Overview
Today is Latina Equal Pay Day, the day in 2018 when Hispanic women in the United States have to work to earn as much as white men in the United States earned in 2017 alone. Like other women of color, Latinas face multiple structural barriers in the U.S. labor market, including both gender discrimination and racial and ethnic discrimination. Empirical evidence demonstrates, however, that these dual barriers are more than the sum of their parts and could instead result in even greater economic difficulties for Latina women.
Download File
The intersectional wage gaps faced by Latina women in the United States
Using U.S. Census Bureau data over an 8-year period, we perform a so-called Blinder-Oaxaca decomposition—an econometric method that determines how much of mean wage differences can be explained by mean differences in human capital and other variables—to estimate the wage gap faced by Hispanic women as a whole, as well as the wage gaps faced by Hispanic women by national origin, immigration history, and education level. In addition to finding that unexplained wage gap for Hispanic women is greater than the aggregation of the absolute ethnic and gender effects, we also identify particular groups of Hispanic women at an even greater disadvantage.
In this issue brief, we build on the work of economists Mark Paul of New College of Florida, Khaing Zaw of Duke University, Darrick Hamilton of the New School, and William Darity Jr. of Duke University in their 2018 working paper, “Returns in the labor market: A nuanced view of penalties at the intersection of race and gender.” Our empirical analysis allows us to separate out the portions of Hispanic women’s wage gap that are explained and unexplained by various demographic and human capital variables. The unexplained portion, usually understood as a proxy for outright discrimination, represents by far the largest portion of the wage gap (22 cents per dollar out of a total gap of 40 cents). We further break down this white-men-to-Hispanic-women gap into a wage premium for white men (18 percentage points, or 18 cents per dollar) and a wage penalty for Hispanic women (22 percentage points, or 22 cents per dollar).
In addition to overt wage discrimination, the explained portion of the wage gap is largely caused by structural barriers that reduce Latinas’ expected earnings. The largest explained causes of the white-men-to-Hispanic-women gap include the segregation of Hispanic women into lower-paying occupations (8 cents) and lower-paying industries (3 cents) and the disparity in access to education and skills training for many Hispanic women (6 cents).
When Latinas are held back from labor market opportunities, their families face worse economic outcomes, and the entire U.S. economy loses out on the higher aggregate demand and productivity growth that could be realized in a more dynamic labor market powered by closing wage gaps and increasing occupational integration. As Hispanic Americans become a larger proportion of the population, their well-being affects the overall distribution of economic outcomes. Ensuring this population has access to good jobs and the social safety net is critical to addressing economic inequality.
The economic research on Hispanic women in the labor market
Hispanic workers are one of the fastest-growing populations in the labor force, yet many are still held back by structural disparities and discrimination that result in low wages and other negative labor market outcomes. The U.S. population identifying as Hispanic has grown from 9.6 million in 1970 to 57.5 million in 2016, comprising the second-largest racial or ethnic group after whites and the second fastest-growing group after Asians. Contemporary economic research substantiates that Hispanic women face weaker economic outcomes relative to other groups (notably Asian American and white women), including lower earnings, higher occupational segregation, and lower labor force participation—all of which ultimately produce greater economic precarity for their families and dampen economic growth.
The late date for Latina Equal Pay Day demonstrates the differential economic well-being faced by Latinas compared to white men in terms of earnings. A report for the Economic Policy Institute by economists Marie Mora of the University of Texas-Rio Grande Valley and Alberto Dávila of Iowa State University finds that the wage gap between Hispanic men and white men is explained to a greater extent by human capital variables such as education, experience, and immigration status, while the wage gap between Hispanic women and white men narrows less when controlling for these factors. Comparing workers with equivalent human capital characteristics, Mora and Dávila find an adjusted or unexplained gap of 15 percent for Hispanic men and 33 percent for Hispanic women—relative to white men.
Mora and Dávila also find significant differences based on the generation of immigration. The wage gap between second-generation Hispanic workers and second-generation white workers is narrower than the gap between first-generation Hispanic and white workers. But beyond this drop from the first to the second generation, the gap doesn’t narrow further for later generations.
Seminal research by Cornell University economists Francine Blau and Lawrence Kahn finds that occupational segregation is one of the largest factors contributing to the gender wage gap faced by women. Researchers at the Institute for Women’s Policy Research examine occupational segregation within racial and ethnic groups, and find that Latinos and Latinas have had the least convergence in occupational segregation in recent decades. Confirming the differences in occupational segregation among women by race and ethnicity, analysis by the U.S. Department of Labor finds that Hispanic women are overrepresented in occupations that pay less such as service occupations, compared to non-Hispanic white women.
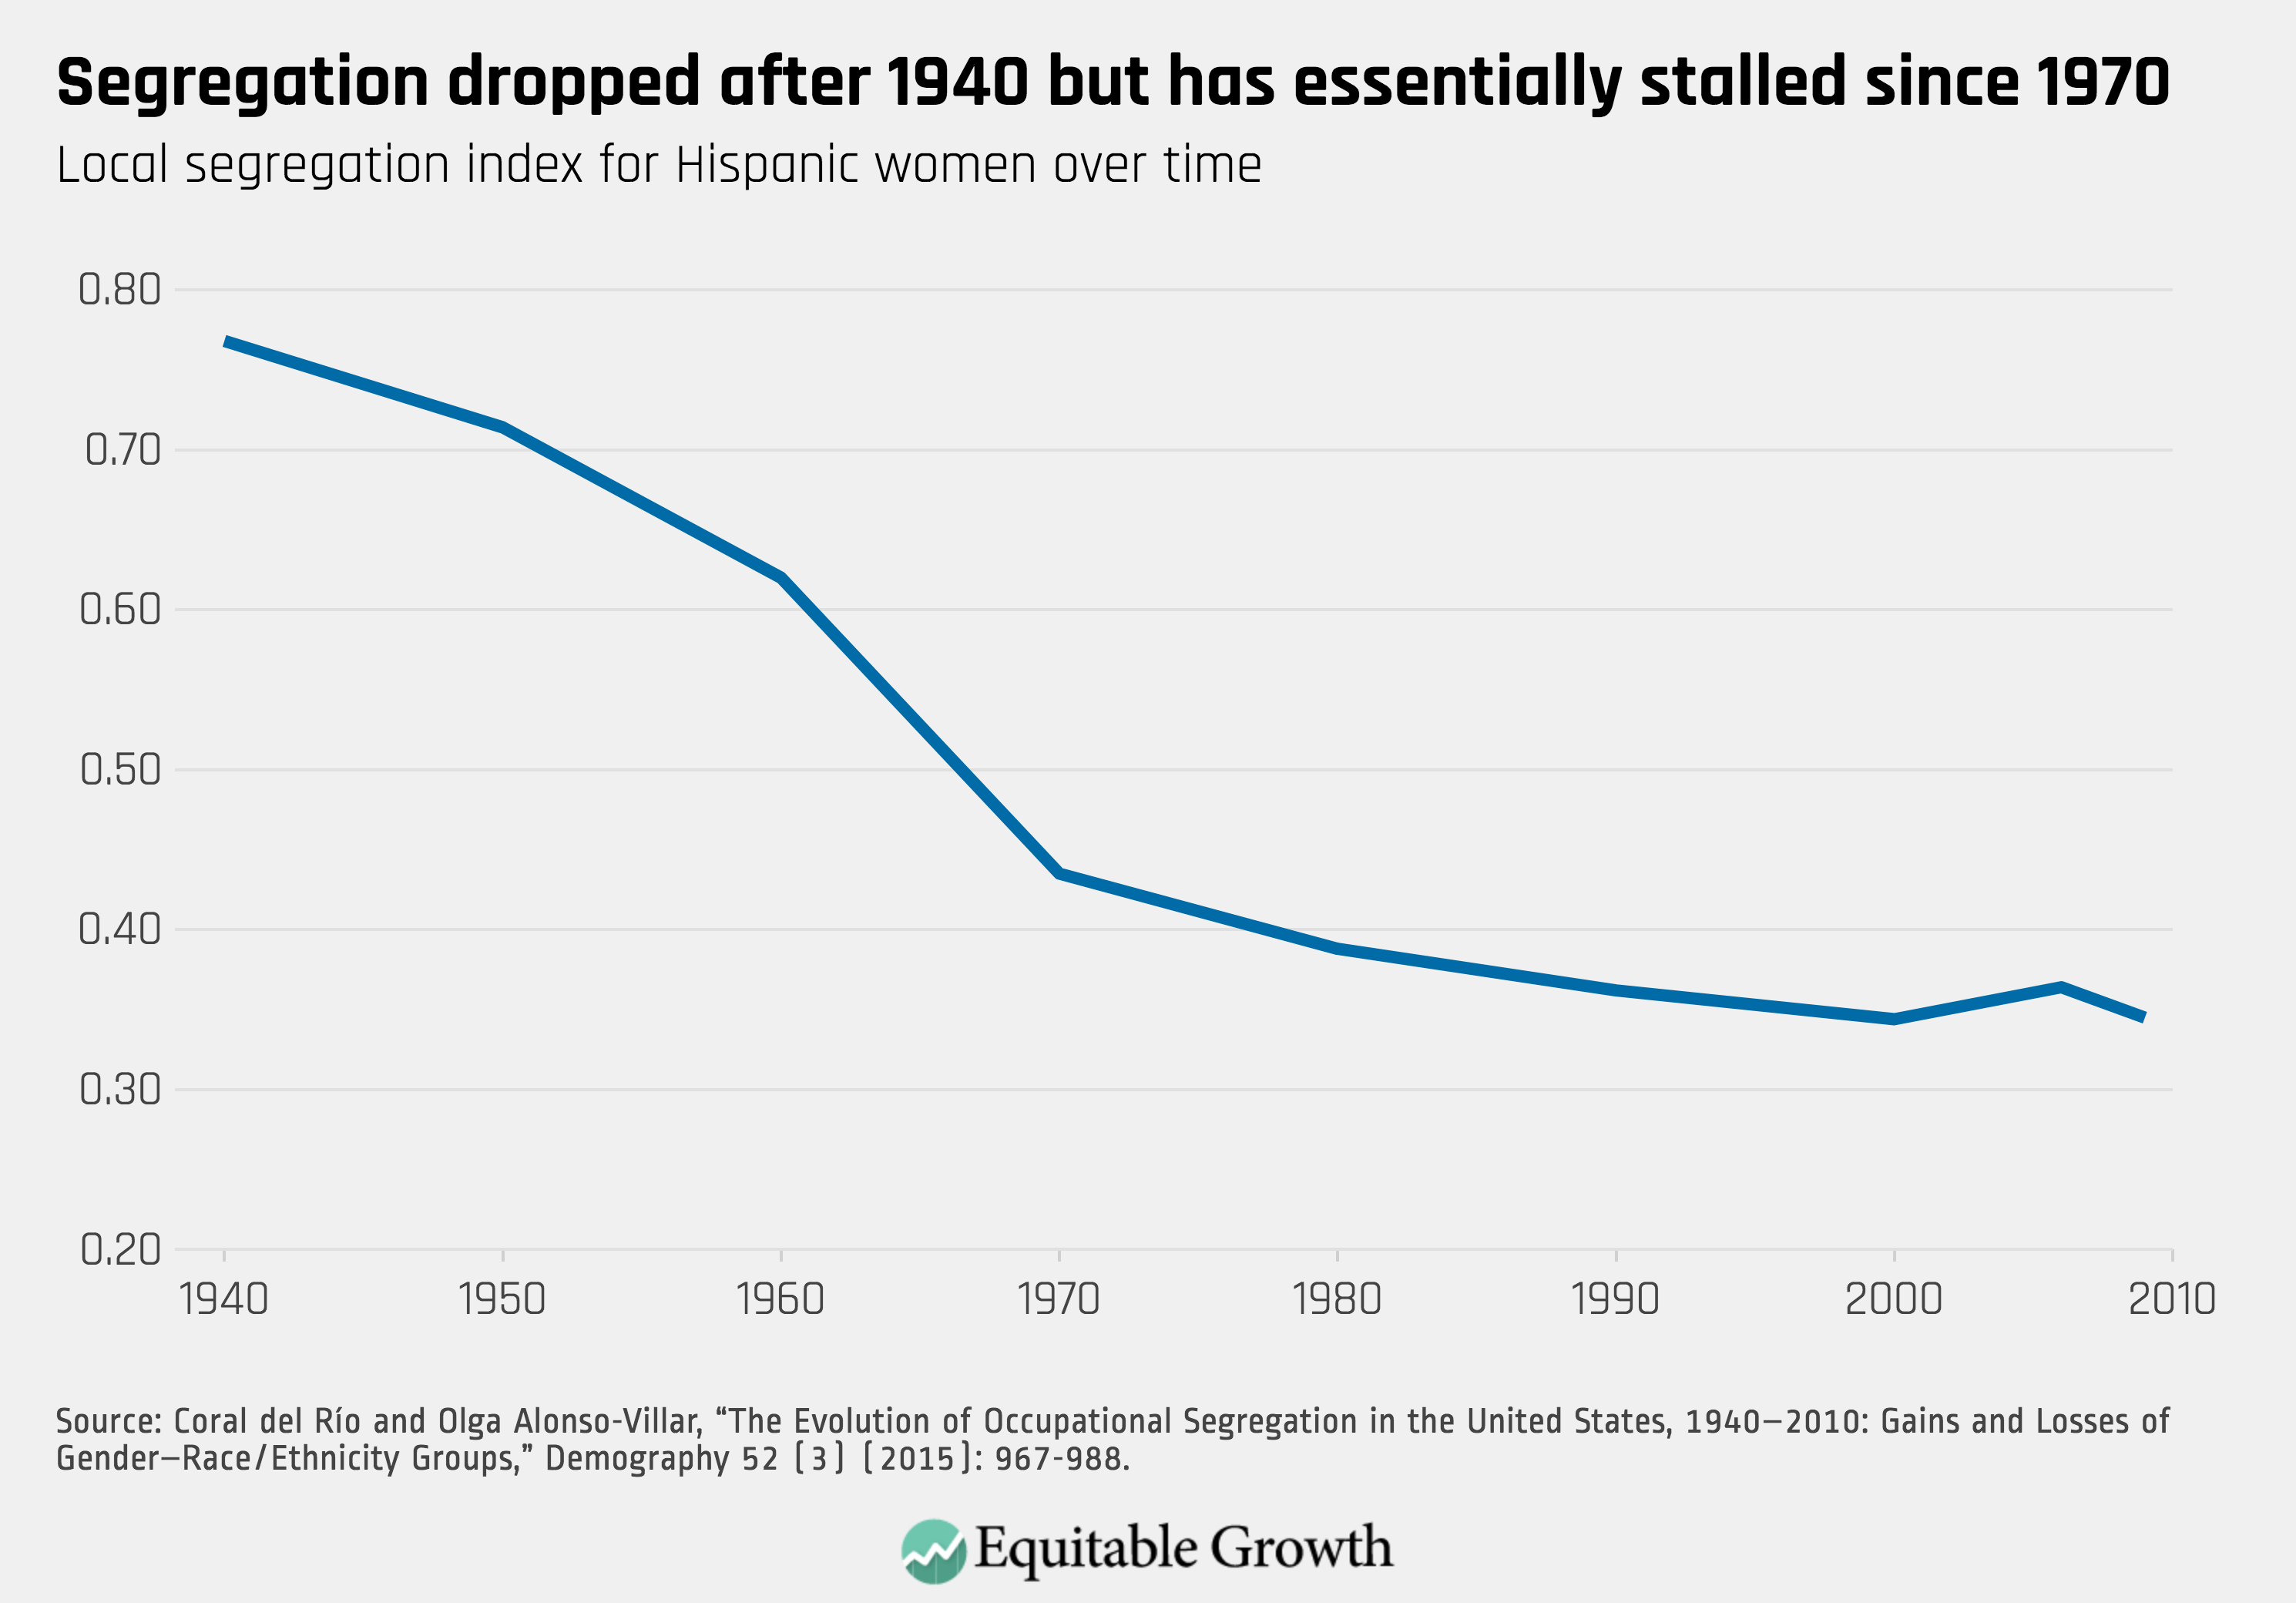
Research by economists Olga Alonso-Villar and Coral del Río at the University of Vigo in Galicia, Spain, details the decline of occupational segregation for Hispanic women since 1940. While segregation for Hispanic workers has increased over the past decade, Hispanic women are now less segregated than Hispanic men, who are the most segregated group compared to other demographic groups of workers (after increasing their level of segregation steadily since 1970). Nevertheless, Alonso-VIllar and del Río find that occupational segregation brings down Hispanic women’s wages more than those of Hispanic men, as the occupations in which Hispanic women are overrepresented pay less on average. (See Figure 1.)
Figure 1
In addition to their lower earnings and heightened occupational segregation, Hispanic women’s rates of labor force participation have historically lagged behind those of other men and women in the United States. After several decades of convergence in the wake of the women’s movement, women’s labor force participation today is slightly lower than that of men for all racial and ethnic groups. Hispanic women in particular had the lowest labor force participation rate of any group of women by race and ethnicity until only very recently—they surpassed Asian women as of 2016 and are now approaching parity with white women. At the same time, as labor force participation rates have declined for most workers, Hispanic women are one of the few groups that has gained ground over the past 10 years. This trend is expected to continue: The U.S. Bureau of Labor Statistics predicts that Hispanic women’s labor force participation rates will be above that of white non-Hispanic women within the next 10 years.
Among Hispanic Americans, country of origin also has a strong impact on labor force participation. Analysis conducted by the Institute for Women’s Policy Research using the American Community Survey found that the overall labor force participation among Hispanic women is close to 59 percent, but this ranges from 70.1 percent for women of Bolivian origin to 55.9 percent for women of Cuban origin. These data indicate that changes in the composition of the country of origin and characteristics of the Hispanic population over time may be affecting long-term trends in Hispanic women’s labor force participation rates.
Age and family structure play important roles in women’s labor force participation, as well as employment opportunities. Hispanic Americans have a younger median age than white Americans and have a higher fertility rate. Paula England of New York University, Carmen Garcia of Seminole Community College, and Mary Richardson formerly of Northwestern University find that the higher fertility rates of women of Mexican origin helps explain their lower labor force participation. Other research finds that mothers of young children have lower employment rates. And while mothers of all races and ethnicities are working at much higher rates than they were half a century ago, childcare responsibilities may limit their opportunities, as these women balance caregiving responsibilities that may affect the hours they can work, their commute to work, and whether they can relocate for better jobs.
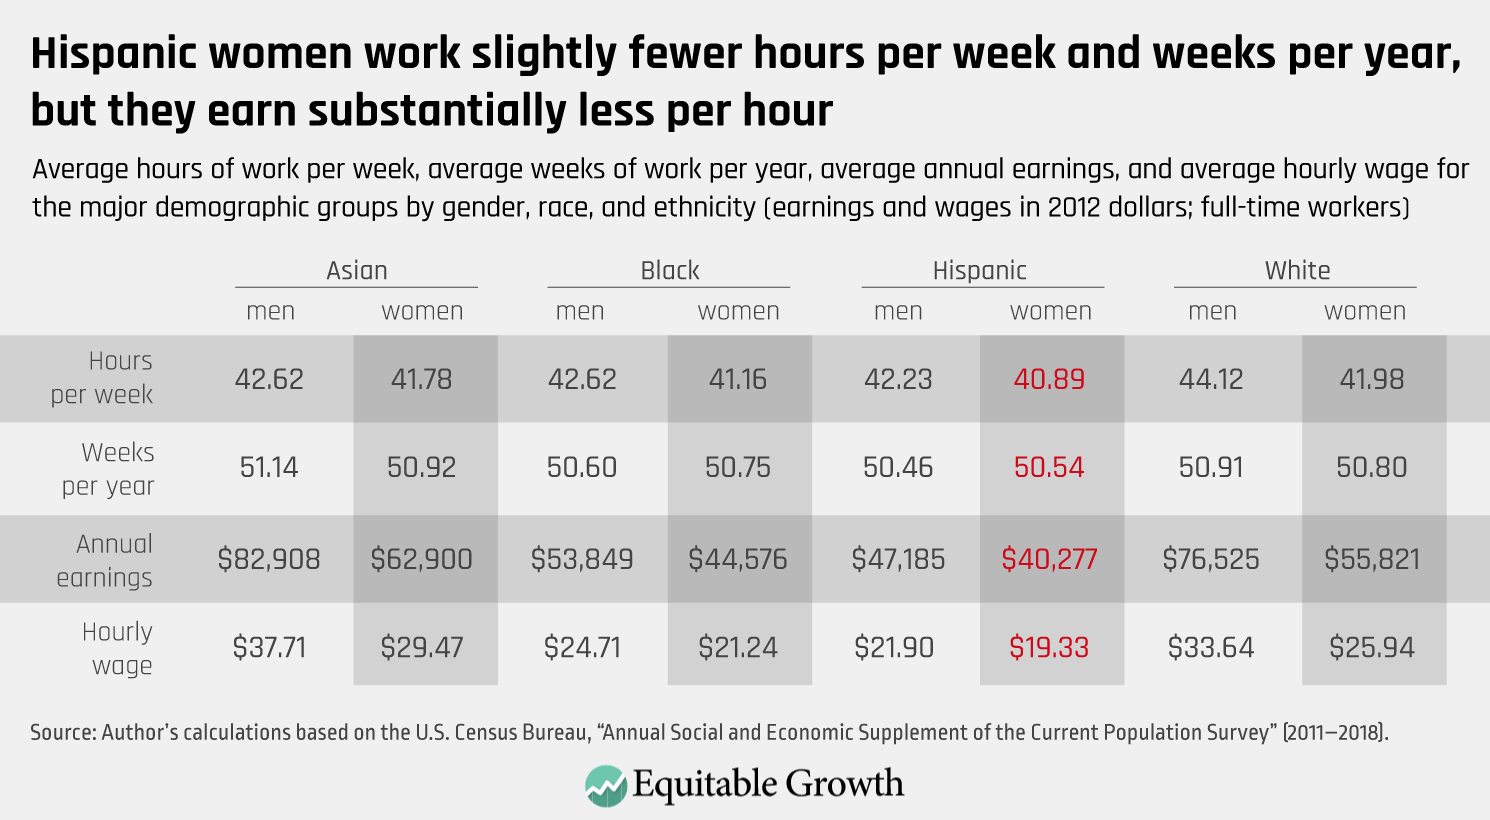
In addition to their lower labor supply on what economists call the extensive margin (lower labor force participation), Hispanic women also have lower labor supply on the so-called intensive margin (fewer hours) even when they work full-time. (See Table 1.)
Table 1
Depressed labor force participation and work hours bring down earnings for individual Hispanic women workers and may also contribute to a more precarious and anti-competitive labor market for all workers. A large population of prime-working age laborers outside of the labor force or working fewer hours than desired could give employers greater bargaining power vis-à-vis workers since they have the option to draw from this reserve of workers rather than improve wages, benefits, and working conditions for current employees.
Conversely, labor force participation can be strengthened by efforts to raise Latinas’ earnings in the labor market. Many of the policy recommendations outlined below to provide childcare and better work-life balance, to enforce workplace protections, and to increase pay equity would likely help boost labor supply as well by attracting inactive workers into the labor market and encouraging both part-time and full-time workers to increase their hours.
The intersectional wage gap faced by Hispanic women as a group
Analyzing the wage gap faced by black women as a case study, the Equitable Growth working paper by Paul, Zaw, Hamilton, and Darity finds that women of color face wage gaps that are explained by more than the sum of the gender wage gap and the racial wage gap. As Paul, Hamilton, and Darity explain in a column summarizing their paper, “examining these two wage gaps through the lens of intersectional theory … enables researchers to understand how workers with multiple socially salient identities such as race and gender are affected in ways that are qualitatively different from the mere sum of the effects of each identity taken separately on outcomes in U.S. labor markets.” This is why it is important for academics and policymakers alike to delve beyond top-line numbers on the gender wage gap faced by women of color to understand how each aspect of their labor market experience influences the wage gaps they face.
A nuanced understanding of the wage gap can help policymakers craft solutions that help Latinas share in the gains of economic growth and enhance the well-being of their families. Using data from the U.S. Census Bureau’s Current Population Survey for the years 2011 through 2018, we provide post-Recession estimates of the wage gap for Hispanic women as a group, as well as for subgroups by national origin, education, nativity (nation of birth), and citizenship. Our empirical strategy is a Blinder-Oaxaca decomposition of the unexplained and explained contributions of various demographic and human capital variables to the wage gap Hispanic women face vis-à-vis white men. We follow a similar strategy as Francine Blau and Lawrence Kahn in their study decomposing the gender wage gap using Panel Study of Income Dynamics data compiled by the University of Michigan, and our model is very similar to the one developed by Paul, Zaw, Hamilton, and Darity in their Equitable Growth working paper on the wage gap for African American women.
As in the case of their decomposition, the wage gap faced by Hispanic women is intersectional—that is, it is the product of group-based discrimination and inequalities that affect women as a whole and Hispanics as a whole, as well as those affecting Hispanic women in particular. Legal scholar Kimberlé Crenshaw at the University of California, Los Angeles and Columbia University originally introduced the term intersectionality “to denote the various ways in which race and gender interact to shape the multiple dimensions of Black women’s employment experiences.”
Applying the concept to the labor market, Paul, Zaw, Hamilton, and Darity demonstrate that black women experience a larger wage gap than black men and white women—larger, in fact, than the addition of the race- and gender-based penalties. We break down the white-man-to-Hispanic-woman wage gap for full-time workers using a modified version of their decomposition model, and drawing on Mora and Dávila’s analysis of the wage gap for Hispanic men and women, we include variables for citizenship and nativity in addition to the variables included in specifications by Paul, Zaw, Hamilton, and Darity. (See Figure 2.)
Figure 2
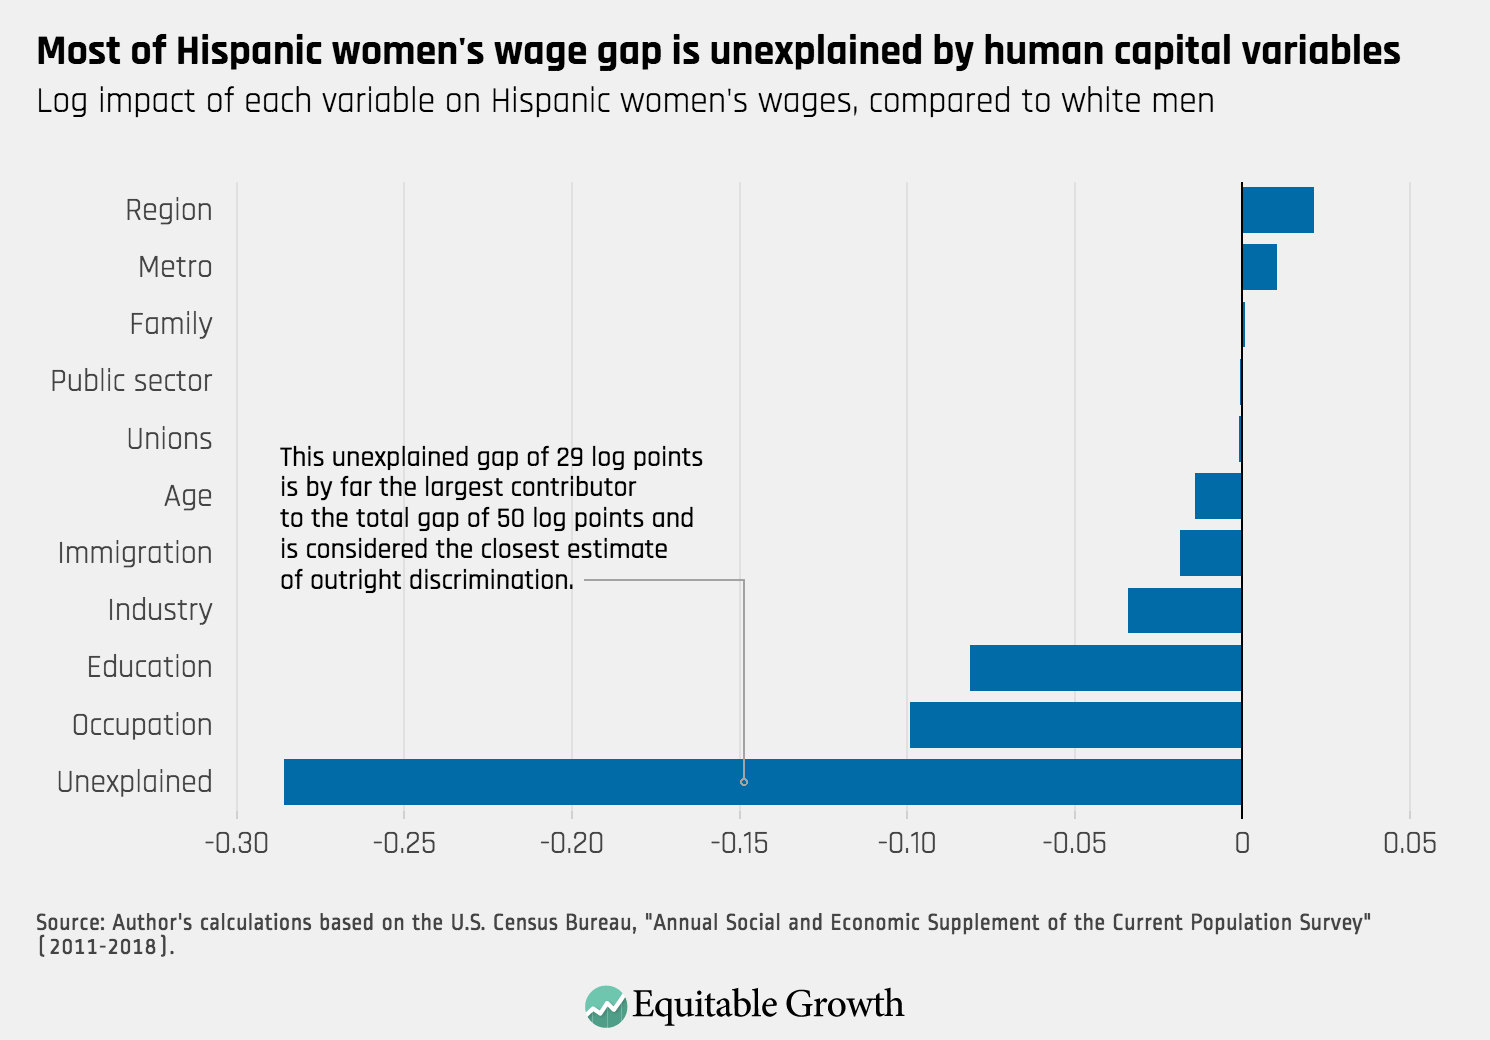
This Blinder-Oaxaca decomposition uses the observations in the Current Population Survey dataset for Hispanic women and white men to estimate the portion of the wage gap explained by average differences between the two groups in levels of the enumerated variables, as well as the portion unexplained by these differences. As in the case of black women, the unexplained gap constitutes the majority of the wage penalty for Hispanic women compared to white men, and this portion is considered the closest approximation of outright discrimination. Alternatively, among the explained variables, educational inequality and workplace segregation by occupation and industry—which are themselves caused by various forms of discrimination and inequality—are the largest contributors to the gap.
In addition to applying this model, we further disaggregated Hispanic women’s wage gap into a white male premium and a Hispanic woman penalty. The white male premium represents the per-capita wage boost that white men receive over all other workers in the U.S. economy except Hispanic women, whereas the Hispanic woman penalty represents the per-capita wage disadvantage of Hispanic women versus all other workers in the U.S. economy except white men. Like the aggregate gap calculated above, both of these components in turn have explained and unexplained portions. (See Figure 3.)
Figure 3
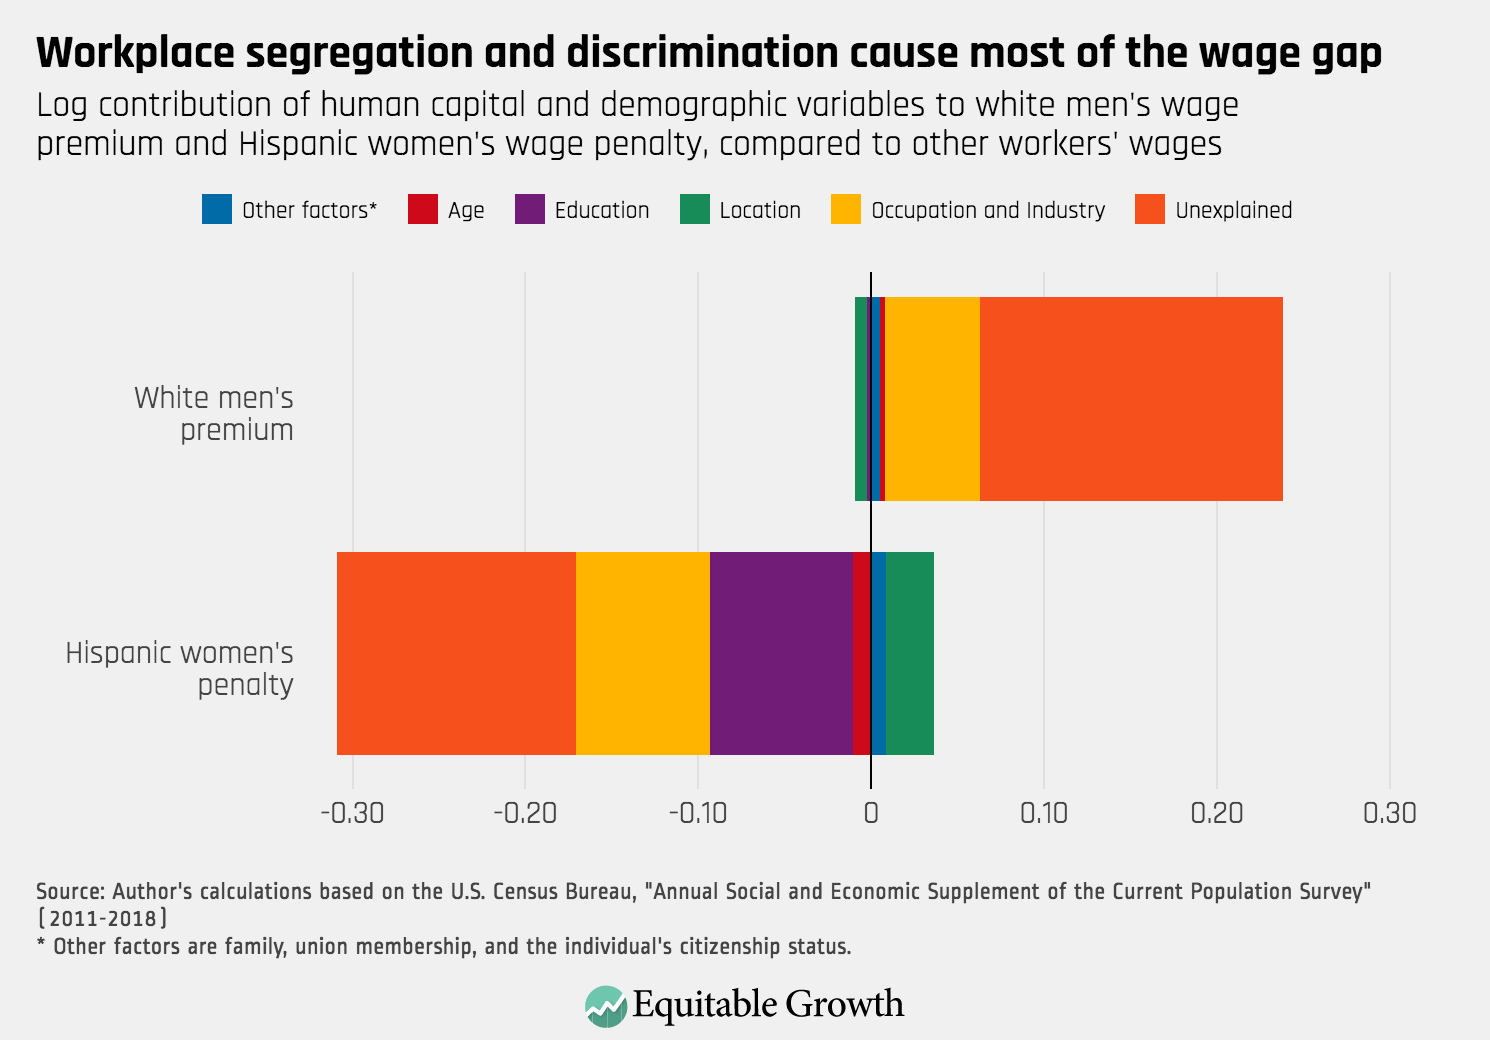
In log points, the aggregation of the Hispanic woman penalty and the white man premium is equivalent to the total white-men-to-Hispanic-women gap, and their relative magnitudes can be used to calculate the percentage point contribution of each component to the aggregate gap. Importantly, both models confirm the empirical evidence presented by Paul, Zaw, Hamilton, and Darity of the role of intersectionality in the labor market. Specifically, Hispanic women’s total wage gap (40 percent, as calculated with Paul et al.’s specification) is larger than the addition of their gender wage gap with Hispanic men (9 percent) and their ethnic wage gap with white women (26 percent).
The intersectional wage gaps faced by Hispanic women of different national, educational, nativity, and citizenship subgroups
To calculate the wage gaps faced by subgroups of Hispanic women, we used our modification of Paul, Zaw, Hamilton, and Darity’s Blinder-Oaxaca decomposition approach, in which explained and unexplained portions are estimated for the wage premium for white men, as well as the wage penalty for various subgroups of Hispanic women compared to all other workers in the U.S. economy. As the sample size of any one of these subgroups decreases, the accuracy of the sample means that the explained variables calculated from the dataset’s observations of this group, as well as those of white men, also decreases.
Disaggregating the white male premium and the Hispanic woman penalty for various subgroups of Hispanic women can help paint a fuller picture of wage gaps for Hispanic workers based on country of origin, immigration history, and education. This methodological approach demonstrates how white men and Hispanic women of different countries of origin are respectively advantaged and disadvantaged compared to other workers in the economy, while also facilitating a direct wage comparison between the two groups. Applying this empirical strategy of estimating mean differences to calculate the explained gap and consequently the residual unexplained gap, we specifically consider the role of education, national origin, nativity (location of birth and parents’ birth), and citizenship in creating intersectional wage gaps for different groups of Hispanic women compared to white men.
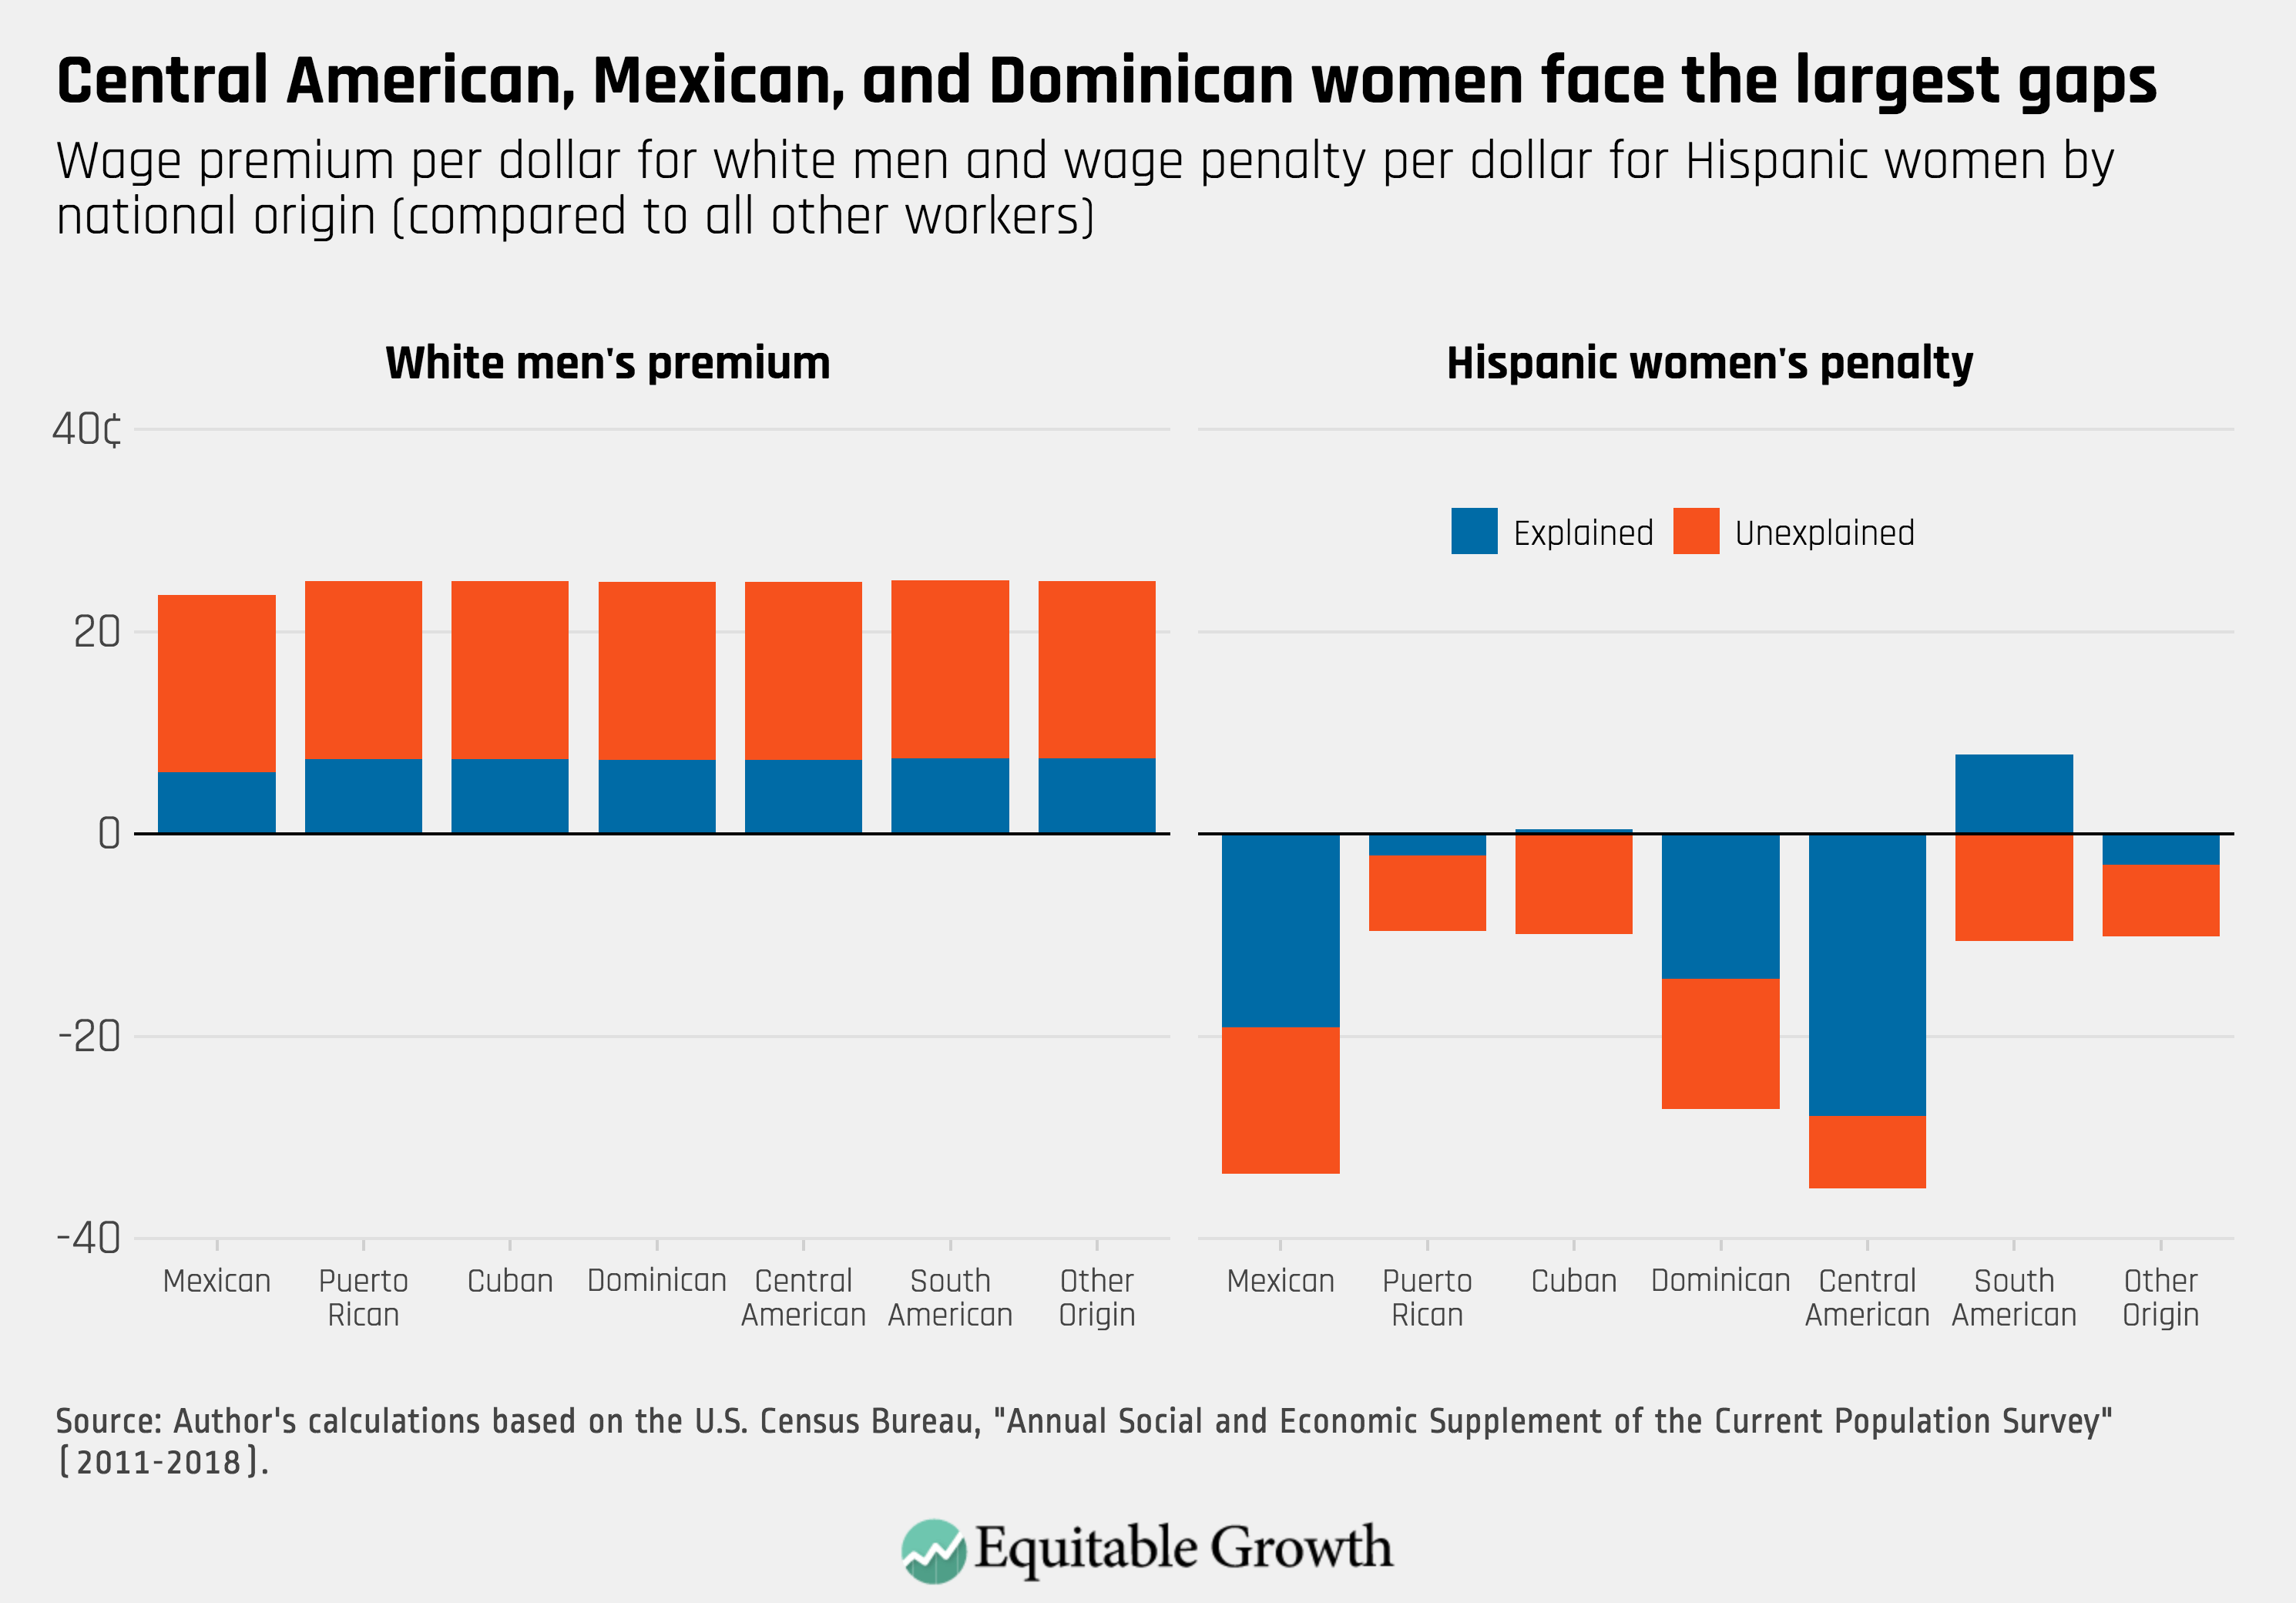
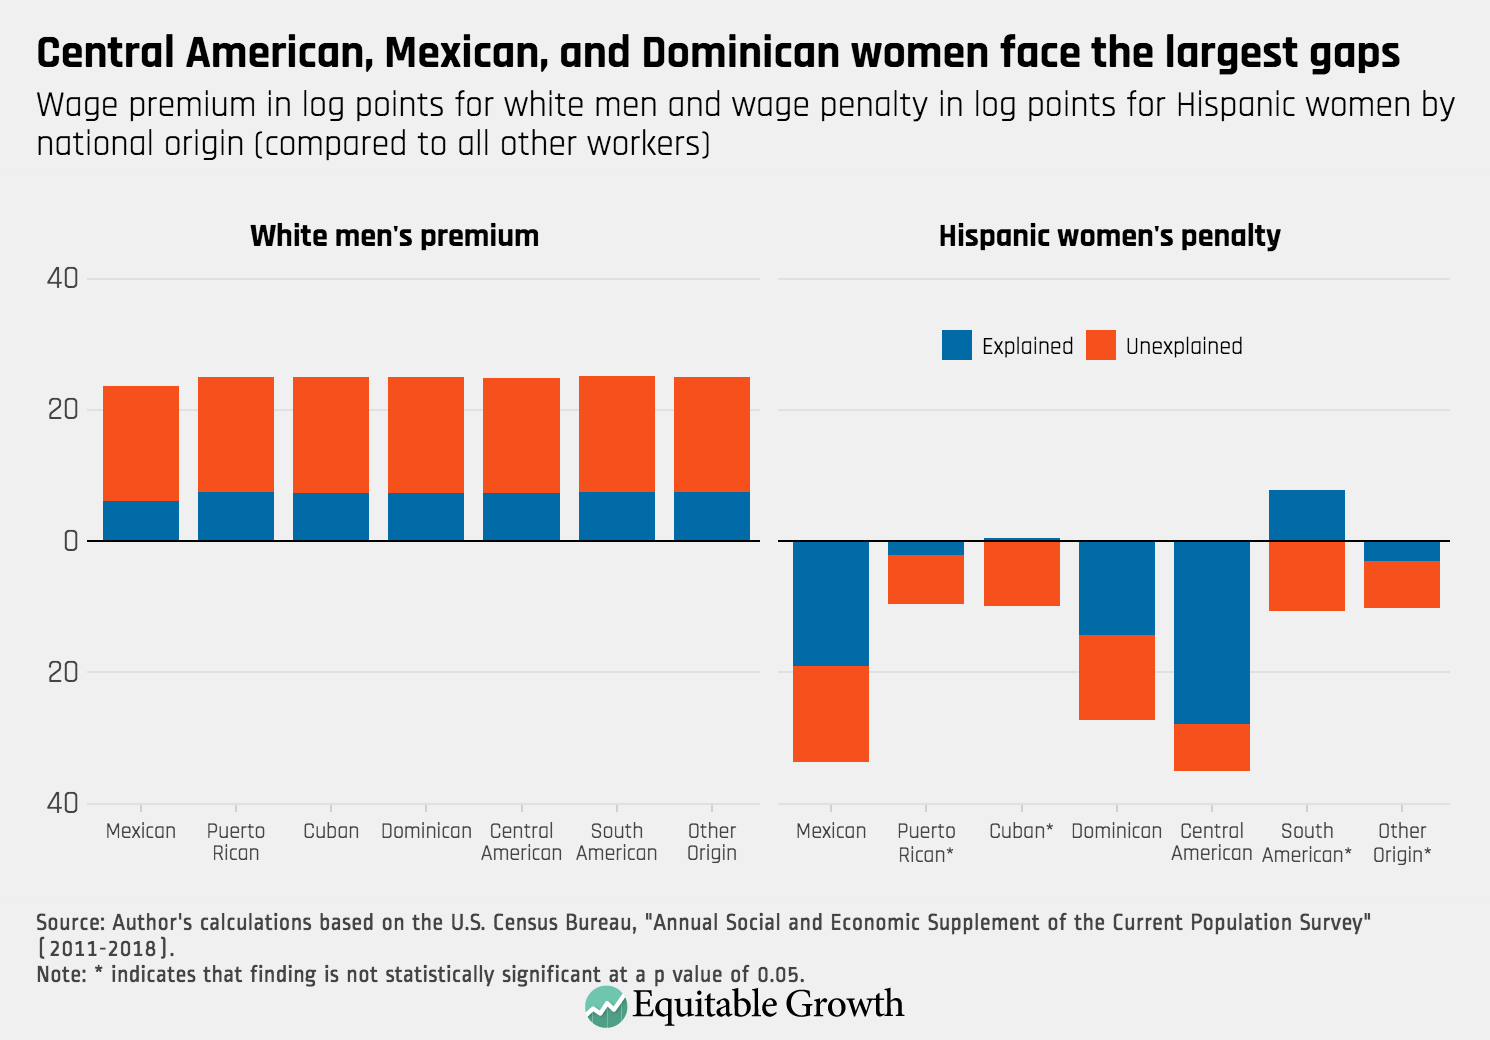
There are statistically significant differences in the wage gap for Hispanic women with different national origins, immigration histories, citizenship statuses, and education levels, but the wage gap is substantial and greater than 20 percent across the entire population of Hispanic women. In terms of national origin, the unexplained and explained portions of the white man wage premium, along with the wage penalty for the largest ethnic subgroups of Hispanic women, are displayed below. Probably reflecting their pronounced economic challenges, Central American women face the largest wage gaps, followed by Mexican and Dominican women. (See Figure 4.)
Figure 4
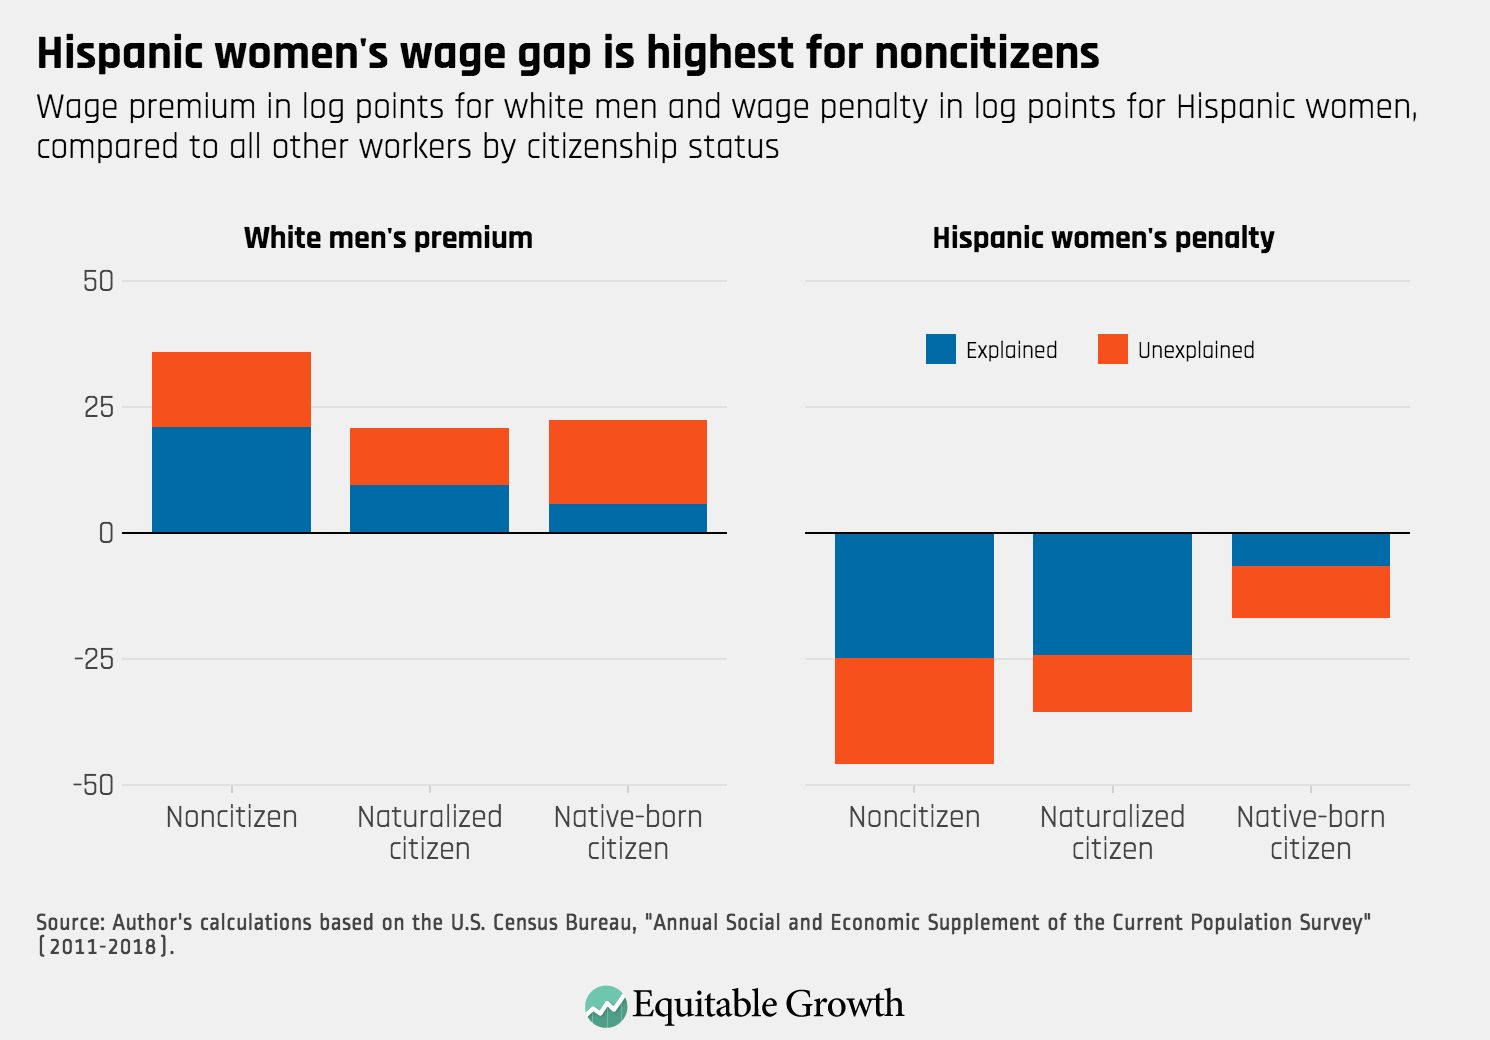
In terms of nativity and citizenship status, native-born citizens face the lowest wage gaps, while foreign-born noncitizens face the largest wage gaps. Importantly, the large penalty for Hispanic women who are foreign born that we calculated does not reflect the greater rates of recent immigration among Hispanic women versus white men in the United States as a whole. Instead, it represents the sharp wage gap imposed on immigrant Hispanic women—compared to white men who are also immigrants. (See Figures 5 and 6.)
Figure 5
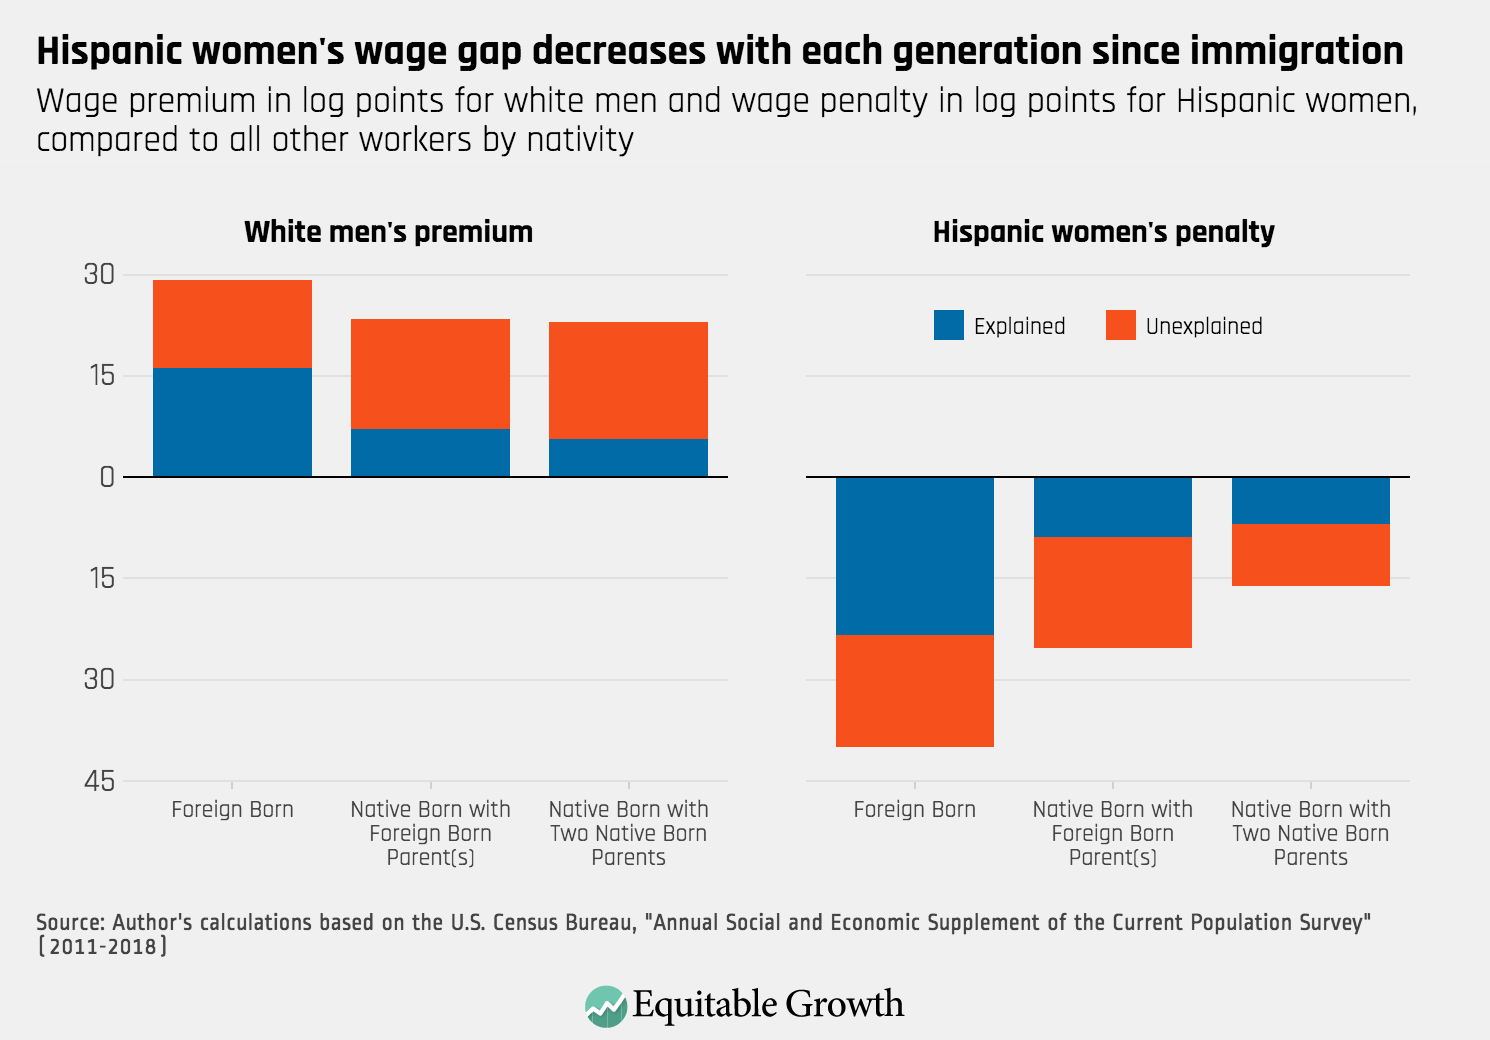
Figure 6
In a similar analysis, we calculated the wage gap for Hispanic women with different levels of education. While the wage gap is large at all levels, it decreases gradually with rising education levels. (See Figure 7.)
Figure 7
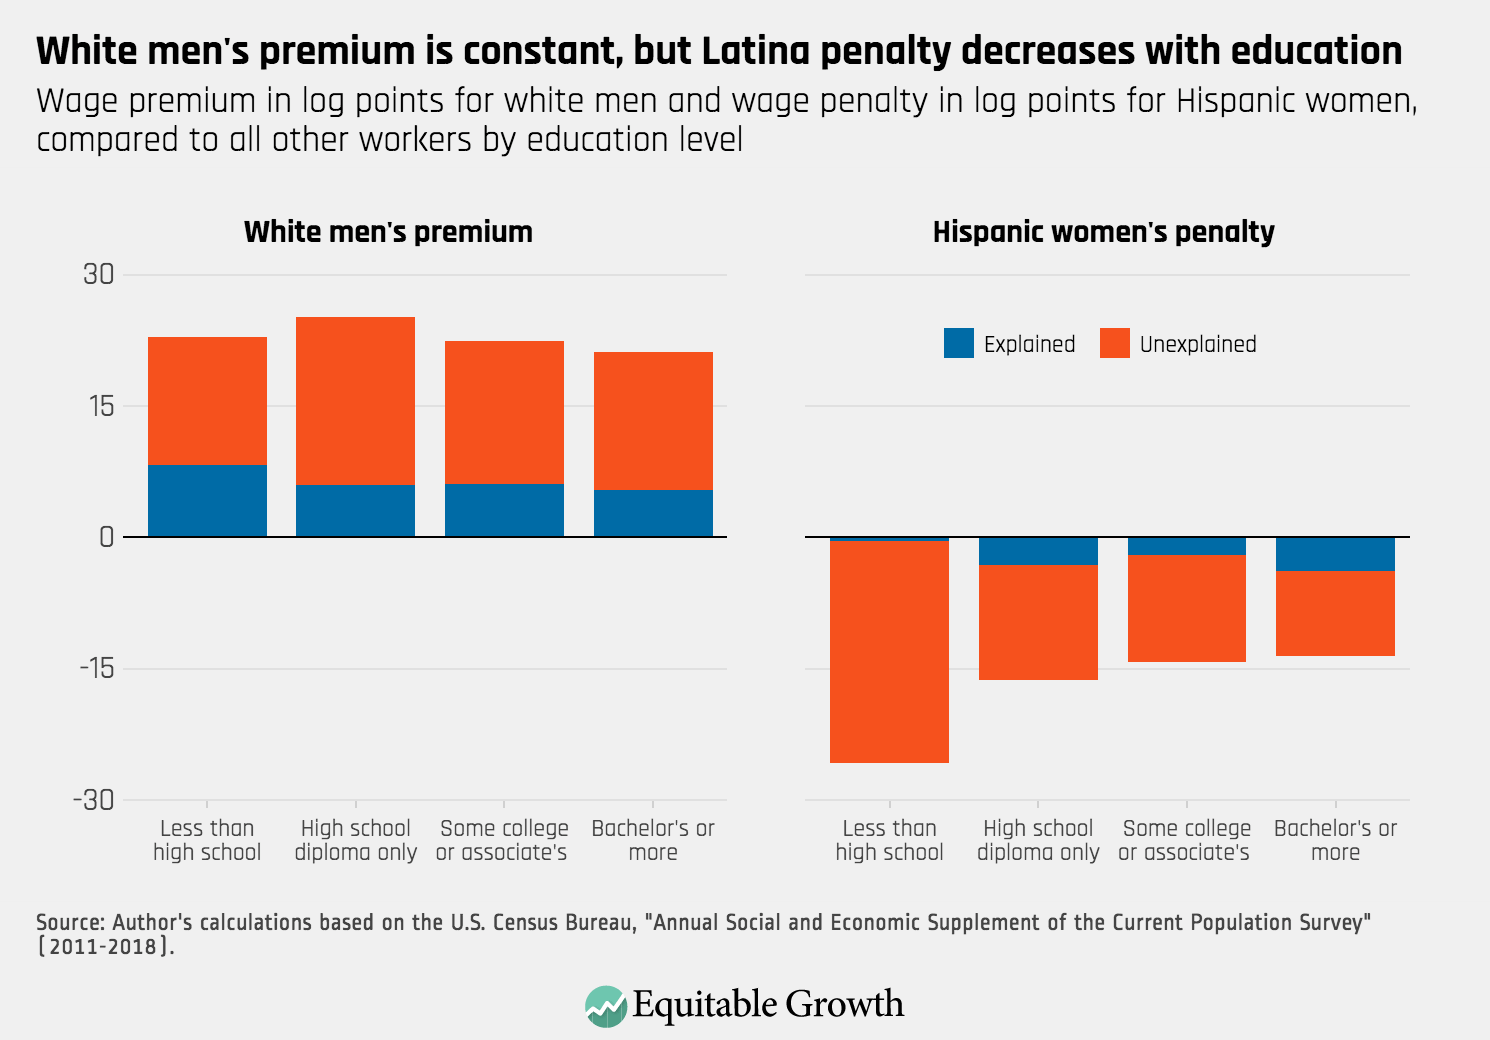
The disaggregation of the white male premium and Hispanic woman penalty detailed in Figure 7 sheds light on the mechanism through which the wage gap changes with rising education. Regardless of their level of education, white men benefit from approximately similar wage premiums—just above 20 percent. Alternatively, Hispanic women who receive a high school diploma experience a wage gap that is about 10 log points (or roughly 10 cents per dollar) lower than Hispanic women who dropped out before graduating high school. In contrast, the benefit of some college is marginal in closing the wage gap, and the benefits of a bachelor’s degree are even smaller.
Policy recommendations and conclusion
The intersectional structural barriers faced by Hispanic women that lead to reduced wages affect both their own lifetime earnings, as well as the economic security of their families. As these women are increasingly breadwinners in their families, their opportunities in the U.S. labor market are crucially important to the well-being of their communities. The complicated factors that result in their wage gap—such as differential returns to education and occupation—require holistic policy approaches that provide opportunities alongside addressing structural inequalities.
Because Hispanic women still face limited benefits in terms of the wage gap for getting a college education after graduating from high school, just encouraging higher education will not resolve the gender wage gap. Instead, addressing outright wage discrimination, occupational segregation, and work-life supports for Hispanic women of all ages is crucial to ensure that Hispanic women and all other women can be fairly remunerated and represented equal to men based on their skills, interests, and ambitions—their human capital.
Unexplained wage discrimination for full-time workers with the exact same job is the largest portion of the overall wage gap experienced by Hispanic women. Wage discrimination can be addressed through new policies around transparency within organizations in addition to salary history bans in applications, as well as effective enforcement of current anti-discrimination laws. While pay transparency is rare in private-sector employment, it is common in the public sector. Along with stronger affirmative action regulations, pay transparency likely contributes to an overall lower gender wage gap in the public sector—roughly half the aggregate wage gap, compared to the private sector.
Collective bargaining agreements also mimic pay transparency by clearly defining pay scales for different positions. As such, pay gaps are lower for union workers. Similarly, banning salary history helps eliminate outright wage discrimination by preventing workers from carrying around lower wages as they change jobs. If a worker is underpaid in one job, and their next job bases their new salary on previous salary, then workers who are more likely to face discriminatory pay at any given employment may face the cumulative effects of this discrimination throughout their careers. Both collective bargaining and banning salary history seek to balance information asymmetries that benefit employers.
Because Latinas are underrepresented throughout higher education and the workplace, affirmative action is a fundamentally necessary response to ensure that underrepresented groups are able to access opportunities at all stages of their careers. Georgetown McCourt School of Public Policy professor Harry Holzer and University of California, Irvine professor David Neumark conducted a meta-analysis of the broad economics literature on affirmative action and find that programs can increase diversity without sacrificing efficiency.
Indeed, evidence from Sweden on the effectiveness of affirmative action quotas on productivity of local governments finds that great equity of opportunity leads to more efficient outcomes since a broader pool of public officials (not just men) are able to gain public-sector employment. Previous research at Equitable Growth found positive empirical evidence documenting the benefits of occupational integration via affirmative action for the wages of women and people of color, scientific and business innovation, and aggregate productivity growth in the economy at large.
Access to education and training also are particularly important for workers who historically have had less access to typical measures of human capital such as years of college or college completion. Lower levels of education and training do not fully explain the barriers faced by Latinas, whose wage gap barely narrows for those with college or an advanced degree compared to those with only a high school diploma. Workers with more education, however, are still more likely to earn more. Hispanic men and women who graduate from high school have a lower rate of college enrollment compared to both their black and white counterparts. Increasing the quality of Kindergarten through 12th grade education and accessibility to higher education is another necessary piece of improving economic outcomes for Latinas, particularly as many fast-growing occupations require post-secondary education.
Access to training and apprenticeship is especially important for underrepresented groups. Women workers are only 7.3 percent of those in registered apprenticeships. Of women who are in apprenticeship programs, less than 10 percent are Hispanic, compared to men in apprenticeships, almost 16 percent of whom identified as Hispanic. Furthermore, women earn less in their apprenticeship programs than men do. Hispanic women earn the least in apprenticeship programs compared to all other groups by racial, ethnic, and gender breakdown. Policymakers who oversee apprenticeship registrations can both encourage increased equity in current apprenticeships, as well as expanded apprenticeships into new industries and occupations. All the while, policymakers must ensure that these apprenticeships continue to be paths to training while earning living wages.
One of the most important undertakings in addressing disparate U.S. labor market outcomes for women workers is to implement myriad of policies that help people balance both their work life and their families’ care needs. As Equitable Growth’s Senior Director for Family Economic Security Elisabeth Jacobs demonstrates, research increasingly suggests that the stability of the family as an economic unit is beneficial for both individual workers, as well as the broader U.S. economy. For Latinas, who are more likely to be mothers to young children since they are a younger population in the United States, these supports (including affordable childcare and access to different lengths of leave) are crucial to their ability to engage in the labor market. Furthermore, segmented labor markets—where low-income, ethnic minority, and rural workers are primarily relegated to jobs that typically offer less pay and fewer benefits—mean that Latin Americans are less likely than whites to have access to paid sick days, paid vacation, and flexible schedules, all of which are the types of supports that help workers balance family needs with their workforce participation.
Research by Equitable Growth grantees Maya Rossin-Slater of Stanford University, Christopher Ruhm of the University of Virginia, and Janet Waldfogel of Columbia University find that the introduction of a nearly universal paid leave program in California increased Hispanic mothers leave-taking by 6 percentage points, compared to a not-statistically significant 4.4 percentage points for non-Hispanic whites. (This program was similarly as beneficial to black women, who increased their leave taking from only one week to seven weeks of parental leave.) This access to paid leave allowed mothers to maintain their attachment to the labor force, ultimately increasing their work hours and subsequent wages by 6 percent to 9 percent.
None of these policy interventions is a silver bullet on its own, but together they would support greater economic opportunity for Latina workers and all other workers. As the wage decomposition in this brief demonstrates, the wage gap for Hispanic women is primarily caused by unexplained discrimination, followed by workplace segregation and restricted access to educational opportunities. Ensuring greater equity means fostering a more dynamic U.S. labor market in which Latina workers are able to invest in their human capital and productivity and get access to more opportunities that will help them earn higher wages, support their families, and jumpstart innovation and productivity growth in the economy.
Ultimately, U.S. labor market reforms to this end would not only reduce income inequality but also help power a stronger, more diversified U.S. economy in which workers who have been structurally disadvantaged would contribute to aggregate productivity, innovation, and demand and share in the fruits of stronger and more stable economic growth.