Worthy reads from Equitable Growth:
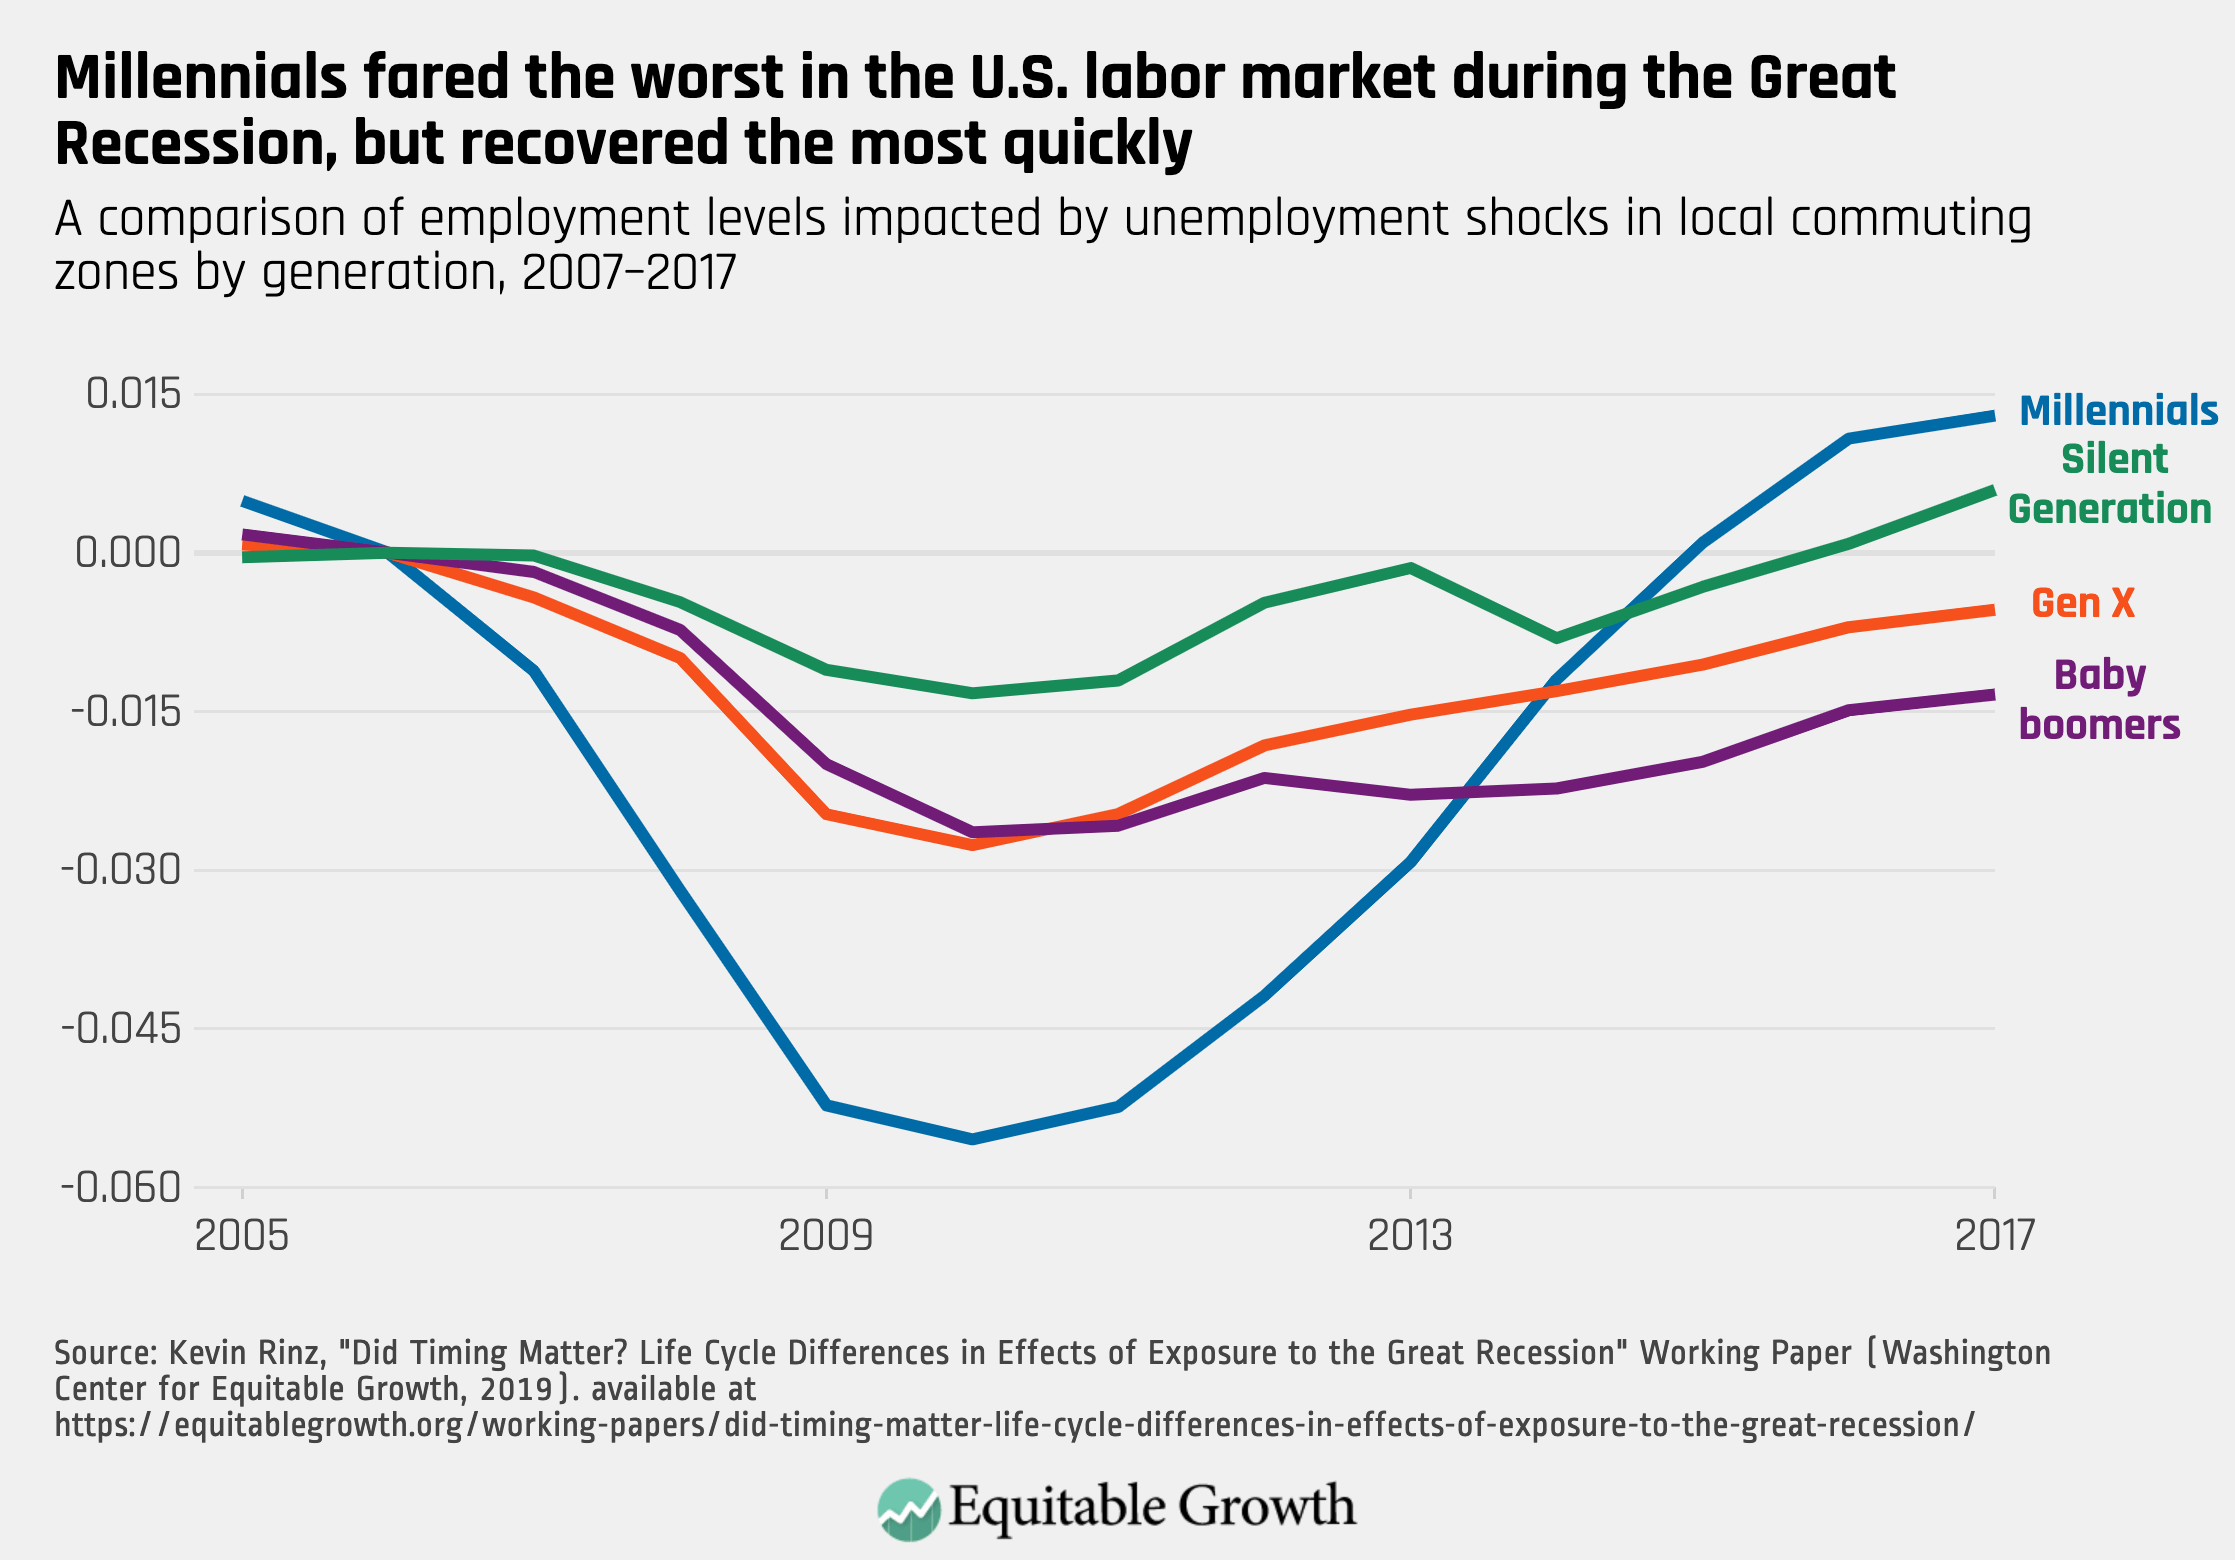
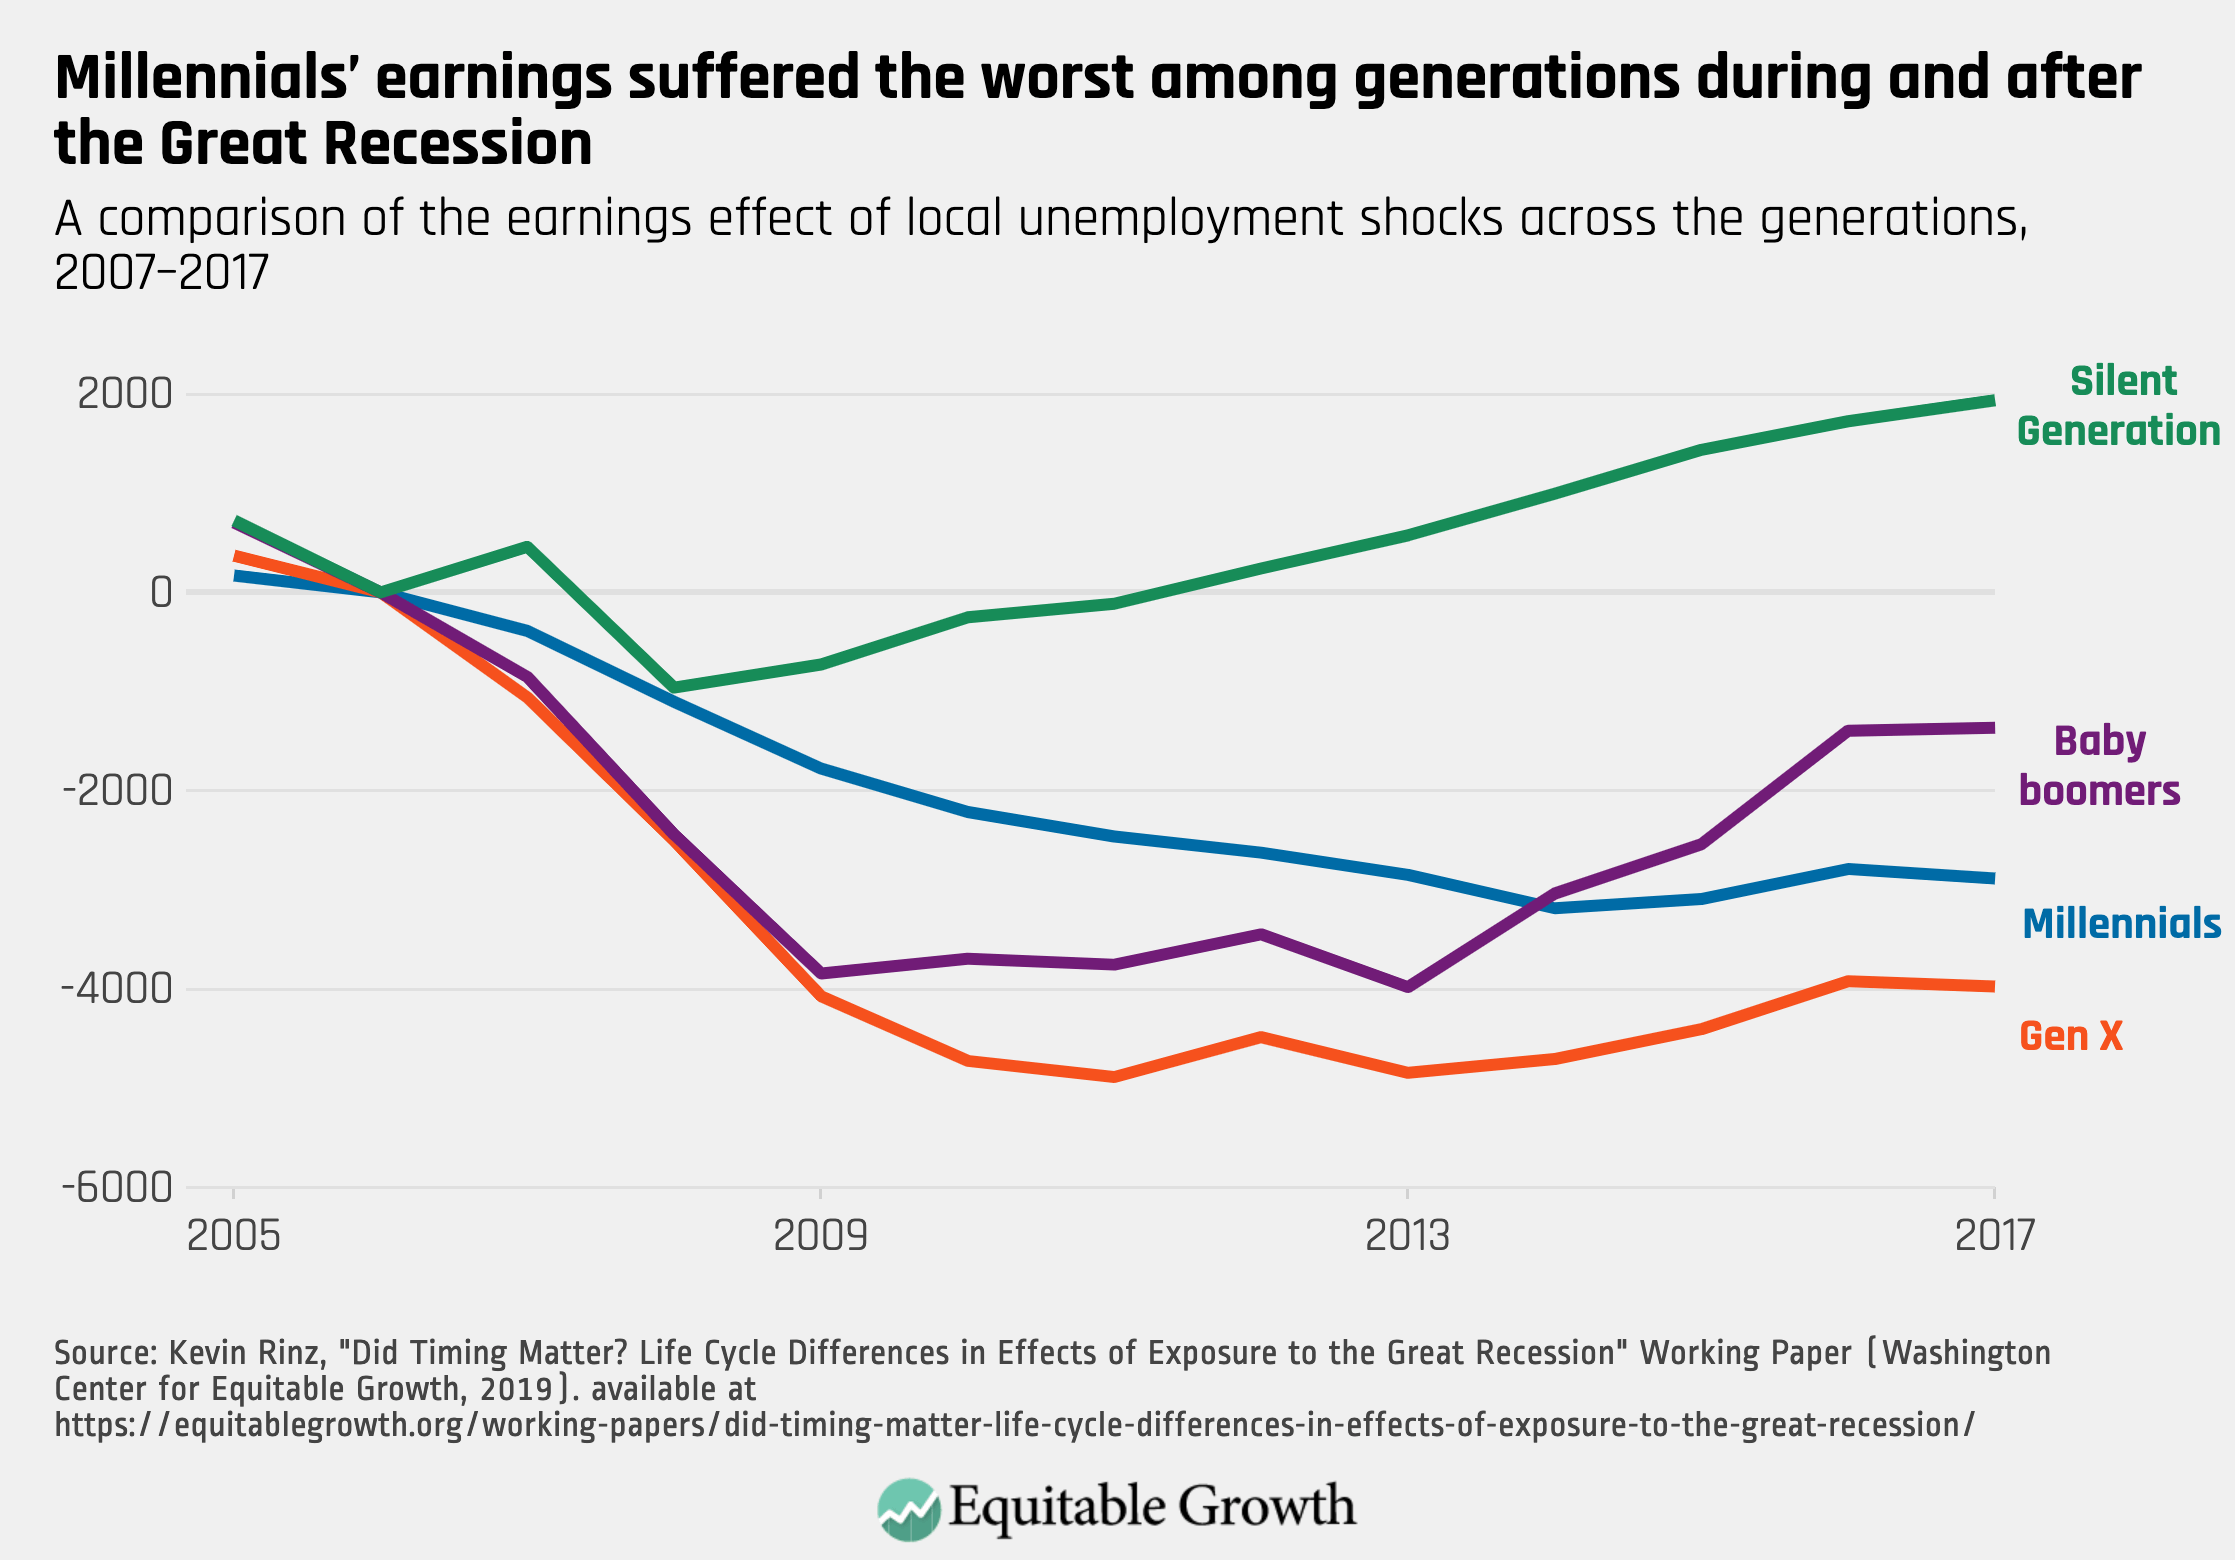
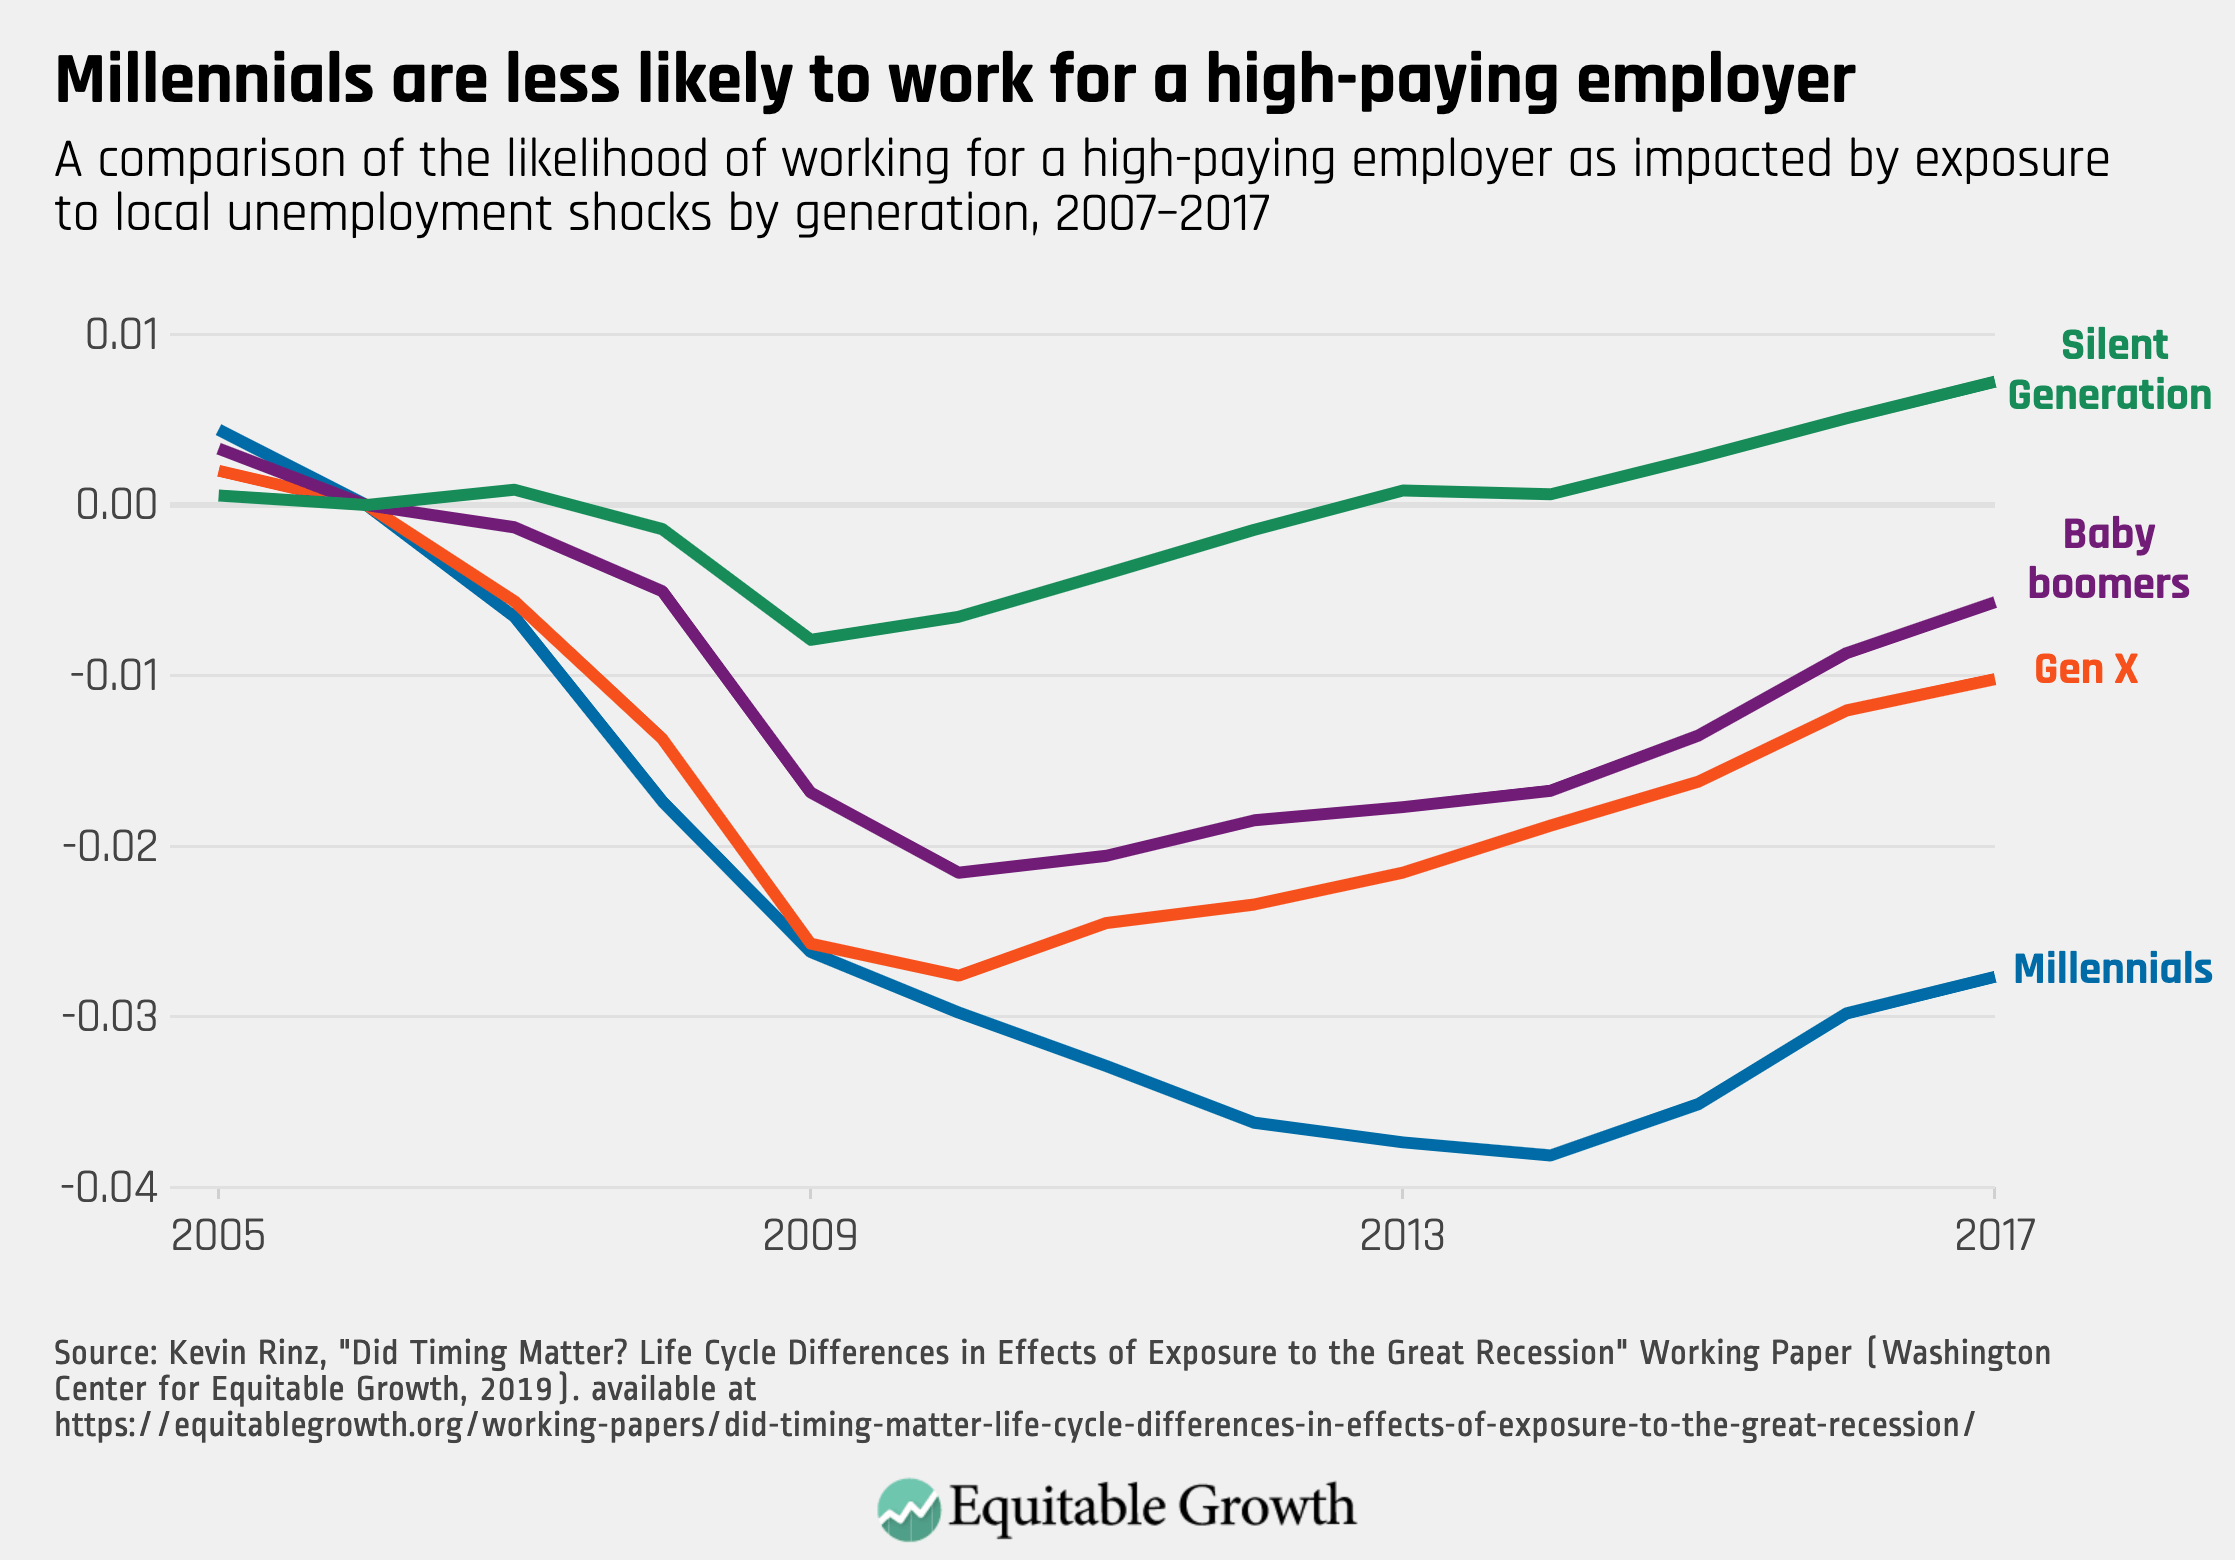
- A brilliant must read is Kevin Rinz’s “Did Timing Matter? Life Cycle Differences in Effects of Exposure to the Great Recession,” in which he writes: “Exposure to a recession can have persistent, negative consequences, but does the severity of those consequences depend on when in the life cycle a person is exposed? I estimate the effects of exposure to the Great Recession on employment and earnings outcomes for groups defined by year of birth over the ten years following the beginning of the recession. With the exception of the oldest workers, all groups experience reductions in earnings and employment due to local unemployment rate shocks during the recession. Younger workers experience the largest earnings losses in percent terms (up to 13 percent), in part because recession exposure makes them persistently less likely to work for high-paying employers even as their overall employment recovers more quickly than older workers. Younger workers also experience reductions in earnings and employment due to changes in local labor market structure associated with the recession. These effects are substantially smaller in magnitude but more persistent than the effects of unemployment rate increases.”
- This is why the financial system is so effective at clipping the edges off of the return of the non-rich is an immense scandal—Read Somin Park, “Wealthier Individuals Receive Higher Returns to Wealth,” in which she writes: “Why do the wealthy get higher returns from their wealth? In part, it’s because they invest a higher share of their assets in the stock market and other risky assets, and therefore are rewarded for their risk tolerance with higher average returns. Wealthier investors also benefit from the scale of their wealth, for example, by using checking accounts that pay higher rates for larger deposits and buying financial advice that leads to higher returns—what the authors call “economies of scale in wealth management.” Yet the authors also find that risk compensation and scale, while important, are not enough to fully account for the variation in returns, or, in economic parlance, “return heterogeneity.” Bank deposit accounts are safe assets that bear essentially no risk. If return heterogeneity were explained by compensation for risk-taking, then there should be no variation in the returns that people get from deposit accounts holding the same amount of wealth. The authors [of a recent working paper] find, however, that there is sizable heterogeneity: People with more education tend to deposit at high-return banks. Persistent variation in returns is therefore also explained, in part, by differences in financial sophistication and differences in ability to access and use superior information about investment opportunities.”
- From last March, but very much worth reading, is Elisabeth Jacobs and Kate Bahn’s “U.S. Women’s Labor Force Participation,” in which they write: “For women in the United States, labor force participation rates have not followed a straight path. It has been a complicated narrative, deeply affected by women’s family roles, by discrimination, by the changing economy, by technological change, and by their own choices. And it is a continuing story, with surprising twists that economists continue to explore. In a sense, this story begins with its first twist, in the 18th and 19th centuries. To be clear, this is a twist for us today, not for those who experienced it. From our modern perspective, we might assume that significant participation by women in the workforce was practically nonexistent until it began rising gradually in the 20th century. We would be wrong. A number of economists, and especially Claudia Goldin of Harvard University, have shown that women in the 18th and 19th centuries played a considerably more important role in the economy than we might have thought. They were critical to their families’ economic well-being and their local economies, not in their rearing of children or taking care of household responsibilities but by their active participation in growing and making the products that families bartered or sold for a living.”
- Watch Equitable Growth president and CEO Heather Boushey on video at Yahoo Finance: “Why Economic Inequality in the U.S. Is at the Highest Level in 50 Years.”
Worthy reads not from Equitable Growth:
- Definitely this week’s most important must read is Dylan Matthews’s “Should the Minimum Wage Be Raised? The Economic Debate, Explained,” in which he writes: “There’s still disagreement … [b]ut it looks like in many cases, pay raises swamp any lost jobs … Dube, Cengiz, Lindner, and Zipperer find that much of the disagreement between the Card/Krueger and Neumark/Wascher approaches is attributable to a quirk in the late 1980s and early 1990s. During that period, blue states experienced an economic downturn relative to red states that predated the biggest blue state minimum wage increases; that made it look like minimum wages were lowering employment growth, when what was really happening was that blue states both had lower employment growth and separately increased their minimum wages. “In our QJE paper we showed that the specifications under argument (lot of controls, little controls) actually all suggest little job loss in the post 1995 period; and that this appears to be driven by the quirky 80s boom/bust,” Dube told me. “None of us knew this until recently. This is actually progress”… Dube notes in his review that the best evidence we have suggests minimal job impacts on minimum wages of up to 60 percent of the median wage. The median hourly wage in El Centro, California is about $15.50, meaning the $13 an hour minimum (effective January 1 of next year) is over 80 percent of the median wage there. The effects there might be very different.”
- In all his columns on Project Syndicate about how dangers of global warming are overblown, Bjorn Lomborg does not appear to have ever called for a carbon tax—at least, searching the website for “Bjorn Lomborg carbon tax” produces no hits. I wonder why not. What’s the upside to you of our not yet having implemented a carbon tax, Bjorn? Read Bjørn Lomborg, “Humans Can Survive Underwater,” in which he writes: “Climate change is a problem we need to tackle, and we should be particularly mindful of how it will hurt the poorest in society. But the bigger, unreported story is that today’s climate policies will do very little to resolve the “challenge” of more people living below the high-tide mark … Even when we read stories from the world’s top media outlets, we need to maintain perspective. Deaths from climate-related causes (floods, hurricanes, droughts, wildfire, and extreme temperatures) have declined by 95 percent over the past hundred years. Furthermore, despite the constant barrage of claims that the global climate crisis is spiraling out of control, the cost of extreme weather as a proportion of GDP has been declining since 1990. Alarming media stories that twist the facts about rising sea levels are dangerous because they scare people unnecessarily and push policymakers toward excessively expensive measures to reduce greenhouse-gas emissions. The real solution is to lift the world’s poorest out of poverty and protect them with simple infrastructure.”
- For a reminder that we know depressingly little about what really works to accelerate economic growth read Ricardo Hausmann, Lant Pritchett, and Dani Rodrik, “Growth Accelerations,” in which they write: “We focus on turning points in growth performance. We look for instances of rapid acceleration in economic growth that are sustained for at least eight years and identify more than 80 such episodes since the 1950s. Growth accelerations tend to be correlated with increases in investment and trade, and with real exchange rate depreciations. Political-regime changes are statistically significant predictors of growth accelerations. External shocks tend to produce growth accelerations that eventually fizzle out, while economic reform is a statistically significant predictor of growth accelerations that are sustained. However, growth accelerations tend to be highly unpredictable: the vast majority of growth accelerations are unrelated to standard determinants and most instances of economic reform do not produce growth accelerations.”
- Looking forward to the next recession, and to the unwillingness of politicians to reserve fiscal space for fighting it, makes Keynes message more urgent than ever. Read Paul Krugman’s “Introduction to Keynes’s General Theory,” in which he writes: “In the spring of 2005 a panel of “conservative scholars and policy leaders” was asked to identify the most dangerous books of the 19th and 20th centuries … Charles Darwin and Betty Friedan ranked high on the list. But The General Theory of Employment, Interest, and Money did very well, too. In fact, John Maynard Keynes beat out V.I. Lenin and Frantz Fanon. Keynes, who declared in the book’s oft-quoted conclusion that “soon or late, it is ideas, not vested interests, which are dangerous for good or evil,” would probably have been pleased … It’s probably safe to assume that the “conservative scholars and policy leaders” who pronounced The General Theory one of the most dangerous books of the past two centuries haven’t read it. But they’re sure it’s a leftist tract, a call for big government and high taxes … The arrival of Keynesian economics in American classrooms was delayed by a nasty case of academic McCarthyism. The first introductory textbook to present Keynesian thinking, written by the Canadian economist Lorie Tarshis, was targeted by a right-wing pressure campaign aimed at university trustees. As a result of this campaign, many universities that had planned to adopt the book for their courses cancelled their orders, and sales of the book, which was initially very successful, collapsed. Professors at Yale University, to their credit, continued to assign the book; their reward was to be attacked by the young William F. Buckley for propounding “evil ideas.” But Keynes was no socialist—he came to save capitalism, not to bury it. And there’s a sense in which The General Theory was … a conservative book … Keynes wrote during a time of mass unemployment, of waste and suffering on an incredible scale. A reasonable man might well have concluded that capitalism had failed, and that only … nationalization … could restore economic sanity … Keynes argued that these failures had surprisingly narrow, technical causes … because Keynes saw the causes of mass unemployment as narrow and technical, he argued that the problem’s solution could also be narrow and technical: the system needed a new alternator, but there was no need to replace the whole car.”