JOLTS Day Graphs: July 2019 Report Edition
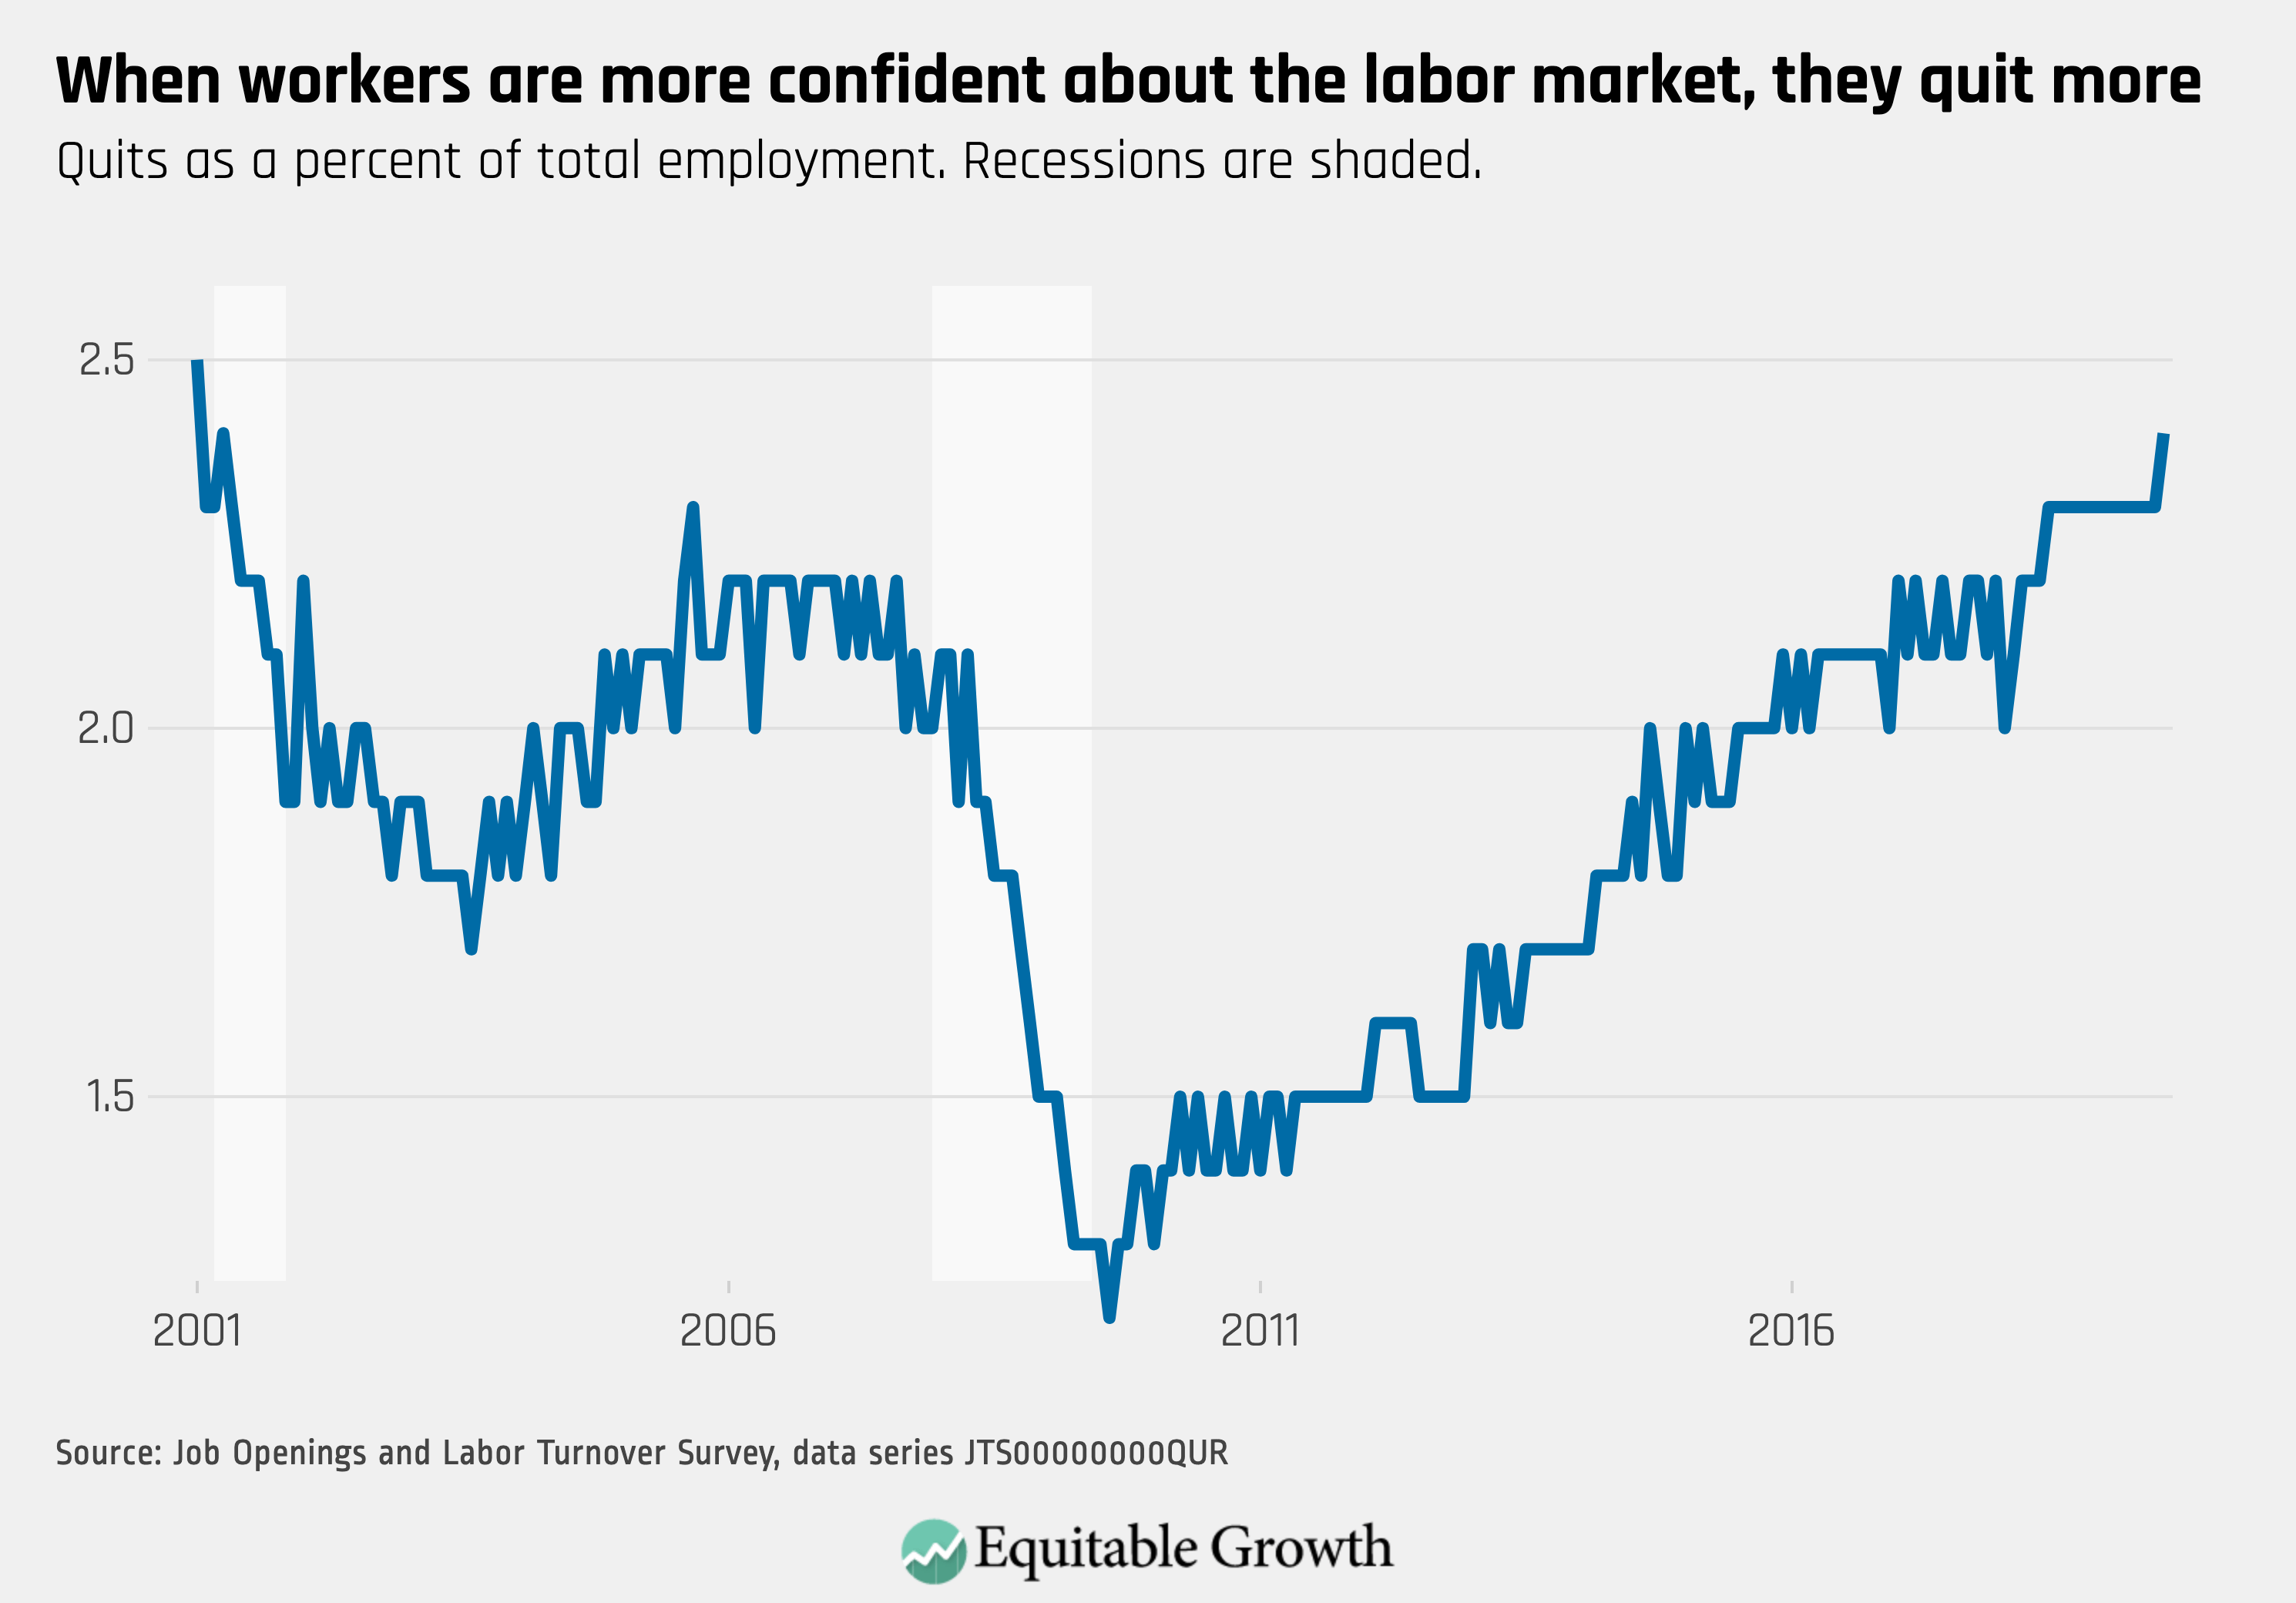
Every month the U.S. Bureau of Labor Statistics releases data on hiring, firing, and other labor market flows from the Job Openings and Labor Turnover Survey, better known as JOLTS. Today, the BLS released the latest data for July 2019. This report doesn’t get as much attention as the monthly Employment Situation Report, but it contains useful information about the state of the U.S. labor market. Below are a few key graphs using data from the report.

1.

The quit rate increased slightly to 2.4%, after holding steady at 2.3% for over one year.
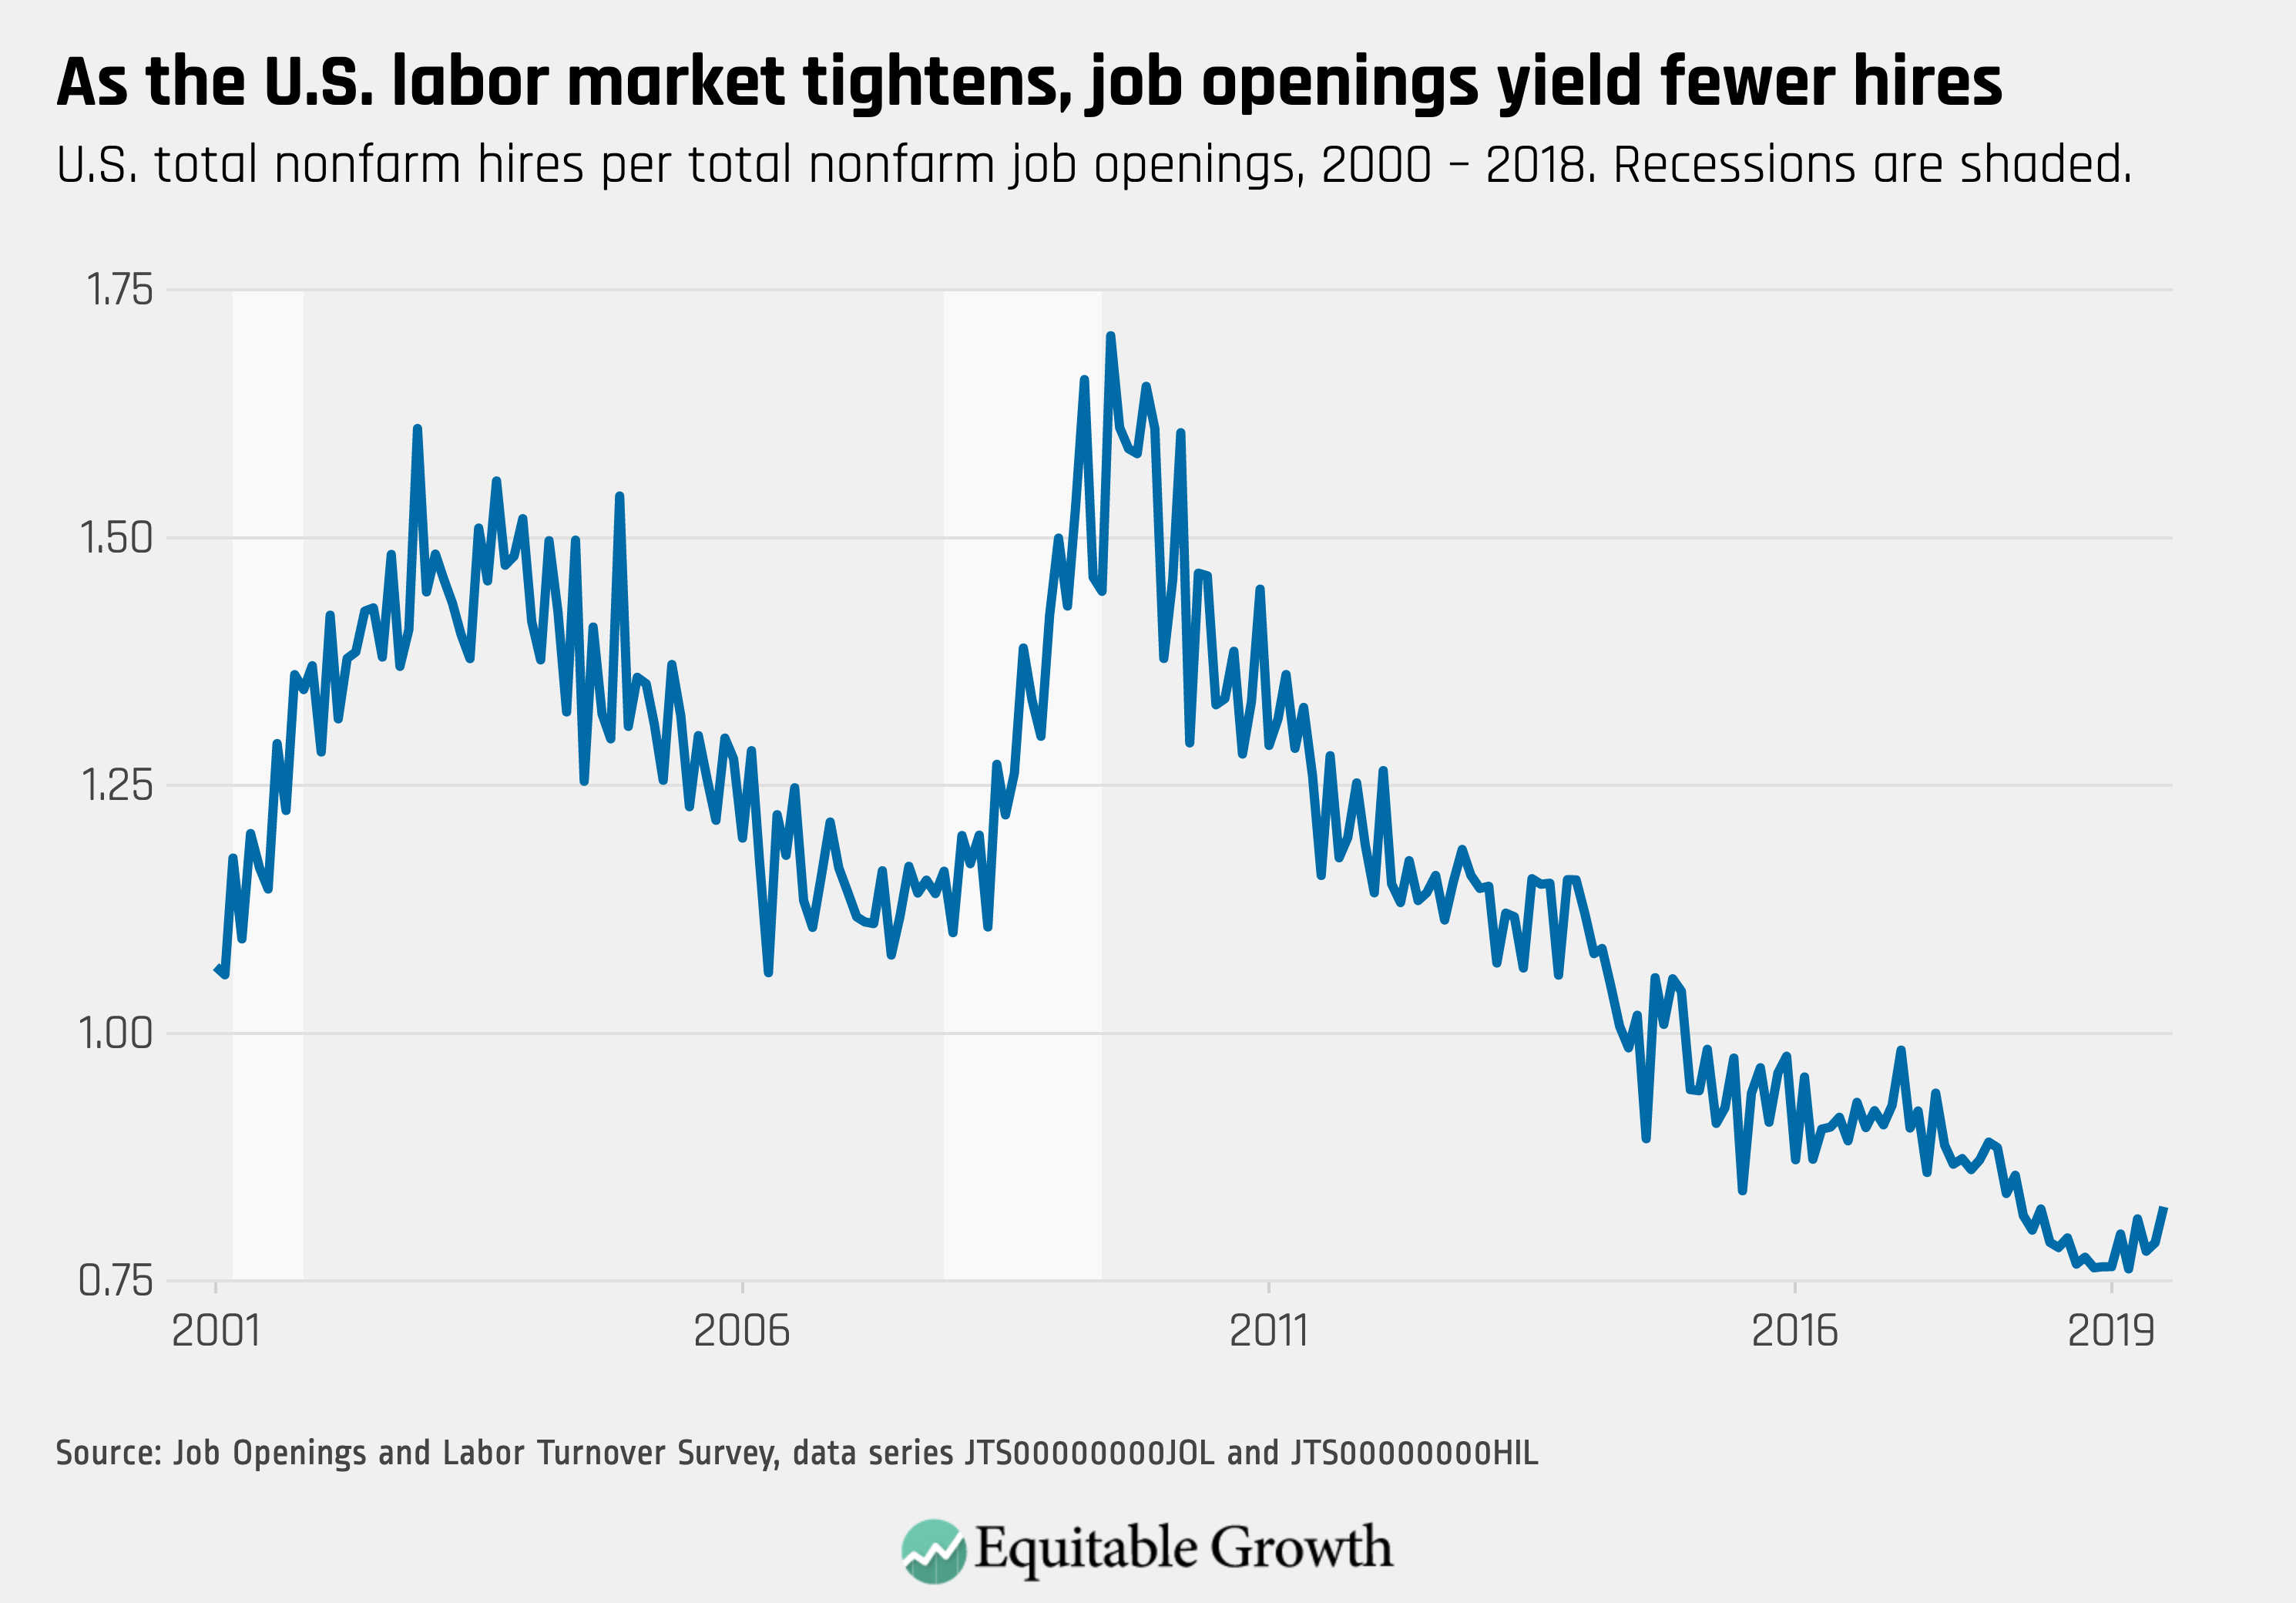
2.

Hires increased in July while job openings decreased very slightly, which may signify a slowing labor market expansion.
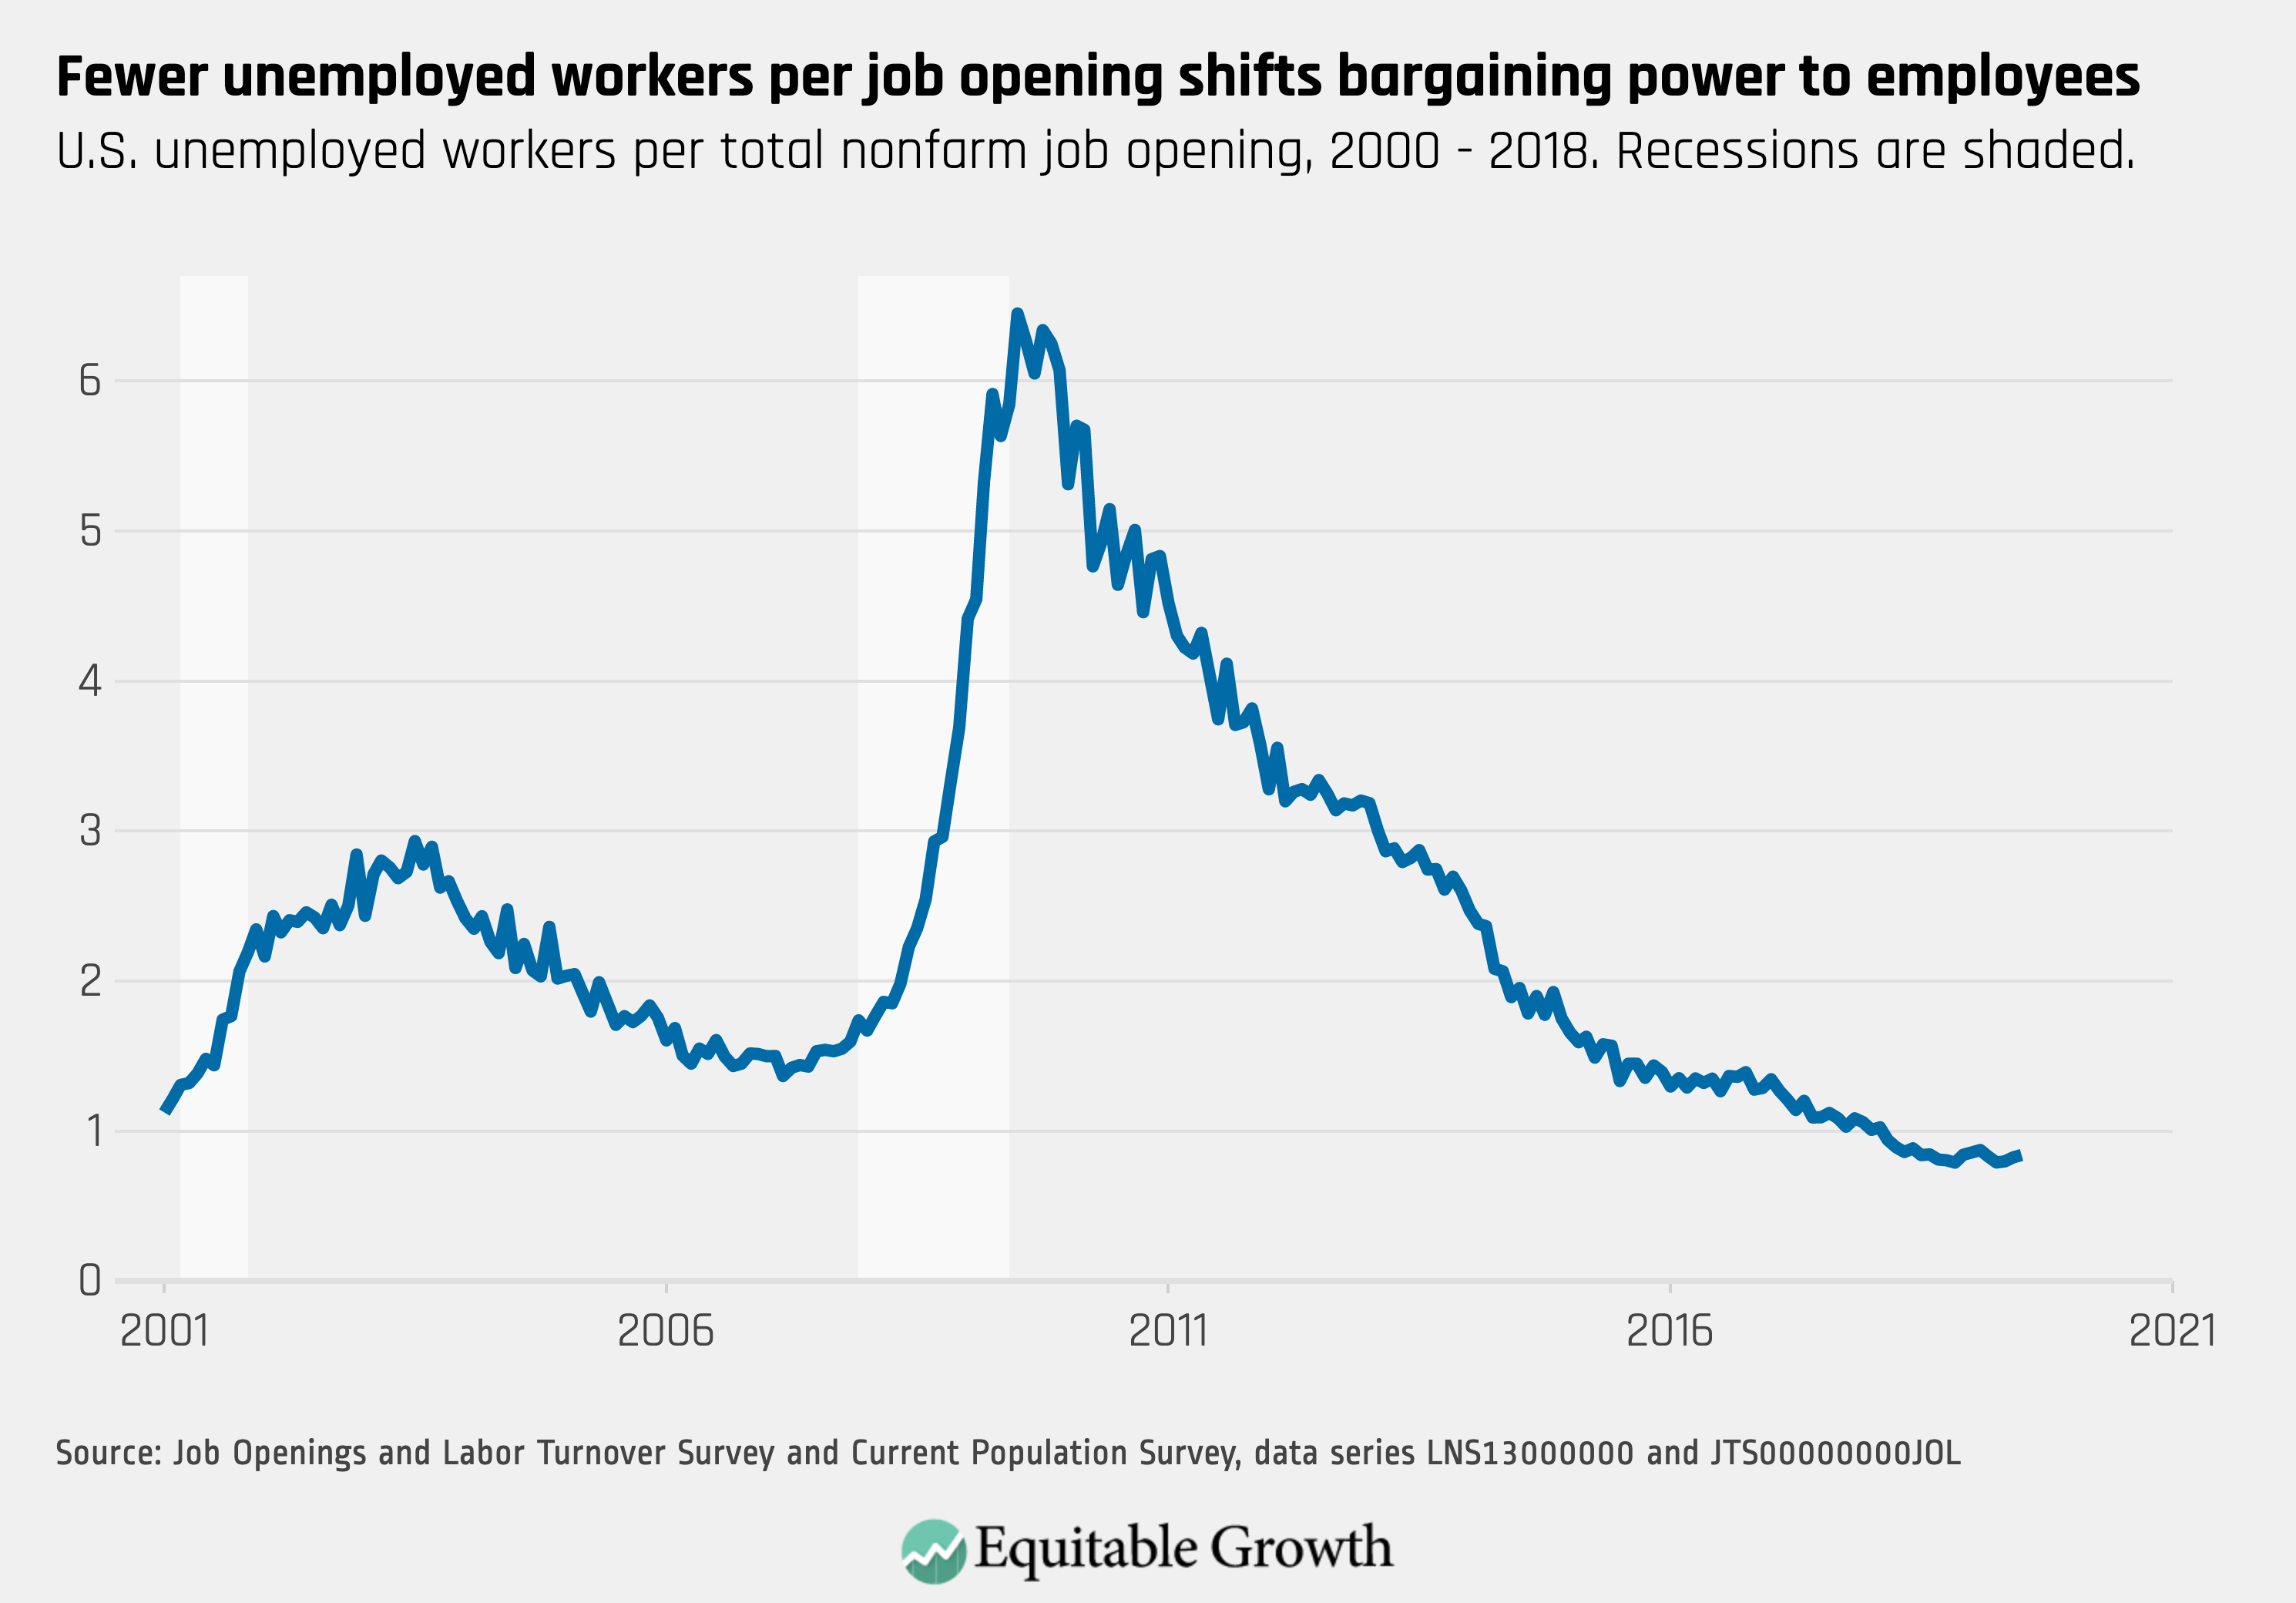
3.

Job openings declined slightly in July, but there continues to be fewer than one unemployed worker per job opening.
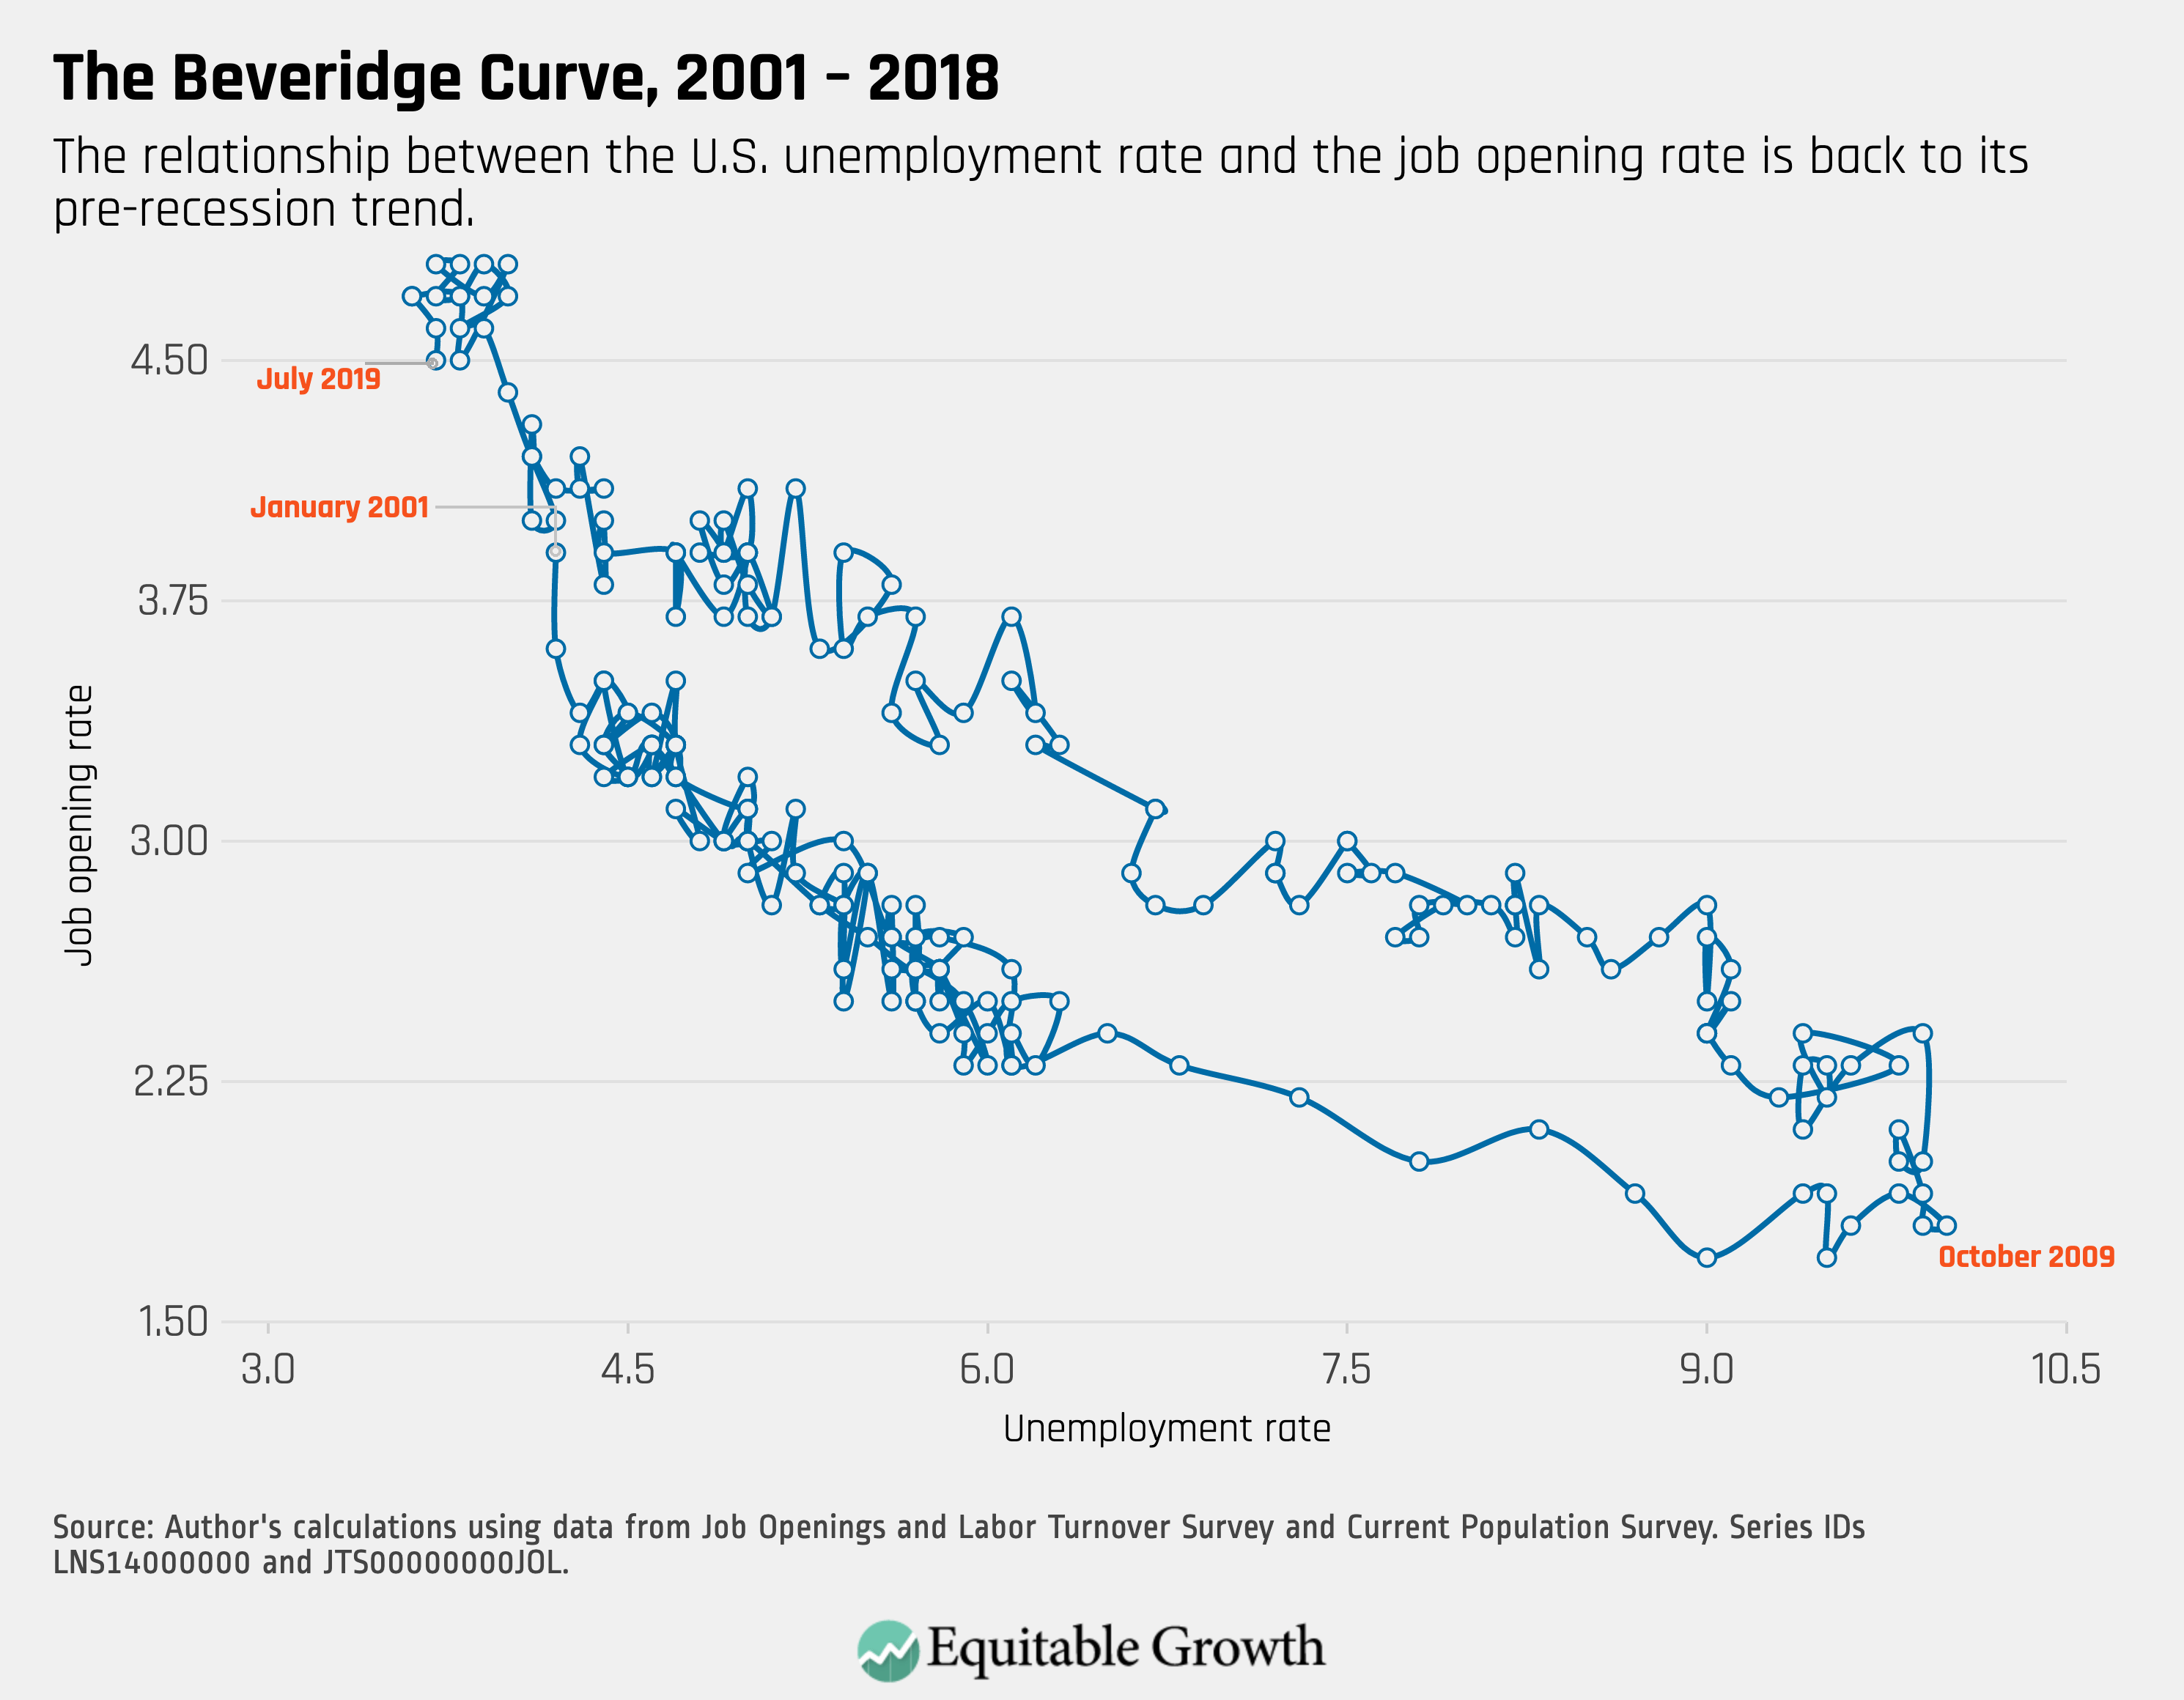
4.

The Beveridge Curve continues to hover at a high rate of job openings and a low rate of unemployment, demonstrating an expansionary labor market even as job openings declined slightly in July.

Connect with us!

Explore the Equitable Growth network of experts around the country and get answers to today's most pressing questions!

Get in Touch