Newly released U.S. poverty statistics show that recent economic growth is not broadly shared
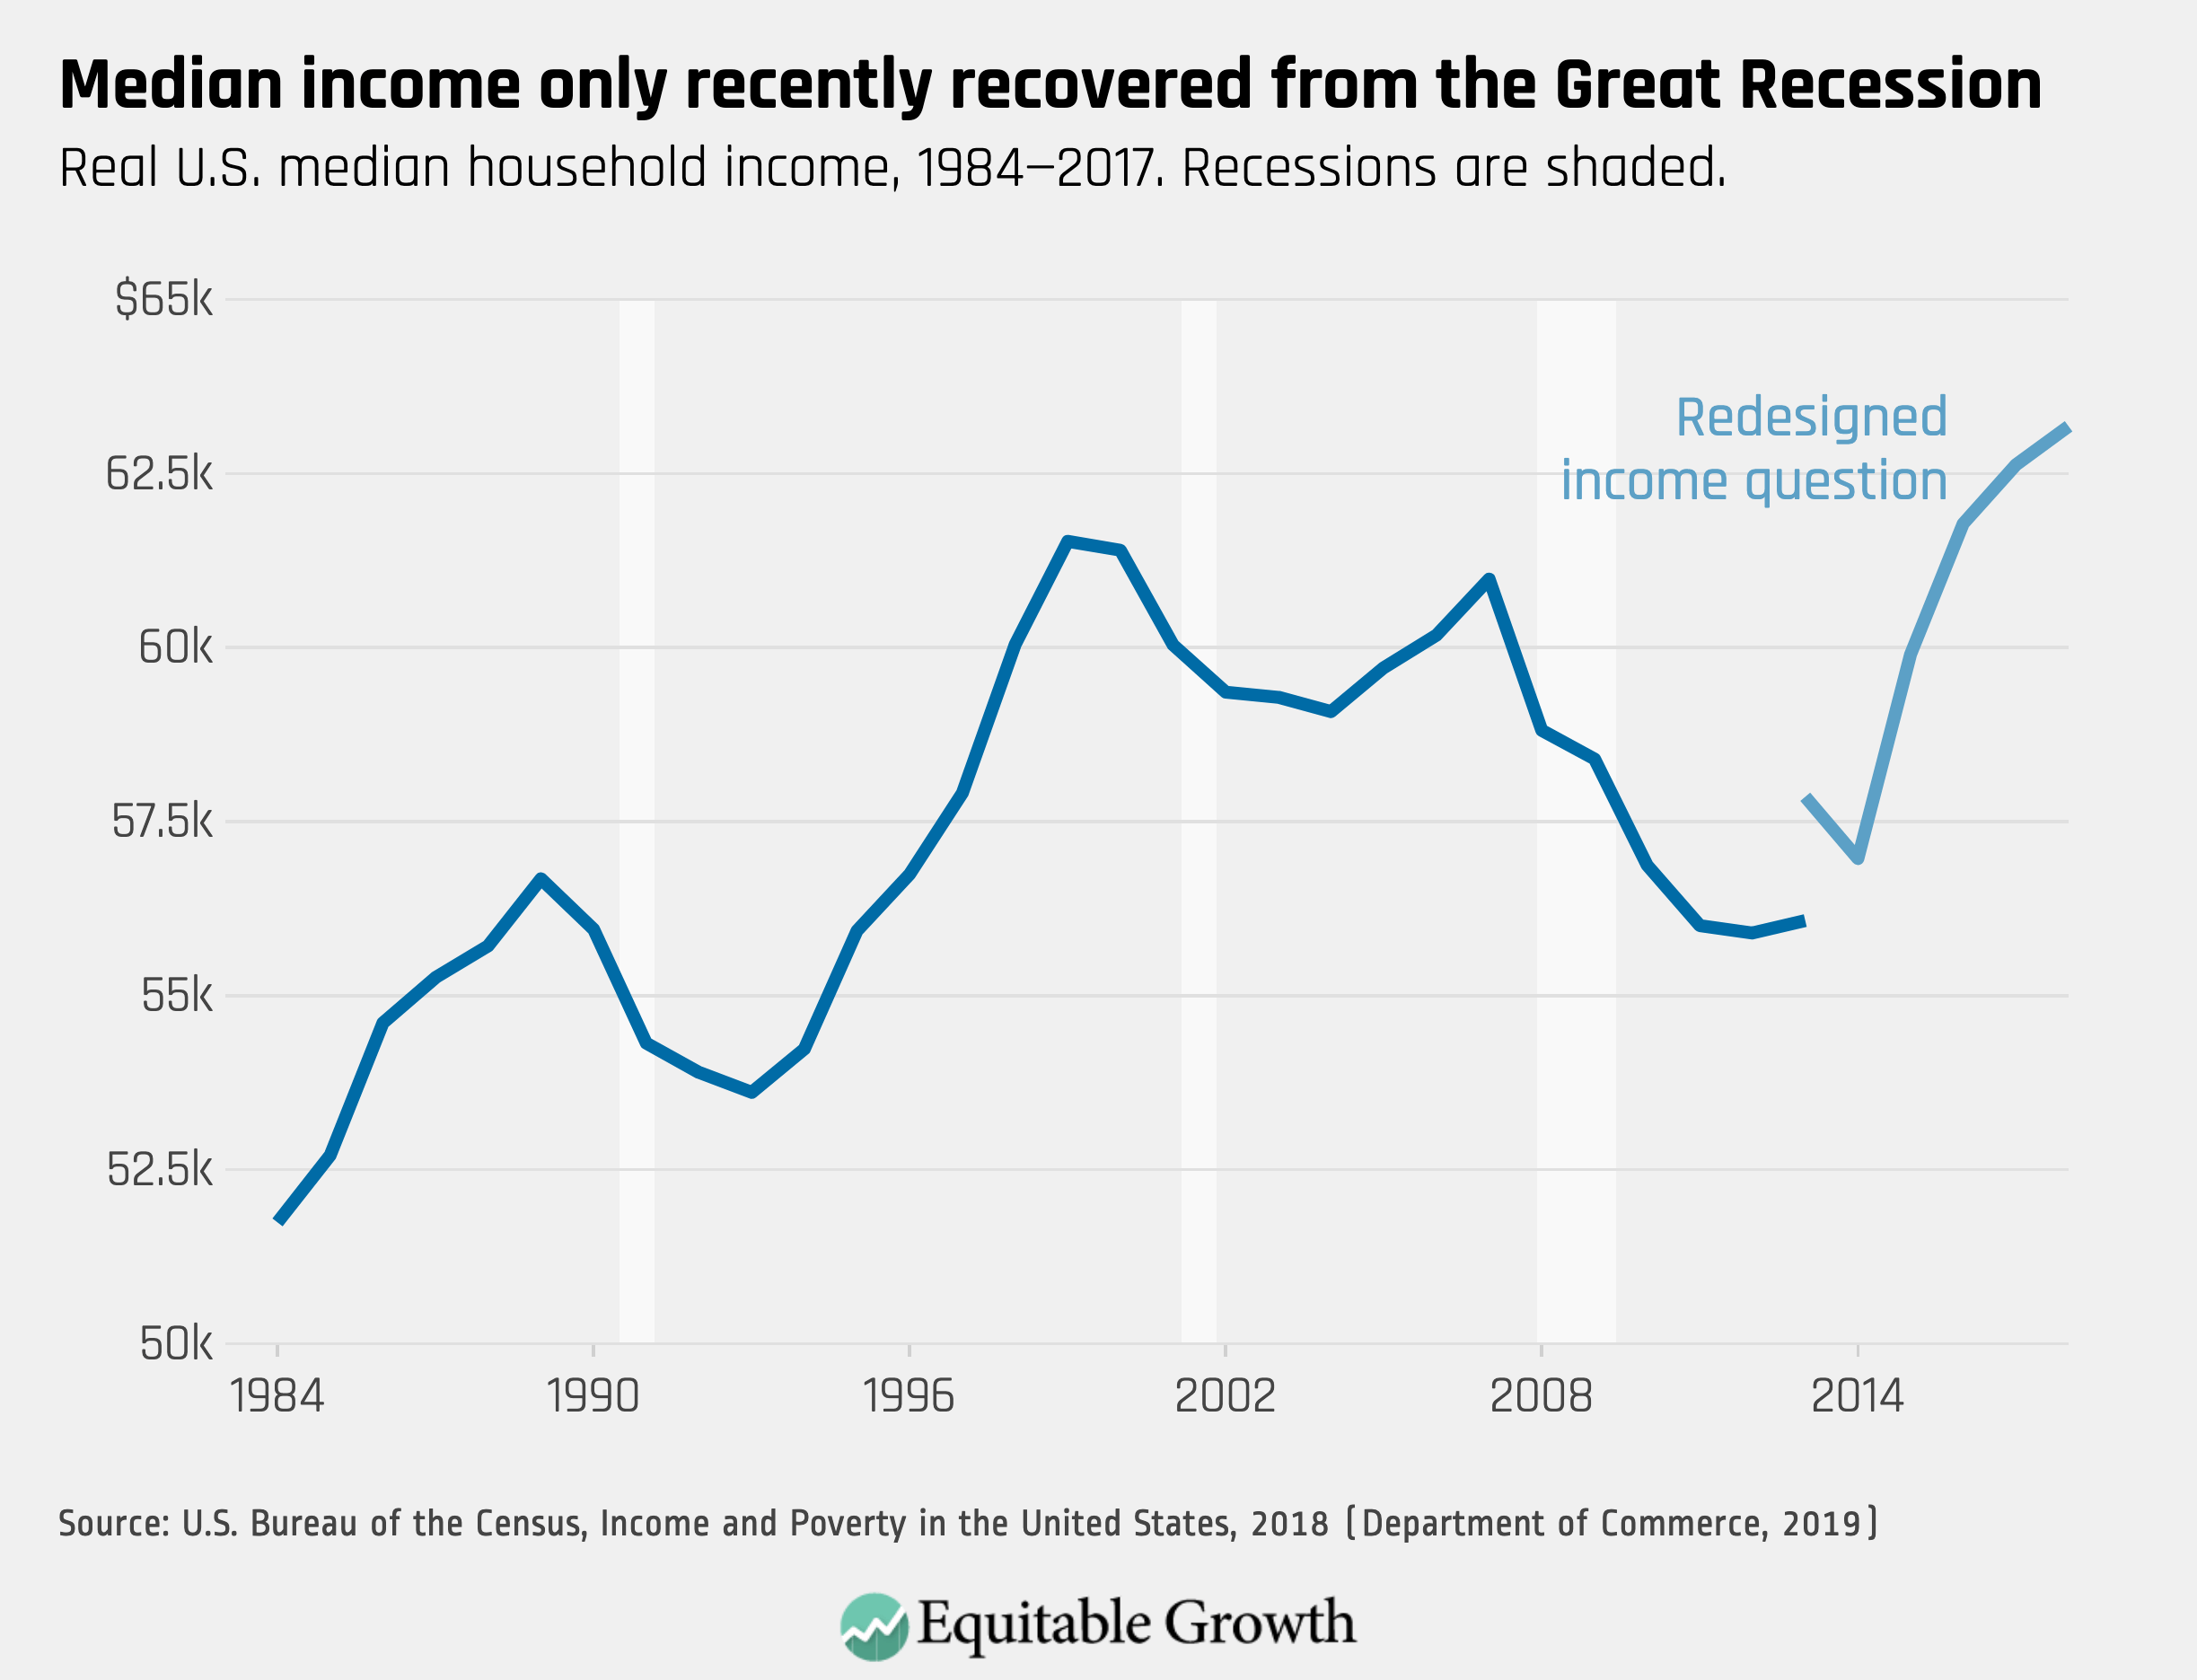
The U.S. Census Bureau yesterday released the 2018 poverty rate alongside information on the 2018 median household income in the United States. The takeaway? Things are not improving that much. Looking across all households, median household income was not statistically different in 2018 from what it was in 2017. (See Figure 1.)
Figure 1
But what about looking at the most economically vulnerable members of society specifically? Taking a closer look at the bottom of the income distribution, the official poverty rate decreased 0.5 percentage points. This is good news, especially if you rely on the official poverty measure.
Yet the official poverty measure isn’t a great gauge of the actual hardship people face—it simply multiplies the 1963 cost of nutritionally adequate food for the year by three, indexes it to inflation, and then sees how a household’s cash income before taxes stacks up against that number. In 2018, the poverty threshold for a four-person household was slightly more than $25,000.
The Supplemental Poverty Measure is more nuanced. This measure, first used by the Census Bureau in 2011, is based on expenditures on food, clothing, shelter, and utilities rather than just food. It takes into account the regional cost of living. And, when adding up a household’s resources, this measure considers gains and losses from taxation, noncash benefits such as government-provided housing and food assistance, and expenses such as child support payments, medical expenses, and work expenses.
This more nuanced look at economic hardship shows no significant change from 2017 to 2018. That means that, on average, things were the same in 2018 as they were in 2017 both for U.S. households on average and for people in poverty, according to this more nuanced measure.
This type of stagnation is what economists and policymakers might expect in the context of a slow-growing economy. But 2018 was a bang-up year for the United States as a whole: The U.S. Gross Domestic Product increased by 2.9 percent! The Census Bureau’s poverty numbers, however, indicate that the fruits of growth are not reaching those on the brink of poverty. Indeed, this is part of a larger trend—since 1980, U.S. economic growth has disproportionately accrued to the households at the top of the income distribution, leaving others behind.
It’s also important to put these figures in more recent historical context. From the end of 2007 to 2009, the United States experienced its most severe recession since the Great Depression, and poverty rates spiked. From 2009 until today, the United States has experienced the most prolonged economic expansion in history. Yet, the median household has not seen significant improvement in income levels relative to 2007, and the poverty numbers are just now recovering to where they were on the eve of the Great Recession.
While it sounds good to reach pre-recession poverty levels, the picture of poverty prior to the recession wasn’t particularly rosy. Today, as then, more than 1 in 10 people living in the United States are officially poor, and this is a lower bound for economic hardship—a far greater number of people than those officially classified as poor are unable to put food on the table or are unable to get the medical care they need because they lack the money needed to do so. It is shocking that economic hardship is so prevalent in a wealthy nation in the midst of an expansion.
What’s more, economic expansions don’t last forever. Another recession is inevitable, which means policymakers should anticipate that poverty rates will spike again. It is wonderful that fewer people in the country are experiencing economic hardship today than were during the Great Recession and its aftermath. Real people experienced real pain during that time. But we shouldn’t conflate the amelioration of pain with progress. When it has taken nearly a decade for people at the bottom of the income distribution to get back to the starting line they were at in 2007, and when they are likely to be pushed backward again by a recession in the near future, that is not progress. That is struggling to keep up.
Though the numbers released by the U.S. Census Bureau yesterday don’t tell a story of progress, they do tell a story of policy successes. Looking at the Supplemental Poverty Measure, the data show that—holding all else constant—Social Security benefits lifted 27.3 million people out of poverty. Similar calculations show refundable tax credits such as the Earned Income Tax Credit lifting 7.9 million people out of poverty and the Supplemental Nutrition Assistance Program and housing subsidies each lifting about 3 million people out of poverty. Our social safety net is catching people. In fact, it is catching millions of people.
The numbers released yesterday paint a picture of a society in which economic gains are not reflected in the paychecks of its most economically vulnerable people, but where the social safety net offers some crucial assistance. Policymakers should take a hard look at these numbers and think carefully about labor market and tax interventions that can facilitate a broader sharing of economic growth. They should also note that in the absence of these changes—or, better yet, as a complement to them—an expansion, or at least a maintenance of social safety net programs, protect people who fall prey to the vagaries of the market.