(This column is reprinted with the permission of the authors. It was first published by voxeu.org on June 3, 2021)
In the aftermath of past pandemics, fiscal policy played an important role in reducing or amplifying income inequality. This column predicts the likely distributional effects of Covid-19 by analysing evidence from five previous outbreaks (SARS, H1N1, MERS, Ebola, and Zika). It finds that severe austerity measures were associated with inequality increases three times greater than expansive fiscal policy following a pandemic. Premature austerity is self-defeating from both a macro and an equity standpoint.
In the early months of COVID-19, there was an expectation that the pandemic might actually lessen inequality, as some low-income frontline workers received hefty pay rises (Hannon 2020). Evidence from previous centuries, such as from the 14th-century Black Death, show big increases in the labour share, as labour became more scarce relative to capital in the outbreak’s wake (Scheidel 2017, Jorda et al. 2020). As Alfani (2020) notes, however, the historical evidence is not uniform: 17th century plagues did not lead to more egalitarian outcomes, as the rich took steps to protect their wealth. Recurrent plagues in the 19th century caused by the spread of cholera had devastating effects on the poor, as they lived in unhealthy and crowded conditions. Dosi et al. (2020) conjectured that COVID-19 would amplify existing inequalities, through channels ranging from inequities in risk of infection to access to hospitalisation, ability to work remotely, and the threat of longer-term job loss.
Twenty-first century pandemics, inequality and austerity
In our recent work (Furceri et al. 2021a, 2021b), we provide evidence about the likely distributional effects of COVID-19 by analysing the impacts of five major epidemics since 2000: SARS (2003), H1N1 (2009), MERS (2012), Ebola (2014) and Zika (2016). For convenience, we refer to these major epidemics as pandemics. H1N1 (Swine Flu Influenza) was the most widespread, with over 6½ million cases across 148 countries. The other four events affected fewer countries and were largely confined to specific regions: SARS and MERS in Asia, Ebola in Africa, and Zika in the Americas.
As in Ma et al. (2020), we construct a (0,1) dummy variable – the ‘pandemic event’ – which takes the value one for countries declared by the WHO to be affected by a particular pandemic. This gives us a total of 225 pandemic events. Our results are similar if we measure the intensity of pandemics based on cases per population. We use the net Gini coefficient (Gini net of taxes and transfers) as our measure of inequality; results are similar for the market Gini.
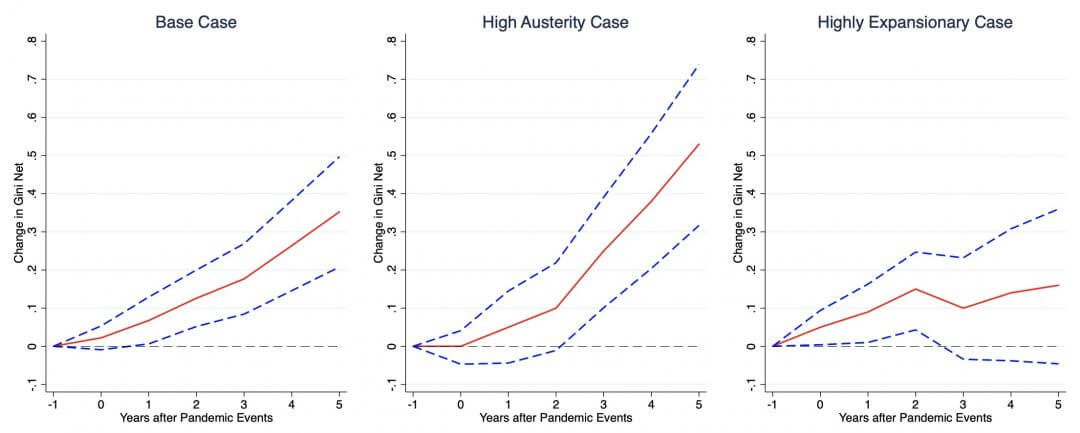
We trace the impact of pandemic events on the Gini by estimating impulse response functions directly from local projections (Jordà 2005). The left-hand panel of Figure 1 shows that the Gini measure increases by about 0.35 points after five years; the response is both statistically and economically significant given that Gini coefficients change slowly over time.
Figure 1 Fiscal policy and the impact of pandemics on inequality
Note: Impulse response functions are estimated using a sample of 177 countries over the period 1960–2019. The graph shows the response and one standard deviation confidence bands. The y-axis shows the change in the net Gini; the x-axis shows years after pandemic events; t = 0 is the year of the pandemic event.
The fiscal response varies considerably across pandemic events. We measure the stance of fiscal policy by shocks to the general government balance not correlated with changes in economic activity (see Fatas and Mihov 2003); results are similar using health expenditures or the extent of redistribution to reflect the fiscal stance. We exploit the variation across countries in fiscal balances after the onset of pandemics to see whether the impact on inequality is different in episodes characterised by high austerity (fiscal surpluses greater than 4% of GDP) compared with episodes of highly supportive fiscal policy (fiscal deficits greater than 4% of GDP).
The results from conditioning on the fiscal response are shown in the middle and right-hand panels of Figure 1. The key finding is that austerity intensifies the extent of the rise in inequality in the aftermath of pandemics. As shown in the middle panel, episodes of high austerity lead to an increase in the Gini by about 0.55 points, considerably larger than the average impact shown in the left-hand panel. By contrast, expansionary fiscal policy considerably dampens the rise in inequality, as shown in the right-hand panel: The increase in the Gini is under 0.2 points and is not statistically significant.
Distributional effects of COVID-19
Early evidence points to adverse distributional impacts from COVID-19 (Blundell et al. 2020, Hacioglu et al. 2020, IMF 2021) occurring through a number of channels. The poor have been more prone to getting infected – in part because they are less likely to have the option of working from home – and to die if infected due to lack of access to quality healthcare. For instance, Brown and Ravallion (2020) found that infection rates were higher in US counties with a higher share of African Americans and Hispanics. There are also indirect and longer-lasting effects from job loss and other shocks to income, particularly for workers in informal employment with limited access to health services and social protection.
However, our results suggest that a long-lasting increase in inequality need not be a foregone conclusion and is contingent on the fiscal policies adopted by governments. The COVID-19 pandemic has led to a worldwide fiscal response estimated at nearly $12 trillion, or about 12% of global GDP, though the fiscal response in low-income developing countries has been restricted by tighter financing constraints. A number of observers have cautioned against premature withdrawal of fiscal support despite the resulting build-up in debt levels (IMF 2020, Stiglitz 2020, Sandbu 2020).
While country circumstances of course differ considerably, a case can be made that there is still room for fiscal support in many economies. The likelihood that low long-term interest rates will persist can moderate debt-service burdens and allow governments to continue extending the maturity of government bonds, though caution is warranted where fiscal buffers have been eroded (Chamon and Ostry 2021). In low-income developing countries, these policy options are much less readily available, and the alleviation of financing constraints could require greater assistance from private sector creditors and additional concessional financing from the official sector.
The experience following the Global Crisis offers a cautionary tale of the dangers of premature fiscal consolidation. In 2010, buoyed by what turned out to be mistaken signs of a strong recovery, many advanced economies signalled a U-turn in their fiscal stance, a policy choice that many regard as partly responsible for the tepid recovery that followed and the consequent failure to bring about reductions in debt-to-GDP ratios (Stiglitz 2012, IEO 2014). The turn to austerity also led to cutbacks in governments’ health expenditures in the run-up to the COVID-19 pandemic (OECD 2016, Soener 2020). Instead of a premature return to austerity, countries would do better by anchoring their fiscal plans in a credible medium-term framework and orienting public expenditures over the coming years toward productive investments in digital and green infrastructure (Gaspar 2020, Estefania Flores et al. 2021). By building market confidence in fiscal sustainability and boosting growth, respectively, these two steps can bring down the debt-to-GDP ratio over time in a more durable way than sharp fiscal consolidations.
Blundell, R, M Costa Dias, R Joyce and X Xu (2020), “COVID‐19 and Inequalities”, Fiscal Studies 41(2): 291–319.
Brown, C and M Ravallion (2020), “Inequality and the coronavirus: Socioeconomic covariates of behavioral responses and viral outcomes across US counties”, NBER Working Paper 27549.
Chamon, M and J D Ostry (2021), “A Future with High Public Debt: Low-for-Long Is Not Low Forever”, IMF Blog, 20 April.
Dosi, G, L Fanti and M Virgillito (2020), “Unequal societies in usual times, unjust societies in pandemic ones”, LEM Working Paper Series, No. 2020/14, Scuola Superiore Sant’Anna, Laboratory of Economics and Management, Pisa.
Furceri, D, P Loungani, J D Ostry and P Pizzuto (2021b), “The Rise in Inequality after Pandemics: Can Fiscal Support Play a Mitigating Role?”, IMF Working Paper 21/120.
Gaspar, V (2020), “Fiscal Policies to Contain the Damage from COVID-19”, IMF Blog, 15 April.
Hannon, P (2020), “How the Coronavirus Might Reduce Income Inequality”, The Wall Street Journal, 19 April.
IEO (2014), “Response to the Financial and Economic Crisis”, International Monetary Fund.
IMF (2020), Fiscal Monitor, October.
IMF (2021), Fiscal Monitor, April.
Jordà, O (2005), “Estimation and inference of impulse responses by local projections”, American Economic Review 95: 161–182.
Jordà, O, S Singh and A Taylor (2020), “Pandemics: Long-Run Effects”, Covid Economics 1: 1–15.
Ma, C, J Rogers and S Zhou (2020), “Global economic and financial effects of 21st century pandemics and epidemics”, Covid Economics 5: 56–78.
Sandbu, M (2020), “There is no fiscal emergency”, Financial Times, 26 November.
Scheidel, W (2017), The Great Leveler: Violence and the History of Inequality from the Stone Age to the Twenty-First Century, Princeton: Princeton University Press.
Soener, M (2020), “How Austerity is Worsening Coronavirus”, Books & Ideas, College de France, 4 June.
In August 2020, the Federal Open Market Committee published an amended version of its “Statement on Longer-Run Goals and Monetary Policy Strategy.” In this revised statement, the FOMC reaffirmed its 2 percent target for inflation, as first announced in January 2012, and adopted a new approach, known as average inflation targeting:
The Committee judges that longer-term inflation expectations that are well anchored at 2 percent foster price stability and moderate long-term interest rates and enhance the Committee’s ability to promote maximum employment in the face of significant economic disturbances. In order to anchor longer-term inflation expectations at this level, the Committee seeks to achieve inflation that averages 2 percent over time, and therefore judges that, following periods when inflation has been running persistently below 2 percent, appropriate monetary policy will likely aim to achieve inflation moderately above 2 percent for some time.
From this description, it is clear that the Federal Reserve adopted average inflation targeting explicitly with the goal of “anchoring” inflationary expectations. When policymakers refer to anchored expectations, they usually mean that people and financial markets are confident that future inflation will be close to target in the long run, regardless of developments in the short run. That is, when people observe a boost in inflation, they can be very sure it will be short-lived and that the Fed will keep inflation near target in the long run.
This is important. If consumers or investors believe inflation will be more permanent, then they may behave in ways that spur further inflation. Strongly anchored expectations indicate that the U.S. central bank is credible. And as the revised statement notes, the Fed believes that well-anchored expectations can help promote maximum employment.
This column provides background on the Fed’s average inflation target, details recent trends in U.S. consumers’ inflation expectations and uncertainty, and explains how the Fed could better anchor those expectations to ensure a stable U.S. economy over the course of business cycles.
Average inflation targeting at the Fed
Average inflation targeting is called a makeup strategy because it doesn’t “let bygones be bygones.” That is, monetary policymakers take past inflation into account, not only current economic conditions and outlook. A Federal Reserve Board working paper, presented to the Federal Open Market Committee as background before the adoption of this target, outlines three main benefits of makeup strategies:
First, makeup strategies naturally imply a desire to commit to a “lower for longer” path for the policy rate [the federal funds rate] in episodes when the ELB [effective lower bound, sometimes called the zero lower bound, which refers to the inability of central banks to set policy interest rates much lower than zero] significantly impairs the conduct of monetary policy and may cause extended periods of below-target inflation. Commitments to a lower-for-longer path provide more accommodative financial conditions, boosting aggregate demand and reducing deviations of inflation from its target even while the ELB binds. Second, (credible) makeup strategies foster expectations of more stable inflation, on average, thus reducing the sensitivity of inflation to transient developments. Third, the systematic materialization of stable inflation rates under makeup strategies may better anchor longer-term inflation expectations, inducing a virtuous circle.
The “lower for longer” point has received the most attention. Since inflation did run persistently below 2 percent for many years, the new average inflation targeting strategy should allow a longer period for the U.S. labor market to recover before the Fed begins to tighten monetary policy, even as inflation rises above the 2 percent target. The second and third points are again explicitly about anchoring inflation expectations. We can be sure that Fed officials will carefully monitor inflation expectations as they decide just how much “lower for longer” they are willing to go.
Fed officials are doing just that. Federal Reserve Governor Randal Quarles, for example, attributed recent above-target inflation to three factors: “the surge in demand as more services come back on line while goods spending remains robust, the emergence of bottlenecks in some supply chains, and the very low inflation readings recorded last spring dropping out of the calculation of 12-month inflation.” Quarles interpreted these factors as transitory and argued that the Fed needs to remain patient “so long as inflation expectations continue to fluctuate around levels that are consistent with our longer-run inflation goal.”
Similarly, Vice Chair Richard Clarida noted in November 2020 that “the goal of the new framework is to keep inflation expectations well anchored at 2 percent, and, for this reason, I myself plan to focus more on indicators of inflation expectations themselves—especially survey-based measures—than I will on the calculation of an average rate of inflation over any particular window of time.”
U.S. consumers’ inflation expectations and uncertainty
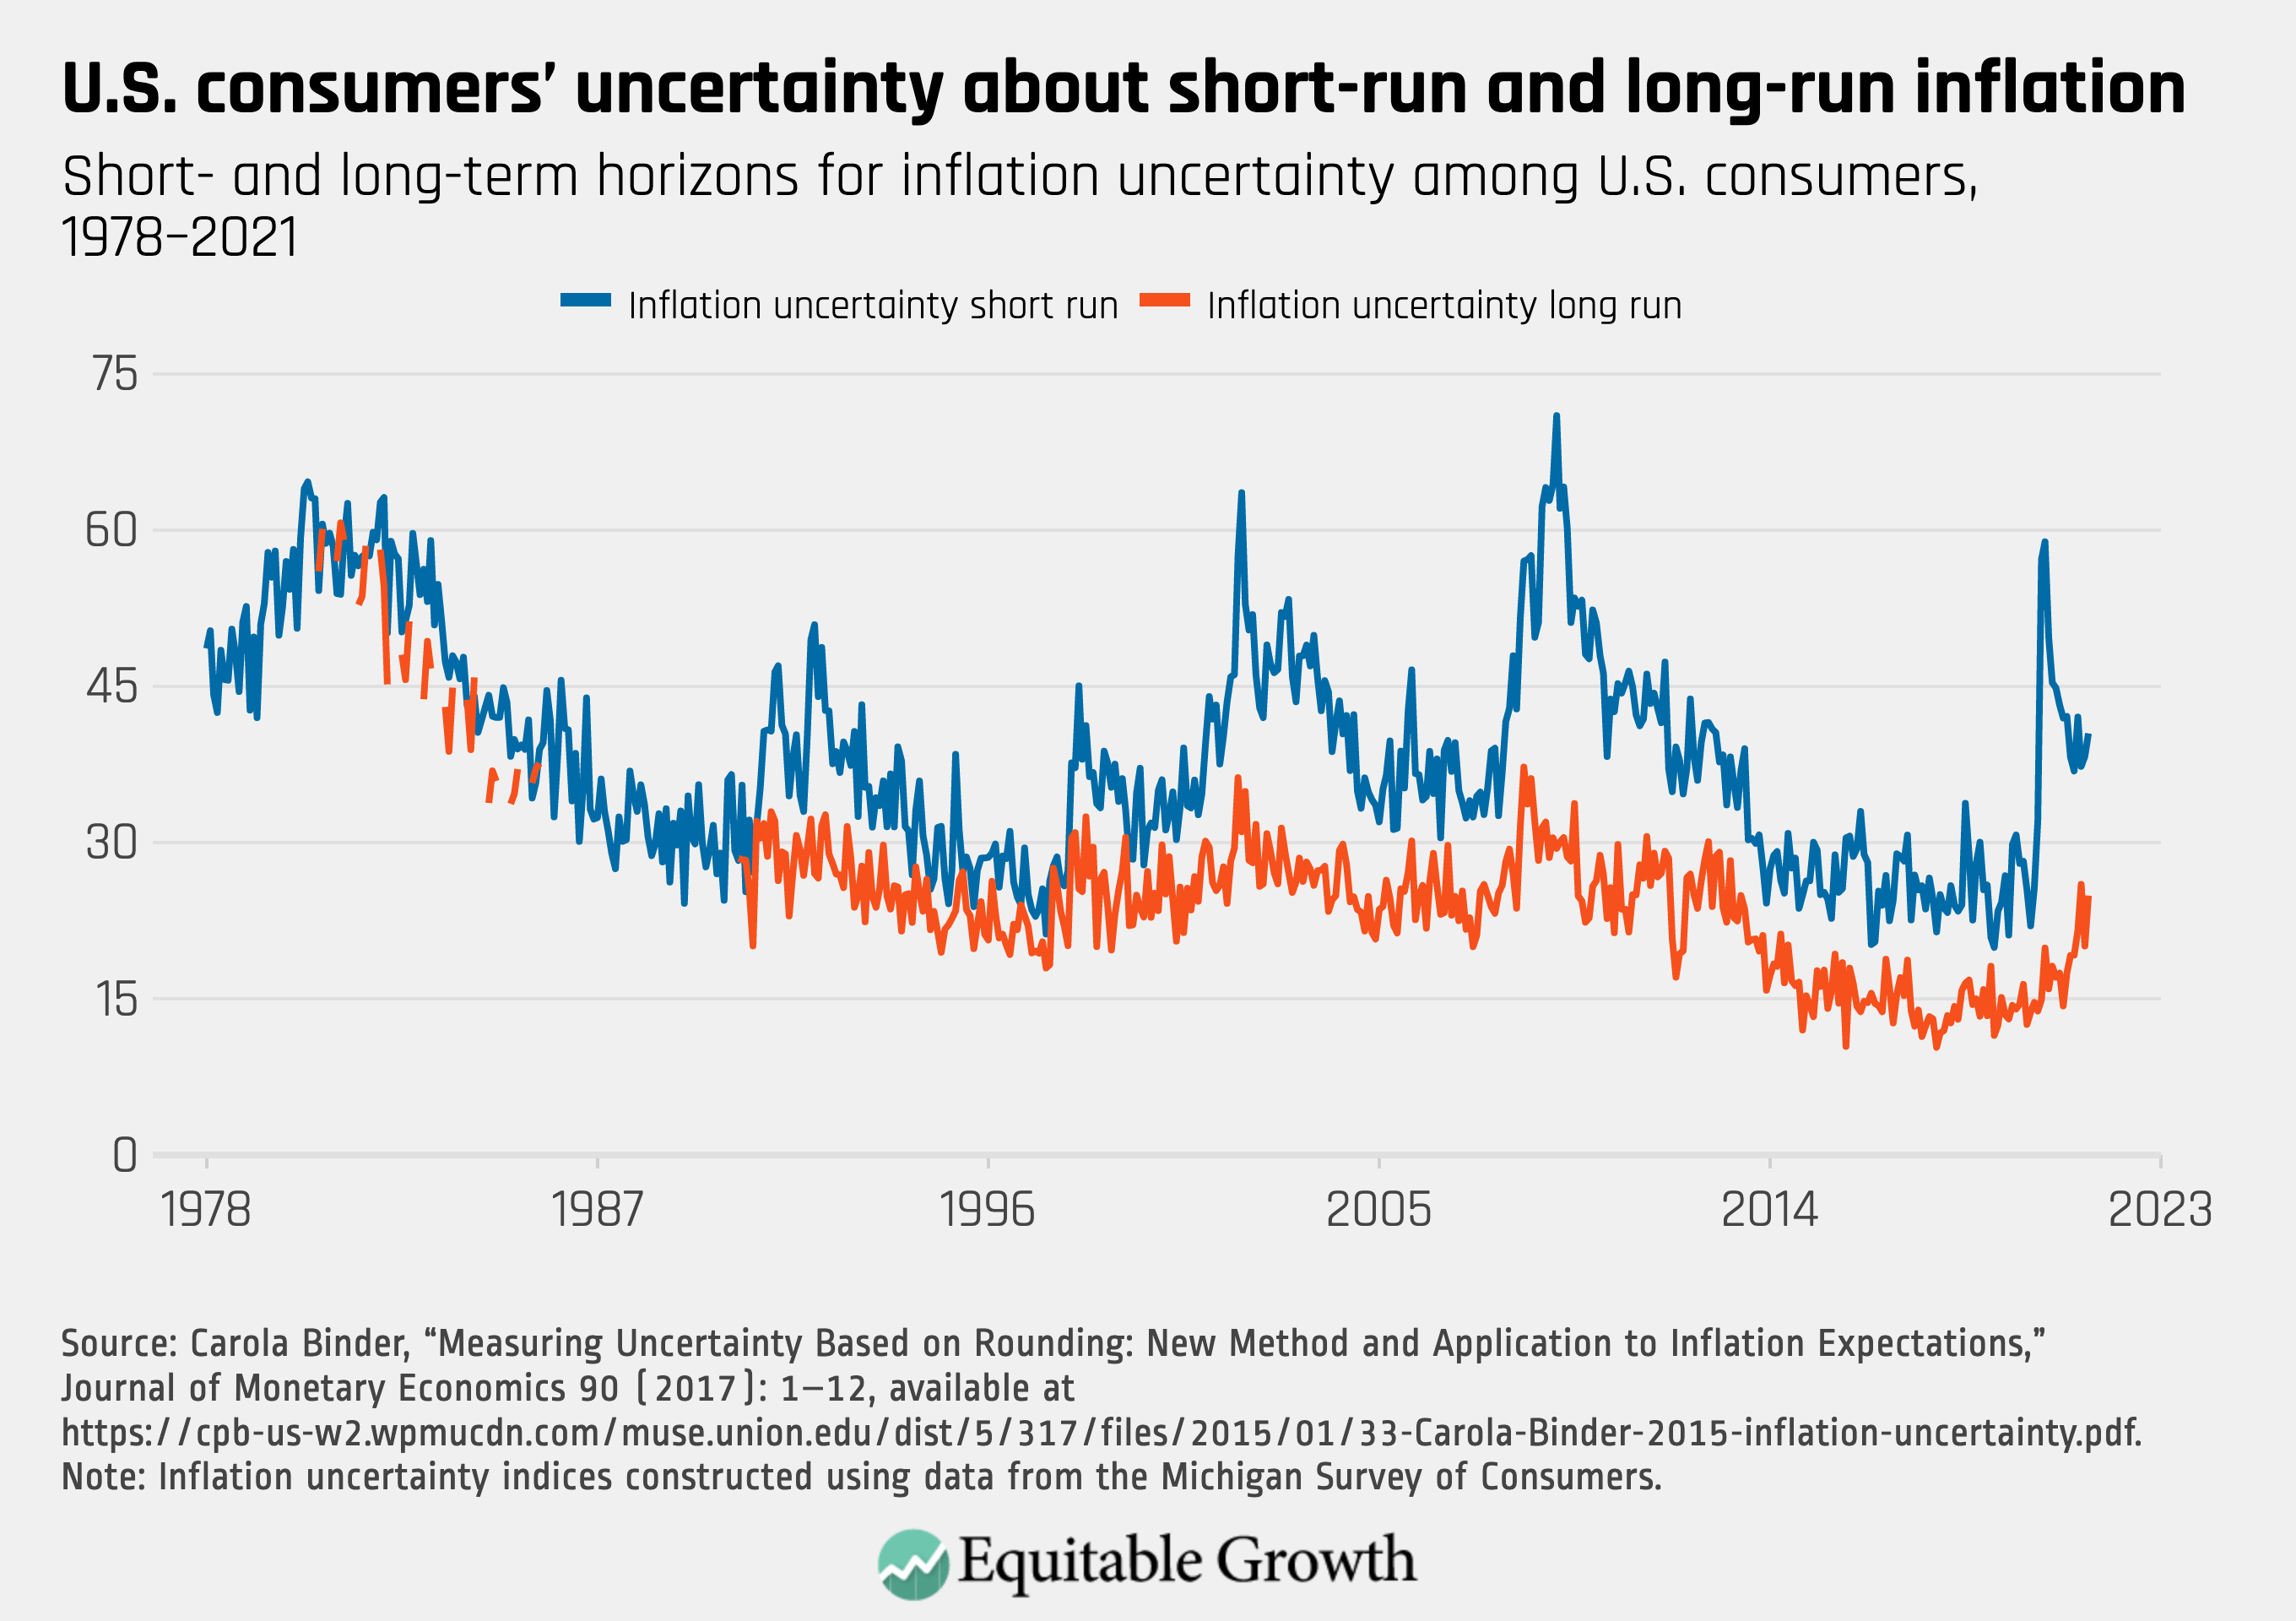
Fed policymakers monitor a variety of measures of inflation expectations, derived from financial markets and surveys. The Michigan Survey of Consumers, a long-running monthly survey of adults in the United States, is frequently used to gauge the expectations and sentiment of the general public (as opposed to professional forecasters or financial market participants). I developed a new method for estimating consumer uncertaintyabout inflation based on the forecasts in the Michigan Survey of Consumers. In particular, I show that respondents tend to provide forecasts that are round numbers—say, 5 percent, 10 percent, or 15 percent—when they are highly uncertain about their forecasts.
This methodology allows researchers to quantify the uncertainty associated with this rounding behavior, to create a consumer inflation uncertainty index about short-run (1 year ahead) and long-run (5–10 years ahead) inflation. The inflation uncertainty index is the estimated percent of respondents who are highly uncertain about inflation. My methodology is useful for estimating uncertainty when density forecasts are not available and has been used by anarrayofeconomists. (See Figure 1.)
Figure 1
Since the disinflation engineered by then-Fed Chair Paul Volcker in the early1980s, long-run uncertainty has typically been lower than short-run uncertainty, consistent with well-anchored expectations. Even when people are uncertain about what will happen with prices over the next year, they are more certain about what will happen in the long run. Figure 1 shows that at the start of the coronavirus pandemic, short-run uncertainty spiked from 25.7 in February 2020 to 57.2 in April 2020, peaked in May 2020, and has since been declining.
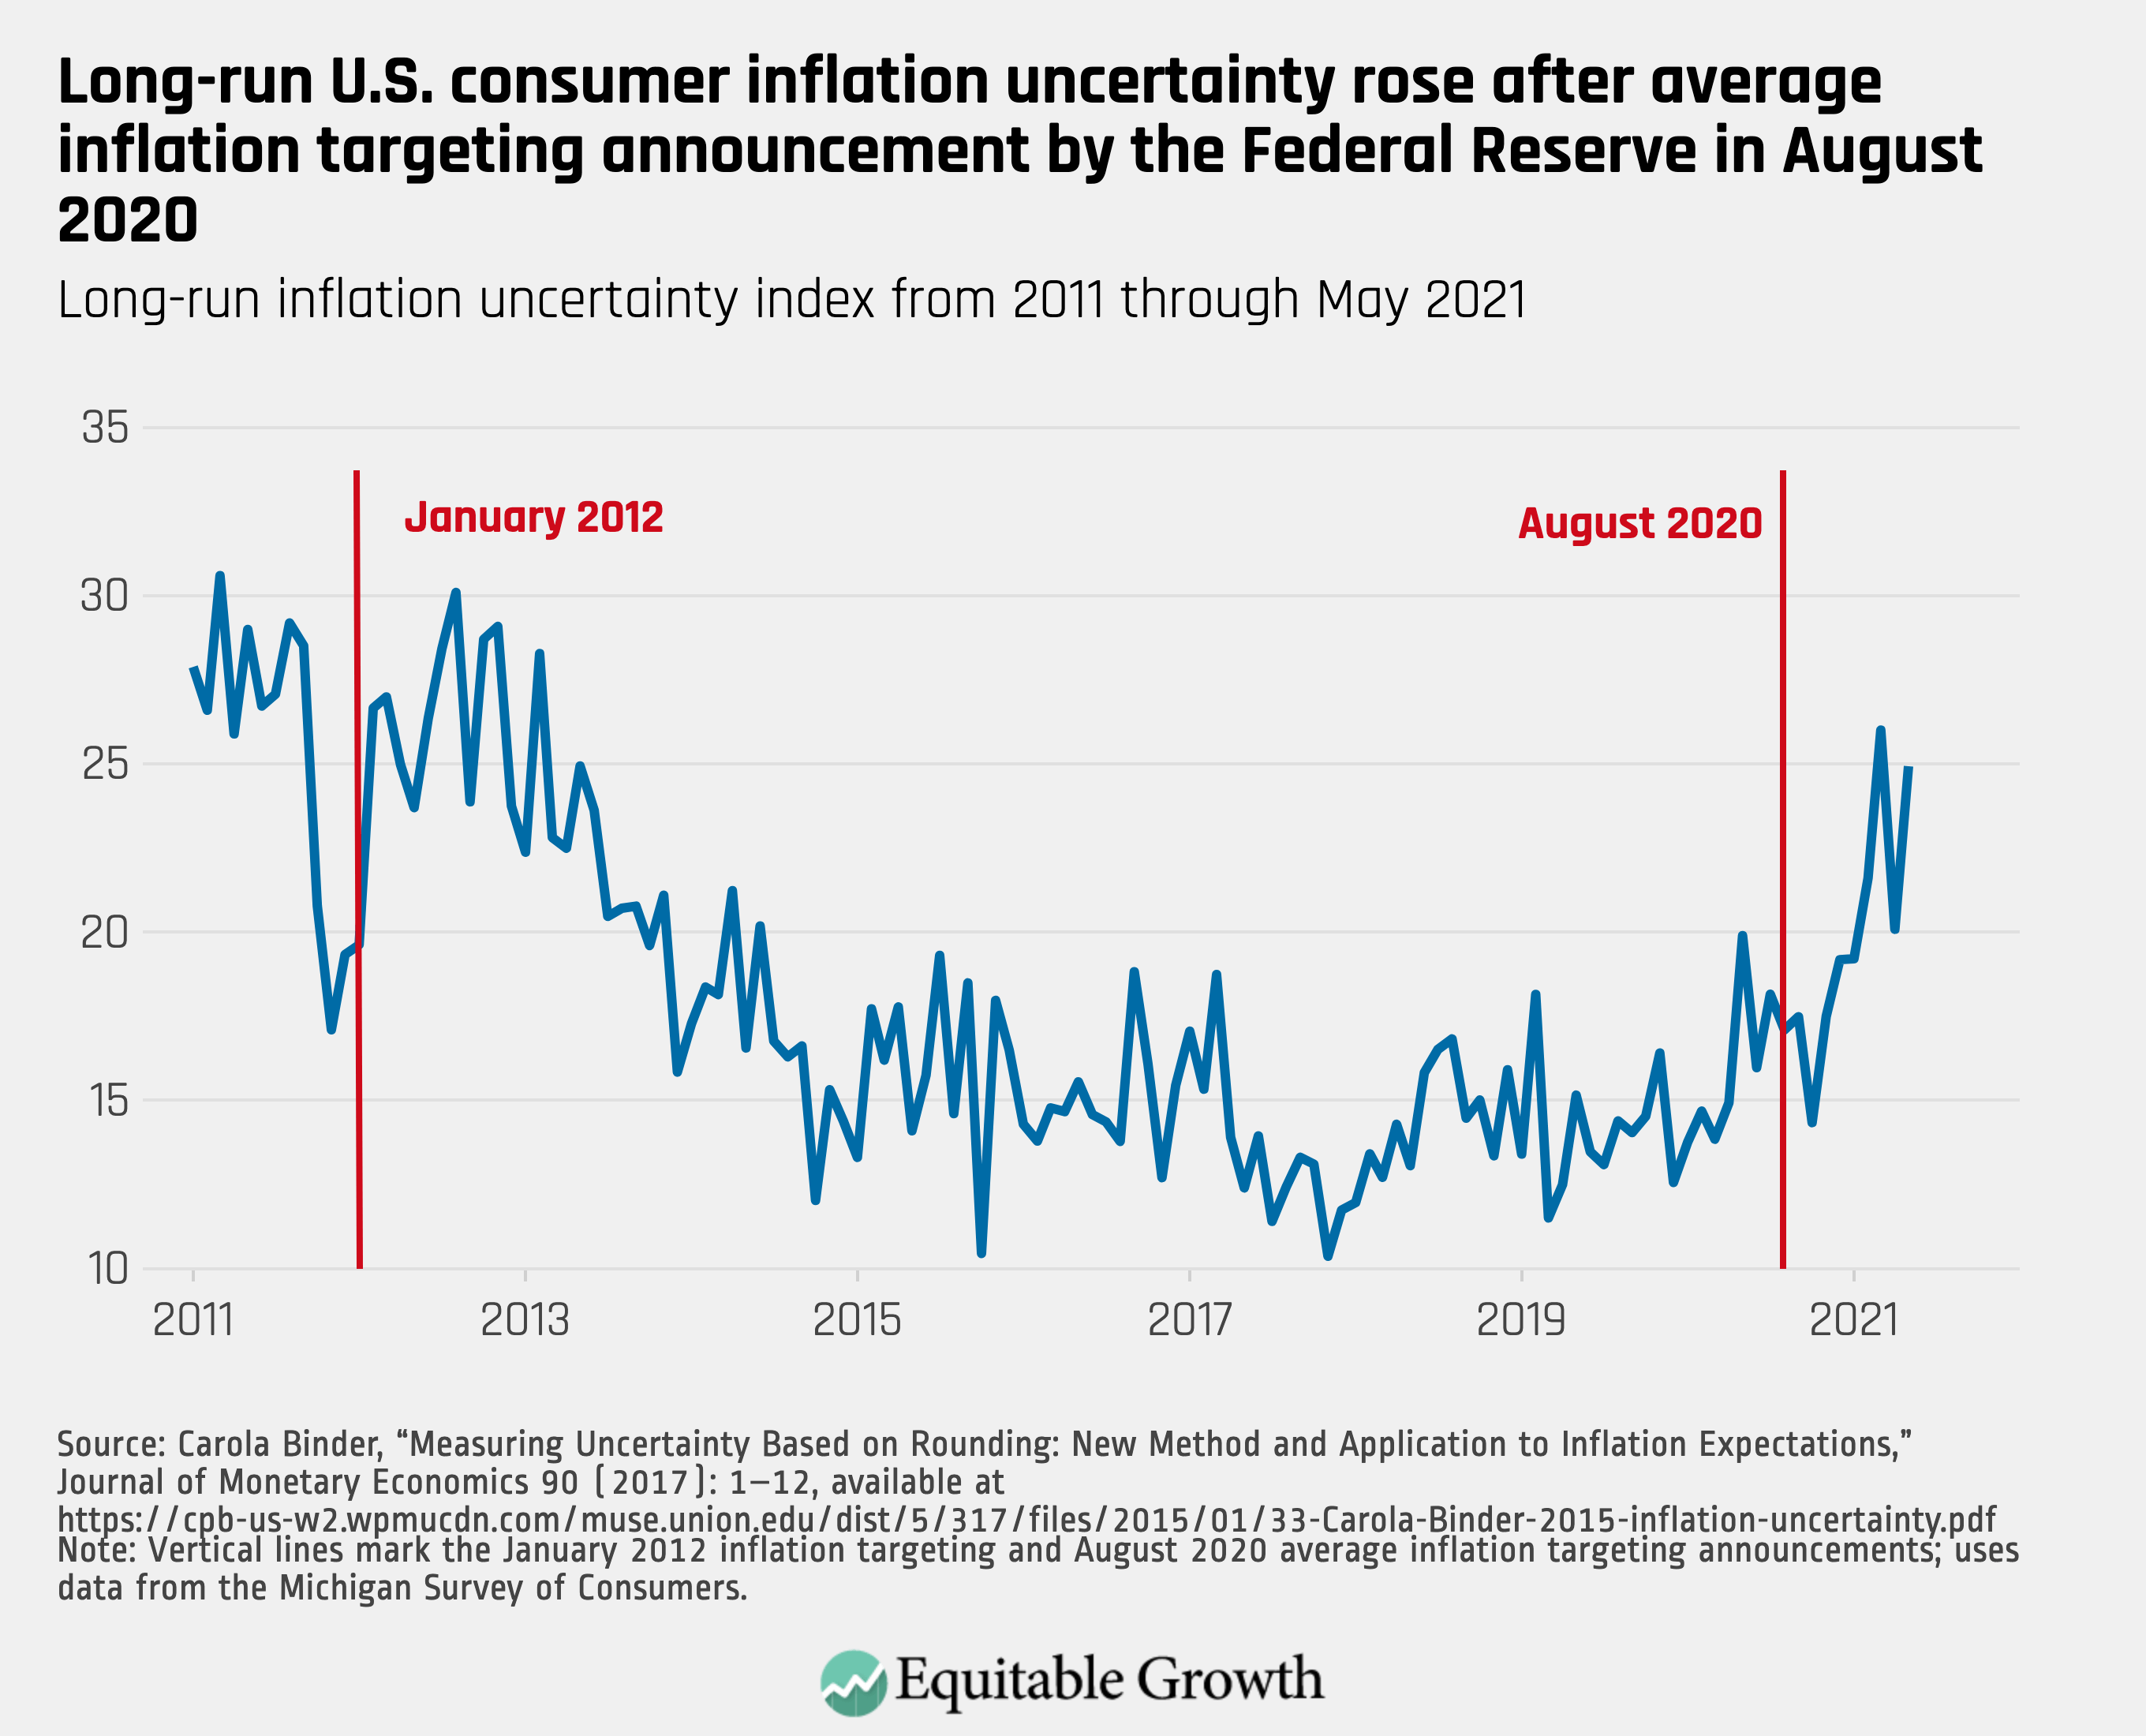
The recent behavior of long-run uncertainty is much different. Long-run uncertainty barely changed at the start of the pandemic but began to rise later, indicating that the pandemic itself is not likely the cause of the recent rise in long-run uncertainty; neither the presidential election nor President Joe Biden’s inauguration were associated with notable changes in uncertainty at either horizon. The rise in this trend is especially noteworthy because it reverses a years-long trend of declining long-run uncertainty.
Long-run uncertainty declined following the 2012 average inflation targeting announcement, from an average of 25.7 in 2011 to 14.1 in 2019. In March 2021, long-run uncertainty rose to 26—the highest it has been since February 2013. It remains similarly high as of May 2021, the most recent month for which data are available. (See Figure 2.)
Figure 2
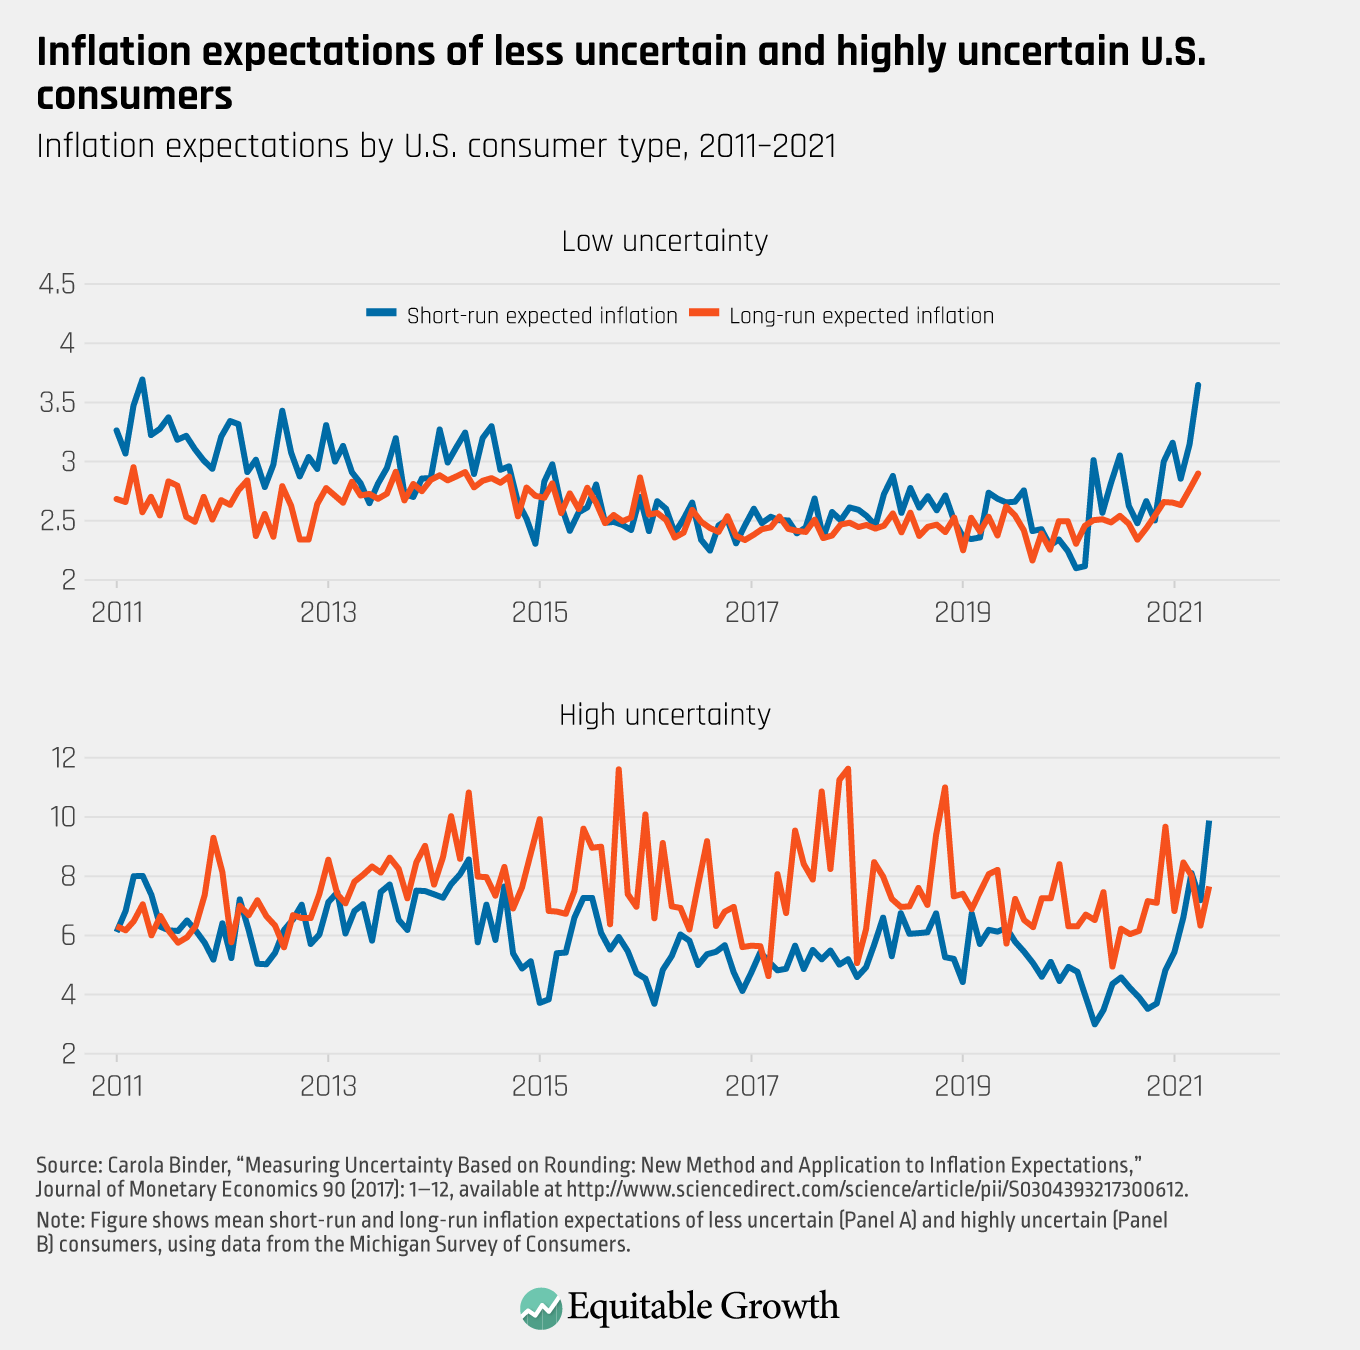
Another useful feature of my methodology is that it allows me to compute the mean (average) inflation expectations each month for the “less uncertain” and the “highly uncertain” consumers. Since the expectations of the highly uncertain consumers tend to be very noisy and high—because these consumers give round number forecasts such as 5 percent, 10 percent, and even 25 percent—focusing on the less uncertain consumers gives a clearer signal of how expectations are evolving.
As of May 2021, short-run and long-run inflationary expectations for these consumers are 3.6 percent and 2.9 percent, respectively, or about two standard deviations higher than they have been over the past decade. (If I had not separated the two types of consumers, then we would observe expectations of 5.7 percent for the short horizon and 3.5 percent for the long horizon.) (See Figure 3.)
Figure 3
The rise in short-run inflation expectations makes a lot of sense because consumers have noticed rising prices and reasonably expect higher inflation over the next year. The rise in long-run inflationary expectations implies that they (also reasonably) think that at least some of the new inflationary pressures are nontransitory.
Addressing long-run inflationary uncertainty
This rise in U.S. households’ long-run inflation expectations is not necessarily a problem at this point—after all, one point of average inflation targeting is to boost long-run inflation expectations so they don’t fall below target after years of too-low inflation. Moreover, the Michigan Survey of Consumers does not specify that respondents should provide expectations of personal consumption expenditures, or PCE inflation, which the Fed targets. Indeed, the respondents to the Michigan survey may be reporting expectations for something more like Consumer Price Index inflation, which tends to be around half a percentage point higher. So, the increase to 2.9 percent could be a move from “too low” to “just right,” rather than from “just right” to “too high.”
But the rise in long-run inflationary uncertainty is more clearly problematic. Uncertainty about long-run inflation makes it more difficult for households to plan for the future. They need to know, for example, how much to save for education or retirement, or to make good decisions about things like taking out a mortgage. These decision can be inherently stressful. This stress hits lower-income households hardest.
Inflation uncertainty is consistently two to three times higher for respondents in the bottom 30 percent of the income distribution, compared to the top 30 percent. Inflation uncertainty also is higher for women and for people without a college degree.
The trends of rising long-run inflationary expectations and rising long-run inflationary uncertainty, especially if these trends continue, should prompt U.S. monetary policymakers to further refine their approach to their average inflation target. Indeed, Fed Chair Jerome Powell, in a speech following his average inflation target announcement in 2020, explained that “we are not tying ourselves to a particular mathematical formula that defines the average.” What’s more, the Fed has not announced the time horizon over which they will compute average inflation. This gives the Fed a great deal of flexibility and discretion but comes at the cost of greater uncertainty.
Conclusion
By making its approach to average inflation targeting more explicit and transparent, the Fed could alleviate at least some of the recently growing uncertainty and keep expectations better anchored as inflation begins to rise. This would enable the Fed to facilitate a stronger U.S. labor market recovery before beginning to tighten.
Greater transparency about average inflation targeting would also make it easier for the U.S. public to hold the Fed accountable, which could improve the Fed’s credibility and democratic legitimacy. And if monetary policymakers have a little less discretion, that should put more impetus on electedofficials to pursue sound and equitable economic policies, such as automatic stabilizers, rather than relying too heavily on the Fed to ensure a stable and sustainable U.S. economy over the course of business cycles.
—Carola Conces Binder is an associate professor of economics at Haverford College.
Many U.S. labor market indicators suggest that the United States is on its way toward a strong recovery. Over the past few months, hopeful signs are starting to emerge that workers in general, and low-wage workers in particular, are now in a better position to bargain for higher pay and better working conditions. But to ensure that a strong labor market recovery translates into sustained wage gains and broadly shared economic growth, workers need not only access to jobs but also access to good jobs.
U.S. workers also need government investments and support for social infrastructure to ensure strong, healthy, and broadly shared economic growth. These types of policies fall into three major categories. The first is labor market protections, such as raising the federal minimum wage. The second is enhancing our system of income supports, such as reforming Unemployment Insurance so that enhanced benefits trigger on and off automatically, enacting a federal paid leave program, and permanently expanding the Earned Income Tax Credit and Child Tax Credit. And the third is strengthening our care infrastructure by providing supports to workers with caregiving responsibilities, including child care and community-based services and supports for older adults and people with disabilities. All of these social infrastructure investments ultimately boost U.S. economic productivity.
These investments in basic social infrastructure are a long time coming. The coronavirus recession hit already vulnerable workers and families first and hardest, exposing longstanding disparities that were present in the U.S. economy well before the onset of the crisis. Now, amid overblown fears about inflation and so-called labor shortages, it’s time for policymakers to invest in social infrastructure to ensure a more equitable and resilient post-pandemic economy. After all, a truly competitive U.S. labor market is not a policy failure, but rather a sign of a healthy, well-functioning economy.
Many labor market indicators suggest the U.S. economy is on track to a strong recovery
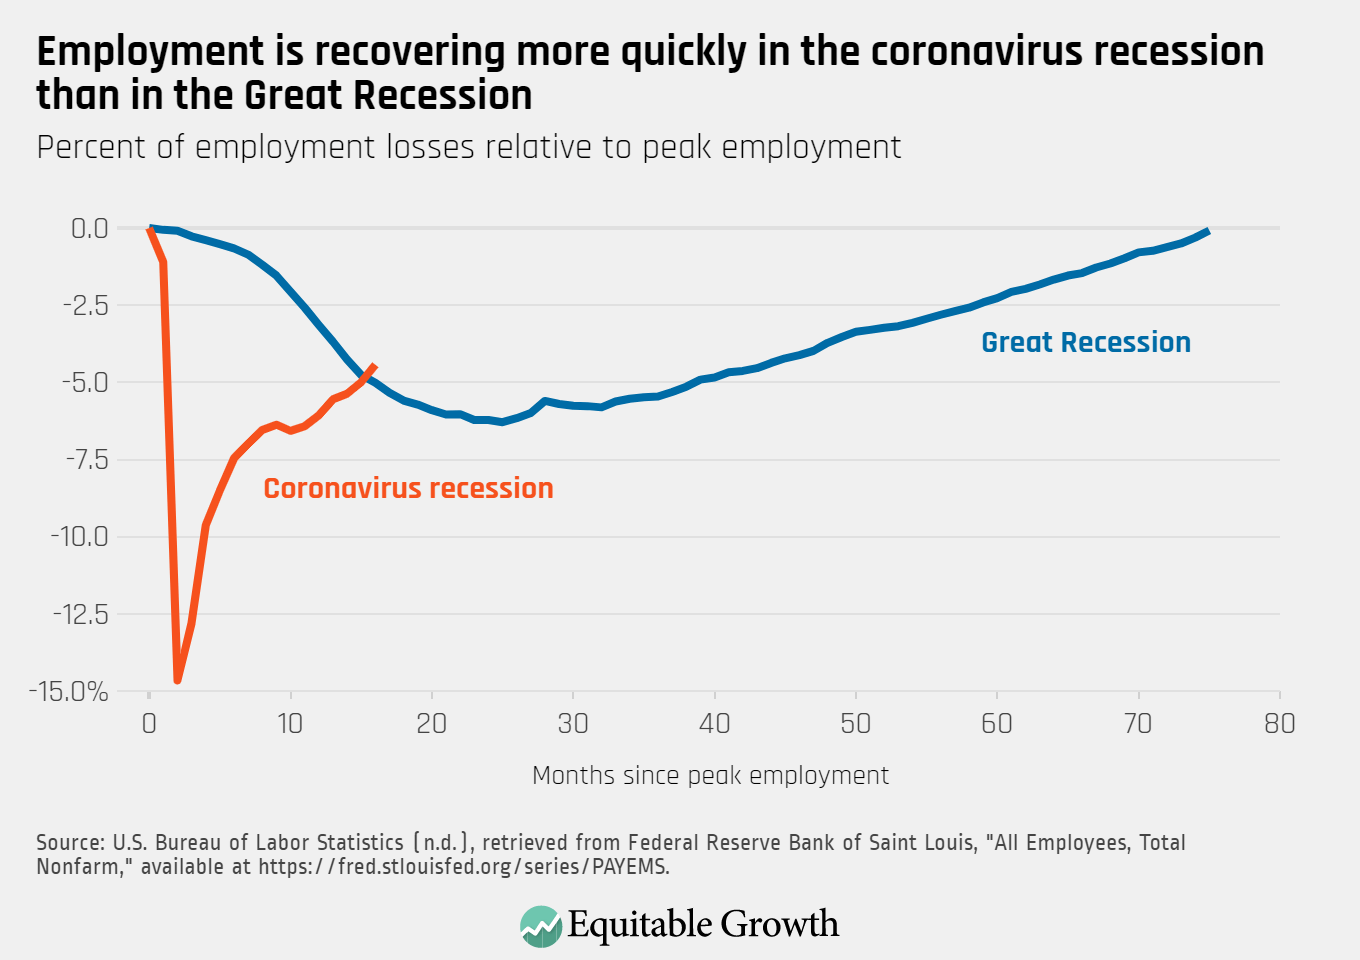
By many metrics, the U.S. labor market seems to be experiencing an exceptionally strong bounce back. As of June, the U.S. economy had recovered about 70 percent of the more than 22 million jobs lost between February and April 2020 as the coronavirus spread swiftly across the nation. This rapid recovery is in contrast to the aftermath of the Great Recession of 2007–2009, when it took until early 2013 for the economy to recover the same share of lost employment. (See Figure 1.)
Figure 1
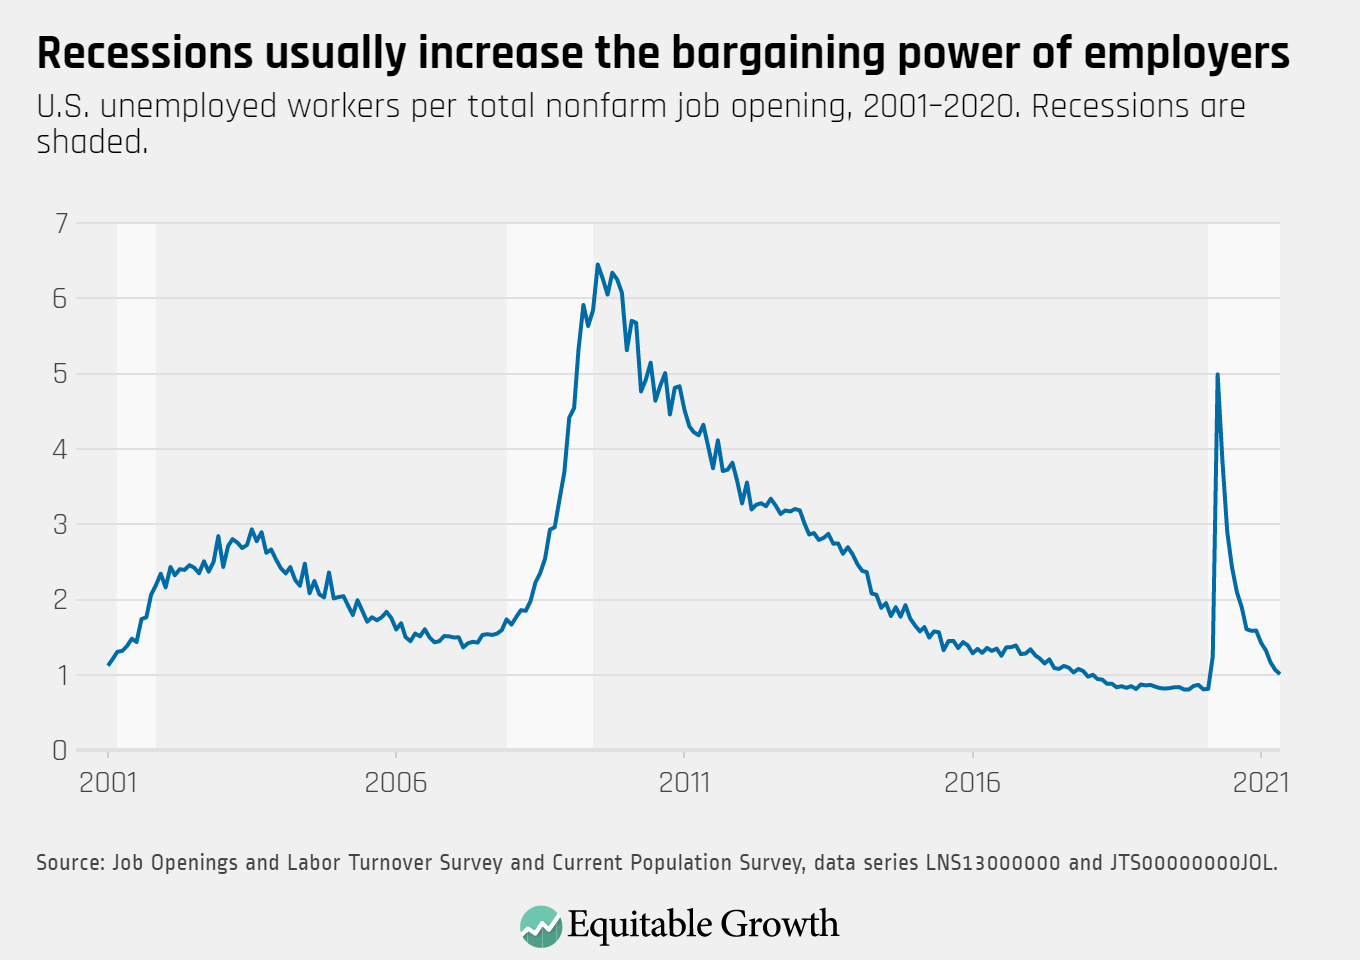
As states, cities, and localities continue to lift coronavirus-related restrictions and increase access to vaccines, sectors such as education, healthcare, and leisure and hospitality—the industries that grappled with the greatest employment losses during the first months of the pandemic—are seeing customers come back and are recovering jobs. In addition, in April of this year, both the number of workers quitting their jobs and job openings hit their highest rates since the U.S. Bureau of Labor Statistics began publishing these measures two decades ago. In May, the most recent month for which data are available, the job openings rate remained unchanged. While the quits rate declined, it remains well above its pre-pandemic level. These two dynamics suggest that many workers are feeling confident about their job prospects as demand for labor surges.
Indeed, there is now about one unemployed worker for every job opening, slightly above the 0.8 jobless workers per job opening of the tight labor market of late 2019. (See Figure 2.)
Figure 2
Wage growth might also be picking up, although the data are ambiguous at this stage. Adjusting for composition effects—shifts in the mix of workers employed—data from the U.S. Bureau of Labor Statistics show that wages and salaries rose 1 percent over the 3-month period ending in March 2021, compared to 0.8 percent in the previous quarter. And over the past few months, wage gains have been especially strong for nonsupervisory workers in lower-paying sectors such as leisure and hospitality, transportation and warehousing, and retail.
Yet the Federal Reserve Bank of Atlanta’s wage growth tracker, which follows the same workers year over year, slowed down from 3.4 percent in March to 3 percent in May. More time and data are needed to observe the wage effects of the recovery at this point.
Then, there are some economic indicators that paint a less optimistic picture. First, there could be more slack in the labor market than the headline unemployment rate suggests, so there is room for growth in labor demand, employment, and wages. The labor force participation rate, which captures the share of U.S. adults either employed or actively looking for work, has remained at roughly the same level since it fell to its lowest point in a generation last summer. And the caregiving crisis in this country is not over: The U.S. Census Household Pulse survey documents that the number of adults pointing to caregiving as the main reason for not engaging in paid work climbed from 9 million in late March to more than 11.5 million in mid-June.
Secondly, structural inequities that were present in the U.S. economy well before the onset of the coronavirus recession—and then entrenched by it—mean that some of the labor market gains are not being experienced evenly across the lines of age, race, ethnicity, and gender. For instance, between the onset of the pandemic and June 2021, Black women’s employment has shrunk 7.2 percent—a deeper fall than for any other race-gender group.
Worker power and social infrastructure investments can power the U.S. economy toward economic growth that is strong, stable, and broadly shared
All in all, the path of the U.S. economic recovery is difficult to predict, not least because the coronavirus itself continues to mutate, and vaccine access and uptake varies markedly across states and counties. But as both employers and workers adjust in the aftermath of last year’s massive economic shock, robust wage growth in some sectors and a tightening labor market represent hopeful signs that after decades of declining worker voice, deliberate policy choices can continue to help increase worker bargaining power.
A tight U.S. labor market is a necessary condition for wage growth and good job matches. But without structural policies that promote worker power, today’s temporary gains will not translate into sustainable and broadly shared growth. Workers’ gains are the foundation of a strong recovery, so worker power helps build a robust U.S. economy.
While there is a lack of evidence that rising inflation and labor shortages are a true challenge for the U.S economy, these arguments nonetheless are being used for winding down policies that help achieve a more competitive labor market and for holding back much-needed investments in the U.S. social insurance infrastructure. Yet it is these very policies—investments in the Unemployment Insurance system, in high-quality child and elder care, and in paid sick and parental leave, for example—that are a foundation for sustainable economic growth.
Winding down current investments in social infrastructure prematurely or preventing their wider deployment amounts to a giveaway to low-road employers who would otherwise be unable to compete for workers. Employers need to meet the challenge of competing for workers instead of being handed options to take advantage of them.
Perhaps most immediately, reports that some employers are having trouble finding and hiring workers are driving states’ decision to opt-out of pandemic-induced and federally funded Unemployment Insurance expansions prior to their official expiration in September. The premature withdrawal from these programs, however, both hurts already-vulnerable workers and is unlikely to have any discernible effect on employment.
A recent survey by Indeed Inc., a popular job search platform, finds that among unemployed workers not urgently looking for jobs, fear about the ongoing coronavirus pandemic, security that stems from a spouse being employed or a financial cushion, and care responsibilities are much more commonly cited reasons for not engaging in an urgent job search than UI payments. In Missouri, officials say there has not been an increase in job applications since the state announced it would cancel the extra $300 in weekly benefits, which ended on June 12.
And arguments that quickly rising wages are both a symptom and a consequence of higher Unemployment Insurance benefits overlook important trends in the U.S. labor market. Indeed, relative to the previous two recessions, wage growth so far this year is not unusually strong. Particularly fast wage growth in the leisure and hospitality industry could, in part, reflect a return to the pre-pandemic trend or, an analysis by the Economic Policy Institute finds, the return of tipping.
More broadly, fears over so-called work disincentives ignore the evidence that worker power and social infrastructure programs promote economic efficiency. Economists Sandra Black at Columbia University and Jesse Rothstein at the University of California, Berkeley, for instance, propose that when workers cannot access healthcare or Unemployment Insurance benefits, the threat of financial hardship means they are more likely to remain in jobs that might not be a good match for them—a dynamic that can depress productivity and overall wage growth. During the COVID-19 crisis, income support from Unemployment Insurance sustained consumption. And analysis from the New York Federal Reserve Bank suggests that direct payments boosted the U.S. economy as well.
Disruptions to the U.S. labor market are an opportunity to achieve sustained worker power and economic growth
To ensure the U.S. labor market is competitive and the economy grows, the U.S. economy needs policies that ensure robust labor market protections, strengthen our system of income supports, invest in care infrastructure, and institutionalize worker power. Lifting the federal minimum wage, which has been stuck at $7.25 per hour since 2009, would boost pay for workers at the bottom of the income ladder and likely benefit workers of color and women of color in particular.
Similarly, for there to be a real restoration of workers’ bargaining power, it should also be easier for workers to join and form unions. There should be stronger protections for pro-union workers, and the right to organize and bargain collectively should be expanded to those who are currently excluded from many labor protections, such as independent contractors and agricultural and domestic workers. Reports that President Joe Biden plans to sign an executive order to ban or limit noncompete agreements—contracts that limit workers’ ability to switch to better, higher-paying jobs—would certainly be an important step toward a more dynamic labor market.
During the COVID-19 crisis, we relied on Band-Aid fixes to our nation’s income support programs, which helped prop up the economy during an unprecedented economic shock but do not address the shortcomings which prevent these programs from achieving their full potential to support the economy. Exclusionary eligibility requirements, application processes that are purposefully difficult to navigate, and insufficient benefits in programs such as Unemployment Insurance, the Earned Income Tax Credit, and the Supplemental Nutrition Assistance Program both hurt individuals and constrain economic growth and stability. Research shows that these shortcomings disproportionately affect Black workers. For instance, states where a larger share of the population is Black tend to have lower levels of benefits under the Temporary Assistance to Needy Families than those where a smaller share of the population is Black.
Finally, to ensure that people with caregiving responsibilities can fully participate in the labor market, we need adequate care infrastructure. This means introducing a new federal income support program—paid family and medical leave—which research indicates would increase labor force participation of the current generation of workers and strengthen the human capital of the next. It also means investing in a child care system that meets the needs of all working people with children and strengthening the provision of community-based services and supports for older adults and people with disabilities.
Far from being a threat to the current economic recovery, stronger labor market protections, improved income support programs, more robust care infrastructure, and greater worker power would help ensure that economic growth in the post-pandemic economy is strong, stable, and broadly shared. Rather than repeating the policy mistakes made during the aftermath of the Great Recession—when insufficient stimulus and austerity politics based on ideology instead of evidence translated into a slow jobs recovery and years of stagnant incomes for low- and middle-income families—U.S. policymakers should strengthen the social insurance and income support programs that protect the entire economy, power greater worker productivity, and set up workers for success now and into the future when another recession inevitably arrives.
After a decade of below-target rates of inflation and the widespread fear of a Japanese-style prolonged economic stagnation with low inflation and zero growth, the incipient economic recovery in the United States from the coronavirus recession is suddenly turning the tables on the debate about inflation.
In May 2021, the Consumer Price Index registered inflation running at 5 percent, the highest reading in a decade for this broad measure of prices—so high that some observers worry about strong and sustained inflation and reference the stagflationary period of the 1970s. At the same time, the Federal Reserve is largely downplaying these concerns, so much so that in late June, Fed Chair Jerome Powell argued before Congress that “it is very, very unlikely” that the United States will face strong inflationary pressures going forward.
Prolonged periods of high inflation do have direct and immediate effects on the macroeconomy and also the potential for more subtle effects of further increasing economic inequality and crimping more sustainable and more equitable growth. Indeed, because many low-income and middle-class households, including many households of color, spend most of their income over the course of their everyday lives, prolonged price increases would affect them more than wealthier households, which save part of their income in real assets whose returns are shielded from inflation.
So, ultimately, what should policymakers really expect to happen to inflation over the next 2 to 5 years? The answer is important, as the Biden administration and the U.S. Congress debate the merits of the proposed infrastructure packages to address fragilities in the U.S. economy and move it toward more stable and sustainable economic growth.
Before focusing our discussion on the plausible and implausible drivers and effects of inflation going forward, we need to stress that the recent 5 percent inflation rate appears much less concerning once we account for what economists call the base rate effect—the price level 12 months ago, in the midst of a pandemic recession in which demand was artificially low due to lockdown measures and inflation was unusually depressed. As this base rate effect vanishes over the next few months—due to the sharp drop in the price level early in the recession partially reversing in the second half of 2020—then, all else being equal, policymakers should expect more moderate Consumer Price Index inflation readings going forward.
But there still remain four very relevant potential drivers of inflation over the next 2 years:
Demand pressures
Supply chain disruptions
Labor market pressures
Inflation expectations
We’ll examine in this column the extent to which these four factors might or might not be relevant in the current situation.
Demand pressures
Inflation can result when demand for goods and services outstrips suppliers’ ability to produce the desired goods and services to such an extent that permanent price increases are needed to bring the market to a new equilibrium. These dynamics, at first glance, seem to fit the economic recovery from the coronavirus pandemic, during which many suppliers were forced to shut down and needed time to bring production back to normal levels. But those supply chains are now recovering.
Demand pressure was also seemingly further fueled by fiscal and monetary policy interventions aimed at alleviating the most immediate negative impacts of the pandemic and resulting recession. Direct state and federal transfers in the form of direct payments to U.S. families, extended Unemployment Insurance, and emergency supplemental UI benefits, among other recession-fighting policies, ensured that households in which the breadwinners suddenly lost their jobs could maintain, at least in part, their purchasing power and repay their debts.
Yet these fiscal and monetary pressures were one-off interventions. A large majority of households might have received income transfers even when they were not facing large drops in their disposable income based on the high income thresholds used to target the program, such as a joint income of more than $160,000 for married couples. Paired with enhanced precautionary savings motives and limited opportunities to spend on leisure and travel during the pandemic, U.S. households’ savings did surge from a rate of 8.3 percent in February 2020 to 33.7 percent in April 2020 and 27.7 percent in June 2021.
This accumulation of higher savings, paired with new spending opportunities and the reopening of the U.S. economy, made the scope for demand pressure very concrete. Indeed, new car and home sales are at their highest levels since before the Great Recession of 2007–2009.
The ultimate question is whether these demand forces are a substantial concern in terms of inflation over the next 2 years. We find it unlikely. Whereas demand pressure will certainly impact prices in the short run, the stock of household savings accumulated over the past year and a half is limited, and suppliers will be able to adjust production to scale in a few months. What’s more, the delayed spending during the pandemic was primarily for services, rather than durable goods, which means the economy can only make up so much lost ground on delayed services spending.
Overall, then, there is no compelling reason to expect a long-lasting demand pressure on prices.
Supply chain disruptions
Moving to the supply side of the U.S. economy, inflation can also arise when firms experience increases in the costs of production—for example, of their intermediate inputs—or those costs that firms often pass onto their customers depending on pricing strategies and profit margin considerations. Global supply chains, whereby crucial components of finished goods are provided by suppliers around the world at greatly reduced costs, have been on the rise over the past several decades but were severely disrupted by pandemic-related transportation restrictions and the shutdown of production sites in response to the pandemic-induced public health crisis. This severely impacted the cost of outsourcing through global supply chains and hence put upward pressure on consumer prices.
For instance, car manufacturers currently face severe bottlenecks in supply chains due to the shortage of semiconductors, which increase their input costs and pressure them to increase the consumer prices of their finished goods. Another example is medical supplies that are largely produced in Southeast Asia, which was largely shut down during the early parts of the pandemic, resulting in stock shortages and price increases.
Similar to the demand pressures discussed above, though, there is little reason to believe that supply-side disruptions will last beyond the time when global supply chains will again be fully operative. Therefore, we do not see how supply chain disruptions might impact inflation in the medium to long term.
Take the price of lumber. Due to the increased demand for construction, timber prices almost doubled in the first half of 2021. Many observers argued that we would face sustained price pressure for lumber and other commodities. Yet, as of June 2021, the price of timber is pretty much back to its January 2021 level. Similarly, while the price of financial contracts for Crude Oil WTI futures—the most actively traded crude oil contract—is at levels previously seen in 2018, there is no reason to believe that prices will keep going up in the medium run.
Labor market pressures
Another way through which costs of production for firms can increase is through higher wages for workers. Of course, higher wages will ensure that consumers’ purchasing power is sustained, but waves of wage increases could be inflationary. So, let’s look at the details.
With demand picking up across the U.S. economy as it reopens, many businesses are starting to increase their hiring. Total unfilled vacancies have reached their highest level since 2000. At the same time, the overall U.S. labor market still has a substantial amount of slack—that is, a large amount of workers who have not yet returned to the workforce. The June 2021 employment-to-population ratio stands at 58 percent, recovering from a low of 51.3 percent in April 2020 but still substantially below the pre-pandemic level of 61.1 percent in February 2020.
Moreover, the pre-pandemic level was still below the employment-to-population ratio before the Great Recession of 2007–2009. Hence, the U.S. labor market is still a long way off from a full recovery and has ample slack to absorb additional labor demand, despite the unemployment rate decreasing from 14.8 percent in April 2020 to 5.8 percent in May 2021.
This latter point is important because macroeconomists typically argue that slack in the economy affects realized inflation due to the Phillips curve—the relationship between inflation and the extent to which the resources in the economy are utilized. Ample slack implies little price pressure.
Recent evidence indicates a flatter Phillips curve, which means that even if the economy were running at full capacity, there is little chance for sustained inflationary pressure to materialize. At the same time, we also observe that the pandemic resulted in a wave of early retirements alongside many workers who are not willing to work in contact-intense industries because of health concerns. This reduction in labor supply can result in temporary labor shortages and higher hiring bonuses and wages. These effects can result in higher price levels—for example, for restaurants—but they are unlikely to result in sustained inflationary pressures because of the overall amount of slack in the U.S. economy.
Inflation expectations
Expectations are a crucial determinant for virtually all decisions consumers make in their daily lives, such as savings-consumption choices, wage-bargaining decisions, and investment choices. Expectations matter for inflation because if consumers think prices are going to rise in the future, then they are more likely to take advantage of what seem like discounted prices today—behavior which itself bids up prices, leads to calls for higher wages, and creates a self-fulfilling feedback loop.
The Federal Reserve focuses on core inflation—overall inflation excluding volatile price series such as groceries and energy—because core inflation tends to better predict sustained inflationary pressures. The Fed also assumes that households have well-anchored inflationary expectations close to their annual target of 2 percent, on average. By contrast, recentresearchshows that households think about inflation in a very different way than what the Fed assumes.
Rather than focusing on the change in prices of an overall consumption basket and weighting those price changes by their expenditure shares, consumers tend to think about the prices of concrete goods and services they face in their daily lives. In particular, most consumers focus on the price changes of salient goods, such as gas, and the price changes of goods they purchase frequently, such as groceries.
What’s more, consumers tend to assign a larger weight to price increases, relative to similar-sized price decreases, when forming their inflation expectations. And these sources of divergence between perceived inflation and official inflation measures are more relevant for women, who tend to be more exposed to grocery prices than men due to traditional gender roles.
Now, with demand picking up, it is evident there is a substantial increase in gas prices at the pump and highly volatile grocery prices, both of which are transmitted into a large spike in household inflation expectations. The expected median inflation rate 1 year from now, as reported in the New York Fed Survey of Consumer Expectations, hit 4 percent in May, the highest number on record.
The median, however, masks a long right tail—statistical parlance for the existence of households with expectations substantially above the median—with average expected inflation across all U.S. households being substantially higher. The average number also masks substantial heterogeneity across demographics. The within-group average for the oldest age group is an inflation rate of 4.8 percent, 1.6 percentage points higher than for the lowest age group. Moreover, those with lower levels of education, on average, expect an inflation rate of 5.6 percent, 2.2 percentage points higher than the expected rate for the college-educated.
Then, there is recent research on what is known as the Euler equation, which explains why there might be some additional, but temporary, price pressures, according to a NBER working paper co-authored by one of us and also a forthcoming working paper in the Review of Financial Studies co-authored by both of us and Daniel Hoang at the Karlsruhe Institute of Technology. But to the extent that heighted inflation expectations result in increased demand pressure in the short run, more permanent price pressures might only occur if the U.S. household sector demanded higher wages due to heighted inflation expectations, which we haven’t seen materializing in recent decades of low and stable inflation and which would require sustained pressure to make up for mostly stagnant wages over the past several decades.
Conclusion
Taken together, the four highly debated factors that might influence inflation in the coming months do not appear to imply sustained inflationary pressure in the medium to long term. Hence, we do not see the need for the Federal Reserve to take policy actions in the short run because of sustained inflationary pressure. But more guidance might be needed by the Fed on how to interpret their new policy framework.
Moreover, given fading inflationary pressure in the medium run, we do not see any evidence for the Biden administration to change its policy agenda because of mounting inflation on the horizon. The pros and cons of those policies should be discussed on their merits rather than on their impact on inflation, which we believe will be temporary.
— Francesco D’Acunto is an assistant finance professor at the Carroll School of Management at Boston College. Michael Weber is an associate professor of finance at the University of Chicago’s Booth School of Business.
June was a month of strong employment gains. According to the U.S. Bureau of Labor Statistics’ latest Employment Situation Summary, the economy added 850,000 jobs between mid-May and mid-June, well above the average month-to-month growth of 540,000 jobs of the previous 3 months. The prime-age employment-to-population ratio, a measure that captures the share of U.S. adults between the ages of 25 and 54 who are employed, increased slightly from 77.1 percent to 77.2 percent.
Amid a strong report, however, the overall unemployment rate actually rose slightly from 5.8 percent in May to 5.9 percent in June, led by reentrants to the labor force and workers leaving their jobs. At 61.4 percent, the labor force participation rate is just 0.2 percentage points above where it was at this time in 2020. Adding 343,000 jobs, the leisure and hospitality sector continued to make big gains in June, but in other industries, net employment declined. Construction lost 7,000 jobs, and financial activities lost 1,000 jobs.
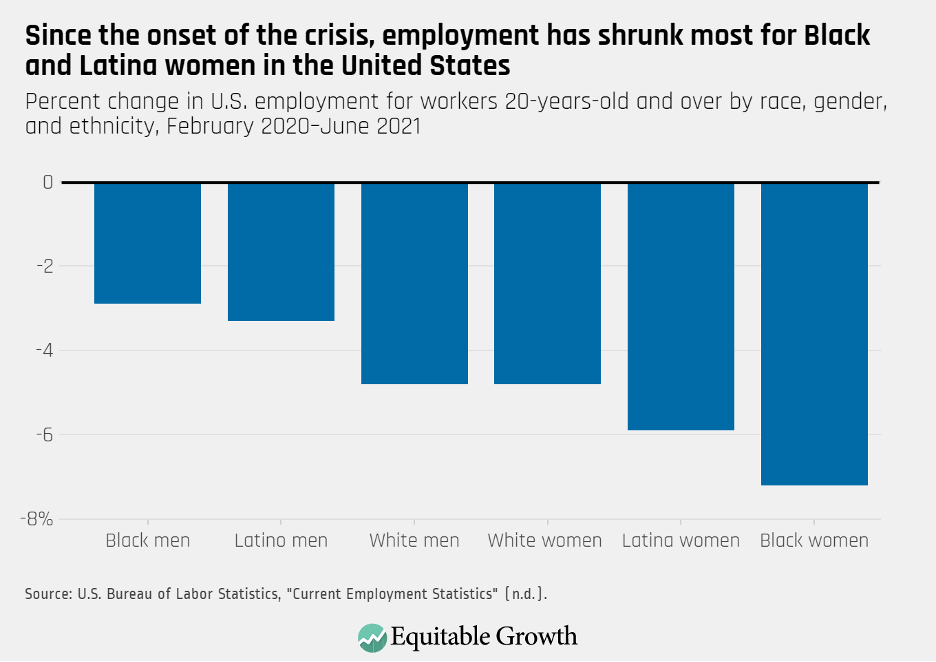
In addition, job gains continue to be greatly uneven along the lines of race, ethnicity, and gender. For Latina women, employment has shrunk 5.9 percent since the onset of the coronavirus recession. In June, 763,000 fewer Black women were employed than in February 2020—a 7.2 percent decline with respect to its pre-pandemic level. (See Figure 1.)
Figure 1
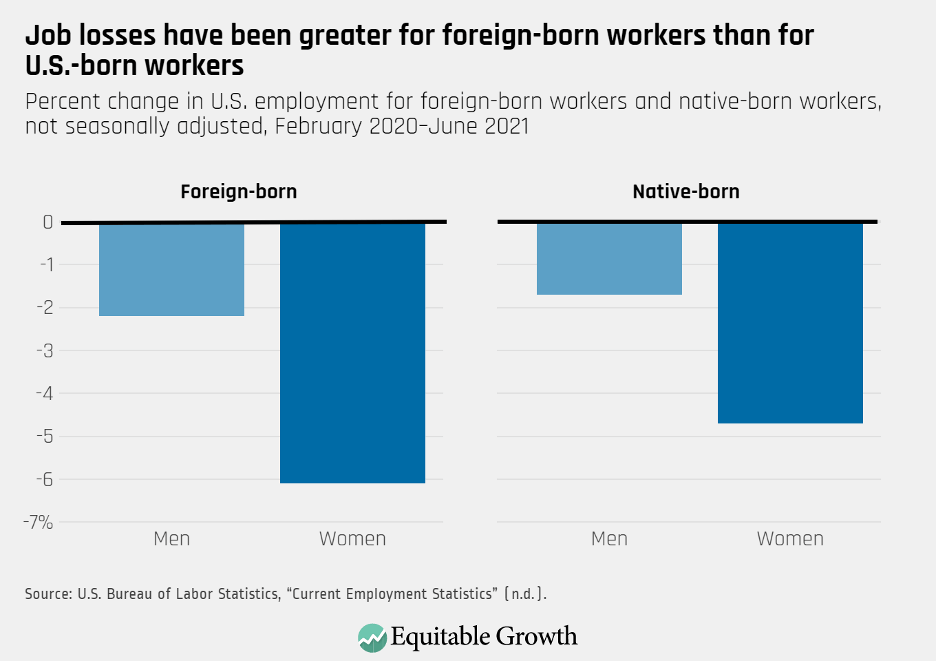
Another group that has been hit hard during the coronavirus recession is foreign-born workers in the United States. Between February 2020 and June 2021, the number of foreign-born workers employed declined 5.9 percent, compared to a 3.1 percent fall for U.S.-born workers. For both foreign- and U.S.-born workers, the decline in employment has been much deeper for women. (See Figure 2.)
Figure 2
Data from the U.S. Bureau of Labor Statistics also show that a substantial share of the decline in the U.S. labor force from 2019 to 2020 can be explained by the large number of foreign-born workers who dropped out of the labor force over that period. Strikingly, while workers born abroad only make up 17 percent of the employed or unemployed adults in the United States, they account for almost 40 percent of the overall drop in the U.S. labor force in that time period. In other words, foreign-born workers represented 1.1 million of the 2.8 million workers who stopped participating in the labor force from 2019 to 2020.
What is driving these disparate labor market outcomes? An analysis by Rakesh Kochhar and Jeffrey Passel at the Pew Research Center found that while 42 percent of U.S.-born workers held jobs which could be done remotely in February 2020, only 31 percent of foreign-born workers had the ability to telework.
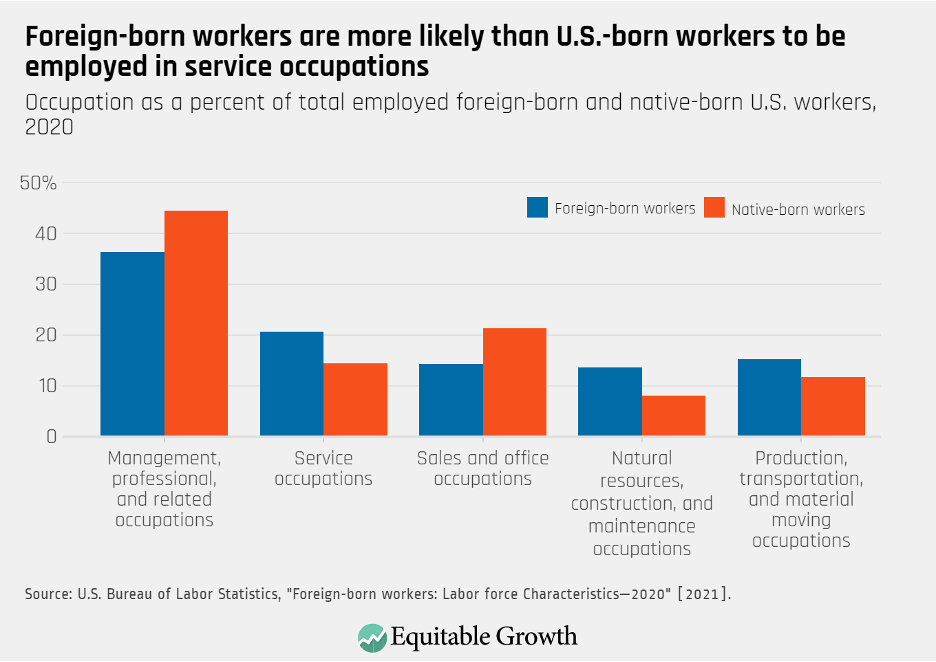
Foreign-born workers are also more likely than their U.S.-born counterparts to work in some of the occupations that were most affected as the health and economic crises sent ripples through the U.S. economy in 2020. For instance, more than 20 percent of workers born outside of the United States were employed in service occupations in 2020—jobs in food preparation and serving, for example—compared with just more than 14.4 percent of native-born workers. (See Figure 3.)
Figure 3
In addition, foreign-born workers are also overrepresented among the essential workforce. Research by Donald Kerwin and Robert Warren at the Center for Migration Studies, for example, estimates that while 65 percent of native-born workers hold jobs categorized as essential by the Department of Homeland Security—jobs in sectors such as meatpacking and poultry processing, agriculture, construction, and healthcare—69 percent of all foreign-born workers do. For undocumented workers, that number climbs to 74 percent.
Foreign-born workers also make up a disproportionately large share of the workforce in sectors in which workers are most at-risk of contracting the coronavirus—food or agriculture has been the deadliest sector, according to a study by researchers at the University of California, San Francisco. Alarmingly, workers in food manufacturing, agriculture, and other essential occupations are also among the most likely to still be unvaccinated.
As such, the fact that foreign-born workers also face barriers to accessing many worker protections and income supports that are most needed during economic downturns—not to mention amid a global pandemic—leaves them particularly exposed to economic insecurity, as well as to the risk of getting sick. Under the current Unemployment Insurance system, for instance, immigrant workers not authorized to work in the United States are not eligible for unemployment benefits.
Immigrant workers are also less likely to apply for assistance programs even when they are eligible for them. A recent analysis by the Urban Institute finds that immigrant adults and families eligible for income support and social insurance programs, such as Medicaid and the Supplemental Nutrition Assistance Program, often decide not participate out of concern that doing so will hurt a green card application process or that information-sharing will lead to the deportation of an undocumented family member.
Even as the U.S. labor market is on track to a robust and relatively quick recovery from the coronavirus recession, there are still 6.8 million fewer jobs than prior to the pandemic. Workers who have been historically excluded from labor market opportunities and protections are at risk of being left behind in the recovery. This not only diminishes the economic security of vulnerable workers, but it translates into a less competitive labor market, lost productivity, and a drag on economic growth.
More than 9.5 million workers actively looking for a job in the United States do not have one. Despite the fact that many workers and families are still struggling, as of the release of this column, 26 states have decided to slash federally funded Unemployment Insurance benefits prior to their official expiration date in early September. Rather than cutting these vital benefits, policymakers should enact permanent reforms that expand UI benefit duration, level, and eligibility, including to freelance workers, seasonal and temporary workers, gig workers, undocumented workers, and workers who do not have a recent work history.
Policymakers should also ramp up the enforcement of labor standards. Research shows that violations to labor law such as wage theft are prevalent in sectors such as agriculture, and that workers who are not U.S. citizens—and Latina noncitizen women in particular—are especially vulnerable to these violations.
Perhaps most urgently, the Occupational Safety and Health Administration—which, at the onset of the pandemic, had the lowest number of workplace inspectors in more than four decades—should be strengthened to guarantee workers are protected during the ongoing pandemic. Ensuring that all workers are protected and have access to the income supports they need is essential for a strong and equitable recovery.
Last week, the Labor and Employment Relations Association, or LERA, held its 73rd annual conference. The virtual event, which took place over four days, featured more than 350 presenters from across disciplines, focusing on workers, worker power, and the workplace in a time of division and disruption. Speakers and participants from labor, management, government, advocacy, and academia attended the more than 85 sessions, from plenaries and workshops to skill-building and networking opportunities.
The interdisciplinary approach to the conference offered a chance for Equitable Growth and our network to deepen and broaden our network of scholars, as well as raise awareness of our work with representatives of diverse interests and fields. Equitable Growth grantees and members of our broader academic community were featured in at least 15 different plenaries, panels, and paper sessions.
At a plenary session on how COVID-19 will shape the future of work, Equitable Growth Research Advisory Board member and economics professor at the Massachusetts Institute of Technology David Autor discussed how labor markets have been and will continue to be affected by the coronavirus pandemic and recession. He predicted a greater shift to teleworking, but also cautioned that these benefits will be unequally distributed, with high-wage, higher-educated, and urban workers more likely to be able to continue working from home.
At another plenary session, on addressing the challenge of racial equity and justice in the workplace, Darrick Hamilton, an Equitable Growth grantee and Henry Cohen professor of economics and urban policy at the New School, emphasized the need for a redefinition of what constitutes economic well-being in the United States, a recognition of the expanded racial wealth gap and occupational segregation amid the coronavirus pandemic, and a decoupling of labor policy from industrial and trade policy.
At a panel session on unequal workplace bargaining power and policy solutions to rebalance this dynamic, Equitable Growth grantee and professor of economics and international and public affairs at Columbia University Suresh Naidu discussed evidence on employer wage-setting and how raising the minimum wage can have a neutral effect on employment.
In the same panel, Alexander Hertel-Fernandez, an Equitable Growth grantee and now the U.S. Department of Labor’s deputy assistant secretary for research and evaluation, examined new research on the role of workplaces as civic spaces, allowing workers to interact with peers who share different views and learn new skills that translate to civic participation. Hertel-Fernandez’s research also explores how unions can get involved by providing opportunities for civic education, training, and skill-building.
A panel chaired by Equitable Growth grantee and Harvard University’s Daniel Schneider featured Director of Family Economic Security Policy Alix Gould-Werth as a discussant and several grantees who presented research. The panelists highlighted their findings on how workers have weathered the coronavirus pandemic and recession, including the disparate impact on workers of color, the consequences of unemployment and impact of Unemployment Insurance on service-sector workers, and the effects of unpredictable schedules on workers amid COVID-19 public health restrictions.
The Washington Center for Equitable Growth also organized four sessions for attendees with participation from staff and network members, as well as non-network experts. Panelists and speakers included both well-established and early career scholars from across disciplines and demographic groups typically underrepresented in economics and social sciences, tied together by the goal of fostering an equitable economy.
A panel session on racial and regional inequality chaired by Equitable Growth Labor Market Policy Analyst Kathryn Zickuhr featured grantee Robert Manduca of the University of Michigan, Chris Becker of Stanford University, Jaimie Worker of the Economic Policy Institute, and Zoe Willingham of the Center for American Progress. Manduca highlighted two important yet alarming trends in the United States: lack of progress in the reduction of racial economic inequality and growing geographic inequality between U.S. regions. Becker then explained how politicians use racist rhetoric in speeches about economic issues, which further entrenches racist policy. Worker discussed how preemption of pro-worker ordinances in the South holds back progress for Black workers, workers of color, women workers, and low-income workers. And Willingham brought up the diversity of rural communities and why researchers must adopt a racial justice lens when studying rural poverty.
In a panel session on worker surveillance and workplace control, Zickuhr presented research on how surveillance harms workers and what this means for policy solutions. She was joined by Alexandra Mateescu of the Data & Society Research Institute, who detailed her research on worker monitoring schemes in the domestic care industry; Luke Elliott-Negri of the City University of New York Graduate Center and a 2020 Equitable Growth grantee, who spoke about workplace collective action in platform businesses such as Instacart; and Equitable Growth grantee Jasmine Hill of Stanford University, who covered workers of colors’ challenges navigating the labor market in the information age.
Equitable Growth’s Director of Labor Market Policy Kate Bahn chaired a panel session about research on monopsony, labor market concentration, discrimination, and wage-setting norms in the United States. Bahn presented her co-authored policy report on racial and gender wage discrimination and U.S. worker exploitation; University of Pennsylvania’s Ioana Marinescu’s essay on boosting wages in noncompetitive labor markets, published recently in Equitable Growth’s Boosting Wages for U.S. Workers in the New Economy; and Ellora Derenoncourt’s Equitable Growth-funded research on the spillover effects of voluntary employer minimum wages. Then, SEIU’s Ahmer Qadeer and Towards Justice’s David Seligman joined for a roundtable discussion of monopsony and workplace fissuring, and policy solutions to correct unequal labor market outcomes.
Equitable Growth also organized a panel on labor market opportunity and economic security for Native Americans chaired by the AFL-CIO’s William Spriggs and featuring research presentations by Equitable Growth grantees Randall Akee of the University of California, Los Angeles and Blythe George of the University of California, Berkeley, as well as Jeffrey Burnette of the Rochester Institute of Technology. The symposium highlighted the limited data available to study workforce participation and income security among Native Americans, which has led to a lack of research that centers the unique experience of these communities, and demonstrated that cultural awareness, additional studies, and targeted policies would foster greater economic well-being and opportunities.
This year’s conference was an important opportunity for Equitable Growth to expand our network of interdisciplinary scholars and to learn about cutting-edge research on workplace dynamics, worker power, and inequality in this unprecedented era of modern history following the coronavirus recession. The papers presented and topics discussed will certainly inform our work as we navigate the economic recovery. We look forward to exploring additional opportunities for engagement and collaboration with LERA and at future conferences.
When President Joe Biden made the case before a joint session of Congress in the spring for two new economic investment packages—a $2 trillion American Jobs Plan and a $1.8 trillion American Families Plan—the question in the minds of policymakers and the American public alike was whether this new round of investment spending would result in sustained equitable economic growth.
After all, Congress over the past year had already approved $5.3 trillion in economic relief amid the swift and steep coronavirus recession. These funds came in successive COVID-19 legislative relief packages. They included:
$8.3 billion in emergency funding, titled the Coronavirus Preparedness and Response Supplemental Appropriations Act (2020)
$192 billion for the Families First Coronavirus Response Act (2020)
$2.2 trillion for the Coronavirus Aid, Relief and Economic Security, or CARES, Act (2020)
$483 billion for the Paycheck Protection Program and Health Care Enhancement Act (2020)
$869 billion in pandemic-related spending as part of the end of 2020 consolidated appropriations bill (2020)
$1.9 trillion for the American Rescue Plan (2021)
Even with all of these aid packages, though, the U.S. labor market is far from fully recovered. What’s more, the rapid rollout of COVID-19 vaccines in the United States has been matched by quickly evolving new and more infectious strains of the novel coronavirus here and around the world. Businesses small, medium, and large are still grappling with how their customers are going to respond as the pandemic continues. And the ongoing coronavirus recession continues to lay bare the deep economic inequalities that stand in the way of a robust, equitable economic recovery that is more stable and sustainable than the halfhearted recovery that followed the Great Recession.
President Biden’s two new economic stimulus proposals will be measured by their effectiveness in addressing these immediate and long-term conditions facing the nation. One broad way to establish this benchmark is simply to look at the growth in Gross Domestic Product over the past year and projections for the rest of 2021. (See Figure 1.)
Figure 1
Growth in aggregate GDP, however, fails to disaggregate that growth by income and wealth, race and ethnicity, and other measures. Those measurements should help guide policymakers who want to ensure the economic recovery from the coronavirus recession is more equitable than the recovery from the Great Recession a decade ago. That’s why the details of the previous COVID-19 relief packages passed by Congress become so important.
So, let’s break out those details. Specifically, let’s look at three major relief initiatives: Unemployment Insurance, the Paycheck Protection Program, and direct aid to key sectors of the U.S. economy. Whether these investment programs were effective in 2020 and into 2021, and whether the continuation of these kinds of investments under the Biden administration this year and beyond keeps the U.S. economy on the path toward more equitable economic growth, may well determine just how sustained U.S. economic growth will be over the course of the next decade.
The coronavirus aid and relief programs in 2020 and 2021
When the pandemic first hit the United States, Congress provided an unprecedented amount of federal support. The financial infusion consisted of $856 billion in direct aid, $764 billion toward Unemployment Insurance, and $968 billion for the Small Business Paycheck Protection Program, though the PPP funding was delivered in two tranches, limiting its initial effectiveness. The total of this aid amounted to roughly 18 percent of annual consumer spending and, as noted in a previous study, ended too soon, while the virus was still raging and before a recovery could take hold. The boost to the U.S. economy lasted until July 2020 and as Congress adjourned for it summer recess, the United States began to again feel the suppressed pain of the coronavirus recession.
This made it clear that more aid should be administered, leading to former President Donald Trump’s signing of the December 2020 Pandemic Relief Bill. This bill provided $900 billion in federal support. Key components of this bill included the 11-week continuation of the UI benefits program, with the previous amount of $600 extra per week in emergency benefits that was in the CARES Act amended to $300 per week , as well as another round of direct payments to U.S. workers and their families.
The Centers for Disease Control and Prevention also extended eviction moratoriums to June 30, 2021. This direct relief was truly helpful as many U.S. workers and their families were being forced to choose between buying food, paying utilities and rent, and celebrating the holiday season with their families. The Paycheck Protection Program was also reopened to continue supporting small businesses as they struggled to keep the doors open and pay employees, including $310 billion in new funding.
In addition, direct aid to specific sectors of the U.S. economy, such as $61 billion to the aviation industry and $28.6 billion to restaurants, was a hallmark of the 2020 and 2021 coronavirus relief packages, but their successes were hit and miss. Analysis of the Paycheck Protection Program demonstrated that economic relief was not distributed equitably to small businesses. President Biden’s American Rescue Plan fixed some of those problems by ensuring the next round of PPP funding was more equitably distributed. That plan also included more extended UI benefits, more PPP loans, and the expanded Child Tax Credit.
The Organisation for Economic Co-operation and Development, however, predicts that a full U.S. economic recovery won’t happen until the third quarter of 2021, with significant drags remaining in terms of global economic growth well into next year. That’s where President Biden’s American Jobs Plan and American Families Plan come into the picture for policymakers.
The American Jobs Plan and American Families Plan
Will President Biden’s American Jobs Plan and American Families Plan lay the foundation for more sustained and equitable economic growth? These two economic investment packages are each large and complex. Examining several key elements within them, however, provides a window into their anticipated effectiveness. By taking a look back at what worked in the prior coronavirus relief packages, we can see specific evidence emerge as to what may be the best solution regarding new and long-term investments.
Let’s first examine the Unemployment Insurance program. Extended Unemployment Insurance and additional pandemic-related unemployment benefits for gig workers certainly are having their intended macroeconomic impact, boosting consumer spending and keeping workers engaged in looking for the best jobs as employment options return, as is now happening across various sectors of the economy. President Biden’s American Families Plan makes provisions for continued UI support as we near the September 5, 2021 expiration date. Should this plan get enacted by Congress more or less as proposed, one key addition should be a reformed UI program that looks to enact so-called automatic stabilizers, which proactively prepare the U.S. economy for the inevitable next recession.
Another key element of the American Rescue Plan was the expanded Child Tax Credit, which will start to be distributed monthly to families beginning in July, yet this is not envisioned as a permanent program in the Biden administration’s latest two plans. Congress should consider making these tax credits to families permanent, which would go a long way toward making the CTC program more effective at lowering the U.S. poverty rate and ensuring new generations of U.S. workers are more productive.
Other key programs in the American Jobs Plan include the Neighborhood Homes Tax Credit, the Community Revitalization Fund, and the Unlocking Possibilities Program. Efforts to disaggregate data by income, race, and ethnicity will also be important to understand the composition of the recovery and inform future policymaking efforts. These are just select examples of programs in President Biden’s two 2021 economic development plans that bear watching for their expected efficacy in creating a more equitable and sustained economic recovery this year and into 2022.
Conclusion
The coronavirus recession exposed several ways in which policymakers can invest in meaningful and sustained equitable economic growth. Even after the current pandemic subsides, the United States as a nation is not at all immune to pandemics or other possible future financial catastrophes. The one immediate lesson learned after spending $5.3 trillion in coronavirus aid and relief over the past year is that Congress can act quickly and in a bipartisan fashion when a crisis strikes. Now, policymakers in Congress need to consider the medium- and long-term investments in President Biden’s new economic plans with equal vigor. Policymakers should above all pay attention to how those investments foster broad-based and sustained economic growth well into the 2020s.
The recovery in U.S. employment picked up some steam last month. According to the latest Employment Situation Summary by the U.S. Bureau of Labor Statistics, the U.S. economy in May gained 559,000 jobs, compared to the unexpectedly low 278,000 jobs added in April. While still 3.3 percentage points below its pre-coronavirus recession level, the share of adults between the ages of 25 and 54 with a job—the prime-age employment-to-population-ratio—rose from 76.9 to 77.1. But the share of adults either employed or actively looking for a job declined slightly, with the labor force participation rate going from 61.7 percent in April to 61.6 percent in May. Troublingly, the U.S. labor force participation rate remains at roughly the same level as in June of last year.
A closer look at the report shows how different groups of workers are experiencing the U.S. labor market. The jobless rate for Black workers fell from 9.7 percent to 9.1 percent between mid-April and mid-May, but continues to be higher than for any major racial or ethnic group. For Latinx workers the unemployment rate now stands at 7.3 percent, for Asian American workers at 5.5 percent, and for White workers at 5.1 percent. After remaining flat between March and April, the share of women who are employed climbed from 52.8 percent to 53.1 percent between April and May. For men that same number rose from 63.3 percent to 63.4 percent. (See Figure 1.)
Figure 1
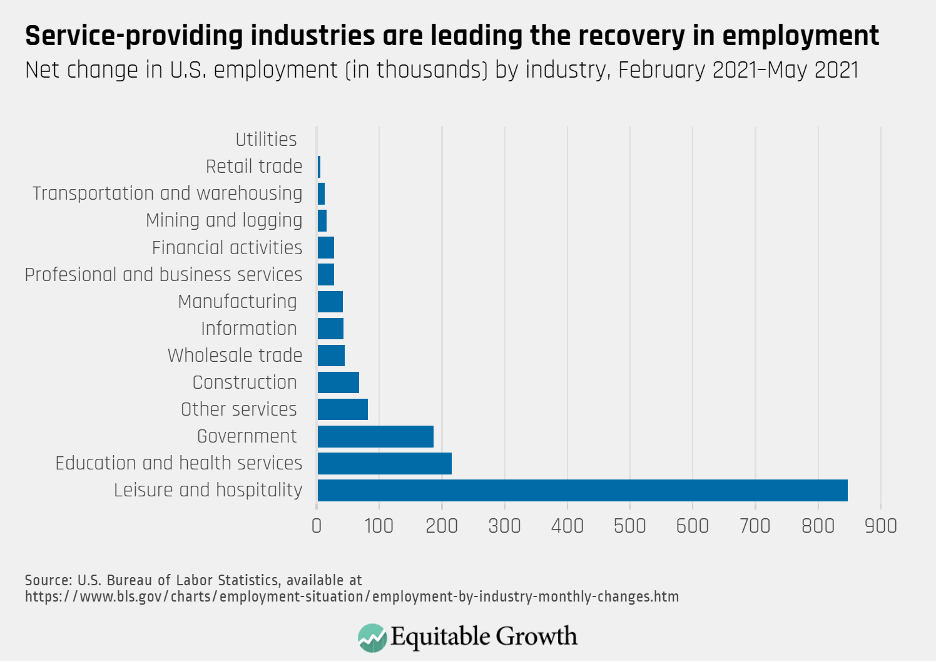
In addition, over the past few months net job gains have been especially robust in service-providing industries as the U.S. labor market makes uneven progress toward a recovery. Between February and May, the leisure and hospitality industry recovered 847,000 jobs—more than any other major sector. It was followed by education and health services, which added 216,000 jobs. Other services—an industry that includes subsectors such as personal care and repair services— added 82,000 jobs. (See Figure 2).
Figure 2
As industries that experienced the brunt of the economic shock gain some ground, it is worth understanding how the economic recovery from this recession could be different from previous ones in order to best design and implement policies that will foster a more inclusive and thus more robust recovery.
At their onset, economic downturns tend to be hardest on goods-producing sectors such as manufacturing, since consumption of durable goods tends to be especially sensitive to fluctuations in the business cycle. In other words, in bad times consumers tend to cut back on their spending of products such as cars and furniture more so than on food or services related to health or education.
Yet the coronavirus recession hit service-providing industries early and hard. This turmoil roiled groups of workers who are not usually among the most exposed to job losses at the start of recessions—namely women of color who suffered the deepest employment losses in part due to their overrepresentation in service-sector jobs. In addition, the concentration of the shock in services industries could have consequences for the progression of economic recovery based on demand effects.
Martin Bejara at the Massachusetts Institute of Technology and Christian Wolf at the University of Chicago, for example, propose that all else being equal, recessions driven by a drop in demand for services are followed by weaker recoveries than recessions driven by a shortfall in demand for durable goods. The reason is that as economic conditions improve consumers are more likely to go ahead with their plans to purchase, say, household appliances, than make up all their missing spending on services such as haircuts or dinning out. In the context of the continuing pandemic, this adds even more uncertainty to the U.S. economic outlook.
While there may be limits how much spending on services will increase to make up for the drop in demand as the economy begins to recover, some economists argue that as COVID-19 vaccination rates increase and more businesses reopen, pent-up demand for travel, entertainment, and postponed health care are helping drive a bounce back. In addition, research shows that policies such as expanded Unemployment Insurance benefits allowed many workers to keep up their spending and protected the overall economy from a shortfall in demand for goods and services—a finding that highlights the need to maintain enhancements to jobless benefits and address racial disparities in benefit take-up.
The upshot: Directing stimulus to those hardest hit in recessions can reduce the overall shock of a downturn, and Unemployment Insurance is an effective tool for targeted aid to those who have lost income.
Conclusion
Between February and April of last year the U.S. economy lost more than 22 million jobs. As of last month, the labor market continues to be at a 7.6 million deficit with respect to February 2020—a deficit that is even larger when comparing it to where the labor market would be absent the recession. In addition, there is evidence that there is more slack in the U.S. labor market than top-line statistics suggest, with new research by economists at the San Francisco Federal Reserve Bank finding that without accounting for the unique circumstances accompanying this recession, the metrics most often used to measure the health of the U.S. economy could be painting an overtly optimistic picture.
Despite evidence that millions of workers are still struggling, largely overstated fears over potential labor shortages led many state governors to prematurely opt-out of federal Unemployment Insurance programs. As of the release of this column, 25 states have decided to slash the additional $300 in weekly jobless benefits before they expire on Labor Day in September. Most of these states are also withdrawing from the Pandemic Emergency Unemployment Compensation program, which extends the number of weeks workers can claim benefits for, and from the Pandemic Unemployment Assistance program, which also expires on Labor Day, meaning that many workers who are self-employed, cannot work due to COVID-19-related reasons, or have limited work histories will stop receiving UI benefits altogether.
This is all why policymakers and analysts should be cautious when claiming the U.S. economy has fully bounced back—overstating the health of the labor market can lead to policies that hold back a strong and equitable recovery.
The onset of the coronavirus pandemic and the rising death toll from COVID-19, the disease caused by the virus, initiated an unprecedented decline in consumer spending in the United States, dwarfing the effects of any previous recession. Understanding what is driving consumer spending—and, in particular, the effects of lockdown policies—is crucially important in designing policies for a full economic recovery, as consumption is two-thirds of Gross Domestic Product.
Yet policies that maximize GDP and employment do not maximize welfare because crowded stores and restaurants can cause widespread COVID-19 infections in customers and workers, leading to further outbreaks. As many countries and states have learned by hard experience, a premature reopening is a recipe for a dramatic rise in cases, hospitalizations, and deaths. The very purpose of restrictions on retail and restaurant activity is to decrease visits, and thus spending decreases. As such, the declines in consumer spending that restrictions bring are not the costs of these policies; in fact, they are the benefits.
In our new working paper, I and my co-author, Raissa Dantas, a Ph.D. candidate in economics at the University of Illinois at Chicago, analyze the causes of the decline and rise in retail spending in the United States—a striking decline of almost 20 percent 2 months after the crisis, followed by a rapid recovery and then a transition to a slow increase. (See Figure 1.)
Figure 1
We find equally striking results about the interplay between fear of COVID-19 and restrictions on consumer behavior. In the early weeks of the pandemic, spending declines were driven fully by fear of catching the coronavirus, and not by restrictions on consumer behavior such as stay-at-home orders. In April and May, however, fear of COVID-19 declined while restrictions on nonessential shopping remained in place. We find the retail and restaurant spending restrictions caused substantial declines in spending for the categories directly affected by restrictions, such as nonessential in-store retail items and full-service in-restaurant dining. Even in recovery, consumption remains depressed, compared to previous recessions.
These results show that the restrictions put in place by governments had their intended effect. The restrictions successfully deterred a large majority of consumers from behavior that would have been beneficial to a superficial measure of welfare—aggregate GDP—but which would have led to the increased spread of the coronavirus and COVID-19. Two studies by the Centers for Disease Control and Prevention and Johns Hopkins University demonstrate that allowing indoor dining is associated with a substantial rise in COVID cases and that stay-at-home orders are effective in reducing COVID-19 infections.
In our working paper, we analyze the effects of business restrictions on consumer spending using data from Earnest Research, a company that analyzes spending data from a panel of 6 million U.S. households. The data allow for a detailed look at how consumers are spending their money. Importantly, the panel distinguishes between spending that is done in-store, and will therefore be affected by stay-at-home orders and retail shutdown policies, and online/essential retail, which is not affected by the laws.
To summarize our findings, we present a case study of four states in Figure 2 below. Two of them—Illinois and Massachusetts—instituted retail shutdowns, while two others—Nebraska and Arkansas—did not. At the beginning of the lockdown, nonessential in-store spending fell close to zero in all four states, even those that did not institute shutdowns. In these early weeks, the fear of COVID-19 was the driving force behind the decline in retail spending, since spending declined by similar amounts even in states without lockdowns. After a few weeks, however, spending sharply increased in the two states without lockdowns, Nebraska and Arkansas, while spending remained near its lows in Illinois and Massachusetts, where lockdowns were still in effect. (See Figure 2.)
Figure 2
We find that when states reopen, the effect on consumption is immediate, with sharp and large increases in spending. The raw data thus suggest that in the early weeks of the spread of COVID-19, spending declines were mainly driven by fear of the disease, and the restrictions put in place by governments were not “binding,” meaning that even in their absence, spending would have decreased. By mid-April and May, however, the fear of COVID-19 had somewhat subsided, and the restrictions on consumer behavior were binding constraints and, when lifted, caused large increases in retail spending.
The restrictions on nonessential in-store spending did not simply shift spending into other retail categories. Retail shutdown policies are associated with a 10 percent decline in aggregate retail spending and restaurant shutdown policies with a 9 percent decline. The recovery in retail spending displayed in Figure 1 is thus partially driven by the end of the lockdowns. We estimate that 34 percent of the trough-to-peak recovery was caused by retail reopenings and 15 percent of the trough-to-peak recovery in restaurant spending was due to restaurant reopenings.
As the coronavirus vaccines continue to proliferate and consumers become comfortable dining indoors, shopping in stores, and going to movies, spending will continue to recover, and it is likely that the remaining constraints on restaurant and entertainment capacity will become binding. In making reopening decisions, then, state and local governments must not chase the false idol of aggregate GDP growth and unemployment policies that punish workers, but rather, should wisely choose public health and long-term prosperity.
The Biden administration has prioritized fighting the coronavirus pandemic and resulting recession through vaccinations and supporting those who cannot work through expanded federal unemployment benefits and economic recovery payments. This is the way forward as scientists and vaccine manufacturers continue to assess the threats to public health posed by new variants of the coronavirus. These priorities must continue.
A view of Goldman Sachs Tower, August 23, 2017, in Jersey City, New Jersey.
Overview
If you are an analyst following Wall Street, things are looking pretty bright these days. The S&P 500—an index of 500 major publicly traded companies in the United States and a benchmark for gauging the health of the U.S. corporate sector—is up more than 80 percent since its low in March 2020 during the onset of the global pandemic.1 Companies in the index have added $50 trillion worth of value during the course of the lockdowns and recovery, a rally not seen since the post-Great Depression period 90 years ago.2
Meanwhile, how Main Street is faring is a bit more complicated. While the U.S. economy added a healthy 916,000 jobs in March 2021 and the unemployment rate fell to 6 percent, there are still 8.4 million fewer jobs than before the pandemic.3 And job gains during the incipient recovery are driven predominately by the strength of employment for White workers. Black men are still experiencing an unemployment rate of 9.6 percent—almost double that of White men—and Black women actually saw their unemployment rate slightly increase to 8.7 percent in March.4
What’s more, this disparity comes at a time when Black women have already dropped out of the workforce at staggering rates. Their employment-to-population ratio dropped 6 percentage points since just before the pandemic, double the rate of White women’s withdrawal from the workforce.5 Latina women face a similar set of challenges as Black women, with the unemployment rate for Latina women at 7.3 percent and the employment-to-population ratio also still far below pre-pandemic levels.6
By now, many policymakers have heard the story of the so-called K-shaped recovery.7 This describes how the fortunes of those at the top of the U.S. wealth and income ladders can be so disconnected from the experiences of U.S. workers and their families, especially those struggling the most in our economy. Even as U.S. policymakers’ economic response to the coronavirus pandemic was relatively robust, compared to other countries,8 the gap between the rich and nonrich in the United States is still among the largest in the world.9
In short, even a strong rescue response can’t make up for decades of disinvestment. So, what policy choices led to the growing divide between the wealthy and the rest of us? How did U.S. policymakers enable these inequitable economic outcomes?
On April 29, a hearing of the U.S. Senate Committee on Banking, Housing and Urban Affairs explored that question, within their remit of banking and financial services: What are the mechanisms by which finance, enabled by public policy, made this the case?10 The hearing delved into the channels through which our financial markets have put the squeeze on U.S. workers, drawing on testimony from Trevon Logan, an Equitable Growth grantee and the Hazel C. Youngberg Trustees distinguished professor of economics at The Ohio State University; Heather McGhee, board chair of the advocacy group Color of Change and author of the new book The Sum of Us: How Racism Costs Everyone and How We Can Prosper Together; and Lisa Donner, executive director of Americans for Financial Reform, an organization focused on strengthening our financial system.11
This issue brief explores their testimony, alongside other evidence-based research and analysis. The brief details how the financialization of the U.S. economy over the past five decades contributed to income and wealth inequality, stifled economic growth, and exacerbated economic disparities by race and ethnicity. It then presents some policy ideas put forth by the witnesses at the hearing, including solutions to short-circuit financialization by investing in physical and care infrastructure, building worker power, ensuring strong regulation of our financial system, and improving fairness in our tax system.
How Wall Street harms U.S. workers and their families
Witnesses at the hearing on April 29 explored how Wall Street harms U.S. workers and their families through the phenomenon known as “financialization.” Financialization refers to the process by which the financial sector—banks, private equity firms, hedge funds, stocks and derivatives exchanges, and other conduits through which money flows between those who have it and those who need it—takes up a larger and larger share of the U.S. economy, fails to allocate capital to its most productive uses, and increasingly results in the hoarding of economic, and thus political, power at the top of the income and wealth ladders.
Financialization also can refer to the increasing participation of nonfinancial businesses in financial activities. General Electric Company, for example, a company most people associate with manufacturing and innovation, earned 43 percent of its profits from financial activities as recently as 2014.12
As explored in the hearing, financialization can create downstream harm for U.S. workers and their families by undermining what Sen. Sherrod Brown (D-OH), chairman of the Senate Banking Committee, calls “the dignity of work.” Sen. Brown borrowed the phrase invoked by Martin Luther King Jr. in defense of striking workers in Memphis, Tennessee, in 1968. The phrase means that all people’s labor is compensated fairly, that employment is free from exploitation and coercion, and that work—whether inside or outside the home—is respected and met with dignity.
How financialization took hold over the past 50 years
Witnesses at the hearing identified the shift to “shareholder capitalism” over the past five decades as a key framework for understanding how financialization has been operationalized. Over the past half-century, corporate leaders, influenced by the free-market economists of the Chicago School, shifted the views of the majority of financiers from the need to support jobs and the communities in which they operate to a focus on the maximization of short-term shareholder value.13 In the words of Milton Friedman in 1970, the goal of corporate managers is to “conduct business in accordance with (shareholders’) desires, which generally will be to make as much money as possible while conforming to the basic rules of the society, both those embodied in law and those embodied in ethical custom.”14
The import of Friedman’s statement is that considerations such as worker welfare, the economic health of communities, the environment, and U.S. competitiveness on the world stage were best left to policymakers and civil society leaders, with business leaders’ only obligation being the maximization of profits. This philosophy formed the underpinnings of not just a change in managerial practices but also in business education.15
The problem with this narrowing of focus on the part of corporate leaders is that policymakers—the stewards of public welfare in this ecosystem—failed to keep up, as large businesses and finance entrenched the excesses of shareholder value to harm workers. In fact, as witnesses at the hearing documented, corporate leaders themselves use their outsized economic power to influence the policymaking process in their favor, for example, by eroding the worker protections and financial system regulations established after the Great Depression. This has created feedback loops where enhanced economic power begets more political power, with workers increasingly short-changed.
How financialization shapes the U.S. economy today
How does financialization manifest itself throughout the U.S. economy today and, especially, in how policymakers measure the success of the economy?
For one, the share of income accruing to workers continues to decline. The so-called labor share of income represents the percentage of U.S. Gross Domestic Product paid out in the form of wages, salaries, and benefits and can be contrasted with capital’s share of income, which is the money made off of investments or the ownership of things. As economist Dean Baker at the Center for Economic and Policy Research points out, if the labor share of income were the same just before the pandemic as it was in 1979, the median worker’s pay would be about 4.2 percent higher than it is now.16
Financialization can decrease the labor share of income in two ways: by increasing the amount of income derived from capital and then by decreasing the amount of income derived from labor. On the first point, while factors such as technological innovation and globalization can drive up the capital share of income, financialization also plays a role, as companies increasingly earn money through financial engineering rather than investment in people. According to one estimate, financialization may have contributed to more than half of the fall in the labor share of income.17
Moreover, financialization, enabled by the gutting of worker power discussed more below, can also decrease the labor share of income by increasing the pressure on short-term profit maximization, driven, in part, by decreasing labor costs. This phenomenon is exemplified by Wall Street analysts downgrading the stock of the restaurant chain Chipotle Mexican Grill Inc. because they concluded that management had exhausted their ability to reduce hours or cut wages of front-line workers.18
Financialization also widens the disparities between people who earn their money in the financial-services industry versus workers who earn it elsewhere. Economists Josh Bivens and Lawrence Mishel at the Economic Policy Institute documented how the overall pay of financial-sector workers relative to others in the economy has risen substantially over the past decade.19 While the ratio never exceeded 1.1 percent from 1952 to 1982, it began rising and reached 1.83 percent by the onset of the Great Recession of 2007–2009.20
Likewise, research by Thomas Philippon at New York University’s Stern School of Business and Ariell Reshef at the Paris School of Economics shows a pay premium for finance workers even when multiple controls, such as education and employment risk, are used. The authors conclude that roughly 30 percent to 50 percent of the pay premium in finance is due to economic “rents,” or policy failures that allow a market to exist out of equilibrium.21
Further, the profits of financial firms comprise a greater share of all corporate profits and of total U.S. GDP. In her April 29 testimony before the Senate Banking Committee, Donner of Americans for Tax Reform presented U.S. Bureau of Economic Analysis data to show that financial-sector profits and their share of GDP have skyrocketed since the 1970s.22 (See Figure 1.)
Figure 1
And despite the growth of the finance industry, the costs of intermediation—the toll taken by financial-services firms to funnel money between savers and spenders—are about the same as they were a century ago.23
Finally, financialization can impede overall economic growth, dragging the entire global economy down. Researchers from the Bank for International Settlements surveyed international economies and found that financial booms can create “bloat” in the global economy that drags resources away from productive activities and into nonproductive trading and speculation.24 Further, according to Adair Turner, a former British banking regulator, only 15 percent of financial flows actually fund new projects and jobs in the global economy, with the rest going toward securitizing and speculating on existing assets.25
As pointed out by Color of Change’s McGhee in her testimony, the subprime mortgage crisis of 2008 is the paradigmatic example of this phenomenon, with a relatively small number of toxic mortgage loans, sold disproportionately to Black and Latinx individuals and families, able to cause a global financial crisis due to the magnifying effect of financial derivatives.26
Financialization is supercharged by policy choices
Financialization isn’t natural law or the logical outgrowth of improving technology or a changing economy. Instead, it is driven by policy choices motivated by Friedman’s ethos taking hold among economists and policymakers alike. Tax policy, for example, encourages executive compensation structures that focus on short-term gains over long-term value creation by making performance-based equity awards tax-deductible for corporations.27 Compensation in the form of unrestricted stock can encourage CEOs to pursue juicing share prices over long-term value creation, particularly as 43 percent of CEOs admit to having a planning horizon of 3 years or less.28
The swirl of tax policy and shareholder supremacy also leads to an increasing number of firms using profits to enable capital distributions to stockholders in the form of dividends and share repurchases, rather than investment in longer-term growth. Research suggests that this short-term focus encourages companies to increasingly focus on financial engineering rather than slow and steady value creation. In fact, some research suggests that capital markets actually reward companies with the highest levels of share repurchases rather than the firms with the highest growth potential.29
These phenomena are further exacerbated by the tax deductibility of interest payments on debt. This leads to firms not only privileging capital distributions over investments in their own operations and future growth, but also to relying on debt to do so. Recent data suggest that about half of share buybacks are financed by debt.30 While the Tax Cut and Jobs Act of 2017 did limit some of the deductibility of interest on corporate debt payments, the windfall to firms from reduced tax bills was met with declining business investment and tepid wage growth, even before the onset of the pandemic and recession.31
Laggard antitrust enforcement is another reason why firms are able to exercise outsized control in their markets, harming workers and their families and decreasing innovation in the broader economy. Researchers hypothesize that lax antitrust enforcement allows firms to sidestep competitive market forces as firms no longer have to invent new technologies or improve services when their market position allows them to extract monopoly profits. Common ownership by institutional investors also can lead to businesses competing less vigorously against one another.32
When combined with the legislative and judicial erosion of worker power over recent decades, these firms can easily exercise outsized control over their workers. Ohio State economist Logan in his testimony points to the coercive control exercised by firms not only via low wages but by policies such as limiting bathroom breaks or social interaction with colleagues, requiring entry-level employees to sign nondisclosure agreements that foreclose on their ability to switch jobs, and using aggressive tactics to prevent collective bargaining.33 Workers of color are disproportionately represented in jobs governed by what Logan, in his testimony, calls “factory discipline,” or the ability of managers to exercise de facto authoritarian control, underscoring the racialized harm caused by monopsonistic behavior.34
Financial deregulation also plays a role. Donner’s testimony describes the process by which Wall Street eroded bank safety and soundness protections, defeated laws governing predatory mortgages, prevented measures to bring transparency to financial derivatives markets and weakened corporate accounting and governance rules in the lead-up to the Great Recession.35 In turn, financial crises inevitably harm vulnerable communities much more than they hurt the financial sector itself. While the Great Recession wiped out almost three-quarters of financial-sector profits, the sector had fully recovered by midway through 2009.36 (See Figure 2.)
Figure 2
Meanwhile, it took a decade for wages to recover to pre-Great Recession levels.37 As Heather McGhee points out in her testimony, communities of color are most likely to suffer earliest and harshest during financial bust periods—and in the 2008 crisis, were both the targets of predatory financial behavior and the last to recover from its effects.38
Finance itself is financialized
The banking sector itself perhaps provides the best case by which to illustrate the feedback loops caused by financialization. The largest U.S. banks benefitted from record revenue in trading in 2020 and early 2021, profiting from volatility across equities, fixed income, currencies, and commodities during the pandemic and the Fed’s intervention in the markets.39 Meanwhile, loans to consumers and small businesses remained flat. Bank executives contend that weak loan demand is driving the lackluster lending volumes.40 Yet community banks have continued lending at nearly 2.5 times the rate of noncommunity banks.41
Other research evidence suggests that large bank concentration in a community can impede lending to the real economy. One study conducted during the policy response to the coronavirus pandemic finds that a small business merely being located in an area predominately served by megabanks lowered the chances of an eligible small business receiving a Paycheck Protection Program loan.42 The lack of connection between Wall Street profits and provision of credit in the real economy is particularly troubling, given the regulatory forbearance afforded to big banks by U.S. financial agencies during the pandemic recovery in the name of jumpstarting lending.43
Meanwhile, front-line bank workers themselves have been exposed to significant risk during the pandemic, protesting a lack of personal protective equipment and intense stress from having to coach customers in navigating an economic crisis.44 At the same time, bank workers’ pay remains modest, with 75 percent of bank workers earning less than $15 an hour and about a third of bank workers relying on some form of public assistance to make ends meet.45 People of color are overrepresented in front-line bank positions such as tellers and underrepresented in senior management roles.46
Lisa Donner in her testimony also pointed to the private equity industry as being at the nexus of many of these phenomena.47 Emboldened by favorable tax treatment of their debt-driven business operations and a focus on short- to medium-term value creation, private equity funds buy up floundering companies, typically increase those companies’ debt levels, and seek to minimize business costs—most notably, labor costs. Some private equity funds may bring management expertise or process improvements to the businesses they own, but some research also shows that private-equity-owned firms are more likely to default on loans related to large buyouts.48 They also are more likely to go bankrupt.49 And they are more likely to cut jobs and reduce wages than similarly situated firms with other ownership models.50
Over the past year, research also suggests that private-equity-owned businesses such as nursing homes have a higher incidence of death among residents.51 And private-equity-owned hospitals were quicker to cut practitioners’ pay and benefits at the onset of the pandemic.52
Solutions to rising financialization
Witnesses at the April 29 hearing pointed to a number of policy solutions to these challenges. The $1.9 trillion American Rescue Plan, enacted in March 2021, directed substantial aid to those suffering the most from the pandemic and the recession it created, with $1,400 direct payments, an expanded refundable Child Tax Credit, and strengthened Unemployment Insurance compensation and child care investments. All are likely to improve the lives of those affected and help grow the U.S. economy.
Further efforts proposed in the $2.3 trillion American Jobs Plan and $1.8 trillion American Families Plan can help entrench those investments so that structural changes in the economy will help workers and their families more sustainably as the economy recovers.53 These policy actions and proposals, if fully implemented, would help correct the disinvestment in public institutions that began in the 1970s—timed just as our legislative and judicial systems removed formal barriers to access for people of color and thus removed an important counterweight to the forces of financialization.
The Senate Banking Committee also heard testimony on April 29 about other policy changes that could combat the deleterious effects of financialization. Ohio State’s Logan emphasized ways to empower workers by using antitrust enforcement to break up monopsonistic power and break the feedback loops created by financialization.54 Donner discussed how to rein in the outsized power at the very top of the U.S. wealth and income ladders by strengthening the rules and regulations governing Wall Street’s rising control of the U.S. economy. Specifically, she wants policymakers to address concentration among banks, strengthen protections against predatory lending, and reform the tax code to end the favorable treatment afforded to income gained via investments rather than labor.55
All of the witnesses also discussed the need to enact policy that addresses the roots of systemic racism, which is deeply interlinked with the causes and consequences of financialization. As McGhee pointed out, the legacy of the racial wealth divide is maintained and exacerbated by financialization, which pulls income away from workers and their families and directs it to those already exceedingly wealthy. Those with the least savings—mostly families of color historically cut off from wealth-building opportunities—are left the furthest behind, with fewer and fewer opportunities to catch up.56
On this point, witnesses also provided a host of policy recommendations to address economic disparities by race and ethnicity. They recommended that policymakers should collect more and better data, disaggregated by race and ethnicity,57 to provide better measures of the U.S. economy. Another suggestion was to enact policies such as baby bonds so that children have assets to help enable wealth-building activities as they head into adulthood.58 A third proposal would be to support worker power to help level the playing field between wage-earners and increasingly powerful corporations.59 Another recommendation was to examine how minority-owned small businesses were left behind in previous rescue efforts, including in response to the coronavirus recession.60 And more broadly, they recommended protecting against financial deregulation, which increases the risk of predation and its economic fallout for Black and Latinx individuals and families.61
The roots of financialization run deep, and its causes stretch far beyond the U.S. banking and financial-services sector. But with a broad set of investments in workers and families, policymakers can reverse these harmful decades-long trends and build a framework for sustained and broadly shared prosperity.