Overview
The U.S. Congress last month mobilized trillions of dollars in the Coronavirus Aid, Relief and Economic Security Act to help workers and businesses survive while mandatory COVID-19 public health measures put our economy on hold. While the size of the support in the CARES Act—around $2.2 trillion that will be leveraged up to $6.5 trillion—is important, just as crucial is how that money gets deployed. The speed with which funds reach individuals and businesses will determine which workers, families, and employers will weather this deep recession caused by policymakers’ failure to manage a public health crisis before it also became an economic crisis.
Differences in the efficiency and accessibility of rescue efforts between small and large businesses, in particular, are important. On this point, policymakers face tough challenges in ensuring that assistance reaches the smallest companies. Tens of millions of small businesses operate in the United States. Lending to those businesses is a time-consuming underwriting task, and small businesses have less existing bank credit to draw upon during times of stress. What’s more, small businesses don’t have access to alternative sources of funding in the capital markets. While frictions also exist in trying to rescue larger businesses, the challenges are more modest, the companies are more resilient, and—for good or bad—our policymakers have much more practice doing it.
If large businesses receive seamless and generous help during the coronavirus recession, but small businesses are left with laggard or inadequate assistance, then it will exacerbate already severe levels of economic inequality, including wealth disparities by race, ethnicity, and gender. It will drive consolidation and concentration, and hurt small business owners, consumers, and workers. As policymakers consider injecting additional hundreds of billions of dollars into financial support for small businesses in the weeks and months ahead, this issue brief draws on lessons from the past and from early implementation of the CARES Act to inform potential policy changes and then offers a number of policy recommendations. Briefly, among them are:
- A substantial increase in the size of financial assistance, especially as each day of mandatory public health lockdowns increase the likelihood of small business failures
- An easing of hurdles, so that small businesses can gain access to small business rescue funds
- Leveling the playing field to ensure equal access for both small lenders and small businesses owned by people of color and women, perhaps including a specific set-aside for the smallest of small businesses
- More aggressive steps to reduce unlawful discrimination and an affirmation of a commitment to fair lending
- Complementing direct aid to small businesses with a moratorium on legal actions related to late payments, such as bills owed to debt collectors, lenders, and landlords
- Structural reform to build financial plumbing that allows us to aid small businesses faster the next time a crisis strikes
Policymakers must quickly and effectively deploy aid to the businesses that need it most or else it will leave our economy more fragile, more concentrated, and less equitable than it was before the coronavirus.
Download File
Rescuing small businesses to fight the coronavirus recession and prevent further economic inequality in the United States
The consequences of rising economic inequality for small businesses
We enter the coronavirus recession at an already fragile time for U.S. small businesses. Business formation in the United States has fallen by half over the past 40 years, across both industries and services, as well as across geographic locations. Whereas in the past, most new establishments were startups, today, incumbent firms increasingly expand with more and more locations of the same business. In the words of researchers from the Federal Reserve Bank of Cleveland, “markets that used to be served by independent entrepreneurs creating businesses are now increasingly being served by the expansion of existing businesses.”
Small businesses, consumers, and workers suffer from rising concentration and consolidation by big firms
This is understood by most people as they move through the U.S. economy. The number of small retailers fell by 85,000 from 2005 to 2015, and Amazon.com Inc’s online sales platform now accounts for 38 percent of all online retail sales. Independent grocery stores are declining in numbers and market share. And Walmart Corp. now controls more than a quarter of all grocery sales. Despite the appearance of choice, three car rental companies control nearly all brands in the industry.
Consolidation in the banking industry has likewise been stark. The number and market share of small and community banks has dropped precipitously, while total assets held by the four largest U.S. banks—JP Morgan Chase & Co., Bank of America Corporation, Citigroup Inc., and Wells Fargo & Company—grew from 6.2 percent of all industry assets in 1984 to 44.2 percent of industry assets in 2011.
What’s worse is that economic crises are particularly hard on small businesses, providing a dire warning for policymakers as they grapple with the coronavirus recession. The total number of businesses is based on the number of firm “births” and “deaths” each year. The apex of the previous global financial crisis, 2009, marked the year where business deaths mostly strongly outpaced business births. For the three months ending in March 2009, new business creation reached its lowest point since the U.S. Bureau of Labor Statistics began collecting the information in 1992.
This long-term rise in consolidation and decline in small businesses has coincided with a period of worsening economic inequality, decreasing economic mobility, and increasing profit-hoarding by firms. The U.S. economy has experienced 40 years of wage stagnation, particularly for lower-wage workers. And a persistent lack of economic progress leaves workers’ share of income generated by firms on a steady decline.
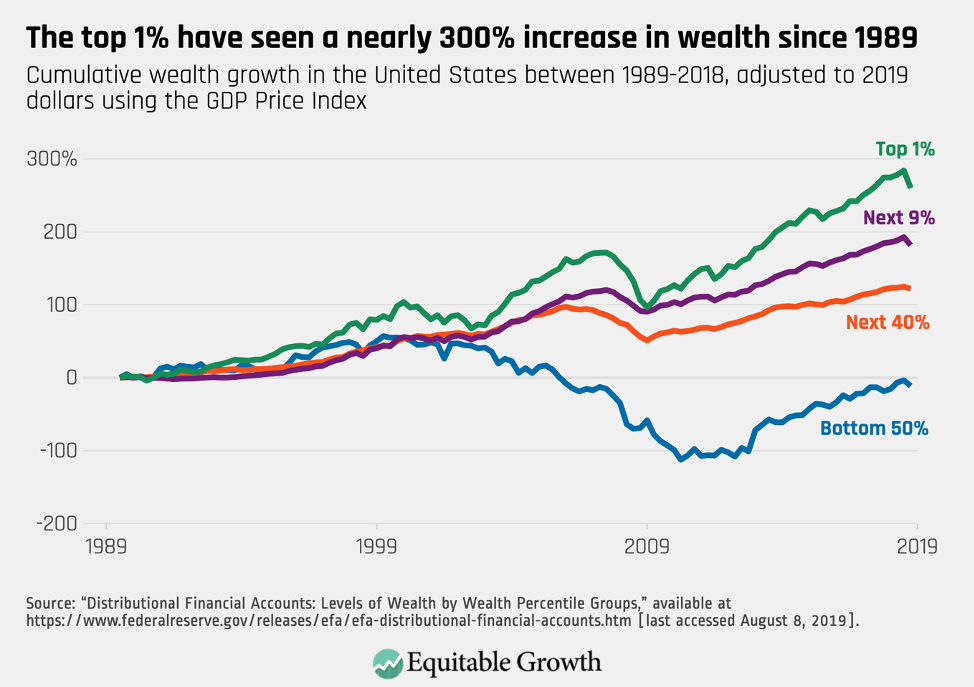
Meanwhile, the top 1 percent of households experienced income gains of 162 percent from 1980 to 2016. This same group also has registered a nearly 300 percent increase in wealth since 1989. (See Figure 1).
Figure 1
Similarly, intergenerational mobility—the chance for children to earn more money than their parents—has become harder and harder for successive generations to achieve since the 1940s. It also has become less likely that the children of rich parents experience downward mobility.
At the firm level, large companies have been able to hoard profits, which were at near-record highs relative to Gross Domestic Product in the years heading into the coronavirus recession. And free cash flow—the money firms generate after new investment—has grown, too. Despite technology and innovation that should be decreasing transaction costs, the cost of financial intermediation—what banks charge to manage the flow of money from savers to firms or individuals wanting to spend money on new projects—nearly doubled in the period from 1980 up until the current coronavirus recession.
Finally, mobility has also decreased for companies. Popular tropes about “disruptive” new U.S. firms upending old ways of doing business mask the reality that large companies are increasingly likely to maintain their dominance while small corporations are less and less likely to become big and profitable.
Some economists argue that this is the inevitable result of globalization, technological innovation, or economies of scale, and that the result is better for both workers and consumers. But increasing consolidation and more entrenched economic inequality is not natural law. The role of policy choices in arranging our market structure is unmistakable. Policymakers chose to bail out Wall Street rather than save homeowners a decade ago. There is a long history of declining antitrust enforcement. And policy choices and court decisions make it harder to join a union.
There are many factors at play in our complex global economy. But the 40-year trend in consolidation and declining business formation, which accelerates during recessions, has moved lockstep alongside an increase in economic inequality and a decline in economic mobility for individuals and firms alike across the United States. If U.S. policymakers allow small businesses to fail and large businesses to prosper during and after the coronavirus recession, then their actions will accelerate the 40-year feedback loop in which opportunity hoarding by the few begets even greater amounts of opportunity hoarding.
Small business failures and the racial, ethnic, and gender wealth gap
Declining small business formation and increasing inequality do not transmit through the economy equally for everyone. Race, ethnicity, and gender are crucial determinants in terms of which small businesses succeed. Any support to businesses needs to acknowledge and address persistent structural economic disparities. The policy response from Congress and the U.S. Small Business Administration needs to protect communities most at risk of being exposed to the new coronavirus or contracting COVID-19, the disease itself, and the related economic recession. Moreover, these same communities are the least likely to see the benefits of economic recovery without deliberate and specific policy attention and action.
Business ownership is a key route to wealth creation in the United States, and one way to help close the racial and ethnic wealth gap and support economic mobility is to facilitate an increase in entrepreneurship among people of color. Unfortunately, the wealth gap between white households and black and Latino households makes small business creation more difficult for people of color. The median white household had 10 times the wealth of the median black household and eight times the wealth of the median Latino household in 2016. This wealth forms the foundation from which business opportunities can grow, as it is nearly impossible to start a new venture without the financial support that comes from accumulated wealth.
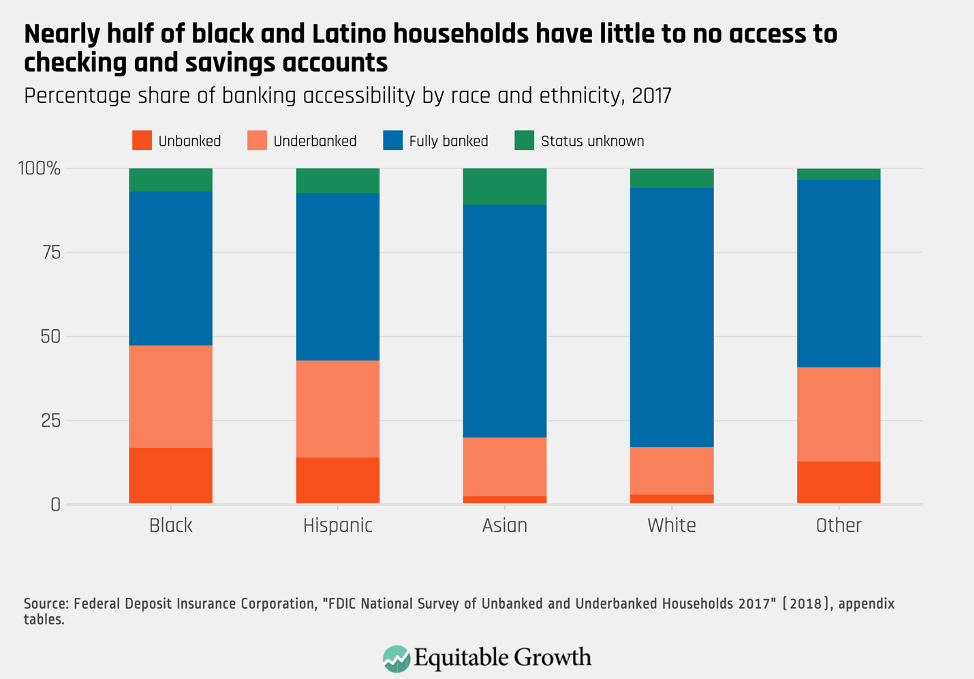
Black and Latino households also are less likely to have a relationship with a lending institution, as 17 percent and 14 percent of black and Latino households, respectively, were classified as “unbanked,” or lacking access to a checking or savings account. That’s compared to just 3 percent of white households. (See Figure 2.)
Figure 2
Other research suggests that neighborhoods with a higher percentage of residents who are people of color are less likely to have access to a bank branch.
For those people of color who do achieve entrepreneurship, one study found that black entrepreneurs have both higher levels of wealth and higher levels of wealth mobility than black workers. The same study also found that black entrepreneurs have levels of wealth mobility equal to those of white entrepreneurs, while white workers have greater wealth mobility than black workers.
As the previous section discussed, in recent years, the rate of business creation in the United States has been declining in absolute terms, though the rates of business creation among entrepreneurs who are people of color now exceeds the rate for whites. In other words, business formation may be slumping, yet the racial and ethnic business formation gap is, at least, closing.
The coronavirus recession could thwart that progress if small businesses owned by people of color are not assisted quickly and equitably. Black- and Latino-owned firms may face particularly harsh circumstances during the coronavirus recession, as those firms have historically been concentrated in the personal service and retail industries, sectors that are especially suffering as the country is on a mandatory public health lockdown.
One persistent problem for facilitating entrepreneurship among people of color is access to credit, created and perpetuated by an economic system whose foundations are rooted in discrimination. U.S. policymakers must be careful not to reinforce existing disparities in credit access for minority versus nonminority business owners as they seek to help small businesses during this recession. One recent study by the Federal Reserve Banks of Atlanta and Cleveland found that black-owned small businesses applied for new funding at a rate 10 percentage points higher than white-owned firms, but their approval rates were 19 percentage points lower. This race and ethnicity-based disparity in businesses’ ability to get credit persisted even among firms with revenues topping $1 million. Minority-owned businesses that were approved for credit received the full amount requested 40 percent of the time, compared to 68 percent of the time for nonminority-owned firms.
The source of minority-owned small businesses credit also may play an important role. The Federal Reserve Bank of Cleveland study found that black and Latino-owned firms were more likely to access funding via a Community Development Financial Institution, or CDFI, and less likely to get funding from a large or small bank. Policymakers should be mindful of this fact, particularly as CDFIs themselves face operational and funding challenges even in good times. Other evidence suggests that disparities exist even within the CDFI industry itself, with ones owned by people of color having less capital than those owned by whites.
Research suggests that inequities also exist for businesses owned by women. One report by the U.S. Senate Small Business and Entrepreneurship Committee found that while businesses owned by women account for 30 percent of small companies, they received only 16 percent of all conventional small business loans and 17 percent of SBA-backed loans. Their loan applications are more likely to be rejected than those from businesses owned by men, and the loans they get are likely to have more stringent terms. Other research shows that in traditionally male-dominated fields such as financial services and information technology, women are disadvantaged in terms of new client referrals from networking. These gender effects, of course, can be compounded by race and ethnicity—with women of color experiencing intersecting forms of disadvantage.
Help for small businesses in the CARES act
U.S. small businesses enter the coronavirus recession with significant vulnerabilities. And small business formation and prosperity has key relevance to economic inequality, including inequality across race, ethnicity, and gender. With that in mind, this section of the issue brief describes the aid flowing from Congress to small businesses during the coronavirus recession, and potential design and implementation challenges.
The small business provisions of the CARES Act
The central provision for small businesses in Congress’ coronavirus rescue bill is a $349 billion loan program administered by the Small Business Administration. The program’s loans are underwritten by participating banks and other lenders at a below-market interest rate of 1 percent. This funding will allow businesses with fewer than 500 employees to borrow up to two and a half months of average monthly payroll expenses, with a cap of $10 million.
Funding can be used for payroll, mortgage interest, rent, or utilities. If the employer keeps workers on payroll or rehires them by June 30, 2020, then loans are forgiven, hence the program being known as the Paycheck Protection Program. If employees are partially rehired, forgiveness is prorated; if they’re not rehired by the end of June, then the funding must be paid back, with interest, within 2 years. According to a provision in the SBA’s guidance, which was not included in the CARES Act statute, only 25 percent of any loan forgiveness can be for nonpayroll expenses.
Regardless of whether loans are forgiven, the SBA guarantees full repayment of loan amounts to participating lenders, meaning that financial institutions accept no credit risk in these transactions. Loans are disbursed on a first-come, first-served basis, with those who reach their lender earliest having an advantage in securing financing through the Paycheck Protection Program.
Challenges for equitable implementation of these provisions
The size and the timing of the small business-focused rescue funds are the first challenges. The current size of the aid allocated by Congress will be a major, perhaps insurmountable, impediment to a healthy small business recovery. The Small Business Administration notes that approximately 30 million small businesses exist in the United States. These firms accounted for 62 percent of new private-sector job growth from 2005 to the onset of the coronavirus recession.
Given the number of small businesses in the country and the magnitude of the economic shutdown, $349 billion won’t be enough to prevent a sectorwide derailment of small firms. To put this funding in context, small business payroll and related compensation expenses totaled around $288 billion a month, using the most recent available data from 2016—meaning the Paycheck Protection Program could support all eligible firms’ payroll and compensation for just less than a month and a half.
Even worse, this estimate excludes other small business costs (mortgage, rent, supplies) and assumes the full $349 billion is available to lend. Though some program details are still unclear, it appears that the fees allocated to financial institutions for processing loan applications also will be paid by the Small Business Administration out of the $349 billion appropriation amount. Lender enticement is structured such that the SBA guarantees repayment of the loans to banks and credit unions while also providing fee income structured as a percentage based on the loan amount offered (ranging from 5 percent on small loans to 1 percent on the largest loans).
Further, lending institutions are compensated by collecting the 1 percent interest rate charged on the 2-year loan, though they are prohibited from collecting fees from participating small businesses. All told, lenders will likely receive between $5 billion and $20 billion in up-front fee compensation for participating in the program. In total, the $349 billion appropriation, less lender fees, will not be enough to prevent the failure of many small businesses.
What’s worse, though lenders are compensated at a higher percentage rate for originating loans with lower principal balances, the high transaction cost of loan origination—and rush to grab funding before it runs out—may skew lending even further away from the smallest of businesses. Simply put, it’s easier to originate one $10 million loan than 50 $200,000 loans.
Then, there’s the timing challenge. First, the money will probably not come soon enough, given the scope and length of small business shutdowns. Major cities and states began mandatory lockdowns weeks ago. Without revenue, small businesses cannot operate for long absent relief. One study found that half of all small businesses have only enough cash on hand to survive for 27 days. Restaurants and bars are particularly vulnerable, as the average small business in the service industry has only enough to survive 19 days without income.
While applications began on April 3, and news outlets reported that banks were evaluating borrowers, the roll-out has not been smooth. One news report issued on the day of the program’s launch says it all: “Massive Small Business Rescue Gets Off to Stormy Start.” Social media is filled with posts of small business borrowers and lenders alike desperate for program rules. One survey found that less than half of small businesses obtained funds from a bank in the past 5 years, meaning lending relationships either don’t exist or may be outdated. As of Monday, April 13, the SBA reported that more than 880,000 applications for assistance have been approved, totaling more than $217 billion. While those early numbers demonstrate tremendous interest and enrollment in the program, it’s likely that the chaos of that early program implementation will leave many businesses behind.
Second, many small businesses have very little revenue to supplement the SBA funding. It’s impossible for most small businesses to operate at anything beyond minimal capacity during this pandemic. This is especially true for small businesses in the service sector that require face-to-face customer contact. One survey, released on the same day as the application period began for the Paycheck Protection Program, said that one-fourth of small businesses have already closed, and another 40 percent reported that they would have to close at least temporarily in the next two weeks.
Anecdotal stories paint a very stark picture. Sales have plummeted by 80 percent at one California company that prints cards for commercial businesses. One restaurant in Washington, D.C. reported that even with a takeout business open, sales have dropped by 80 percent. Nail and hair salons, gyms, movie theaters, clothing boutiques, and many other services businesses across the country have completely shuttered.
Third, small businesses probably won’t be able to rehire employees by the end of June 2020, as required under the Paycheck Protection Program in order for loans to be forgiven. The U.S. economy has undergone an abrupt and severe shock, which means it is unrealistic to expect small businesses to ramp-up employment by June 30. Beyond the economic challenges involved in rehiring employees, there’s the question of whether the public health emergency will be over in two months. The mayor of Washington, D.C. last week suggested that the city may not reach the peak infection rate until late June or early July. Social distancing measures may remain in place for months to come.
Fourth, funding constraints are made more pressing by the Small Business Administration’s definition of an eligible small business. While small firms owned by large companies are generally excluded from benefitting from the Paycheck Protection Program, certain exceptions exist, most notably in the hotel and food service businesses. The result is that fast-food chains such as Burger King, Whataburger, and Arby’s could benefit from this funding over “mom-and-pop” restaurants, even though these chains have deep-pocketed and highly creditworthy private equity owners.
Policymakers should be concerned about extending a too-small amount of help to firms that have little chance of rehiring employees by the deadline. With limited ability to repay even a modest loan, additional debt could trap businesses without offering them a pathway out of the recession. The home mortgage foreclosure crisis of a decade ago provides an important warning on this point: About 1 in 3 borrowers who received a government loan modification ended up redefaulting. Households stretched themselves to keep paying mortgages they ultimately couldn’t afford, because the government rescue program was insufficient.
Policymakers should not make the same mistake again and encourage small businesses to “throw good money after bad.” Aid must be drastically scaled up, and perhaps paired with efforts to reduce or eliminate outgoing funds from small businesses, through measures such as halting debt collections or imposing moratoria on legal actions related to rent or mortgage payments. All told, we must provide assistance that is robust and lasting, and help small businesses get through the length of the pandemic.
Administrative concerns over small business lines of funding in the CARES Act
The Small Business Administration is already facing administrative challenges in deploying this rescue aid. The $349 billion appropriated in the CARES Act amounts to many multiples of what the relatively small government agency is accustomed to processing in a given year. It approved 58,000 applications through its flagship program last year. Yet on the second day of the Paycheck Protection Program, the SBA was so swarmed with activity that its website crashed. One participating lender received 212,000 applications for loans in just more than a day of the program being operational.
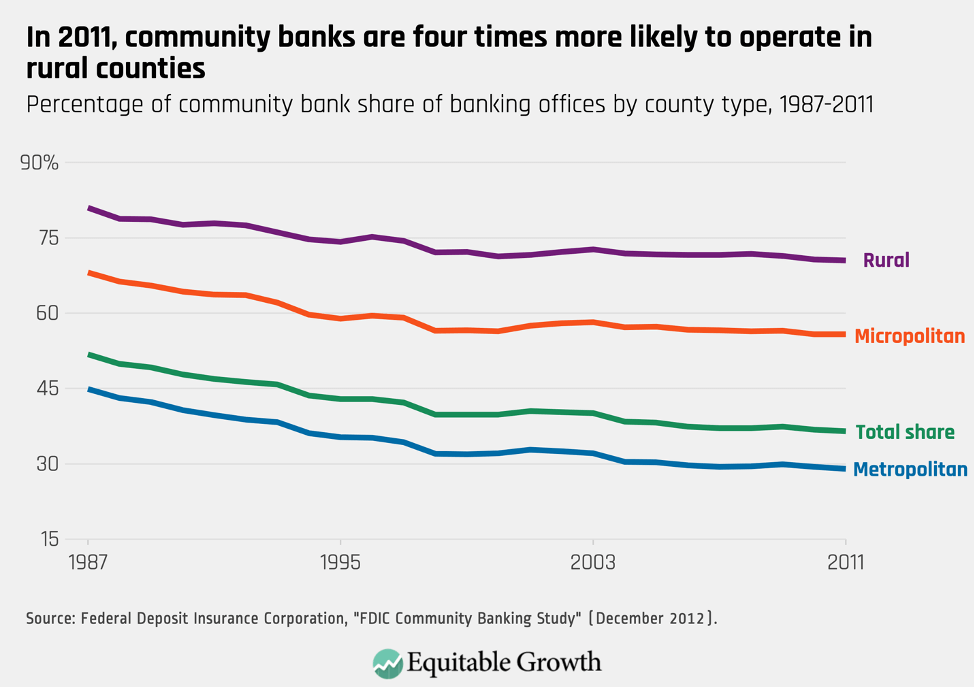
Implementation programs appear to be effecting small and community lenders particularly hard. This will have knock-on effects for which small businesses receive funds. One Federal Deposit Insurance Corporation study found that community banks were four times more likely to operate offices in rural counties. (See Figure 3.)
Figure 3
While the simple four-page application form makes it more likely that the rescue money won’t get trapped in bureaucratic processes, lenders are still reporting inconsistencies in the documentation required by the SBA. The agency will need to ramp-up operational capacity to prevent fraud and serve the needs of small businesses and participating lenders in the weeks ahead.
Racial, ethnic, and gender equity implications of the Paycheck Protection Program
Demand for small business loans will probably far outpace supply. Given that fact, alongside structural problems in small business lending, credit discrimination within the Paycheck Protection Program is a real concern. Absent data collection that allows for visibility into discriminatory trends and strong enforcement of fair credit laws by the U.S. Department of Justice, new small business programs may well entrench old patterns of bias. Lending institutions have wide latitude to pick and choose between loan applications, as eligible borrowers compete for a small pot of funding. This is likely to exacerbate existing biases favoring white-owned firms over minority-owned firms, as lenders exert power when credit demand outpaces limited supply.
One threshold problem is a lack of small business lending data, disaggregated by protected characteristics—information that is collected related to mortgage lending which has formed the basis of decades of policy research and fair lending enforcement. The Consumer Financial Protection Bureau was mandated to collect such data pursuant to the Wall Street Reform and Consumer Protection Act of 2010. But the new agency never completed the mandate. Recently, the Consumer Financial Protection Bureau settled a lawsuit with fair-lending advocates that required them to complete the rule. But amid the coronavirus pandemic, the agency has halted progress on the rule’s implementation.
Finally, one troubling feature of the Small Business Administration’s guidance as it relates to the Paycheck Protection Program is the absence of a restatement of the protections afforded under fair lending law. This absence is conspicuous given that the guidance does restate law as it relates to nondiscrimination for religious institutions.
Furthermore, policymakers must be aware of how administrative choices designed to expedite the deployment of funding may have knock-on distributional consequences for minority-owned small businesses. Some lenders participating in the program, for example, are favoring small business clients who already have relationships with the bank, either through official policy or in practice, as evidenced in recent news reports. Guidelines released by the Treasury Department encourage lenders to do so, since in these instances, these small businesses could be considered already “vetted” for the purposes of anti-money-laundering and related rules. While this will deliver aid modestly faster, it will also reinforce existing disparities in access to credit between white-owned firms and entrepreneurs who are people of color.
What’s more, because funding under the Paycheck Protection Program is provided on a first-come, first-served basis, firms with access to resources such as attorneys or financial managers may benefit from first-mover advantages. Technical assistance is probably needed. Press accounts suggest a frenzied roll-out of the program, with borrowers forced to navigate systems that are not yet fully established. Additionally, some banks are directing customers to online-only application systems. This could have distributional impacts on small businesses that do not have broadband access or web-savvy literacy in navigating online application forms.
The limitations on those small firms eligible for small business funding also will have distributional consequences, including by race and ethnicity. Implementing guidance from the Small Business Administration bars the agency from receiving a loan from any business whose owner (defined as 20 percent or more as an equity holder) is “incarcerated, on probation, on parole; presently subject to an indictment, criminal information, arraignment, or other means by which formal criminal charges are brought in any jurisdiction; or has been convicted of a felony within the last five years.” This prohibition goes beyond existing SBA regulations on criminal prohibitions, which only prohibit business owners currently incarcerated, on probation or parole, or currently indicted for a felony or crime of moral turpitude.
Given that 100 million Americans have some sort of arrest or conviction record, this prohibition will lock out a wide range of borrowers from accessing small business funding. And because our criminal justice system has structural racism embedded in every step of the process, this limitation will disproportionately lock out entrepreneurs of color. It should be dropped entirely—at a minimum for the duration of the coronavirus recession, but optimally permanently.
Finally, the Small Business Administration in the past has also faced challenges in reaching business owners whose primary language was not English. An SBA Inspector General report found that during Hurricane Maria in September 2017—a Category 5 storm that swept through the U.S. territories of Puerto Rico and the Virgin Islands—the agency did not have sufficient Spanish language assistance. Again, policymakers need to increase resources for small businesses whose owners’ primary language is not English and conduct oversight regarding access for these populations. Without such efforts, the Paycheck Protection Program will reinforce racial and ethnic disparities as the nation recovers from the coronavirus recession.
Help for large businesses in the CARES act
In contrast to the numerous hurdles facing small businesses seeking access to funding through the Paycheck Protection Program, large businesses can and are receiving financial support via a variety of avenues through the Federal Reserve and the U.S. Treasury Department. Some of this funding is via the CARES Act and some via existing or new lending facilities set up by the Fed. By and large, these funds are being deployed relatively quickly and at a greater scale. This section of the issue brief breaks out those funding channels to demonstrate the economic inequality baked into the U.S. financial system and the CARES Act.
The Federal Reserve’s response to the coronavirus recession for big businesses
Earlier in March and without requiring prior authorization from Congress, the Federal Reserve unveiled financing programs pursuant to the authority provided by Section 13(3) of the Federal Reserve Act, colloquially known as “13(3).” These recent programs today are bolder and broader than anything previously undertaken by the Fed, but the model for the interventions was developed during the 2008 financial crisis.
Under these recent 13(3) programs, the Fed is buying bonds and extending loans to investment-grade companies—large firms such as McDonald’s Corp., Exxon Mobil Corp., and The Walt Disney Co., all of which are seen as the lowest-risk corporate investments. The Fed’s efforts also include support for financial instruments such as Exchange Traded Funds and Money Market Mutual Funds, comprised of those large companies’ debts. Another program, called the Term Asset-Backed Securities Loan Facility, was set up to purchase the safest consumer and student debt and existing SBA loans (those made prior to the Paycheck Protection Program in 2020), and was later expanded to cover commercial mortgage-backed securities and collateralized loan obligations.
All told, the Fed’s market interventions for larger and more creditworthy firms exceed those for small business by many multiples. Both as a result of the Fed’s market stabilization measures, as well as large companies’ size and less risky profiles, most investment-grade companies have been able to secure funding in the private market, raising record amounts of capital in recent weeks to bolster their finances and reassure investors. Again, this is stark when contrasted with small businesses, which, in nearly half of cases, have no relationship with a lender at all.
The CARES Act’s provisions for big businesses
Beyond these Fed interventions, Congress authorized $454 billion in the CARES Act to capitalize a fund run by the Treasury Department, jointly with the Fed, and directed toward large businesses. This pool of funding will serve as a down-payment for investments, again made pursuant to the Fed’s 13(3) authority. The taxpayer-provided backstop is needed for these facilities, as historically Fed implementation of 13(3) requirements prevents the central bank from making riskier investments absent further support from Congress. By providing first-loss protection that stands ahead of the Fed, this pool of funding allows for loans, bond purchases, or equity investments that reach further down the “risk curve,” and therefore help larger companies in more perilous conditions.
Federal Reserve Board Chair Jerome Powell has noted that the $454 billion will likely be leveraged 10-to-1, meaning that taxpayers’ down-payment will support $4.5 trillion of investment into the U.S. economy. To put that amount in context, the total amount of all bank commercial and industrial loans outstanding in 2019 totaled $2.35 trillion. And all new nonfinancial corporate debt issued in the same year was $1.41 trillion. None of this support will be forgiven by the federal government, as is the case with the small business rescue funds, but it is important to note that the scale of relief afforded to large businesses is many multiples the size of the Paycheck Protection Program for small businesses. Generally speaking, aid to large businesses has some modest restrictions on dividend payments, stock buybacks, and executive compensation. But the program includes no requirement that they rehire any employees at all, compared to small businesses which must bring back their workforces by June 30, 2020.
The Fed in mid-April announced the creation of several programs backstopped by CARES Act funds, including programs for mid-sized businesses called the Main Street Lending Program. But its target is relatively large firms—those with up to 10,000 employees or $2.5 billion in revenue with a minimum loan size of $1 million. These programs will reach middle-market companies with riskier profiles than the investment-grade companies initially helped by the Fed. This quick roll-out of rescue funds to a broad range of larger businesses contrasts poorly with the slower roll-out and more troubled small business program, underscoring how the Fed and other policymakers have fewer “off-the-shelf” rescue options available for smaller firms.
Conclusion and policy recommendations
The CARES Act offers crucial assistance to small businesses at an unprecedented scale and on an unprecedented timeline. But the economic pain caused by the coronavirus recession will undoubtably overtake even these relatively bold policy efforts. U.S. policymakers in Congress and the Trump administration must address the concerns outlined in this brief or run the risk of worsening economic inequality, further limiting economic mobility for individuals and firms alike, and widening the racial, ethnic, and gender wealth gap across the United States.
To summarize the recommendations in this issue brief, policymakers must further help small businesses by:
- Drastically increasing the size of financial assistance and speeding its deployment, especially as each day of mandatory public health lockdown increases the likelihood of small business failure
- Easing hurdles to access by pushing out or eliminating entirely the June 30, 2020 rehiring deadline by which loans can convert to grants, as well as loosening limitations on use of funds
- Leveling the playing field by ensuring equal access for both small lenders and small businesses owned by people of color and women, perhaps including a specific set-aside for the smallest of small businesses in any subsequent round of funding
- Complementing direct aid to small businesses with a moratorium on legal actions related to late payments, such as bills owed to debt collectors, lenders and landlords
- Taking aggressive steps to reduce the likelihood of unlawful discrimination by collecting better lending data
- Affirming a commitment to fair lending through both Small Business Administration outreach and Department of Justice enforcement
Some of these steps could be taken now by the Small Business Administration in concert with the Treasury Department to improve the shape of the distribution and oversight of existing Paycheck Protection Program funding. And program changes are all the more urgent as time passes. President Donald Trump says his administration may seek additional funding for small businesses in future legislation, which means there is an opportunity to establish more policy changes in the next round of funding.
Beyond strengthening the Paycheck Protection Program, policymakers should think about other ways to deploy funding to small businesses quickly and efficiently over the long term. The 2008 financial crisis and the decade since was a lost opportunity to develop fairer, more transparent, and more equitable ways to deploy emergency funds to real people and small businesses. In the case of 2008, our policy infrastructure failed to help borrowers save their homes but was very efficient at rescuing large banks.
Taking that lesson to heart, policymakers might consider enabling the federal government to partner with automated paycheck systems such as those run by Automatic Data Processing, Inc. and Paychex Inc. to use existing pipelines to release money faster to small businesses, many of which already use one of these services to handle their payrolls. Even still, these new partnerships will take time and may come too late for many small businesses.
To that end, we must think about long-term reforms both as this crisis unfolds and as we prepare for the next recession. Mehrsa Baradaran, a law professor at University of California, Irvine School of Law and a Washington Center for Equitable Growth board member, years ago proposed establishing a system whereby all Americans are afforded the opportunity to open bank accounts through the U.S. postal system. Such a system run by the U.S. Postal Service could also include small businesses, thereby expediting the deployment of funds and reducing the costs of financial intermediation in a crisis.
In 2018, law professors Morgan Ricks at Vanderbilt University School of Law, John Crawford at U.C. Hastings College of Law, and Lev Menand at Columbia Law School proposed a similar idea but centered in the Federal Reserve. They proposed to allow all U.S. individuals and businesses to open an account at the Fed—a benefit currently afforded only to banks. Again, such a system in the future could allow for the quick deployment of funds during times of emergency.
And then, there’s the proposal from Saule Omarova and Robert Hockett, both of Cornell University School of Law. In 2018, they proposed establishing a permanent National Investment Authority, similar to the Reconstruction Finance Corporation employed during the Great Depression. This proposed agency would have a democratically accountable governance structure and would be responsible for efficiently and transparently administering bailout funds and mobilizing production in the national interest during national crises. Such a system could prove useful in the future, particularly as the threat of climate change bears down on communities and financial markets around the world.
Entrepreneurship and business formation are important to the U.S. economy and offer individuals and families a pathway to accumulate wealth—to draw down upon to pay for higher education, buy a house, or pass on to the next generation. If policymakers’ responses to the coronavirus recession reinforces, rather than mitigates, the trend toward the increasing concentration among large firms and declining small business dynamism, then our country will emerge more fragile, more concentrated, and less equitable than it was before.
—Amanda Fischer is the policy director at the Washington Center for Equitable Growth.