Category: Coronavirus Recession
New wealth data show that the economic expansion after the Great Recession was a wealthless recovery for many U.S. households

Overview
The Federal Reserve’s 2019 Survey of Consumer Finances, or SCF, released last week, shows that the wealth of many U.S. households never recovered from the shock of the Great Recession more than a decade ago. Although mean (average) wealth of all households in 2019 exceeded mean wealth in 2007 by 9 percent, median (midpoint) wealth declined by 19 percent over the same time period. If housing wealth is excluded, the median wealth of all households in 2019 is about equal to median wealth in 2007.
These several data points show that U.S. households barely recovered their levels of nonhousing wealth over the more than 10 years of economic expansion since the Great Recession of 2007–2009, compared to pre-Great Recession levels. And the data show that households are now less likely to have a home to leverage as a financial asset.
Moreover, disaggregating the data by demographic characteristics shows that many of these households fared worse than the average. Whiter, wealthier, and more educated households fared better, although even these struggled to recover their pre-Great Recession levels of wealth, demonstrating just how broadly felt the slow recovery of wealth has been.
That so many of these households would soon enter the coronavirus recession, which began in February 2020, in worse condition than they entered the Great Recession is a dire warning. This current recession is already deeper and families have fewer resources to draw on to protect themselves from its effects. The upshot: Further aid from Congress is critical to avoid repeating the mistakes made as the United States recovered from the Great Recession.
New wealth data show that the economic expansion after the Great Recession was a wealthless recovery for many U.S. householdsDownload
Disaggregating the 2019 SCF data to discover what kinds of households entered the coronavirus recession with the resources to insulate themselves from job losses, furloughs, or ill health caused by COVID-19, the disease caused by the virus, would help policymakers understand what kinds of households need help now to weather this economic and public health crisis. Notably, however, sample sizes in the Survey of Consumer Finances are not large enough for Hispanic and Black communities to support the fine levels of disaggregation necessary for policymakers to target aid effectively and efficiently.
Furthermore, sample sizes for Asian Americans and Pacific Islanders are so small that the Federal Reserve has to withhold these data from public disclosure entirely, grouping them into a catch-all “other” category to protect the privacy of these households. This is why the Fed should consider oversampling these communities.
The analyses below compare 2007 levels of wealth, from before the Great Recession, to 2019 levels of wealth, and represent peak-to-peak comparisons that tell us whether households with particular demographic characteristics are better- or worse-positioned for the current recession than they were in 2007 for the Great Recession. Most graphs in this column include shaded 95 percent confidence intervals to show levels of statistical uncertainty for these calculations.
White households had a stronger recovery of wealth
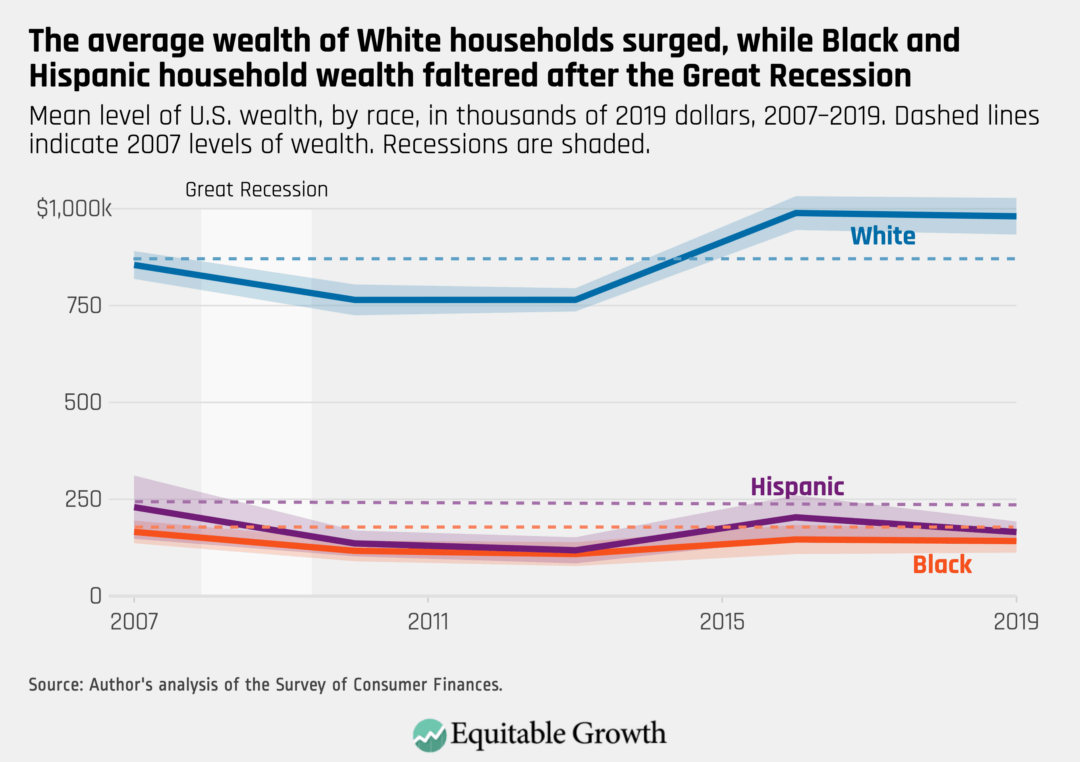
Households that fully recovered their pre-Great Recession levels of wealth are overwhelmingly White. While White households, on average, have 15 percent more wealth in 2019 than in 2007, Black households have 14 percent less wealth, and average wealth for Hispanic households declined by 28 percent. (See Figure 1.)
Figure 1
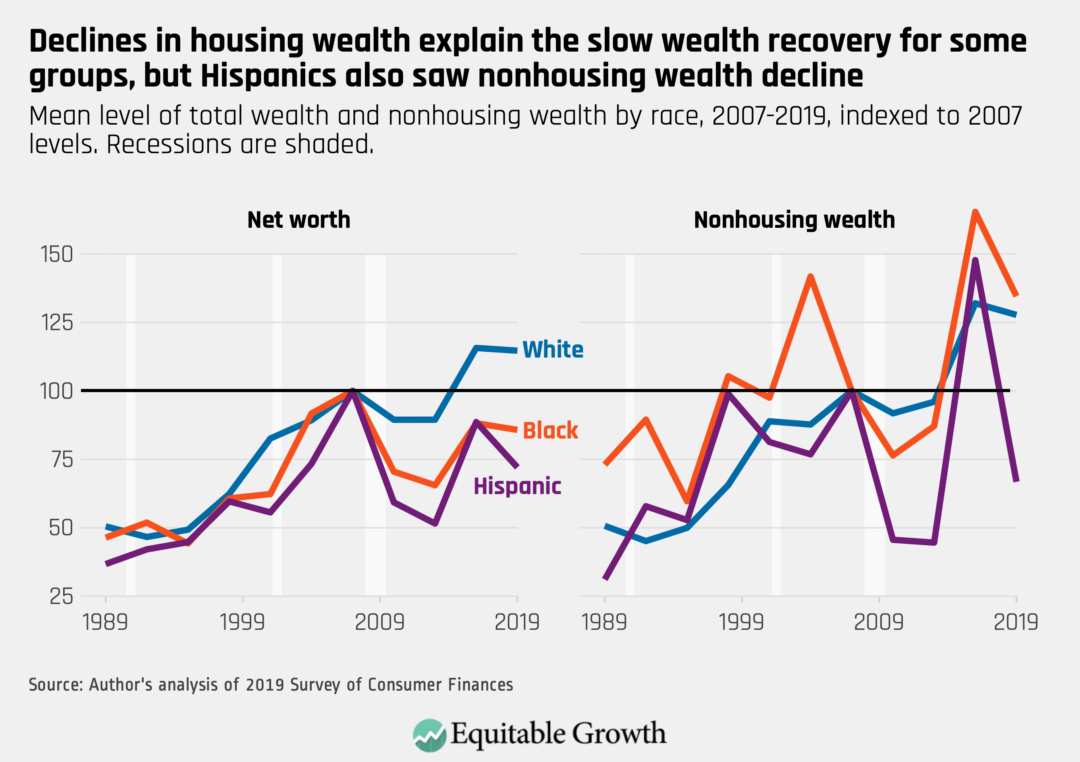
Declines in housing wealth in the United States are responsible for a significant portion of wealth declines since before the Great Recession, but they are not the whole story. The nonhousing wealth of White households between 2007 and 2019 increased by 28 percent after the Great Recession, while it surged 35 percent for Black households and dropped 33 percent for Hispanic households. That average Black wealth declined even though nonhousing wealth surged in the group indicates how important housing wealth is to Black households. (See Figure 2.)
Figure 2
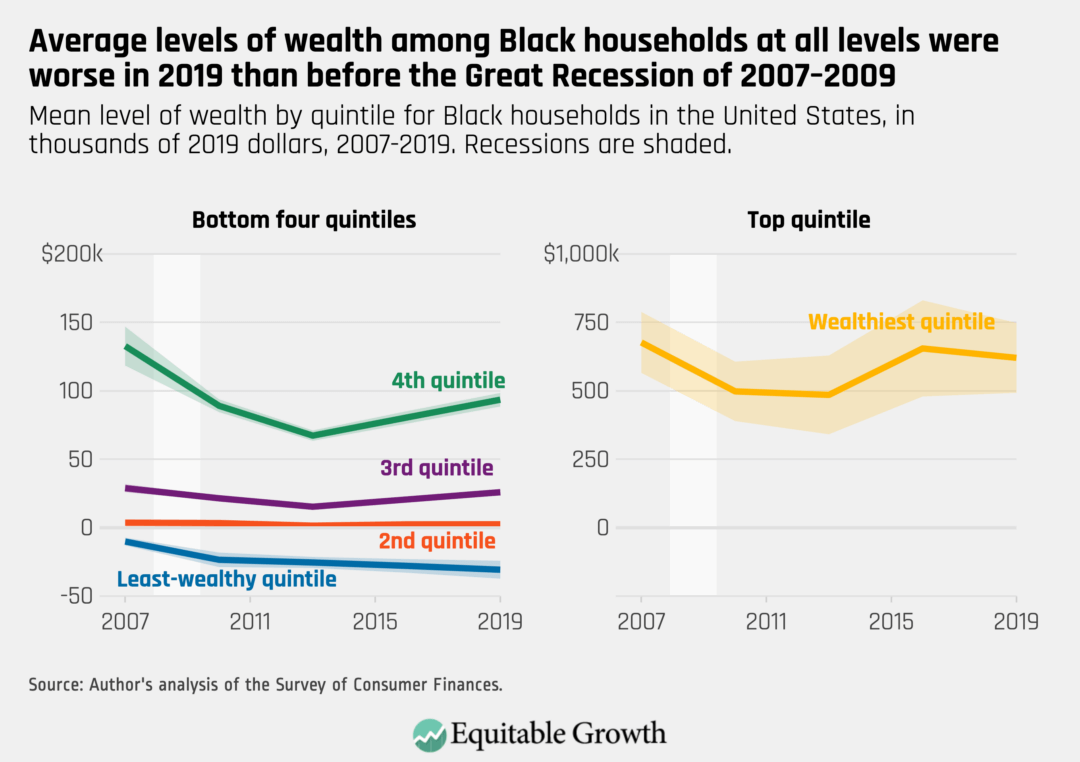
Even high-income Black households did not fully recover what they lost during the Great Recession. Classified by wealth, every quintile of Black households saw declines in their net worth. Middle-quintile Black households saw their net worth decline by 10 percent between 2007 and 2019, for example. (See Figure 3.)
Figure 3
Wealthier households had the strongest recoveries of wealth
U.S. households headed by White people were more likely to recover or exceed their pre-Great Recession levels of wealth, with much of this growth happening at the top of the wealth distribution. In contrast, households outside the top 10 percent experienced relatively weak recoveries.
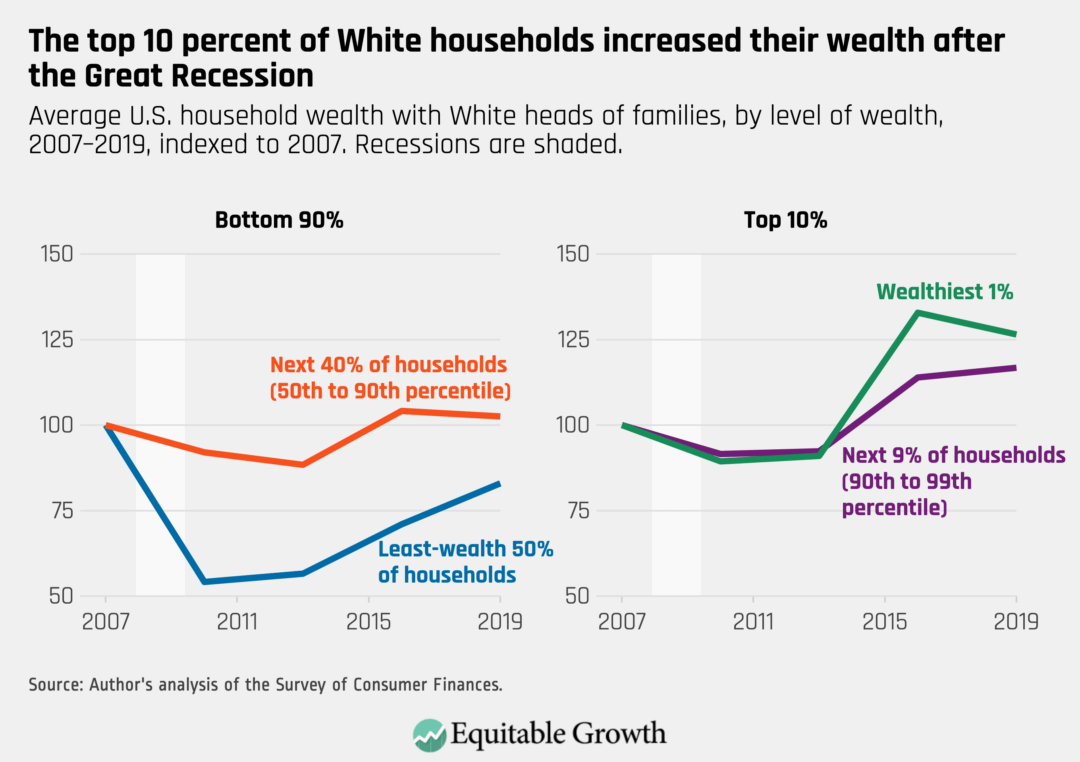
In fact, White households in the bottom half of the wealth distribution only recovered about 83 percent of their pre-Great Recession wealth peak. Those in the next 40 percent of the wealth distribution (from the 50th percentile to the 90th percentile) saw very modest gains of about 2.5 percent. Those at the top, however, built a significant amount of wealth. The top 1 percent increased their wealth by 26 percent during the post-Great Recession economic recovery. (See Figure 4.)
Figure 4
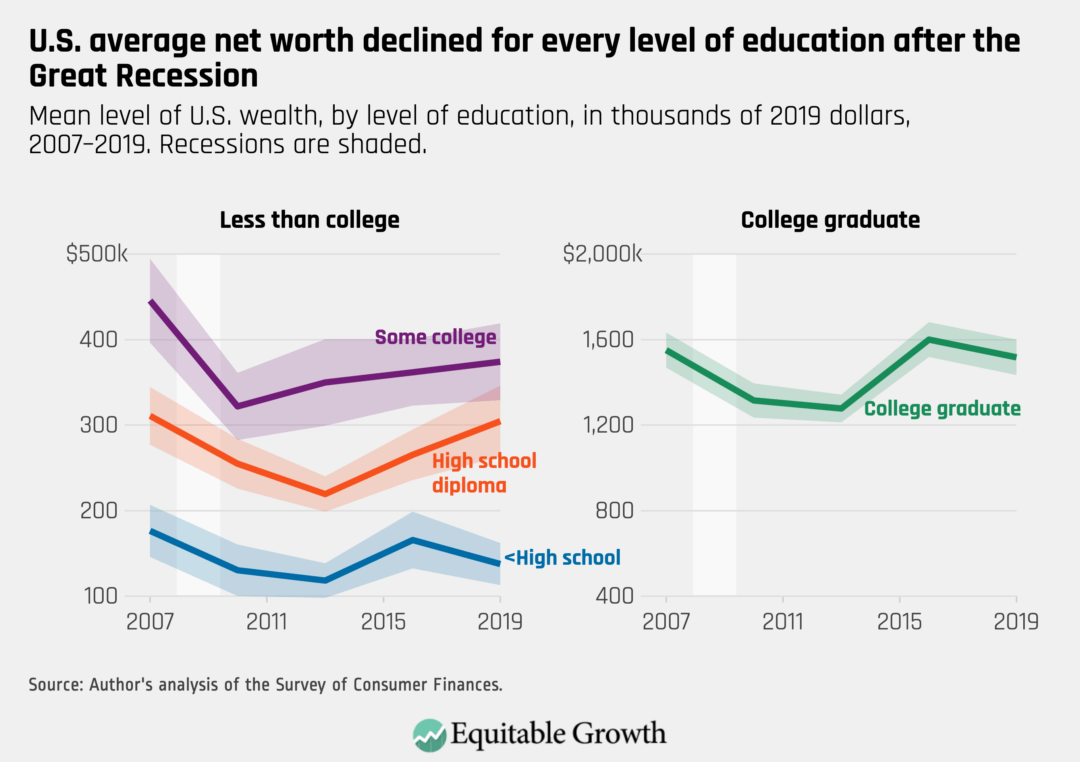
Less-educated households struggled to build wealth in the recovery
Americans grouped by education experienced a similar divide before and after the Great Recession. Those with a bachelor’s degree or more just barely recovered their pre-Great Recession levels of wealth. But Americans in every other educational group saw significant declines in their wealth, although Americans with high school diplomas came closest to recovering. (See Figure 5.)
Figure 5
This is true even for White households at lower levels of education. Those White households with a head of the family who had less than a high school diploma or with a GED or high school diploma only narrowly recovered their 2007 levels of wealth by 2019. Sample sizes for White households with a head of the family who had some college experience are relatively small, and it is difficult to draw inferences in this group.
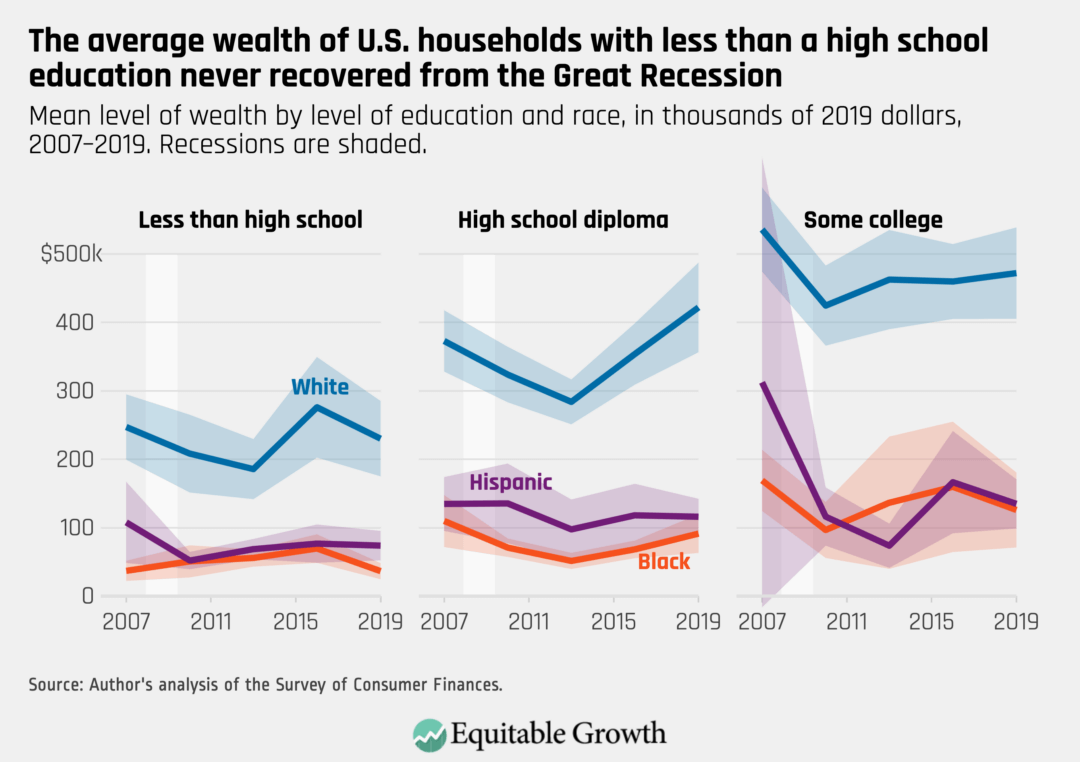
Again, the differences are more stark for households of color. White households with less than a college degree saw their wealth increase by 3 percent between 2007 and 2019. But Black households without a college degree entered 2020 and the coronavirus recession two months later with an average of 17 percent less wealth than what they had in 2007. (See Figure 6.)
Figure 6
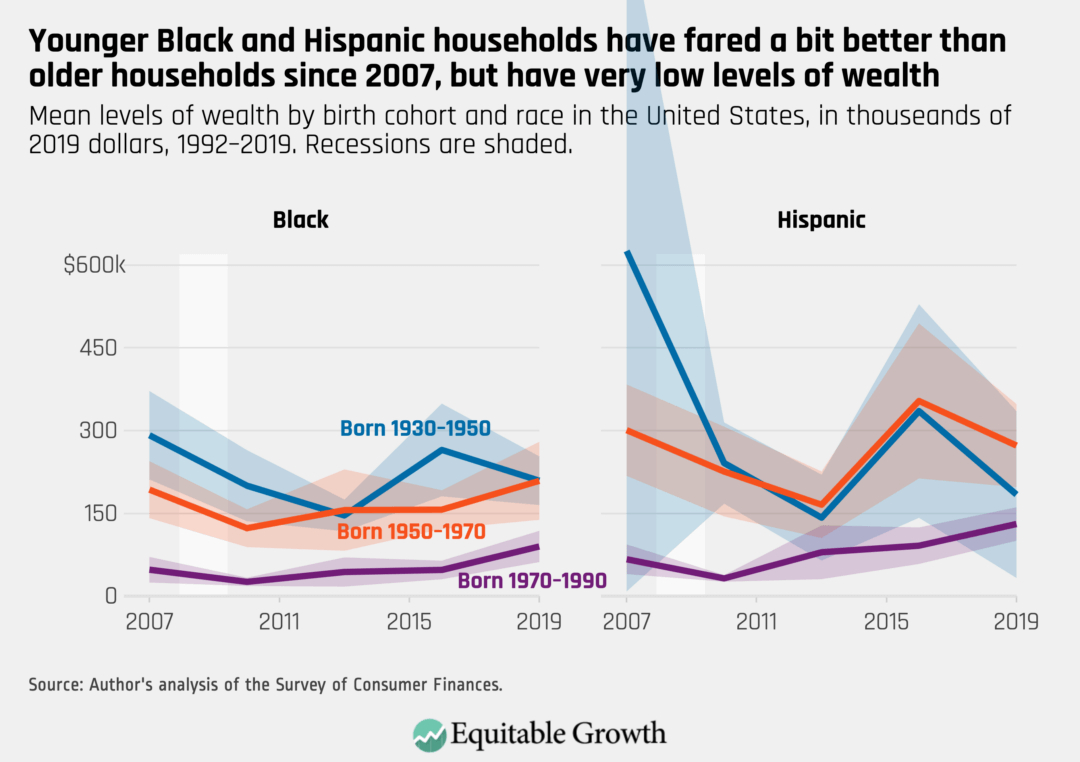
Younger Black households built wealth during the recovery but continue to have very low levels of wealth
From a generational perspective, Black households have levels of wealth far lower than even the youngest White households. A White household where the head of the family was born between 1970 and 1990 had average wealth of about $500,000 in 2019, whereas even the oldest Black households only had average wealth of around $200,000.
Black and Hispanic households of any age had very low levels of wealth entering the Great Recession. But younger generations of both Black and Hispanic households fared better over the course of the recovery after the Great Recession. Black households with heads of families born between 1970 and 1990 increased their wealth by 65 percent between 2007 and 2019, but nonetheless still have very low levels of wealth. (See Figure 7.)
Figure 7
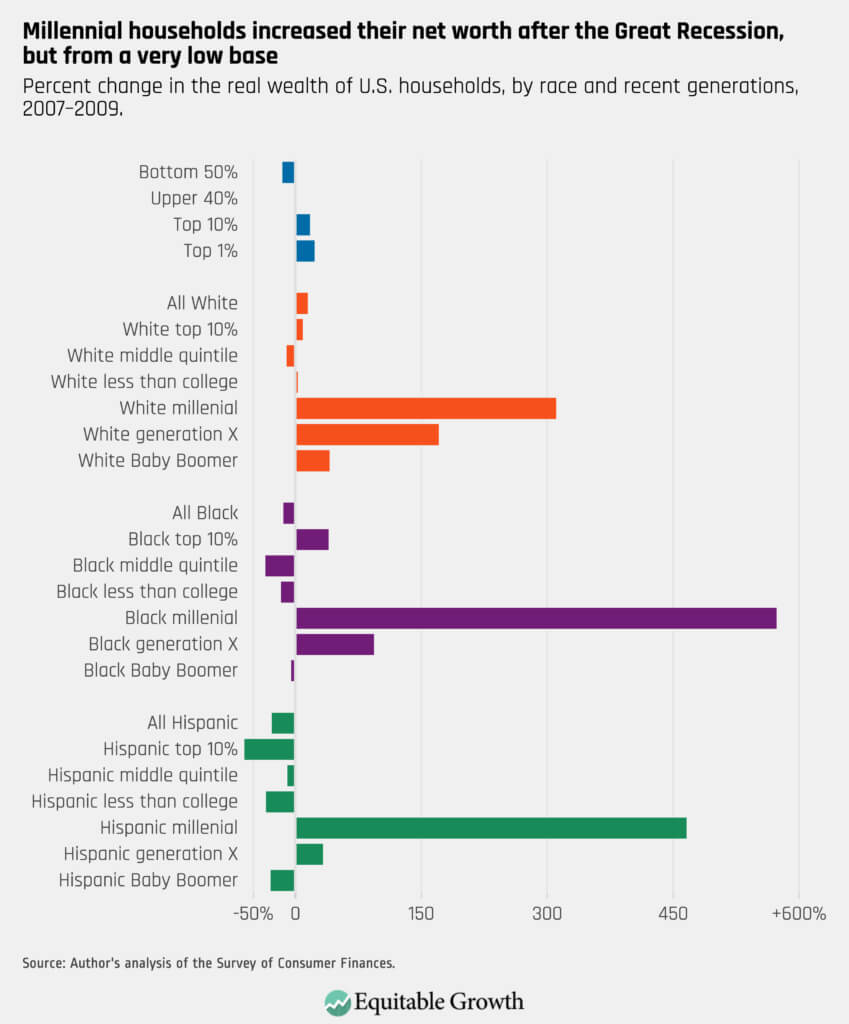
The wealth of many U.S. households is lower entering the coronavirus recession than right before the Great Recession of 2007–2009
Despite the record-long economic expansion of more than 10 years following the Great Recession, many households never fully recovered, pointing to weaknesses in wage growth and in the availability of high-quality jobs that dogged the recovery for nearly its entire length. Notably, millennial households built a considerable amount of wealth during that recovery, but only because they started with very low base levels of wealth, and they had less housing wealth to lose during the Great Recession. (See Figure 8.)
Figure 8
Conclusion
The lessons learned about U.S. household wealth across a variety of measures after the Great Recession demonstrate that the relative paucity of policymaker action after the economic gains from the American Recovery and Reinvestment Act of 2009 fed into the U.S. economy led to an overall weak recovery in U.S. household wealth. Today, that leaves many Americans struggling through the coronavirus recession. And that’s why Congress should not repeat the mistakes made by past Congresses, but rather continue to act forcefully to make sure there is a robust recovery.
Another important takeaway from the data in the Federal Reserve’s 2019 Survey of Consumer Finances is that the huge error bars around Hispanic and, to a lesser extent, Black household estimates of wealth in the graphs above demonstrate how uncertain these estimates become when analyzing the data at the intersection of race and education, age, gender, or other demographics. To support better decomposition of groups, the Federal Reserve should consider instituting oversamples of households of color.
What the coronavirus recession means for U.S. public-sector employment

According to the latest Employment Situation report released by Bureau of Labor Statistics today, the U.S. economy in September added 661,000 nonfarm payroll jobs, reflecting an important slowdown in employment growth. Also known as the Jobs Report, the release shows that the share of 25- to 54-year-old prime-age workers who have a job fell from 75.3 percent in August to 75.0 percent, and the number of unemployed workers who report being on a permanent layoff increased by 345,000 for a total of 3.8 million workers out of 12.6 million unemployed workers in September.
This final Jobs Report before the 2020 presidential election calls into question what policies are needed to foster an equitable and sustained economic recovery in the midst of the coronavirus recession. The report also reflects U.S. labor market conditions more than a month after the expiration of the $600 “plus-up” in unemployment benefits funded through the Coronavirus Aid, Relief, and Economic Security, or CARES, Act. The end of this plus-up is forcing workers to return to work during an uncontrolled pandemic with few other options to support themselves and their families.
As such, there continue to be important income, race, and gender disparities evident in the latest Jobs Report, as well as questions about the quality of jobs being added that underlie last month’s net job gains.
At 7 percent, White workers’ unemployment rate is well-below the 8.9 percent jobless rate for Asian American workers, the 10.3 percent jobless rate for Latinx workers, and the 12.1 percent jobless rate for Black workers. The unemployment rate for women, which was lower than the jobless rate for men just before the onset of the coronavirus recession, stands 0.3 percentage points above it, at 8 percent. Additionally, 865,000 women dropped out of the labor force in September, and therefore are no longer counted among the ranks of the unemployed. Longstanding disparities along the lines of race, ethnicity, and gender continue to be exacerbated amid the tenuous economic recovery.
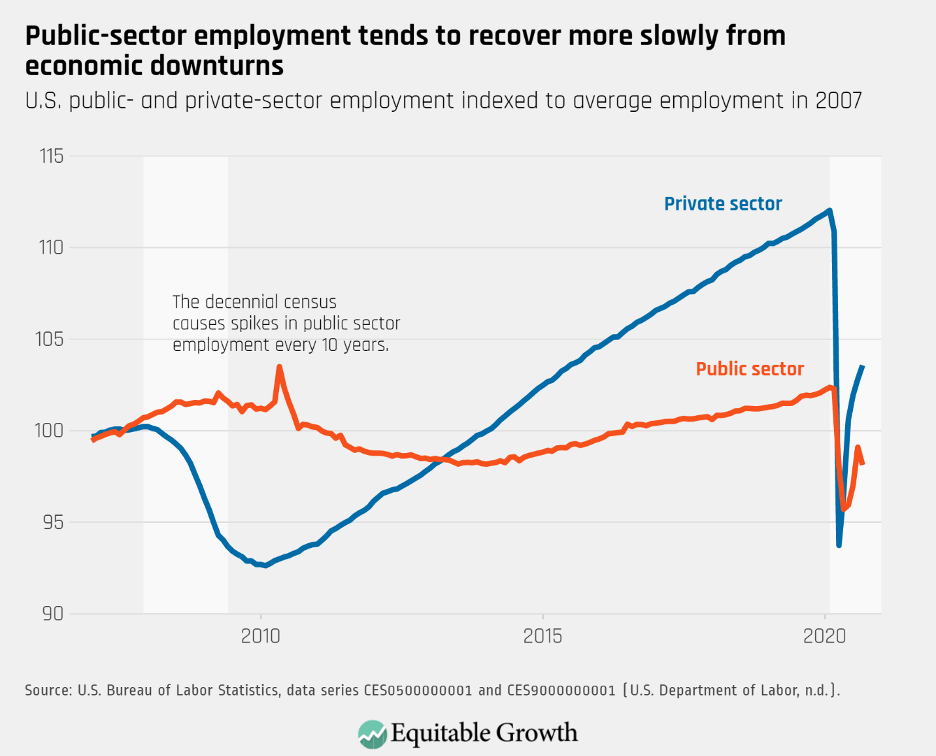
So far, employment losses in the public sector are not as deep as in the private sector, but they are worrying given that government is the only major sector to have experienced net losses last month, shedding 216,000 jobs in September. Additionally, the public sector was exceptionally slow to recover from the previous economic downturn. Even though the private sector also took a harder hit during and immediately after the Great Recession of 2007–2009, jobs were back to their pre-crisis level by March 2014. In contrast, government employment did not fully bounce back until late 2019, excluding a brief spike in 2010 due to hiring for the past decennial Census. (See Figure 1.)
Figure 1
The crisis in the public sector also threatens many good jobs. Government workers tend to be less likely than their private-sector counterparts to experience either job losses or poverty, and have greater access to employee benefits such as healthcare. At 33.6 percent, the union membership rate of government workers is five times greater than for private-sector workers. Since the 1960s, effective enforcement of equal opportunity employment policies and greater political power led to a rise in the share of Black workers holding government jobs, making the public sector an important pathway to economic mobility and security for many marginalized workers.
Over the past few decades, however, public-sector jobs are becoming more insecure and less effective at promoting equitable labor market outcomes—a process that Great Recession of 2007–2009 seems to have accelerated.The past 40 years are marked by a shift from decent to lousy jobs, with both the decline in public-sector job quality and the loss of government jobs through recessions contributing to rising economic inequality. Research by Kimberly Christensen of Sarah Lawrence College, for example, shows that the fiscal crunch faced by state and local governments in the aftermath of the Great Recession was particularly damaging for women workers and workers of color because it shifted employment from good government jobs to much more precarious work in retail, leisure, and poorly paid medical care work.
Even though government jobs used to serve as a buffer against U.S. labor market inequality, their equalizing effect weakened over time. When analyzing racial disparities in the likelihood of being laid off, Elizabeth Wrigley-Field of the University of Minnesota and Nathan Seltzer from the University of Wisconsin-Madison find that Black workers are more likely to involuntarily lose their jobs than White workers, a disparity that has increased since the 1990s. The public sector used to reduce Black workers’ disproportionate exposure to layoffs, but it became less protective over the past three decades, the authors find.
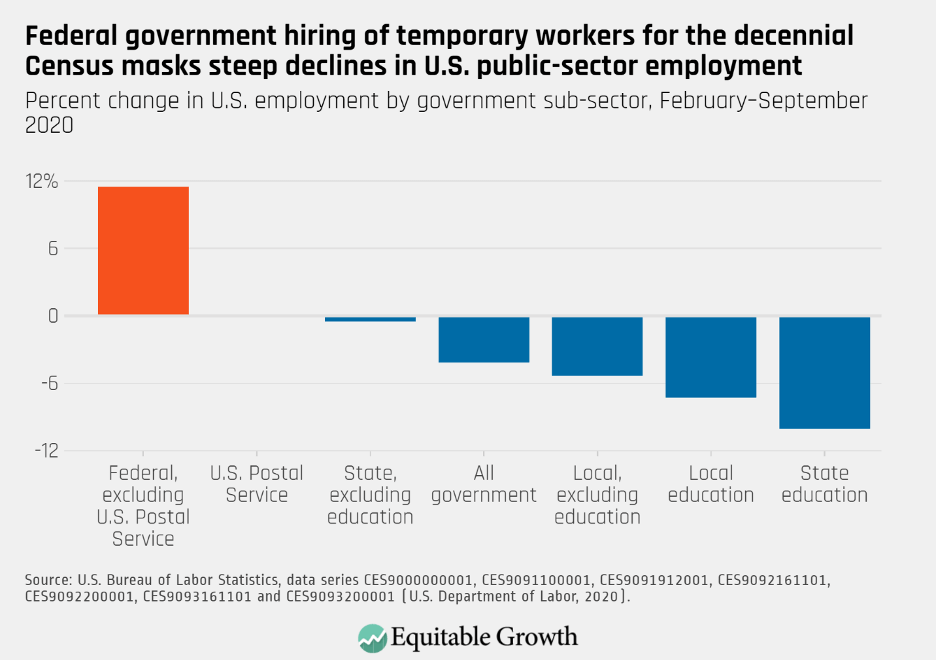
The great majority—63 percent—of public-sector workers are employed in local governments, compared to 23 percent in state governments and 14 percent in the federal government. This means local and state government workers—among whom women and Black workers make up a larger share of the labor force than in the federal government—are once again experiencing the deepest job losses because states are required to keep balanced budgets without debt financing.
In addition to the downward pressure on state and local employment in recessions, the increase in federal employment over the past 6 months is due to this year’s decennial Census staffing. This staffing is now beginning to wind down. (See Figure 2.)
Figure 2
Another slow recovery in the public sector—a sector in which Black workers, women workers, and union members are overrepresented—would put the brakes on the economic security they and their families need to climb out of the coronavirus recession, deepen existing U.S. labor market disparities, and become a drag on the economic recovery, as consumer spending declines as more quality jobs disappear.As state and local governments struggle with deep revenue and budget shortfalls, greater fiscal support to state and local governments is essential.
In addition to the unique risks facing the public sector, the private sector faces challenges to continuing jobs growth as well. These challenges exist in the public sector, too, particularly jobs such as Kindergarten through 12th grade school teachers, but private-sector service jobs that require face-to-face interaction or require close proximity to one’s co-workers during an uncontrolled pandemic means that many of the recent jobs gains remain precarious.
Without sweeping and coordinated public health measures in place and effective treatments and vaccines for COVID-19, the disease caused by the coronavirus, the number of additional jobs gained amid this tenuous economic rebound is fragile, and these jobs remain hazardous. The upshot: This continuing recession is still exacerbating long-term trends of decreasing job quality and rising economic precarity, which are especially harmful to marginalized workers, including Black workers and women workers, and their families, particularly amid a still-lethal pandemic.
Structural racism and the coronavirus recession highlight why more and better U.S. data need to be widely disaggregated by race and ethnicity
Overview
The enduring legacy of structural racism in the United States is not news to the multihued communities of color across our nation. And in these Black, Latinx, Native American, Asian American, Native Hawaiian, and Pacific Islander communities, it comes as little surprise that many of these communities are suffering and dying more from the novel coronavirus and COVID-19, the disease caused by the virus, or that many also are bearing the greater brunt of the job losses and income declines amid the coronavirus recession.
The public health crisis today is especially acute among these communities of color. Black Americans, for example, are dying from COVID-19 at about 1.5 times their prevalence in the U.S. population. Latinx communities are suffering much higher rates of infection. Native Americans living on reservations are dealing with outsized outbreaks of the coronavirus and COVID-19.
In many communities of color, workers and their families, are more likely to be employed in lower-paying jobs with fewer benefits such as paid sick leave and often in jobs on the front lines of the current pandemic. And heightened levels of respiratory disease leave many of these individuals more likely to be infected by the coronavirus—respiratory ailments that are largely attributable to systemic racism that results, for example, from polluting industries and power plants sited in neighborhoods of color. Despite these facts, in the early days of the pandemic, most states were not reporting infections and fatalities by race. Thanks to the efforts of academics and policymakers who sounded the alarm early, racial breakdowns of coronavirus’s effects are now widely available.
Structural racism and the coronavirus recession highlight why more and better U.S. data need to be widely disaggregated by race and ethnicityDownload
Then, there are the already wide economic divides in homeownership, income, and wealth between Americans of color and White Americans, which may be growing wider due to the convergence of these crises in 2020. Add in the enduring police killings of unarmed Black victims—also no surprise to Black Americans—and the ensuing protests are now drawing the acute attention of our nation on the many ways that systemic racism persists in the modern-day United States.
Discrepancies in economic outcomes by race and ethnicity have long been known, but the coronavirus recession is putting a spotlight on the unique ways that the U.S. economy fails these groups amid economic downturns often further marked by racial repression. Alas, this spotlight is not matched by the collection of widely disaggregated data by race and ethnicity by federal government statistical agencies. And, as a result of attention garnered by the ongoing police killings of Black Americans, more data are likely to be demanded on issues of systemic racism in our society, just as the coronavirus recession is sparking new data-gathering demands.
This issue brief details the steps Congress and executive branch agencies can take to improve our understanding of economic and social outcomes for all communities of color. There are many ways the economic statistical agencies could improve data collection, provide more analysis of racial economic divides, and alter the presentation and publication of statistics to better inform policymakers on the needs of marginalized communities. This issue brief focuses on three concrete policy actions that could be taken now with a focus on oversampling in existing federal surveys:
- Provide funding for the U.S. Census Bureau and the U.S. Bureau of Labor Statistics to perform an oversample of Black, Latinx, Native American, and AANHPI populations, and to provide cash incentives to respondents if necessary, in the monthly Current Population Survey and the Annual Social Economic Supplement
- Request that the Federal Reserve consider oversampling Black, Latinx, Native American, and AANHPI populations in its Survey of Consumer Finances
- Direct the Government Accountability Office to study the feasibility, desirability, and cost of instituting oversamples for these groups in other surveys conducted by federal statistical agencies
Our current socioeconomic state of affairs is bleak, but it is no worse in aggregate than what so many communities of color have faced for generations. Current statistical surveys already show clear divides in unemployment rates and income levels by race and ethnicity across our nation, with the aggregate metrics indicating that many Black Americans live in a nearly permanent recession, and that overall, communities of color experience more frequent and prolonged periods of recession. By providing the means to more finely disaggregate data, policymakers can better understand the consequences of structural racism and the coronavirus recession today so that they can design policies that result in more equitable economic recovery attuned to the specific needs of all Americans.
Better data on communities of color are important to socioeconomic research and policymaking
The Current Population Survey and the Annual Social Economic Supplement, or ASEC, play a critical role in economic research. The monthly CPS is the foremost survey for understanding labor attachment (economic parlance for workers’ engagement in the jobs market) and is available at a higher frequency than most other surveys. The ASEC supplement to the Current Population Survey is the most commonly used source of income data for many researchers and includes much more detailed income reporting than the U.S. Census Bureau’s annual American Community Survey. And the Federal Reserve’s Survey of Consumer Finances is the most commonly cited survey for the measurement of wealth in the United States and the primary source of data on the Black-White wealth divide.
But the sample populations of these surveys do not support analyses of racial and ethnic segments of the population by age, gender, or geographical location without significant error. Oversampling is a survey technique where certain populations are sampled at a comparatively high rate, compared to their prevalence in the population, so they are overrepresented in the final survey sample. Oversampling communities of color can aid in uncovering the different economic and social experiences of Americans of different demographic groups by providing a granular view of key economic variables—and taking into account generational changes within these communities over time as well.
Oversampling for these data will also help target ongoing policy needs. The Coronavirus Aid, Relief, and Economic Security, or CARES, Act of 2020, for example, provided more than a trillion dollars in rebates alongside Pandemic Unemployment Assistance that proved pivotal to helping low-income households survive the first wave of the coronavirus recession while keeping the U.S. economy running. This aid was crucial, but the money could have boosted the economy even more strongly if we had the data to target it more efficiently.
Oversamples of particular racial and ethnic groups are a cost-effective way to make the analyses of small U.S. subpopulations viable in these surveys. Increasing the sample size of these surveys indiscriminately would inflate their costs and provide still more detail on populations that are already well-covered. Oversamples allow researchers and policymakers alike to zoom in on subpopulations whose economic experience is not well-represented by the aggregate data and learn more about the specific ways some groups are being left behind in our economy.
Disaggregated data shape how we view and manage the economy
The data that federal agencies choose to collect and the ways in which they release that data can have significant impacts on economic narratives and economic policymaking. As Rhonda Sharpe of the Women’s Institute for Science, Equity and Race writes, “If the data are collected and reported without taking a true diversity of experiences into consideration, it can’t be used to create a more inclusive society.”
Earlier this year, Equitable Growth published a working paper that finds the tone of economic news is uncorrelated to the fortunes of the bottom 90 percent of income earners, after controlling for income changes among the top 10 percent. The researchers blame this elitist tone on the outsize emphasis that reporters place on aggregate GDP growth, which does not represent the fortunes of most Americans and yet is released frequently and widely regarded as perhaps the most important economic indicator.
To the credit of the federal statistical agencies, many of their most notable economic releases provide racial breakouts. The Census Bureau’s Income and Poverty report, for example, provides extensive disaggregation by race. And the Bureau of Labor Statistics’ monthly Employment Situation Report provides White and Black unemployment figures alongside overall unemployment in the press release.
But there are limits to the existing data. Although these and other current surveys are sufficient for gleaning disaggregation by race and often for deciphering the intersection of race and gender, the data on smaller subgroups come with large amounts of uncertainty. Users may want to look at race at the intersection of occupations and industries, for example, or at subgroups within race groups that experience particularly poor labor market outcomes, such as young Black males. The appendix at the end of this brief gives some examples of the level of error that analysts face when working with some of these subgroups in the Current Population Survey and Survey of Consumer Finances.
The case for oversampling in surveys
Survey data are incredibly important sources of information for academics, the policy community, and journalists alike. In addition to their distribution by federal agencies, large surveys like the CPS and the SCF power public resources like the Prosperity Now Scorecard and PolicyLink’s National Equity Atlas, which provide invaluable snapshots of economic progress across geography, race, gender, and other demographic groups.
But surveys suffer from a significant drawback for analysts who want to study subgroups of the population. Sample sizes in most surveys are insufficient for disaggregation of subgroups of the population. Oversampling in these surveys would make it possible for analysts to study a much wider array of outcomes for subgroups of workers and communities from the Black, Latinx, Asian American, Indigenous American, Native Hawaiian, and Pacific Islander populations.
There is precedent for oversampling. The Current Population Survey’s Annual Social Economic Supplement currently features two existing oversamples: an oversample of Hispanics and an oversample of households with children under age 18, which was instituted to make it possible to reliably analyze the effects of the State Children’s Health Insurance Program at the state level. This latter oversample was instituted by Congress in 1999 in that year’s consolidated appropriations act. 42 U.S.C. § 1397ii contains the relevant language for expanding the sample and could provide a guide for implementing future expansions.
These two surveys are especially good targets for an expansion of sampling. The Current Population Survey, first administered in 1940, is the workhorse survey of economic statistics in the United States. It is one of the few surveys that is administered monthly with a nationally representative sample. IPUMS, a project of the Minnesota Population Center at the University of Minnesota, puts an enormous amount of work into standardizing CPS data between years and making it available to anyone. There are now nearly 5,000 new users per year for its CPS portal. Its users create more than 30,000 data extracts annually, according to IPUMS.
Additionally, the full microdata for the CPS survey are released by the Census Bureau about a month after the survey’s reference week, making it easy for anyone to access the survey results and perform their own data analysis. Largely through the efforts of nongovernment analysts, CPS data are a critical window into the labor force attachment and income of non-Hispanic Black workers. Its yearly rotation group schedule also provides 1 year of panel data that is rare for economic surveys.
Because it is issued monthly, CPS is the most important tool we have for understanding the impacts of recessions as they are happening. The monthly CPS is being widely used by academics right now to understand the early phases of the coronavirus recession.
Michelle Holder of the City University of New York, who literally wrote the book on economic outcomes for Black males during the Great Recession, told us that although her work showed that Black males ages 16 to 24 appear to have had the highest unemployment rate of all major sex-race-gender combinations during the early stages of the Great Recession, CPS sample sizes are too small to reliably characterize levels and trends in this group. In the Appendix, we show that 95 percent confidence intervals (statistical parlance for the likely range of an estimate) for this group can have a range of around 10 percent, compared to just a percentage point or two for the same analysis for White respondents. Analyses of racial disparities in unemployment at the state level are similarly hindered by sample sizes in the CPS and generally require averaging 3 months or more of data together.
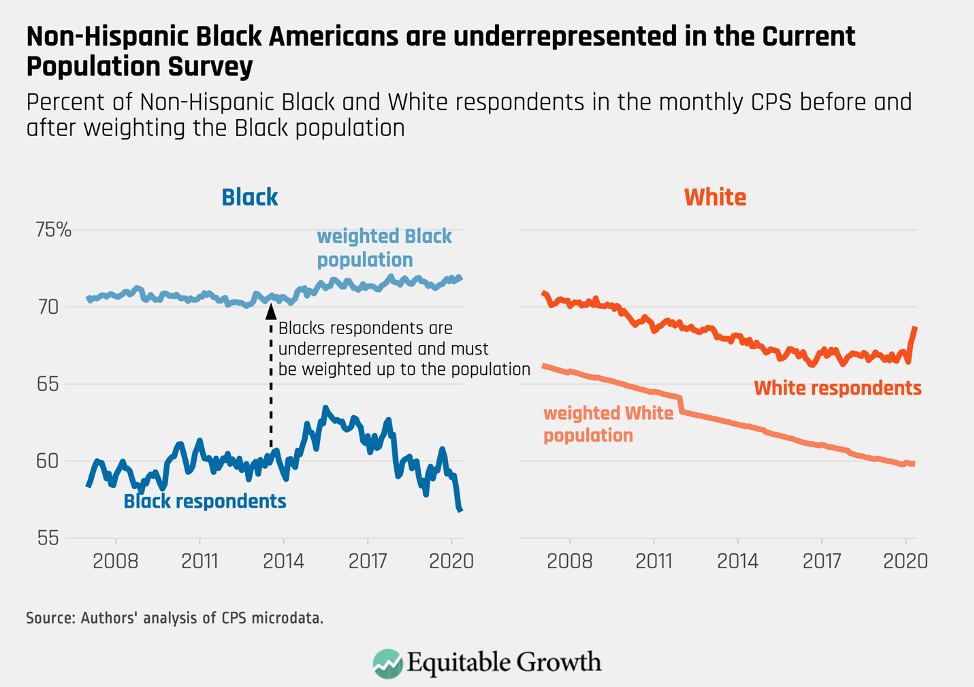
Non-Hispanic Black workers are, if anything, underrepresented in the CPS, as they now routinely represent a lower percentage of respondents to the survey than they are in the population. This underrepresentation can be even more severe for Black respondents of certain ages or education levels, making it more difficult to examine these relatively small groups. Some of these education-level and age subgroups are less likely to respond to surveys, and statistical agencies should also explore the possibility of paying respondents to fill in demographics that are not well-represented. (See Figure 1.)
Figure 1
Then, there’s the Federal Reserve’s Survey of Consumer Finances, which is conducted every 3 years. This survey is the data source for virtually all analyses of levels and trends in wealth in the United States. It is essential in helping economists and policymakers alike understand the size of the Black-White wealth divide. Just as with economic outcomes for income and unemployment in the Current Population Survey, the SCF demonstrates that when it comes to wealth, many communities of color face a very different economy than White Americans. And, in the case of wealth, the deprivation Black Americans face is based on a well-known and explicitly racist policy history.
But the Survey of Consumer Finances suffers from many of the same problems as the Current Population Survey. The SCF does have an existing oversample of high-wealth respondents, which is important because a significant amount of wealth is concentrated in a small number of households, and it is difficult to survey high-wealth households. But this is also effectively an oversample of White people, who are far more likely to have high levels of wealth.
Although measures of wealth are available in other surveys (including the Survey of Income and Program Participation, which has oversampled both Black people and Hispanics in its low-income oversample), the SCF is the gold-standard survey for understanding wealth in the United States and collects data on a much larger number of wealth categories than anything else available. Like analysis performed with the CPS, data from the SCF quickly becomes unreliable when subgroups of respondents in a single community of color are selected for analysis.
Administrative data cannot replace surveys
Economists are increasingly relying on administrative data instead of survey data for a number of reasons. Administrative data often consist of a much larger sample of people (sometimes virtually all participants in the U.S. economy) and are therefore ideal for disaggregation of small subgroups. They sometimes collect more detailed information than surveys do, may be less subject to misreporting, and, in some cases, can be observed on a very short lag at a high frequency.
But administrative data have many drawbacks. First of all, administrative data cannot replace surveys for many kinds of more immediate analysis. In the case of government administrative data, many datasets are not available until 2 years after the fact or longer. Secondly, gaining access to these datasets takes time and requires an application, which often means well-resourced researchers are advantaged by this application process. Finally, working with these datasets requires significant and uncommon data expertise. It is therefore not a viable option for many analysts.
A case in point is the IRS’s tax data, taken directly from tax returns. These data are, in many ways, the gold standard of analysis for most forms of income in the United States. But it is slow, arriving more than a year after the calendar year it documents. These data also lack racial demographics and must be merged with other sources to study race.
Private administrative data, such as credit card expenditures from banks or scheduling software data from Homebase or other human resources firms, are likewise often only accessible to a small group of researchers, either because access must be negotiated or purchased. Additionally, private administrative data often represent a particular subgroup of the population that may not be representative of all Americans.
Because both federal and private administrative data are often available only to a select group of academic economists, the researchers who can obtain access to these data resemble the demographics of the economics profession. Case in point: Just 3 percent of Ph.D.s are awarded to Black graduates, and little progress has been made toward diversity over the past two decades. If the researchers who have access to these gold-standard forms of data are largely White and male, then important perspectives on the data may be missed, especially when it comes to racial discrepancies.
Because of these pitfalls, administrative data are not a solution to the problem of racial disaggregation in surveys. Administrative data allow for the analysis of very small subgroups of the population because the reach of the data is so vast. But there is reason to believe that the researchers who have access to these data may not be as diverse as the profession at large. Expensive private datasets are not accessible to many researchers, and delays in the release of federal administrative data mean surveys are sometimes the superior tool, even when a researcher has access.
Properly resourcing statistical agencies
Instituting these oversamples will not be free, but the small investment they would require would be well worth it. The Census Bureau has requested just $67 million for the Fiscal Year 2021 collection of the Current Population Survey and the Survey of Income and Program Participation. These surveys are the backbone of our economic statistical infrastructure and are responsible for an enormous amount of academic research about the U.S. economy.
Similarly, a recent report by the Bureau of Labor Statistics suggests that fielding a new cohort for the National Longitudinal Survey would cost just $50 million over 5 years (two previous cohorts of this survey oversampled both non-Hispanic Black people and Hispanics). As The Brookings Institution notes, federal data collection is a very modest investment with enormous returns.
Unfortunately, federal statistical agencies are often seen as less important than other federal priorities and thus are frequently subject to cuts or freezes in funding. These cuts mean these agencies must conduct surveys infrequently, accept less accurate or less frequently released statistics, and, in some cases, halt certain types of economic data collection altogether.
Small investments in the statistical agencies can have outsize impacts, giving us access to new insights about the U.S. economy. Those insights can change narratives and shape policy. Instituting new oversamples in existing surveys must be matched by budget commitments that will allow the statistical agencies to adequately carry out their jobs.
Oversampling would capture disparities in the U.S. economy
Amid the coronavirus recession, continuing high unemployment and depressed consumption could take years to overcome, especially for those workers and their families who are suffering the most devastating labor market disruptions in communities of color across the nation. Although the release of the employment situation report for May 2020 contained some positive news for unemployment in aggregate, many analysts noticed that despite a dramatic recovery in employment for workers overall, unemployment for Black workers was essentially unchanged, increasing by 0.1 percentage points, a statistically insignificant change. This remarkable discrepancy occurred against the backdrop of protests over the police killings of George Floyd, Breonna Taylor, and others—protests that are highlighting anew the structural racism in our society.
Indeed, economic outcomes for Black Americans are so consistently depressed when compared to outcomes for White Americans that virtually any economic observer can tell you right off the top of their heads what the ratio of Black unemployment to White unemployment is: about 2. This has been generally true in good times and bad since we first started measuring Black unemployment in 1972. (See Figure 2.)
Figure 2
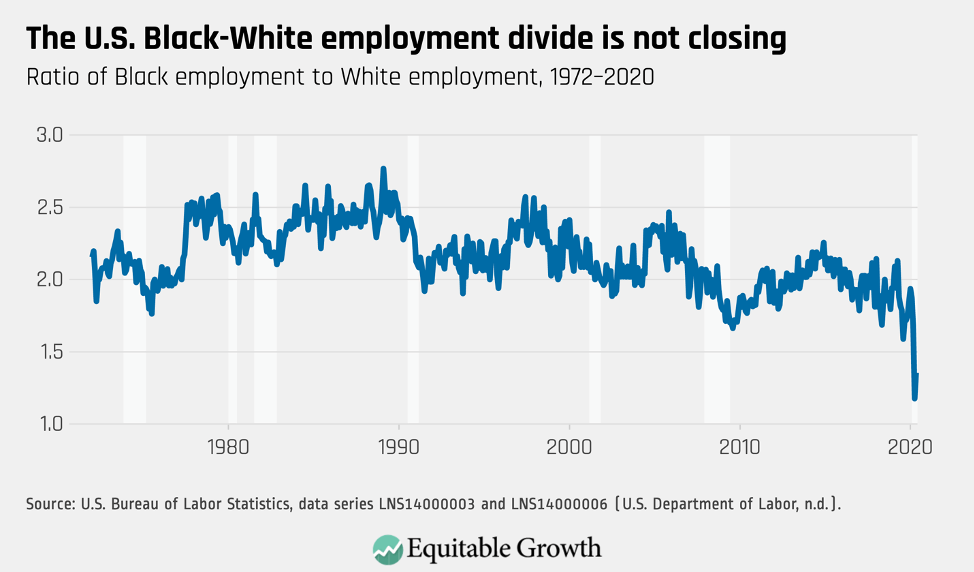
Because Black workers are disproportionately employed in essential, face-to-face jobs—think bus driver or grocery clerk—they have fared a bit better in this recession, relative to other groups, than they have in the past. But while their jobs have been spared a bit more than usual in recessions, their lives are more likely to be on the line. The unusual nature of this recession underscores the need for an oversample that will allow analysts to divide workers of a single race by occupation, gender, and age. All of these groups are experiencing the coronavirus recession in distinct ways.
The same persistent divides can be observed across many other economic variables, including income and wealth. As the country grapples with the legacy of slavery and ongoing systemic racism, economists and policymakers should consider why these divides persist despite the commonly held belief that today’s labor market is less discriminatory. Policing and criminal justice is far from the only domain where systemic racism causes significant harm to the Black community, although research shows that discrimination in the criminal justice system is closely tied to poor labor market outcomes for people of color.
Economists, in particular, must do some soul searching. Most economists are blind to the importance of racial discrimination in their research due to the economic models they employ that largely do not account for racial discrimination. As researchers in the field of stratification economics point out, existing theories of discrimination in the U.S. labor market cannot account for persistent, decades-long divides in economic outcomes between races. Classic models of racial discrimination predict that the free market will adjust and eliminate discrimination, but we haven’t seen this in practice.
Research shows, for example, that job applicants with “Black-sounding” names receive 50 percent fewer invitations to a job interview than those with “White-sounding” names. The researchers find that this is true across industries and employers. Black and Latinx workers who apply for jobs in person are significantly less likely to receive callbacks than White applicants. Similarly, research shows that Black men have to spend more time looking for work and are more likely to have unstable work histories.
The problem is especially acute now. Research shows that Black workers and their families are more affected by recessions. As a group, Black communities experience a deeper recession than others and are likely to be slower to fully recover from a recession than other groups. Amid the coronavirus recession, the losses of jobs among Black workers are, so far, less dramatic, but Black workers are more exposed to the coronavirus and COVID-19 because of their prevalence in front-line professions. This brief is not intended to summarize the many, many ways that Black people experienced the economy differently from White people, but this fact has been extensively documented.
Latinx, Native Americans, Asian American, Native Hawaiians, and Pacific Islanders likewise have their own distinct economic characteristics that are not well-represented by economic aggregates, and these groups also face unique challenges during the coronavirus recession. Latinxs suffer from much higher infection rates and are likely to be in front-line occupations. Native American reservations are dealing with severe outbreaks of the coronavirus. And Asian Americans are facing discrimination and harassment due to racist conspiracy theories about the origins of the virus. Knowing more about these populations of Americans is difficult because existing data sources for these highly heterogeneous groups are lacking, which is why they merit more granular analysis.
Oversampling needs to be accompanied by revamped survey instruments
Oversampling is only a first step in trying to create a federal statistical infrastructure that meets the needs of Black communities and other underserved communities of color. It will also be necessary, in some cases, to rethink survey instruments. The U.S. Census Bureau had planned to change its two-part race and ethnicity questions, which includes a question that asks the respondent if they consider themselves Hispanic and a separate question to indicate whether the respondent considers themselves Black, White, or another race. Census Bureau research found that a new one-question design would have a number of benefits.
Although this change was initially planned for the 2020 Census, the Census Bureau ultimately decided against it, in keeping with the White House Office of Management and Budget’s standards for race and ethnicity in federal data. This decision should be revisited, and OMB should revisit these standards. The one-question design that Census planned has a number of benefits.
Other subgroups cannot be found in the Current Population Survey data at all. There is no option, for example, for a respondent to indicate that they are of Middle Eastern descent. These respondents will generally just indicate that they are White. The result is that Americans of Middle Eastern descent simply can’t be analyzed: They are invisible in our most important economic survey.
Similarly, there are no questions about sexual orientation and gender identity in the CPS or the SCF, making it impossible to analyze these populations. These questions are present in the American Community Survey, and there is good reason for analysts to want to study these groups. Some may face economic discrimination or otherwise have unique experiences in the economy. Encouragingly, investigations into the possibility of identifying these communities by the Census Bureau are feasible.
Conclusion
The policies discussed in this brief are just a small first step toward better economic data coverage for marginalized groups. But ongoing protests against systemic racism and the unique ways that the coronavirus recession is harming Black, Latinx, Indigenous, Asian American, Native Hawaiian, and Pacific Islander communities makes it urgent that federal statistical agencies attempt to make changes that will give economists and policymakers better insight into their economic health now. Providing funding and direction to our statistical agencies will have a lasting impact on our ability to serve these communities. We are advocating three specific actions that could be taken now that would significantly enhance our ability to disaggregate economic data by race.
- Provide funding for the U.S. Census Bureau and the U.S. Bureau of Labor Statistics to perform an oversample of Black, Latinx, Native American, and AANHPI populations. The size of such oversamples should be selected to allow for reasonable disaggregation along the lines of race, age, and gender for Black and Latinx populations. For smaller populations, such as Asian Americans and Pacific Islanders, oversamples should allow analysis at the intersection of race and gender. Congress should also provide funding so the Census Bureau can give cash incentives to populations that are difficult to survey in the monthly Current Population Survey and the Annual Social Economic Supplement.
- Request that the Federal Reserve consider oversampling Black, Latinx, Native American, and AANHPI populations in its Survey of Consumer Finances. The size of the oversample should reflect the importance of understanding Black wealth by generational cohorts.
- Direct the Government Accountability Office to study the feasibility, desirability, and cost of instituting oversamples for these groups in other surveys conducted by the federal statistical agencies. This brief covers two very important economic surveys. But there are a number of other federal data collection efforts that would be well-served by oversampling underrepresented populations. The GAO can identify some of these needs to help guide future congressional action.
—Austin Clemens is a computational social scientist at the Washington Center for Equitable Growth. Michael Garvey is a macroeconomic policy analyst at the Washington Center for Equitable Growth.
Appendix: Standard errors in the Current Population Survey and Survey of Consumer Finances for some sample populations
This appendix demonstrates that in the two major surveys discussed in this brief, sampling errors for communities of color are large. We focus on Black Americans, but the same findings apply to Latinx, Native American, and AANHPI communities, the latter of which is where this problem is even more pronounced because they make up a small portion of the population. Even a significant oversample is unlikely tell us much about small subgroups within the AANHPI population, but it could make it possible for us to look at large subgroups, such as male and female.
The CPS surveys about 60,000 households each month. In March, the Annual Social and Economic Supplement surveys about 100,000 households. These sample sizes are sufficient for studying outcomes for all non-Hispanic Black Americans and gender divisions within the Black community. But at the level of a particular age group of Black Americans, or for Black workers in a specific set of occupations or industries, the error on monthly estimates becomes large. Analysts can mitigate this issue by aggregating multiple survey periods at the expense of timeliness.
To demonstrate the approximate amount of uncertainty in subgroups that might be interesting to researchers, we created standard errors for various point estimates in the monthly CPS and the ASES using bootstrap methods suggested by the Bureau of Labor Statistics. The BLS suggests applying a bootstrap and making a design-effect adjustment to account for the complex design of the survey. They recommend multiplying variances for unemployment totals by 1.6 and all other population estimates by 1.3. Because the CPS has a complex sampling frame, the resulting survey estimates are likely biased.
A basic statistic that is followed closely by economic observers is the employment-to-population ratio: the number of people who are employed divided by the total population of working-age adults. Ninety-five percent confidence intervals for this measure for the whole population have a range of less than 1 percentage point.
Young males are a subgroup where calculating the employment-to-population, or EPOP, ratio is important. Constructing estimates over time shows that the confidence intervals around our point estimates of EPOP for young White males consistently have a range of about 3 percentage points. For young Black males, the range is around 7 percentage points, occasionally reaching 8 percentage points. (See Figure 3.)
Figure 3
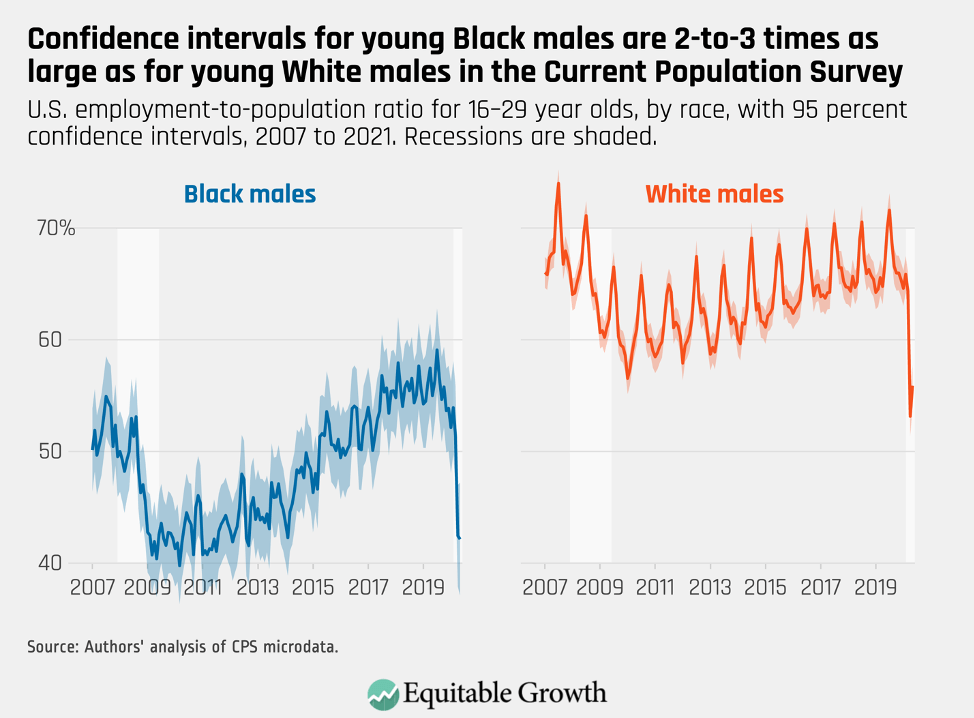
Even without confidence intervals, the lower reliability of estimates for Black males can be seen simply by looking at the trendline. The White employment-to-population trendline exhibits a stable pattern of seasonal differences with long-term trends responsive to the business cycle. The corresponding Black trendline is unstable, and any month-to-month difference is more likely noise than trend, making it difficult to know if the EPOP ratio for this group increased or declined in any given month.
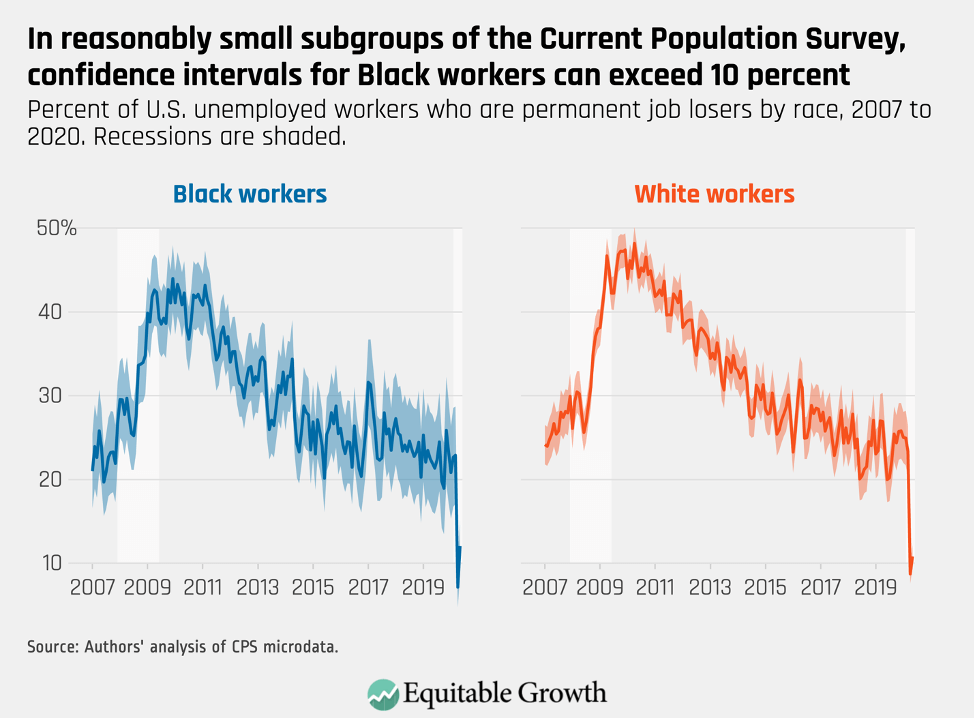
Young males are an entirely plausible population on which analysts might want to focus and are not a particularly small subgroup. Analysts also might be interested, for example, in analyzing only the unemployed population. As the coronavirus pandemic recession drags on, we might want to know what proportion of the unemployed permanently lost their jobs instead of going on furlough or other options.
This population is much smaller and splitting the data by gender or age is not practical. Figure 4 shows the proportion of the unemployed that are permanent job losers, by race. Both lines are unstable, but confidence intervals for Black workers often exceed 10 percentage points. They are a more manageable 4 percentage points for White workers. (See Figure 4.)
Figure 4
A bit more than 6,000 families are surveyed for the Survey of Consumer Finances, which is conducted every 3 years. The survey’s microdata include five implicates (statistics speak for separate observations) for each respondent to allow analysts to account for imputation error, and a set of replicate weights is also provided to account for sampling error. To show the approximate levels of error that might occur in analysis of SCF data, we replicate calculations of homeownership by age cohort published by one of the authors of this issue brief and Equitable Growth Visiting Fellow John Sabelhaus.
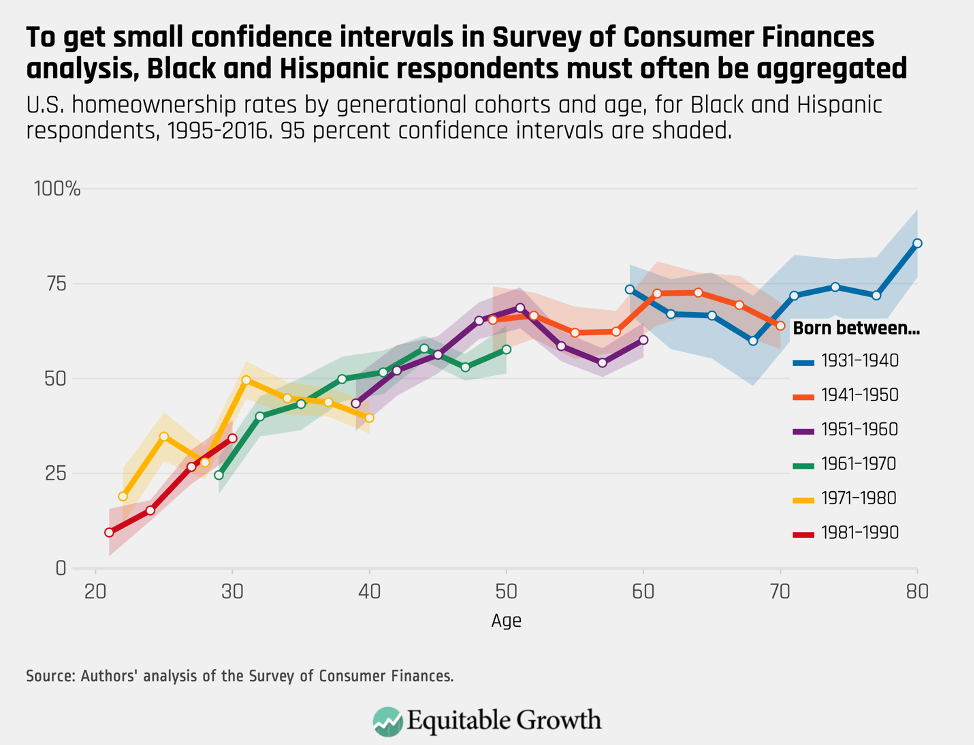
Sabelhaus and Clemens show that successive generations have experienced lower rates of homeownership within several subgroups. An example of such an analysis by Sabelhaus and Clemens groups Black and Hispanic respondents to increase sample size and plots homeownership in each of the surveys between 1995 and 2016, with respondents broken out by year of birth. At the same age, younger cohorts tend to have lower rates of homeownership than older cohorts. (See Figure 5.)
Figure 5
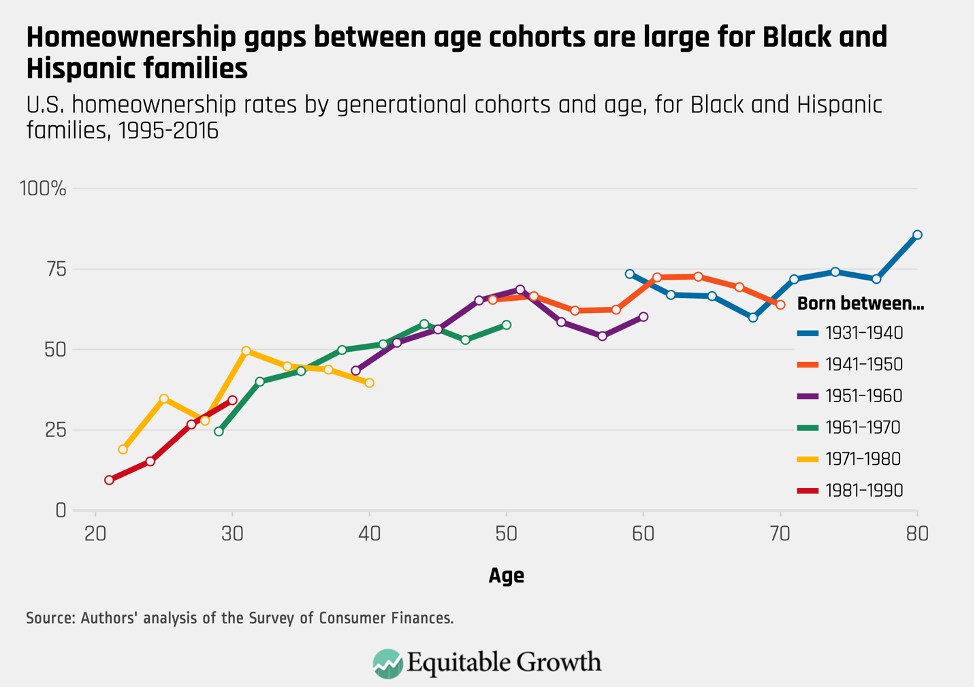
Grouping Black and Hispanic respondents is necessary. Below, we show the same graph with 95 percent confidence intervals for each point estimate. Although some of the gaps between cohorts appear to be statistically significant, many do not reach a 95 percent level of confidence. (See Figure 6.)
Figure 6
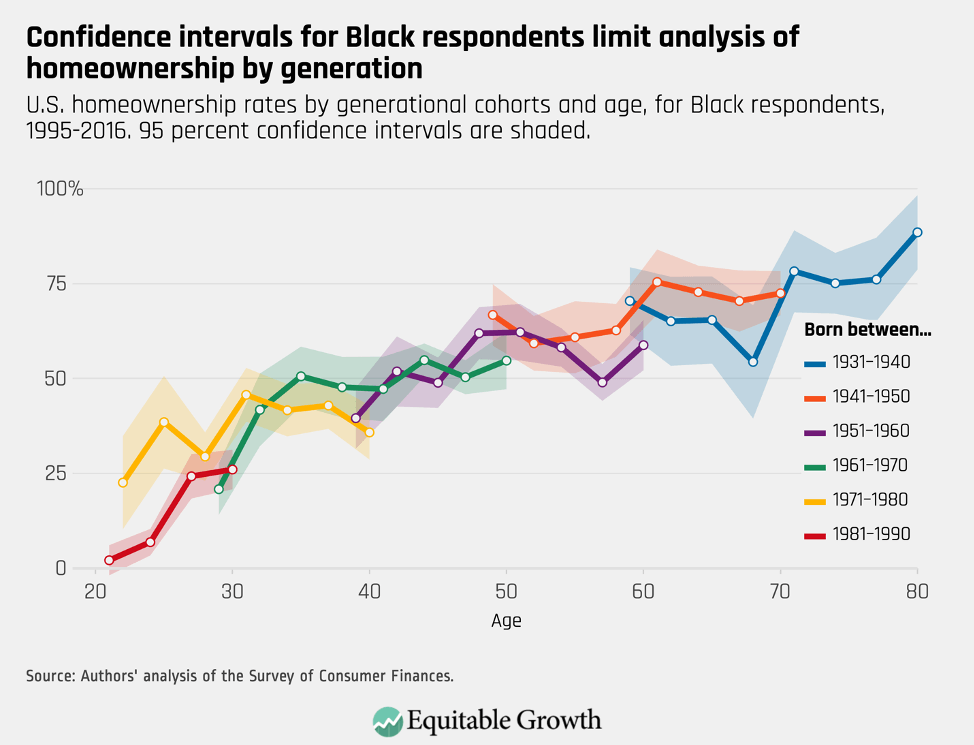
By contrast, the situation for Black respondents alone is intractable. Confidence intervals are large, with ranges exceeding 20 percentage points in several instances. Analysis of subgroups of this size is essentially impossible. (See Figure 7.)
Figure 7
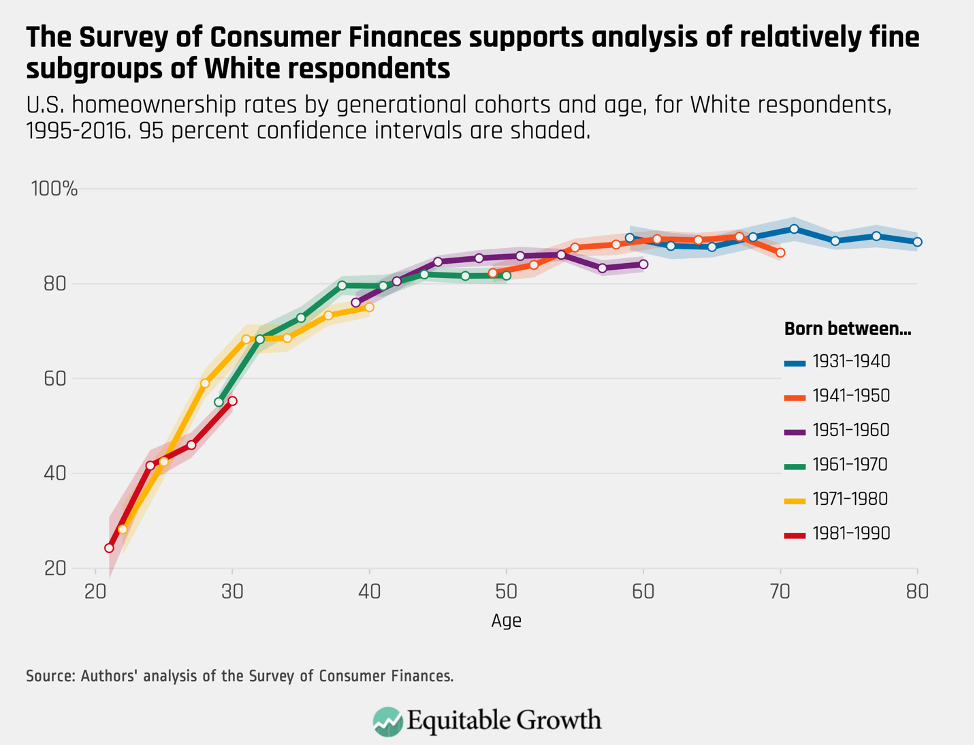
As with the CPS, Black and Hispanic families are, if anything, undersampled in the survey, because the SCF’s oversample of wealthy families tips the racial composition heavily toward White families. Below, we show that the exact same analysis for White respondents produces tight confidence intervals of just a few percentage points. Even though the gap between homeownership at age 40 for older and younger Gen Xers is only about 4.5 percentage points, this difference is statistically significant. (See Figure 8.)
Figure 8
Main Street’s workers, families, and small businesses are now suffering as Wall Street prospers from policies to fight the coronavirus recession

Overview
In San Antonio, 10,000 cars lined up to get bags of groceries from a local food bank, waiting hours in the heat for help.1 In New Orleans, advocates chained themselves together outside of the city courthouse to prevent landlords from finalizing evictions.2 In New York City, more than one-third of small businesses may be closed forever.3 And across the United States, more than 190,000 lives have been lost to COVID-19, the disease caused by the novel coronavirus, as of early September.4
But while these economic and health crises unfold in cities and towns across the country, a slice of the U.S. economy continues to thrive, insulated from upheaval, or even benefitting from it. The S&P 500—an index of 500 major publicly traded companies in the United States and a benchmark for gauging the health of the U.S. corporate sector—is up more than 5 percent in 2020, as of September 9. The index has not only fully recovered to its pre-pandemic level but, in fact, has hovered around the all-time high.5
Main Street’s workers, families, and small businesses are now suffering as Wall Street prospers from policies to fight the coronavirus recessionDownload
Leading the way is Apple Inc., which saw its market capitalization double in just 2 years and was the first company in U.S. history to be valued at $2 trillion.6 Bond issuances by U.S. companies—the way most medium- to large-sized firms fund themselves, by issuing debt—have also soared to an all-time high in the second quarter of 2020.7 This occurred after the U.S. bond market hit a prior high of debt-raising in the previous quarter.8 Companies issuing both the most credit-worthy investment-grade bonds and those issuing less credit-worthy “high yield” or “junk” grade bonds have been able to raise money fairly cheaply to get through the cash crunch caused by declining revenue during the coronavirus pandemic and ensuing recession.9
How did the fates of working people—facing death, hunger, displacement, and joblessness—and small businesses facing permanent closure become so disconnected from the fates of large corporations? Why isn’t the abundance channeled via U.S. financial markets to those at the top of the wealth and income ladders in the United States translating to security for most individuals and families? The answer is evident most immediately in the policy choices made during the coronavirus recession but also in policies enacted in the decades before the U.S. economy hit this particular shock.
This issue brief details what’s happening today on Main Street among our nation’s workers, their families, and our small businesses. It then explains why much of Wall Street remains insulated from the economic suffering happening across the Main Streets of our nation, and how policy decisions made over the past 40 years have produced these outcomes by design. It concludes with some key lessons about why policymakers not acting aggressively and consistently during and after the Great Recession of 2007–2009 harmed Main Street in many prolonged ways—lessons that, in 2020, seemed to have been learned, based on policymakers’ initial actions at the onset of the coronavirus recession but which increasingly fade as the fates of Wall Street and Main Street diverge.
To avoid another prolonged recession and tepid economic recovery, policymakers need to realize that Main Street needs to come first. Those policy tools are available and tested. They need to be deployed.
Individuals, families, and small businesses are on the edge
Individuals, families, and small businesses are on the edge of a cratering economy. The unemployment rate was 8.4 percent, as of August 2020, higher than at many points during the Great Recession of 2007–2009.10 While overall unemployment numbers have improved from their peak earlier this year, there’s been a surge in the number of permanent job losses, as temporary layoffs transition to lasting cuts.11 Food insecurity is rising, especially in households with children.12 Thirty million to 40 million people may be at risk of looming evictions, marking the most severe housing crisis in modern U.S. history.13 Small businesses everywhere are shuttering, and many of them may be closed for good.14 Public health data indicate that growing numbers of people are experiencing mental health challenges such as depression, anxiety, substance abuse, and suicidal ideation.15 And all of these trends, like COVID-19 itself, disproportionately harm people of color, especially Black, Indigenous, and Latinx individuals and families.
The good news is that this suffering is not inevitable. Policymakers have the tools to support individuals and families and to prevent a wider macroeconomic downturn if they choose to do so. In fact, actions taken by lawmakers in the spring and early summer as the pandemic spread across the country reduced the harm faced by most workers and their families and at least some small business owners. But that protection began to wane beginning at the end of July as various coronavirus aid programs expired. The renewed harm now facing many workers, their families, and small businesses will become more and more permanent if policymakers don’t act again soon.
Researchers at the Center on Poverty and Social Policy at Columbia University find that the Coronavirus Aid, Relief, and Economic Security, or CARES, Act, kept 12 million people out of poverty.16 Other research from former Equitable Growth Steering Committee member and Harvard University researcher Raj Chetty, leading the Opportunity Insights team, produced research showing that the “recovery rebates” (also known as direct payments) provided to individuals and families alongside enhanced Unemployment Insurance helped households in the poorest ZIP codes maintain necessary spending.17
The same is true for housing stability. ProPublica, the investigative news organization, reviewed filings in local court records in more than a dozen states over the course of months, finding that evictions dropped substantially in properties covered by the CARES Act’s federal eviction moratorium.18 All of these findings, however, are either largely expired or greatly diminished. Most of the one-time, direct relief $1,200 checks were spent many months ago, enhanced unemployment benefits ran out at the end of July 2020, and significant uncertainty surrounds the continuation of a federal eviction moratorium.19
Then, there are small businesses, which sustain half of private-sector jobs in the country. The Washington Center for Equitable Growth previously documented both the successes and challenges of earlier federal policy interventions, namely the $670 billion Paycheck Protection Program.20 While that program proved to be an effective lifeline for some firms in need of a boost to get through the worst of the mandatory, pandemic-induded lockdowns, it was less successful in helping the hardest-hit firms in the areas with the most cases of the coronavirus and the most concentrated caseloads of COVID-19.21
Challenges with the Paycheck Protection Program largely centered around issues with its program design, namely the rules around eligible uses of funds, conditions for loan forgiveness, and the intermediation of funding to these businesses through financial institutions.22 Equitable Growth documented how policymakers might fix those flaws, but the future of the Paycheck Protection Program is uncertain. As of August 8, 2020, the ability of the program to accept new applications expired, with more than $130 billion unspent and not available to eligible businesses.23
In summary, data show that we can prevent suffering when we give individuals, families, and small businesses the direct support they need to survive the coronavirus recession. Policymakers provided substantial relief in the CARES Act, but that help ran out. Yet what persists in its absence is the rescue money available for financial markets, as well as pre-existing advantages in our economy for certain large firms. Because our financial infrastructure is designed to quickly stabilize the corporate sector—even without further action from Congress—what’s happening on Wall Street looks a lot different from what’s happening for many workers.
Much of Wall Street is winning
When we say Wall Street is thriving, it’s important to identify precisely which slice of U.S. businesses is doing well in this moment. A good way to judge medium- to large-sized corporations’ health is through two measures. The first is to look at how their stocks are trading. The second is to see whether corporations have been able to borrow money and at what rate of interest. Corporations also raise money by taking out loans from banks or nonbank financial firms, with small businesses relying more on that type of funding. This issue brief will delve into those credit markets, but only minimally.24
Broadly, the two major U.S. stock markets, the New York Stock Exchange and NASDAQ, are performing extraordinarily well because a handful of powerful technology companies are profiting handsomely due to the nature of the coronavirus recession, which plays to their strengths, and because of historically lax antitrust enforcement that enables them to further boost their profits at the expense of other firms, workers, and consumers. Meanwhile, the U.S. bond market is performing well more broadly for all firms. This is due, in large part, to rescue programs designed by the Federal Reserve under authority provided in the CARES Act.
So, let’s turn to each of these Wall Street financial markets in turn.
The U.S. stock market
Stocks represent equity, or an ownership interest, in a company. Fundamentally, stock prices are determined by investors’ confidence in the future earnings of a firm (calculated by combining the risk-free rate earned on holding government debt, plus the risk premium associated with owning the stock). Stocks are also a relatively risky form of investment, as stockholders are the first to bear losses and the last in line to get paid if a company fails. In good times, stockholders are compensated by dividends issued by the company or through appreciation of the stock price, which is realized if the investor sells shares of stock.
So, how have the stock markets been performing during the coronavirus recession? While the S&P 500 index, which measures the 500 largest companies on both U.S. stock markets, is up more than 5 percent in 2020 as of September 9, those gains have been driven by only a handful of companies that control a significant share of all stocks traded on the markets.25
Those top companies are concentrated in the technology sector. Consider the roughly $27 trillion in total market capitalization of all companies in the S&P 500.26 Of the value of all outstanding shares:
- Apple Inc. boasts a $2 trillion market value.27
- Amazon.com Inc. and Microsoft Corp. each represent around $1.7 trillion in value.28
- Alphabet Inc., the parent company of Google, represents just more than $1 trillion in value.29
- Facebook Inc. represents more than $800 billion in value.30
In total, the market capitalization of these five giants is more than one-fifth the value of the total market capitalization of the 500 largest firms trading on U.S. equity markets. (See Figure 1.)
Figure 1
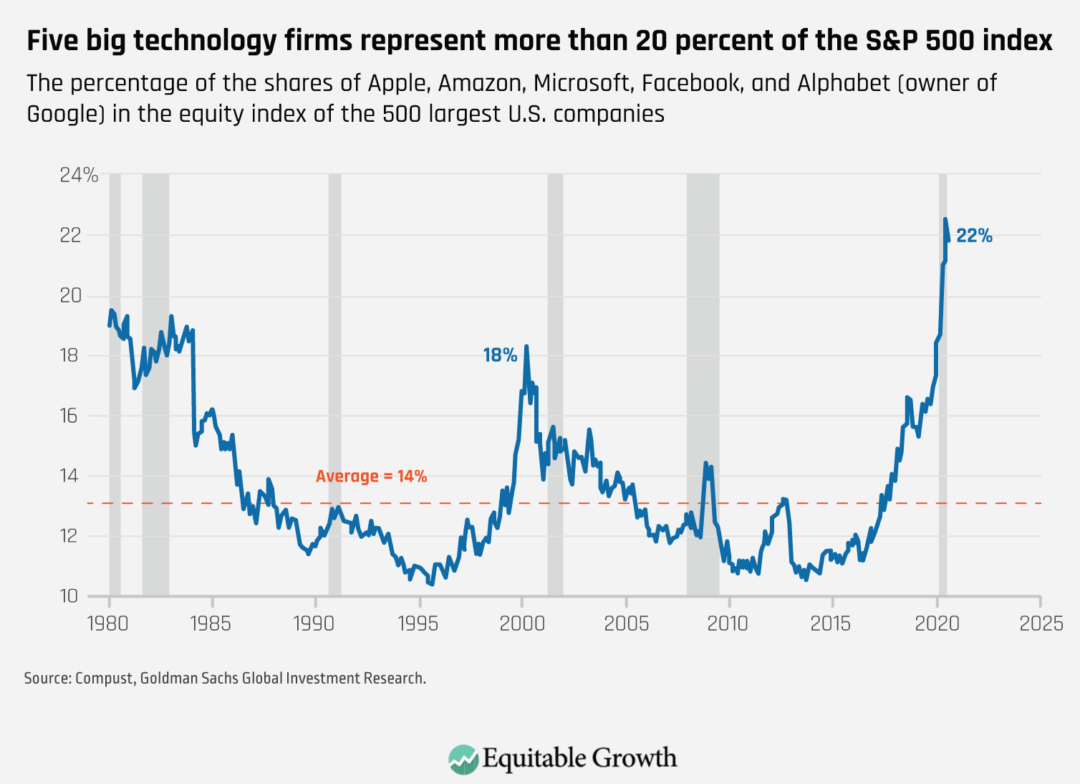
More broadly, total market capitalization for all publicly traded firms is concentrated in the S&P 500, with those 500 companies representing more than 75 percent of the value of all equities traded on U.S. stock exchanges.31 This level of concentration in market capitalization among a small number of companies is at historically above-average levels and is at the highest level it has been in about 40 years.32 The previous time it even approached this level was during the dot-com boom more than two decades ago, though even then, the top five stocks only represented around 16 percent of the S&P 500’s total value.33
These technology companies’ stock-price gains in 2020—particularly since the coronavirus and its recession hit—are outsized, too. The stocks of these five firms are registering astronomical returns while the median stock in the S&P 500 index declined by 4 percent as of August 28.34 Technology companies dominate the stock market among large companies. And, in turn, the stock market indexes of large companies are outpacing indexes backed by the stocks of smaller firms. The Russell 2000, an index that tracks small-cap U.S. firms, is down around 8.4 percent since the start of 2020, as of September 9.35
A visualization of the returns of Amazon, Alphabet, Apple, Microsoft, and Facebook stocks, versus the returns of the overall S&P 500 and Russell 2000 indexes, is instructive. (See Figure 2.)
Figure 2
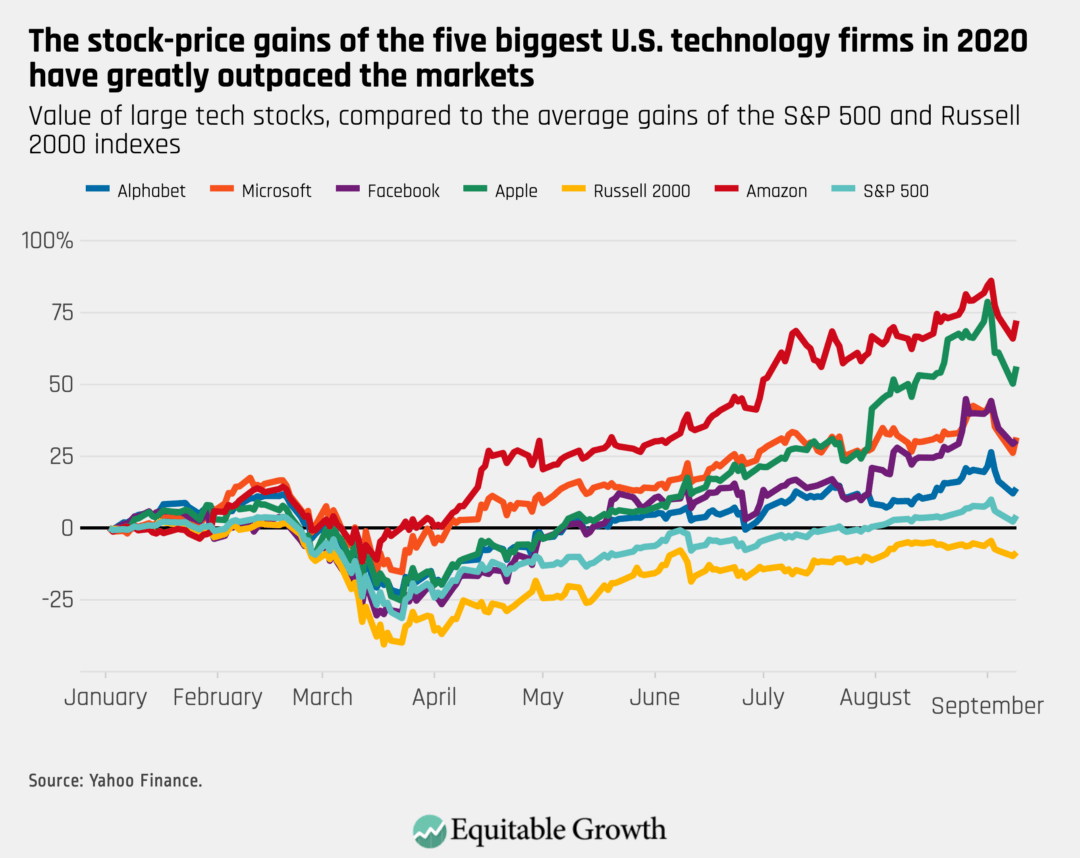
If stock prices reflect investors’ belief in the future health of a company, then technology firms are right to inspire significant confidence during the coronavirus recession. With many people trapped at home, reluctant to go outside, and increasingly working from their houses if they are able to do so, the business models of technology companies are uniquely suited for this moment.
Take the changing nature of shopping. A survey by consulting firm McKinsey taken between July 30, 2020 and August 2, 2020 finds that consumers’ use of online channels for purchases surged during the pandemic, with 59 percent growth in online grocery purchases, 45 percent growth in online over-the-counter medicine purchases, and 18 percent growth in online consumer electronics purchases, to name just three examples.36 McKinsey finds that across purchase categories, there has been a 15 percent to 45 percent growth in online sales, with similar levels of growth in the percentage of consumers who plan to make all purchases online.37 Across channels, new modes of product delivery, such as curbside pickup and home delivery, rose sharply.38
This trend benefitted Amazon the most. The company registered 40 percent growth in earnings in the second quarter of 2020, compared to a year earlier.39 In fact, the company’s second quarter earnings this year “managed to blow away elevated [investor] expectations,” according to the stock market website The Motley Fool.40 And Amazon continues to expand in ways that draw sharp contrast with the decline in brick-and-mortar retail sales and the companies engaged in traditional retail sales. News articles recently reported that Amazon is looking to convert vacant mall department stores into distribution centers, with Amazon’s growing reach coming alongside the recent bankruptcies of retailers, including J.C. Penney Company, Inc., Sears Holdings, Marcus Corp (the parent company of Neiman Marcus), J.Crew Group, Inc., and Ann Taylor’s parent company, Ascena Retail Group.41
The surge in working from home, rather than the office, has also benefited technology companies, which provide services such as cloud computing needed for telework. A survey of more than 300 chief financial officers and finance leaders by research firm Gartner Inc. finds that nearly three-quarters of companies plan to shift at least 5 percent of their previously on-site workforce to remote work permanently.42 Another study by consulting company Global Workplace Analytic estimates that when the pandemic is over, 30 percent of the entire workforce will work from home at least a couple times a week.43 In contrast, before the pandemic, U.S. Census Bureau data released in 2018 found that 5.3 percent of workers typically worked at home.44
But it’s not just COVID-19 causing technology companies’ dominance. A second factor to consider is how U.S. competition policy favors Big Tech. As the Washington Center for Equitable Growth’s Director of Competition Policy Michael Kades noted in a recent post, weak antitrust laws and conservative courts using unsound economic theories continually expose U.S. markets to corporate abuses of market power, which boost large corporations’ profits and dominance at the expense of competitors, workers, and consumers.45
In a recent hearing of the U.S. House Committee on the Judiciary featuring the chief executive officers of Amazon, Apple, Google, and Facebook, Kades notes how policymakers focused on the ways in which these technology companies have suppressed competition through harmful exclusionary conduct.46 Those practices, according to Kades, “allow dominant companies to stifle actual and potential rivals, preventing competition on the merits and allowing incumbents to obtain or exploit market power.”47
Kades notes that in the hearing, policymakers cited several examples of these practices, including:
- Facebook cutting off online entertainment community Vine’s access to Facebook because it was a potential competitor
- Amazon pricing its proprietary products and services below cost to drive out competitors
- Apple discriminating against apps that compete with Apple products
- Google preferencing its own content over that of its competitors48
Kades notes that new legislation is needed to give enforcement agencies and the courts the ability to shift the balance in U.S. antitrust law.49
The U.S. bond market
In addition to funding themselves with shares, firms also fund themselves with bonds, or securities issued by a firm paying a pre-established rate of return, either fixed or variable, for a set period of time. Bondholders’ investments are usually backed by collateral owned by the firm, and bondholders receive priority compared to stockholders if a company fails and its assets are liquidated.
Like stocks, bonds are widely traded among investors and can be grouped into indexes composed of a variety of bonds that can also be traded. Unlike stocks, bond returns do not change based on swings in the value of the firm. Note that companies can also fund themselves with other types of debt such as loans from banks or nonbank financial firms, including private equity companies, which this issue brief will touch on briefly later.
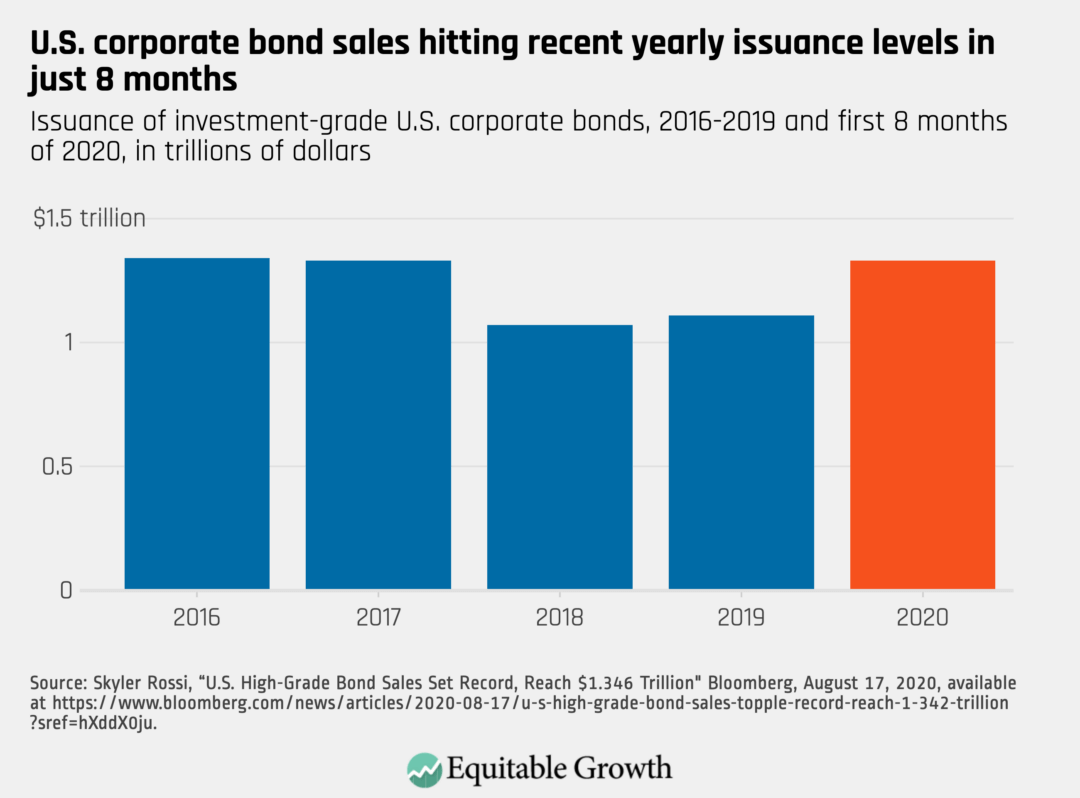
The bond market, unlike the stock markets, is performing solidly for all types of companies, even during the coronavirus recession.50 All told, companies, as of mid-August, have issued $1.9 trillion in bonds in 2020—a record amount, with healthy issuance for both investment-grade and speculative-grade companies.51 Companies have needed to raise additional money to help cover revenue shortfalls caused by a dip in demand during the pandemic. Other companies are issuing new debt because of the historically low cost of financing, driven by Federal Reserve interventions in the market, described later in this issue brief.
Among investment-grade companies, bond issuance totaled $1.3 trillion, hitting a yearly record just 8 months into the year 2020.52 Big companies such as Alphabet and Apple borrowed billions of dollars in recent weeks to lock in the low cost of debt financing.53 Indeed, mid-August 2020 was a record week for investment-grade bond issuances. (See Figure 3.)
Figure 3
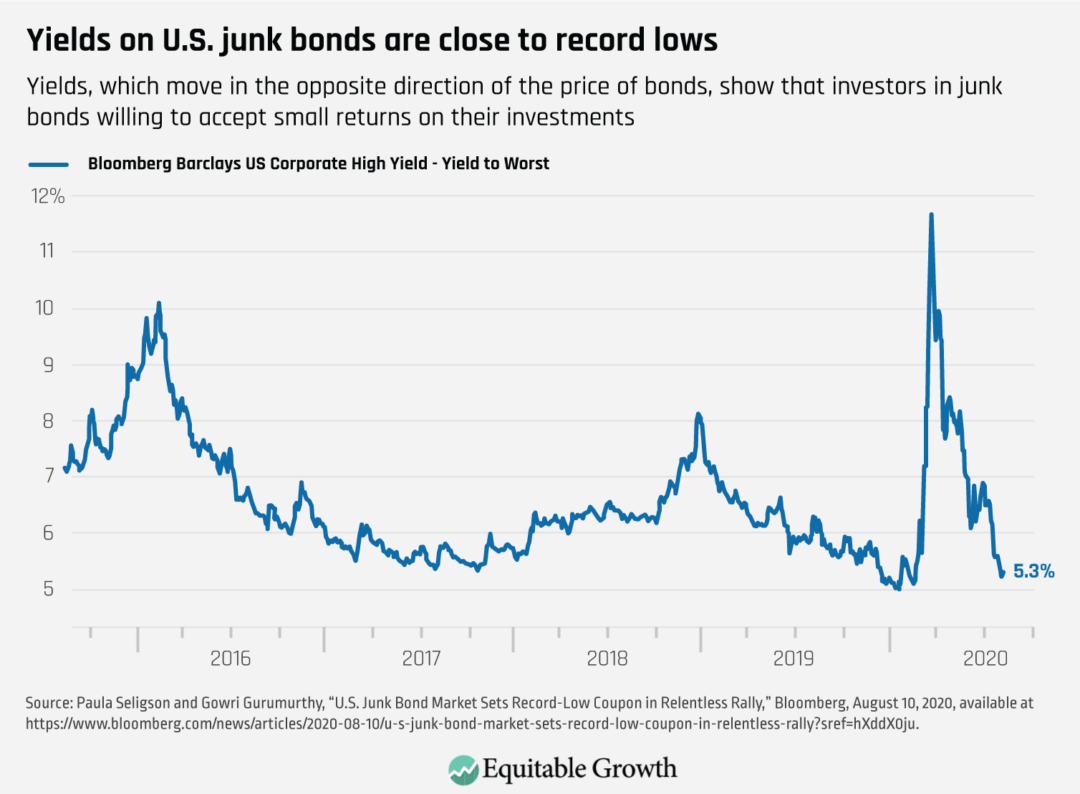
Riskier firms have been able to issue bonds as well. Issuance by high-yield companies set a record in the second quarter of 202054 and topped a new record for the “typically slow August,” breaking records not seen since 2012.55 Firms adversely affected by the pandemic—among them aerospace manufacturer Boeing Inc. and Carnival Corp., the cruise line—were able to issue debt to fund themselves when previously, both firms had sought higher-cost loans from nonbank financial firms such as hedge funds.56 In total, yields on high-yield companies’ bonds are at record lows after briefly spiking in March 2020, meaning investors are requiring historically small levels of returns in exchange for purchasing company debt.57 (See Figure 4.)
Figure 4
How did the bond market become so robust for the full spectrum of firms issuing debt? This story is about interventions by the Federal Reserve.
The U.S. bond market seized up in March, when the coronavirus recession began and as a growing consensus developed in U.S. financial markets that the United States would experience a prolonged recession due to the ongoing and failed public health response to the coronavirus pandemic.58 But the Federal Reserve’s mere announcement at the end of that month—saying the central bank would undertake a number of accommodative measures to boost the economy, including buying bonds and exchange traded funds, or ETFs, backed by bonds using funds appropriated under the CARES Act—caused markets to rebound and gain confidence.59 Indeed, Federal Reserve Chair Jerome Powell noted at the end of March that the central bank is “not going to run out of ammunition,” and financial markets responded with confidence.60
Specifically, the central bank set up two facilities, announced in March but operationalized starting in May, for the purpose of supporting corporate credit markets. The first facility, the Primary Market Corporate Credit Facility, which is operational but has not yet made any purchases, is designed to purchase debt directly from the issuing companies.61 The second facility allows the Fed to purchase both individual bonds and ETFs backed by corporate bonds on the secondary market via the Secondary Market Corporate Credit Facility.62 In total, both programs have the authority to purchase up to $750 billion in assets.63 The Fed, using its lender-of-last-resort authority to leverage money appropriated by Congress, which stands in a first-loss position relative to the central bank, has $75 billion in congressional appropriations to withstand any losses on its balance sheets.64
As of August 10, 2020, the Secondary Market Corporate Credit Facility has just more than $12 billion worth of holdings, around $8.7 billion of which is in the form of ETFs and $3.5 billion of which is in the form of individual bonds purchased on the secondary market.65 The purchases by the Fed include bonds, or ETFs backed by bonds, issued by firms that were rated as investment grade on March 22, 2020, whether they have kept that rating or have been subject to certain downgrades since that date (companies in the latter category are known as “fallen angels”).66
Among individual bond purchases, the Fed’s activity has been concentrated among blue chip companies, or large, well-established firms with household names.67 Individual bond purchases have comprised all of the Fed’s activity since the end of July.68 Generally, the Fed’s purchase activity has slowed in recent months compared to early on in the pandemic response, but it still remains active.69
The Fed helped companies that are riskier bets too, through the purchase of ETFs, which began in May 2020 but has generally slowed in the months since.70 Early purchases of ETFs by the Fed coincided with private buyers flooding the market, with the Fed’s purchases making investors feel more comfortable with the risks associated with companies with riskier profiles and higher debt.71 Though the Fed owned only 3 percent of total assets in the ETFs in which it purchased shares at the end of June, the Fed accounted for more than half of new cash inflows into some ETFs, giving it an outsized ownership share of some funds and putting pressure upward on prices and driving down yields.72
Notably, the Fed and other banking regulators sounded the alarm on high-yield corporate debt just before the pandemic.73 But today, 54 percent of the Fed’s corporate debt portfolio is composed of bonds on the cusp of junk bond territory,74 easing investors’ comfort and causing them to expand purchases notwithstanding increasing default rates and ratings downgrades.75
The size of the Fed’s total bond market interventions, at $12 billion,76 is relatively small (by way of comparison, Alphabet alone issued $10 billion in debt earlier this month).77 Still, the effects of the Fed’s actions on financial markets are profound. Fed reassurances to the bond market demonstrate that it will do whatever is necessary to stabilize corporate credit markets, and the $750 billion pledge of available funding for the Primary Market Corporate Credit Facility, alongside continuing purchases by its SMCCF window, gives confidence that the Fed has deep pockets to execute on its promises.
Observers differ on their perception of the wisdom of the Fed’s actions, with some calling it “decisive action” to “[avert] a worst-case scenario”78 and others saying the Fed is “addicted to propping up markets even without a need.”79 But all agree that the bond market was buoyed by Federal Reserve interventions.
Why isn’t the boom on Wall Street trickling down?
The stock market and the bond market are humming along amid the unprecedented coronavirus recession. But one central question that flows from these trends is to what extent the boom in stocks and bonds is helping people on Main Street by:
- Preventing layoffs
- Boosting individuals’ investment incomes
- Producing knock-on effects for small businesses
- Helping state and local governments cope with declining revenues
The short answer is that it is too soon to tell, but let’s examine each of these questions individually. The details may well indicate the emergence of trends in the coming weeks and months akin to what happened during and after the Great Recession of 2007–2009, which produced prolonged suffering for Main Street.
U.S. financial market gains are not preventing many layoffs
The stock market boom doesn’t mean much for most workers’ jobs. First, only around 17 percent of workers are employed at an S&P 500 firm.80 In contrast, nearly half the U.S. workforce is employed by small businesses.81 The vast majority of small businesses don’t issue stock.
For those who are employed at companies that issue shares, stock prices could be correlated with job growth—investors may feel confident in a company when they see it innovating or investing in workers to grow the business. But sometimes, investors actually penalize companies for investing in workers. American Airlines Group, for example, was downgraded by analysts when it gave raises to pilots and flight attendants.82 And Chipotle Mexican Grill, Inc. experienced a 3 percent decline in its stock price when analysts determined it couldn’t trim its workforce costs.83
Importantly, the companies whose stocks are surging the most during the coronavirus recession don’t employ that many people. Big technology companies, while large employers in an absolute sense, don’t have that many workers compared to their share of the stock markets’ total value. While they represent around a fourth of the total market capitalization of S&P 500 firms, they represent only 5 percent of the index’s total workforce. As a recent Bloomberg news report notes, 20 years ago, companies with the same market share employed 10 percent of the S&P 500’s total workforce.84 These companies are also more likely to use gig workers or independent contractors, who don’t have the security of permanent employees.85 Good examples are Amazon using independent contractors to do “last mile” deliveries with their own cars,86 or Google and Facebook using independent contractors to screen their platform for inappropriate content that violates the company’s guidelines.87
In fact, research suggests that companies with a higher level of “intangible assets” (such as intellectual property and brand recognition) per employee are far outpacing stock gains compared to companies with fewer intangible assets per employee.88 Part of this is driven by the unique nature of the coronavirus recession and the surge in the value of technology intermediation. But again, it’s also an outgrowth of antitrust policies that allowed prolific mergers and acquisitions in the technology sector.
The Fed’s support for bond markets could hypothetically support workers at companies that need to issue debt. After all, if a company can’t raise money, they can’t meet payroll. It is hard to causally determine whether any Fed actions are responsible for any positive indicators in labor markets, but, as economist William Spriggs of the AFL-CIO notes, one counterfactual (the Fed not acting at all) is unlikely to have produced better results for workers. Spriggs notes, “so you want [the Fed] to let all the companies go bankrupt? And then which jobs do you think will be left?”
In short, boosting teetering companies, while imperfect, may be better than the alternative.89
However, it is important to note that the Fed didn’t face a binary choice to do everything for corporate credit markets without precondition or do nothing at all. In fact, the CARES Act did include discretionary authority for the Fed to require corporations receiving rescue aid to retain jobs, maintain collective bargaining agreements, prohibit dividends and stock buybacks, and limit executive compensation,90 yet the Fed used several legal maneuvers to sidestep those conditions on aid.91 Two examples of how the Fed’s financial market activities are decoupled from worker protections can be instructive. For example, the Fed purchased corporate debt issued by ExxonMobil Corp.92 Meanwhile, the company is separately preparing for job cuts and ending their employer match for their remaining employees’ 401(k) retirement plans.93 The Fed also bought the corporate debt of Tyson Foods, Inc.,94 while the company has allowed a massive outbreak of COVID-19 in its meatpacking facilities.95
Finally, some contend that the Fed’s bond market actions are just delaying the devil coming due for many teetering firms and therefore won’t have a long-term positive effect on jobs. Indeed, the Federal Reserve Bank of New York recently noted a growth in firms whose expense payments exceed their cash flow.96 These firms are colloquially known as zombie companies.97 The New York Fed’s research finds that around 25 percent of all public firms (except agriculture) had expense payments that exceeded cash flow, along with more than a third of companies in the entertainment/hospitality/food, mining/oil, and retail industries.98 The Fed’s bond purchases could serve to prop up companies that otherwise would have stumbled or failed, including those that were precarious long before the pandemic, such as many oil and gas firms.99
Investment income doesn’t matter much for most Americans
The Fed’s actions also are unlikely to boost returns for most low- to moderate-income people in the United States. While about half of Americans own some amount of stock (either directly or through investment vehicles such as 401(k) plans), the value of all stock ownership is concentrated, with the top 1 percent of households by wealth owning more than half the value of all outstanding shares.100
As for corporate bonds, individual ownership, especially among moderate-income households, is extremely limited in the United States. Low- and moderate-income people do have exposure to the bond market through insurance companies, mutual funds, or pension funds that own such bonds.101
Small businesses continue to struggle
The Fed’s actions also are unlikely to do much for small businesses, aside from potential salutary macroeconomic effects of its actions for the U.S. economy generally. Small businesses typically don’t issue stocks or bonds, so they’re not helped by the Fed’s interventions in those markets. Low interest rates, under typical economic conditions, should enable some small firms to borrow more cheaply from commercial bank lenders. But, as described more below, bank lending is retrenching as financial institutions become more risk-averse during the pandemic.
The Fed did create a separate program to facilitate direct lending to mid-sized businesses, known as the Main Street Lending Facility.102 The program was designed to encourage financial institutions to lend to mid-sized companies with up to 15,000 employees and $5 billion in revenue by having the Federal Reserve purchase 85 percent to 95 percent of those underlying loans.103 Despite a $600 billion available pot of funding, the Fed has only committed or settled $252 million across 32 loans, with another 55 loans worth $604 million under review.104
This Fed program is floundering due to the complex rules of the Fed’s Main Street Lending Facility, alongside the already substantial debt load among mid-sized businesses and the reliance of the Fed program on the participation of private-sector lenders.105 Indeed, the sluggish start of the Main Street Lending Facility mirrors a general downturn in available credit for small- and mid-sized companies that rely on bank and nonbank loans for funding, despite low interest rates.
As noted in a recent Bloomberg article, “banks are tightening conditions on loans to smaller firms at a pace not seen since the financial crisis, while many direct lenders that have traditionally focused on the middle market are pulling back or turning to bigger deals instead.”106 This is despite claims from some that recent relaxation of post-Great Recession banking regulations would increase the provision of credit for nonfinancial businesses.107 Nonbank lenders are likewise tightening lending as they address increasing defaults and are targeting bigger deals.108
In short, the coronavirus recession and the policy response has produced a lopsided trend in corporate credit markets—with small firms that rely on lending increasingly finding it difficult to get credit while high-yield firms with access to bond markets enjoying falling yields.109 (See Figure 5.)
Figure 5
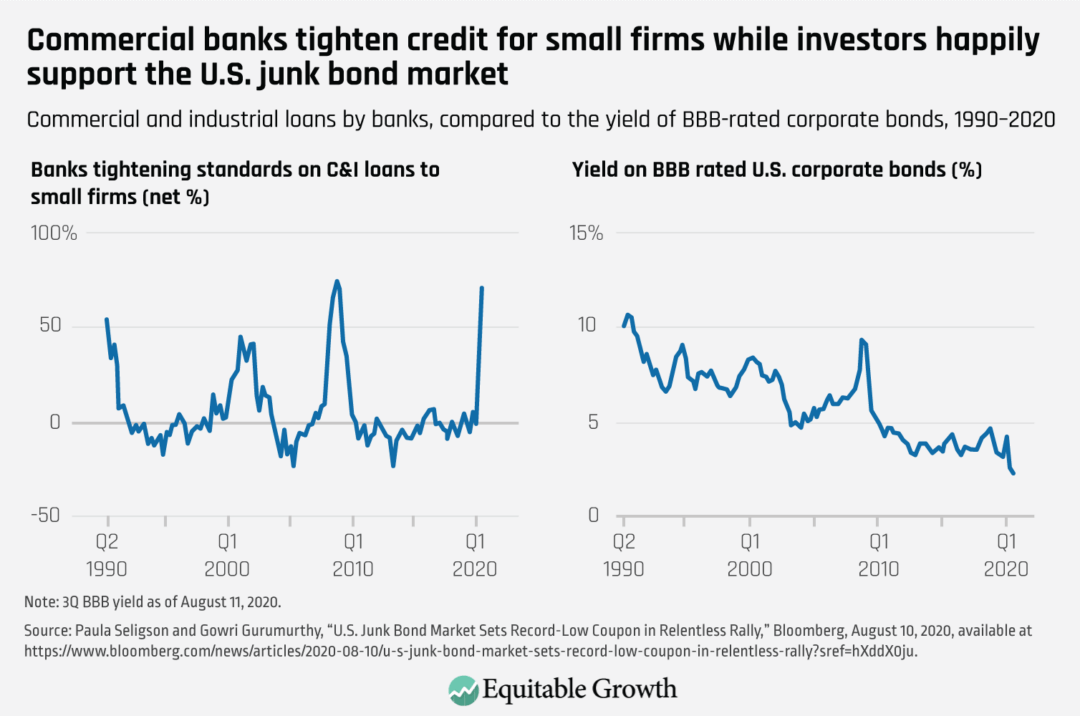
State and local government financing is dire
How are the Federal Reserve’s bond market interventions affecting the health of state and local government finances and, therefore, the workers of these public-sector employers? The Fed, in April, established a Municipal Lending Facility to buy up to $500 billion in bonds issued by certain qualifying counties and cities so that they could use the proceeds to pay for necessary expenses related to, or declines in revenue because of, COVID-19.110 But only two bonds have been purchased by the Fed so far. One was issued by the state of Illinois, for $1.2 billion.111 The other was issued by the state of New York Metropolitan Transit Authority, for $451 million.112
The discrepancy between the Fed’s municipal and corporate bond buying program rules is instructive. The Fed imposes more stringent requirements on municipal borrowers than on corporate ones. A municipality rated A3 by a credit rating agency (a medium-grade rating that signifies the weakest borrowers within the cohort of strong borrowers) could borrow for a maximum of 3 years at around a 2.2 percent interest rate, while a similarly situated bond issued by an A3-rated corporation would pay just 1 percent.113
What’s more, municipalities can borrow for a maximum of 3 years, but corporations will be able to borrow for 4 years to 5 years—giving them more time to repay debts.114 Companies that issue bonds directly to the Fed via the Primary Market Corporate Credit Facility can have repayment timelines of up to 4 years, while the Fed’s program to buy bonds in the secondary market through its Secondary Market Corporate Credit Facility is allowing maturities of up to 5 years.115
Similar to the situation with corporate bonds, municipal bonds were stressed at the onset of COVID-19, and then, the market stabilized upon the Fed announcing its interventions, which included both the creation of the state and local bond purchase facility and other actions.116 But the Fed’s terms for municipal bond purchases are generally more punitive than those for corporations, meaning that the program may only be attractive for lower-rated municipalities that would otherwise have trouble borrowing at low cost in the market. Tellingly, only two municipal bond issuers have found the Fed’s terms attractive, with issuances totaling $1.65 billion, compared to more than $12 billion in Fed-supported corporate bond issuances, which support a range of investment-grade and high-yield firms.
Given the large declines in state and local revenues, combined with a lack of emergency federal support for state and local government bearing the increased costs of fighting the pandemic, public-sector job losses and services cuts are all but certain to continue because most states cannot run budget deficits. States and localities have already cut about 6 percent of their workforces as of mid-August 2020, and most estimates anticipate further job cuts absent a stabilization of the pandemic, added support from Congress, or a loosening of borrowing terms by the Federal Reserve.117
Conclusion
The coronavirus economic crisis need not produce deep and sustained harm for individuals and families in the United States if policymakers learn the lessons of the past. During the Great Recession, Congress failed to provide support commensurate with the scale of the crisis, and we saw the consequences.118 Wall Street was quickly stabilized and returned to profitability, with the fourth quarter of 2009 being the last quarter in which the banking sector posted losses.119
But individuals, families, and small businesses did not fare as well. It took until 2017 for median household income to get back to pre-crisis levels.120 The Great Recession saw more than a third of workers unemployed for 27 weeks or more.121 These sustained periods of joblessness led to poorer health, shorter life expectancies, and worse academic performance for children.122 The eviction crisis during and after the Great Recession produced heightened levels of stress, health crises, addiction, child abuse, and myriad other negative family outcomes.123
The apex of the previous global financial crisis, 2009, marked the year when business deaths most strongly outpaced business births, and for 3 months that year, new business creation reached its lowest point since the U.S. Bureau of Labor Statistics began collecting the information.124 And, perhaps most troublingly, one study from the U.S. Centers for Disease Control and Prevention found that suicides doubled in the years just before and after the Great Recession, spurred by severe housing stress, including evictions and foreclosures.125
Today, Wall Street is recovering even faster than during and after the Great Recession. Meanwhile, the coronavirus recession may be on track to deliver even worse economic conditions for workers, their families, and small businesses. Absent further action from policymakers, our nation may replicate the alarming consequences of the Great Recession. And this is not even taking into account the human tragedies brought on by the coronavirus pandemic and COVID-19 deaths and lingering sicknesses.
Policymakers have the evidence and tools to ensure a strong recovery. Direct financial aid to individuals and families works. Programs such as extended Unemployment Insurance, increased food benefits through the Supplemental Nutirition Assistance Program, and aid to states for Medicaid should be scaled up commensurate with economic indicators—and not scaled down until indicators show it’s safe to do so. Congress also needs to provide more financial aid to state and local governments.
Then, there are the reforms needed to ensure continuing financial aid to Wall Street is accompanied by concomitant obligations to help workers and their families, and support credit to small businesses. Policymakers should design more resilient “plumbing” to make rescues of families and small businesses as frictionless as Federal Reserve financial market interventions.126
Beyond the immediate response to the pandemic, the Washington Center for Equitable Growth provides a roadmap for the structural solutions needed to rebalance the economy over the long term, including restoring antitrust enforcement, boosting wages, and empowering workers.127 The United States walked into the coronavirus pandemic with severe underlying fragilities. To ensure a sustainable recovery will require bold action now, as well as addressing these weaknesses with structural policy changes.
—Amanda Fischer is the Policy Director at the Washington Center for Equitable Growth.
Wage discrimination and the exploitation of workers in the U.S. labor market
College football’s inequality dilemma amid the coronavirus recession

Before the coronavirus pandemic and the recession it caused, the economics of college sports, particularly college football, took a backseat to game-day coverage of tens of millions of fans spending freely on eating, drinking, and cheering in tightly packed stadiums and bars, tail-gate parties, and backyard barbeques across the United States. In particular, the economic well-being of the athletes themselves and the financial imperatives for the college and university towns and cities where these games are played was, by and large, overlooked by the majority of fans.
Now, however, even Americans with no interest in college sports are taking part in conversations about whether college football should be played this fall and, by extension, what the economic impact would be of deferring a year of sports. Two of the Power Five college football conferences, the Big 10 and Pac-12 conferences, decided earlier this month to suspend their fall seasons at least until January due to the still out-of-control coronavirus pandemic and COVID-19, the disease caused by the virus.
In contrast, the other three conferences—the Atlantic Coast Conference, the Big 12, and the Southeastern Conference—say, for now, that they will forge ahead with the slimmed-down game schedules even as most of the regions of the country in which they play are among the hardest hit by the coronavirus pandemic. While the National Collegiate Athletic Association has started to implement measures to lessen the spread of COVID-19, the NCAA has not canceled the football season.
Certainly, a predominant factor for the ACC, Big 12, and SEC in forging ahead with a football season is the revenue generated: According to Patrick Rishe, director of the sports business program at Washington University in St. Louis, the top 65 schools in the Power Five generated $4 billion in revenue from football in 2018. Yet the chances of a full season of college football for the ACC, Big 12, and SEC conferences are in the hands of a virus that infects people of color, including students of color, more than other students, which, in turn, infects these athletes’ classmates and their parents and grandparents. And lurking in the background of all of this is the longstanding call for student athletes to be recognized as a labor force entitled to a voice and workplace protections, among other job-quality standards.
Of all student athletes in Division I football at the Football Bowl Subdivision level in 2018, 54.3 percent were African Americans, 39.8 percent were White, 2.3 percent were Latinx, Asian Americans and Pacific Islanders represented 2.8 percent, and 0.9 percent were classified as Other.
This higher infection rate and death rate among people of color in the United States is the defining health inequality of the coronavirus pandemic. Yet the pandemic and resulting recession also lay bare several economic inequalities that athletes of color have faced for decades, among them the lack of worker power enjoyed by their counterparts in the professional National Football League via their union, the NFL Players Association, as well as the massive subsidy these student football players provide to college and university sports programs and these institutions of higher learning overall. This difference is made more stark when examined through the lens of the race and ethnicity of college football players, who supported financially all other college sports programs in 2018—54 percent are Black, 40 percent are White, and 5 percent are Latinx and Asian Americans and Pacific Islanders. (See Figure 1.)
Figure 1
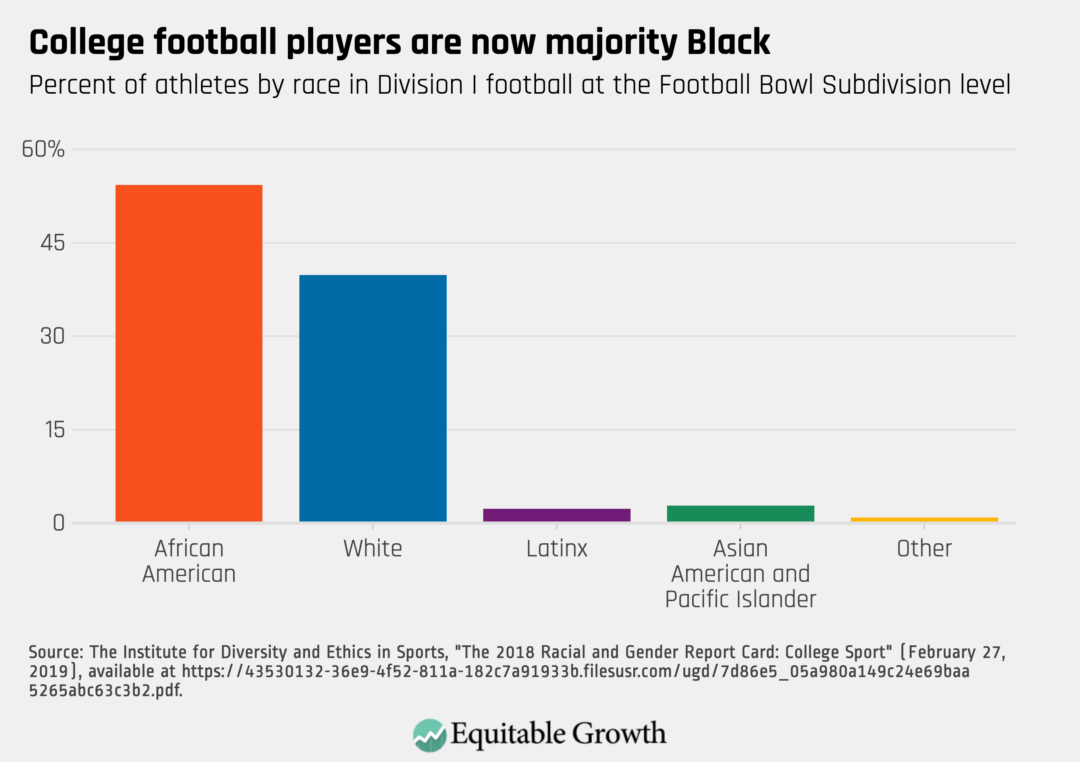
Compare this to the $1.2 billion in revenue just among the top five teams in the SEC, the ACC, and the Big 12 in 2018. That may seem like an apple-to-oranges comparison, except that the work of these majority players of color supports exceedingly well-paid head coaches in football and in the other college power sport, basketball, nearly all of them White, as well as all other sports programs. (See Figure 2.)
Figure 2
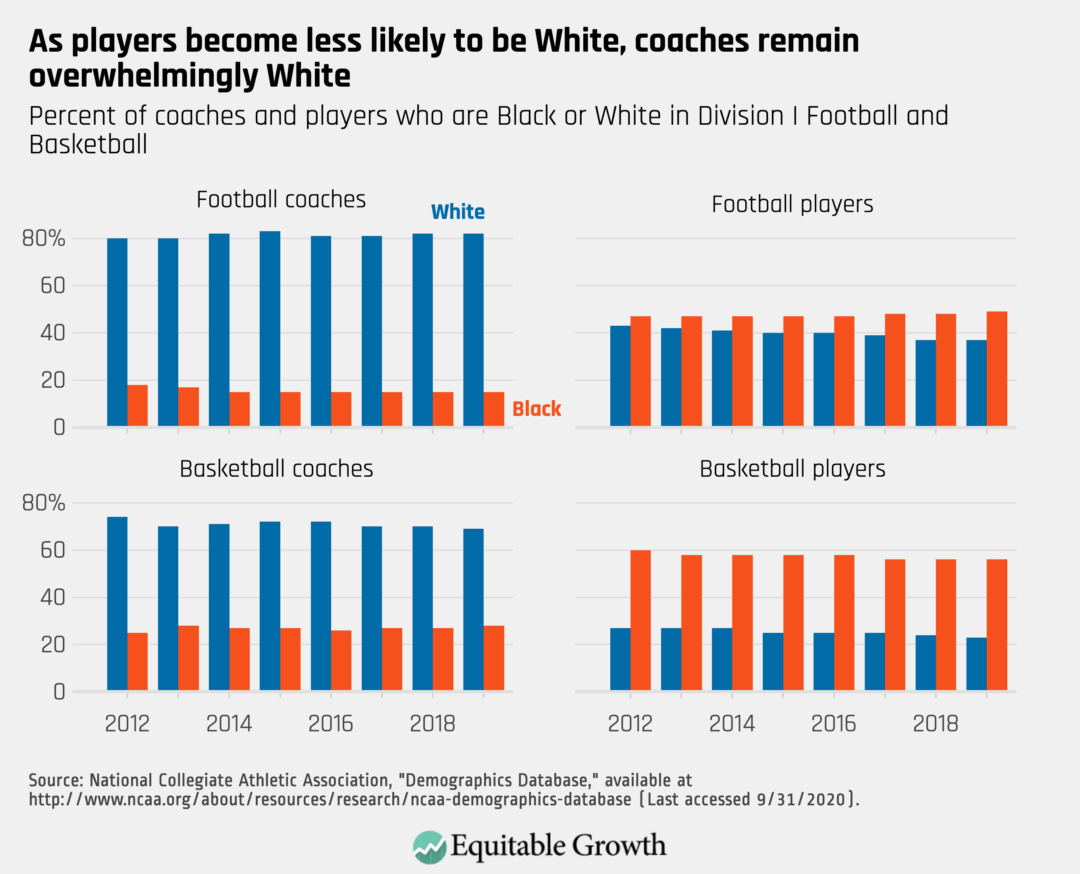
Here is just one telling case in point from SEC powerhouse Louisiana State University, ranked fourth in revenues in 2018, according to the SBNation/Vox News website Banner Society:
In 2018, LSU’s athletic department reported $145 million in revenue to the NCAA. Of that, LSU reported $87 million came from football. But that doesn’t tell the whole story. LSU also reported $39 million from media rights, the result of the SEC’s negotiations with ESPN and CBS. The athletic department only credited $12 million of that to football, even though anyone in college sports would tell you the vast majority of CBS’s interest in the SEC was football-based.
Football’s real contribution was well over $100 million of LSU’s $145 million in total athletic money. But even going by LSU’s accounting, football made $55 million in profit. Men’s basketball and baseball, together, added a little less than $1 million. Everything else lost money, but thanks to football, the department still made about $8 million.
Then, there’s the economic engine of college football in college and university towns across the nation. Like the restaurant industry, most Americans didn’t realize how important hospitality and leisure activities were to the economic well-being of their fellow citizens. The largely uncontrolled spread of the coronavirus in the spring and early summer made clear the economic importance of college sports in some of the towns and cities and rural communities in the South and Southeast, Midwest, and Mountain West that are most passionate about college football. Now, with the 2020 college football season over or seriously curtailed, business owners are facing heavy losses.
All of these data point to the economic importance of college football—especially to the importance of the players who are not paid to support this incredible economic edifice—and to the economic inequalities that are the sport’s very foundation. Seen in this light, the efforts by the SEC, ACC, and Big 12 conferences to play college football amid a pandemic that threatens players of color especially with possible career-ending sickness or even death before they ever get a shot at being paid as professional athletes means these conferences are ignoring longstanding health inequality along the lines of race and economic class on top of already egregious economic inequality.
This is the moment to come to grips with the intricacies of college football in our society amid the coronavirus recession and the enduring structural racism in our economy and society that underpins college football and also harms Black Americans and other Americans of color. College athletes are exploited while creating tremendous value during regular seasons, and their safety is put at further risk if they are to play during an uncontrolled pandemic. One way to address this problem may be the recently introduced “college athletes bill of rights” in the U.S. Senate by Sen. Cory Booker (D-NJ) and number of his colleagues. More immediately, a wise move could be for all conferences to pause this college football season because of the coronavirus pandemic and take the time to figure out how college sports, and college football in particular, could be more equitable and sustainable when the nation emerges from the coronavirus recession in 2021 or beyond.
Maintaining effective U.S. labor standards enforcement through the coronavirus recession
Get more money immediately to U.S. families and help them out of the coronavirus recession

The costs of the deepening coronavirus recession and the benefits of the federal government providing another round of direct economic aid to families are clear.
Let’s begin with the mounting costs of the public health and economic crisis before turning to what Congress must do now, and why another round of direct payments to all families is essential. Cases of the coronavirus recently hit nearly 6 million, with about 183,000 deaths. The rolling result of the pandemic in our economic lives, including temporary business closures, layoffs, shelter-in-place orders, and social distancing, continue to hurt everyone. Low-income families and families of color have been hardest hit. Millions have less money than before the crisis to pay their bills. And this is all happening before an expected second wave of infections and deaths are feared to spread across the country later this year.
The economic costs are accumulating quickly, too. Millions of U.S. workers have lost their jobs and even more are receiving smaller paychecks than before. Some were hit much harder by the crisis than others, including Black, Latinx, and Indigenous American families. As of June—before the case counts began to rise again—30 percent of Black families and 40 percent of Latinx families had lost at least one paycheck, according to a recent study. That compares to 20 percent of White families. Suffering also is widespread today, even relative to the Great Recession, especially for front-line workers, the majority of whom are Asian Americans, Native Hawaiians, or Pacific Islanders.
Additional economic relief from Congress is necessary to help those suffering the most. New research and incoming data show that the relief the U.S. Congress provided this past spring helped support low-income families to make ends meet, such as the findings in a study on poverty rates by the Center on Poverty & Social Policy at Columbia University. But most of that economic relief expired at the end of July. And then, Congress went home.
That support should not have ended. The Coronavirus Aid, Relief, and Economic Security, or CARES, Act included (among other measures) a one-time direct payment to families like the payments at the start of the Great Recession of 2007–2009. The main differences between the two are size, eligibility, and speed of delivery. In 2008, Congress sent out $600 per eligible adult and $300 per dependent child. The payments in 2020 were $1,200 per adult and $500 per child. That’s nearly $300 billion in total in the second quarter of 2020, or about 2 percent of annual consumer spending. In addition, enhanced jobless benefits, including an extra $600 per week, added $250 billion to the economy through July.
In addition, nearly every woman, man, and child with a Social Security Number was eligible for this direct payment in 2020, unless they had annual income of more than $150,000 for couples or more than $75,000 for individuals. Thus, eligibility for this rebate was much wider than in 2008, and included 85 percent of the U.S. population. The U.S. Treasury Department also got the money to people much faster this year, with the first direct deposits arriving as early as mid-April. Most families had their rebates by the end of May.
An array of new studies show that the 2020 rebates helped U.S. families. And despite many unique features of the current recession, numerous studies summarized in a report by one of the co-authors of this column demonstrates that the effectiveness of these rebates was similar to the 2008 rebates that helped families in the Great Recession.
First, the 2020 rebates buffered the freefall in spending and helped get people back to work. Consumer spending—as measured by transactions in their bank accounts—began to rebound as soon as families received their rebates. Of course, the rebates, along with other aid such as enhanced unemployment benefits, were not enough to reverse steep declines in spending, but they did provide some relief to many families. (See Figure 1.)
Figure 1
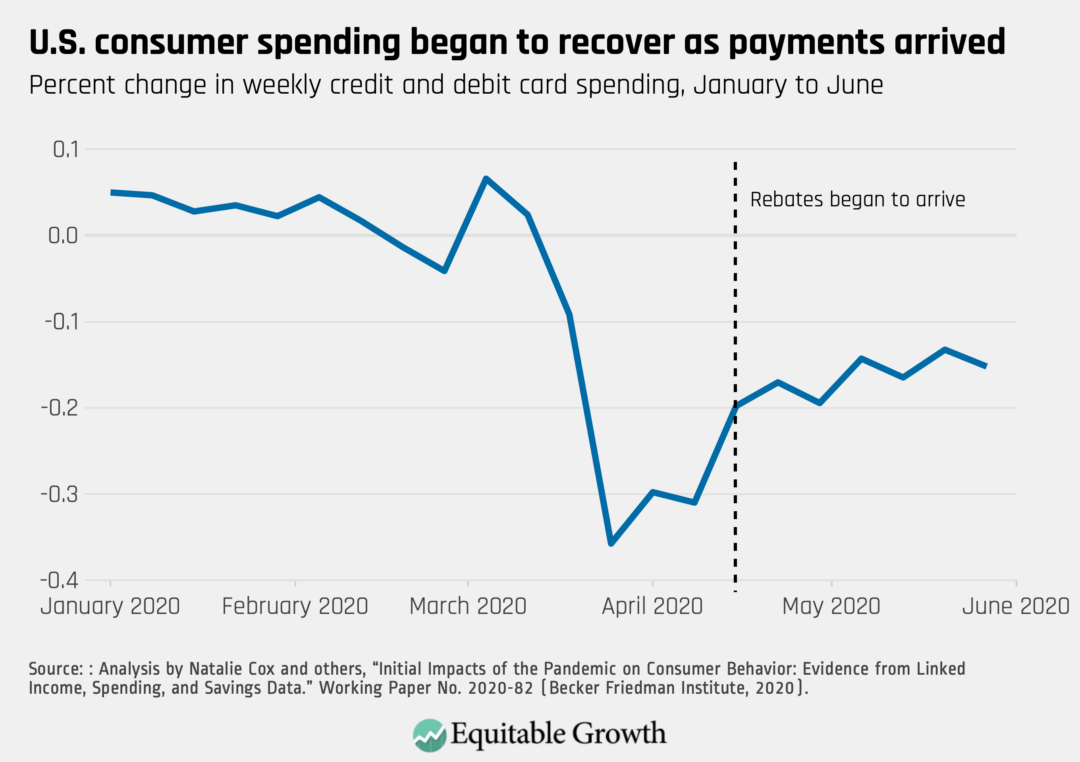
Surveys of families in May and June show that between 40 cents and 60 cents of every rebate dollar was spent, with most spending occurring within a few months of receiving the rebates. This adds up around 0.7 percent of aggregate consumer spending. Another survey, similarly shows that many people spent their payments. Thus, the rebates provided notable support to the economy early in the recession and helped to slow the downward spiral.
Some families were more likely to spend their rebates than others. Cash-strapped families with little in savings were most likely to spend a higher fraction of their rebates. In contrast, those with a financial cushion were more likely to save the rebates, building up money to spend at a later time. (See Figure 2.)
Figure 2
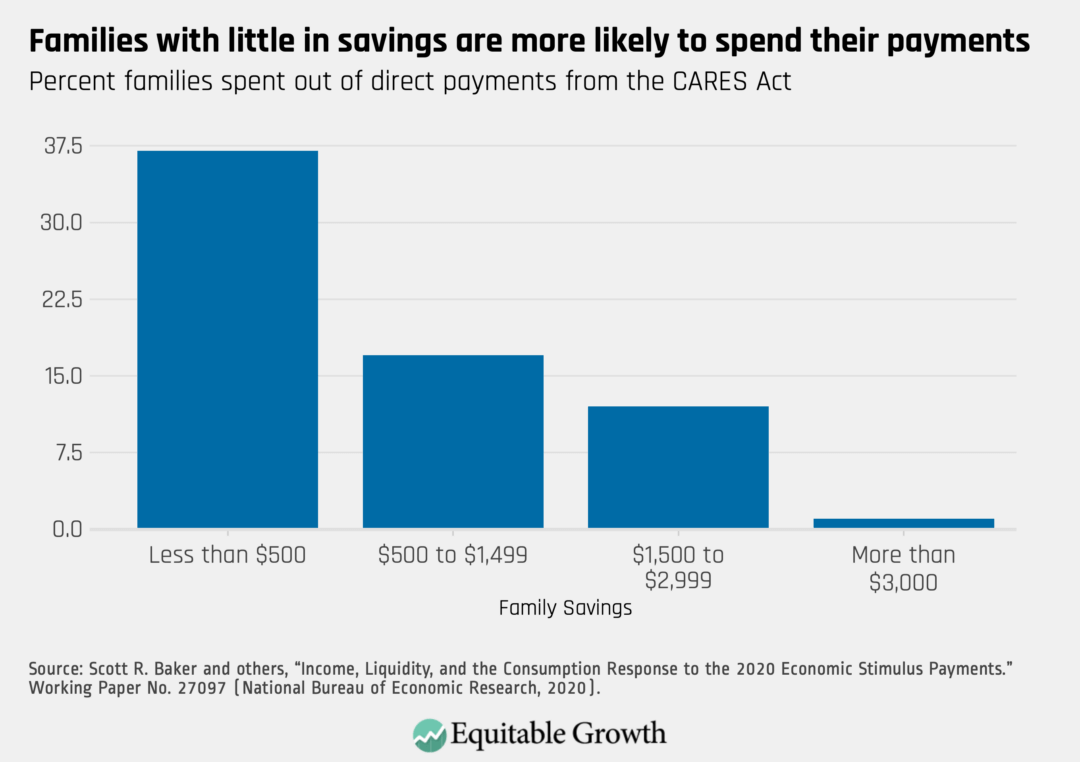
This $300 billion in payments was critically important to stabilizing the U.S. economy. Most of the spending occurred quickly—within weeks of receipt. Some sectors benefited more, as spending turned up most in food, rent, and other bills. Some of the rebates went to all types of spending, including big ticket purchases such as cars. Spending patterns did differ between 2020 and 2008. (See Figure 3.)
Figure 3
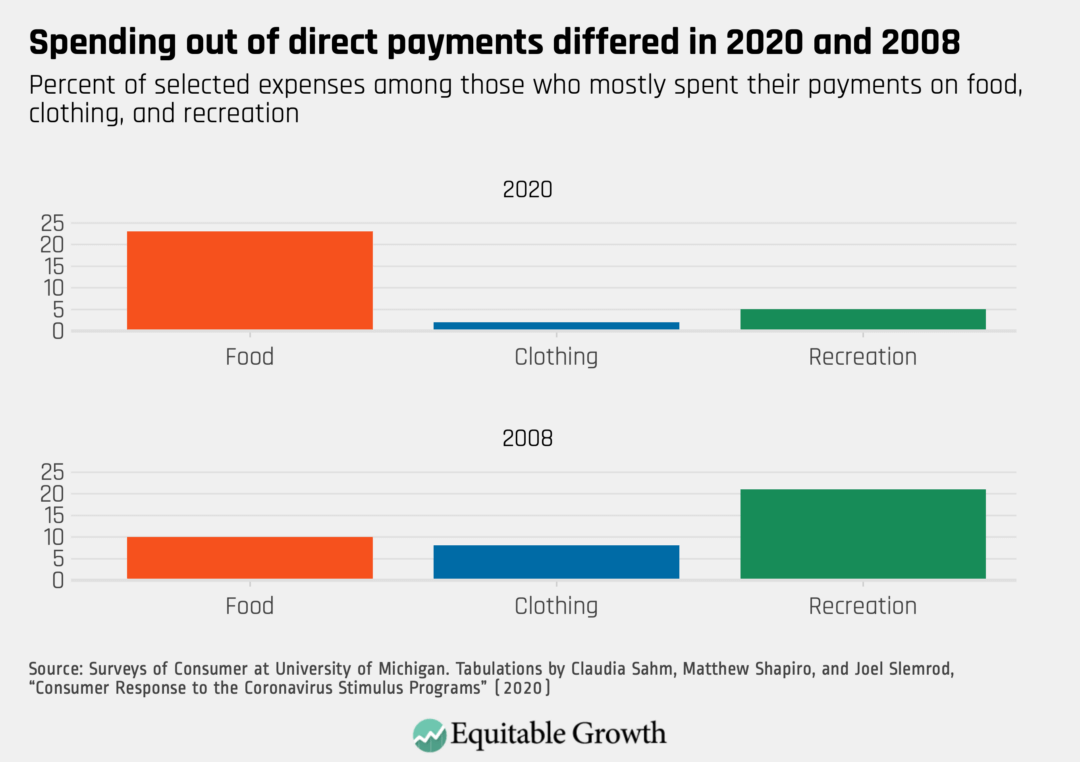
The payments to families in the spring of 2020 helped them directly, and the U.S. economy broadly, by supporting an upturn in consumer spending. In addition, the payments that were not spent can also benefit the economy. Some families saved their rebates, especially those who kept their jobs and their income steady. Unfortunately, families caught up in the economic collapse—often those with smallest financial cushion—were unable to save their payments.
As a result, they will be less able to weather future economic setbacks. The coronavirus pandemic and the ensuing recession rage on, and families can only spend their payments once. Many are now scrambling to pay the bills, and some are missing their rent or mortgage payments.
To add insult to injury, the extra $600 per week of the unemployment benefits expired at the end of July. Research by JPMorgan Chase Institute shows that these expanded unemployment benefits were a notable support to the income and spending of the recipients.
Targeting direct economic aid and enhanced unemployment benefits to families suffering the most today and going into the fall and winter is good policy and pushes back against a further increase in income inequality. The CARES Act, including direct rebates and enhanced jobless benefits, was integral for families and small business owners, especially those with less income and marginalized groups, to weather the onset of the coronavirus recession. It is imperative that substantial additional assistance be provided to those in need. We are facing a pandemic that threatens our well-being in countless ways, perhaps for years to come.
Congress must do more to support all families and keep us safe.
Revamping U.S. small business rescue programs amid the coronavirus recession

The coronavirus economic rescue programs enacted by Congress this past spring failed to prevent layoffs and firm bankruptcies among the smallest employers in the United States. Existing resources, such as the Paycheck Protection Program, helped firms that needed a marginal boost to get through the worst of the shutdowns caused by the coronavirus pandemic. But the hardest-hit areas or businesses did not receive the help they needed because of the structure, timing, and delivery mechanisms of rescue aid.
What’s worse is that little data are available to evaluate whether rescue efforts have been equitable for Black and Latinx small business owners. Meanwhile, policy interventions through the Federal Reserve have efficiently saved the largest and most well-resourced companies. As a result of these imbalances, the U.S. economy may become increasingly lopsided, concentrated, and less dynamic, harming prospects for broad-based and stable growth and racial equity moving forward.
Heading into 2021, policymakers should prioritize restructuring business aid so that small firms can be rescued with the same speed as large firms. The Paycheck Protection Program should be altered to help firms in high-rent areas, firms that are smaller and less well-connected to the banking system, and firms owned by Black and Latinx entrepreneurs. Longer term, policymakers should build public financial systems to make our economy resilient for the next downturn, including:
- Increasing the capacity of the Small Business Administration
- Building a faster payment system
- Ensuring universal access to the banking system
- Creating established alternatives to ad hoc business rescue programs via the Federal Reserve
Emergency financial rescue has been primarily a subject handled by the U.S. Congress, the Federal Reserve, and the U.S. Department of the Treasury, through the Small Business Administration. The key resources below provide solutions that policymakers can deploy to strengthen small businesses and provide for more equitable economic growth.
Key resources
“Broken plumbing: How systems for delivering economic relief in response to the coronavirus recession failed the U.S. economy,”by Amanda Fischer and Alix Gould-Werth
Well-functioning economic delivery systems, like plumbing systems, are essential to stopping the cycle of economic contraction. In this piece, Fischer and Gould-Werth outline how policymakers must invest in our economic infrastructure if our economy is to emerge from the coronavirus recession more resilient. This includes an examination of U.S. small and large business rescue aid programs, as well as Unemployment Insurance systems and U.S. paid leave policies.
“Did the paycheck protection program work for businesses across the United States?,”by Amanda Fischer
As policymakers consider how to keep the U.S. economy stable while efforts to control the public health crisis continue, it is useful to evaluate the early research on the efficacy of the Paycheck Protection Program—most notably, whether the money went to the hardest-hit areas, encouraged firms to keep employees on payroll, and kept small businesses from going bankrupt. It is unlikely that any businesses—and particularly, small businesses—will be able to return to normal anytime soon, and the early evidence suggests that the Paycheck Protection Program is struggling to meet its intended goals. Examining what we know about the program can provide a roadmap on how to deploy aid to American small businesses moving forward, and this piece offers up several short-term fixes, as well as needed structural changes.
“Enhanced U.S. social insurance will be necessary until the coronavirus recession recedes,” by Liz Hipple and Amanda Fischer
Research from former Equitable Growth Steering Committee member Raj Chetty and the Opportunity Insights team finds that U.S. consumer spending fell dramatically over the spring and summer of 2020, driven by public health and safety concerns due to the novel coronavirus and COVID-19, the disease caused by the virus. These concerns keep people, especially those in high-income households, from purchasing in-person services. This indicates that until people feel safe engaging again in in-person services, such as dining out or getting haircuts, consumer spending on services will not meaningfully rebound. If policymakers want to fix the U.S. economy, then they must first fix the U.S. public health crisis. In the meantime, Chetty and his co-authors find that investing in social insurance programs—such as the expanded unemployment benefits enacted by Congress in the Coronavirus Aid, Relief, and Economic Security, or CARES, Act—is the best way to mitigate economic suffering during the recession, rather than stimulus measures targeted toward businesses or the rich.
Top experts
- Amanda Fischer, policy director, Washington Center for Equitable Growth
- Mehrsa Baradaran, professor of law, University of California, Irvine School of Law
- Raj Chetty, William A. Ackman professor of public economics, Harvard University
- Lisa Cook, professor of economics, Michigan State University
To view the other policy sheets in this series, please click here.