This is a post we publish each Friday with links to articles that touch on economic inequality and growth. The first section is a round-up of what Equitable Growth published this week and the second is relevant and interesting articles we’re highlighting from elsewhere. We won’t be the first to share these articles, but we hope by taking a look back at the whole week, we can put them in context.
Equitable Growth round-up
This week, Equitable Growth launched our 2021 Request for Proposals. Since our founding, we have focused on deepening our understanding of how inequality affects economic growth and stability by supporting research that investigates these topics from a diverse range of perspectives in economics and the social sciences. Our RFP is organized around four main channels of economic growth: human capital and well-being, the labor market, macroeconomics and inequality, and market structure. And this year, we are particularly interested in research that looks at the consequences of structural racism, as well as climate change, on these four areas. Read more about our RFP and the types of research we aim to fund, as well as details about who is eligible, how to apply, and upcoming deadlines.
As millions of workers continue to be out of work as a result of the coronavirus pandemic and recession, many have relied upon their states’ Unemployment Insurance benefits to get through the worst of the economic downturn. Earlier this year, the U.S. Congress passed a program called Pandemic Emergency Unemployment Compensation, which provides an additional 13 weeks of benefits for those who have used up the standard 26 weeks in their states. But the program is set to expire at the end of this month. Alix Gould-Werthexplains the results of a recent study that looks at the benefits of expanding unemployment benefits to workers, firms, and the economy. The study uses data from previous recessions, with implications for the current one: The research finds that when workers have access to Unemployment Insurance that provides the resources to cover their basic living expenses, they are able to take the time to find a job that fits their skillset and meets their needs, both financially and in terms of working conditions, rather than taking the first job they find. This not only benefits workers and their families but also allows firms to fill openings with the best-suited candidates for their jobs, increasing overall productivity—and causing positive ripple effects across the economy. The findings indicate that insufficient levels and durations of UI benefits during downturns may exacerbate inequality in the U.S. labor market, writes Gould-Werth. This is particularly disconcerting in amid the coronavirus recession.
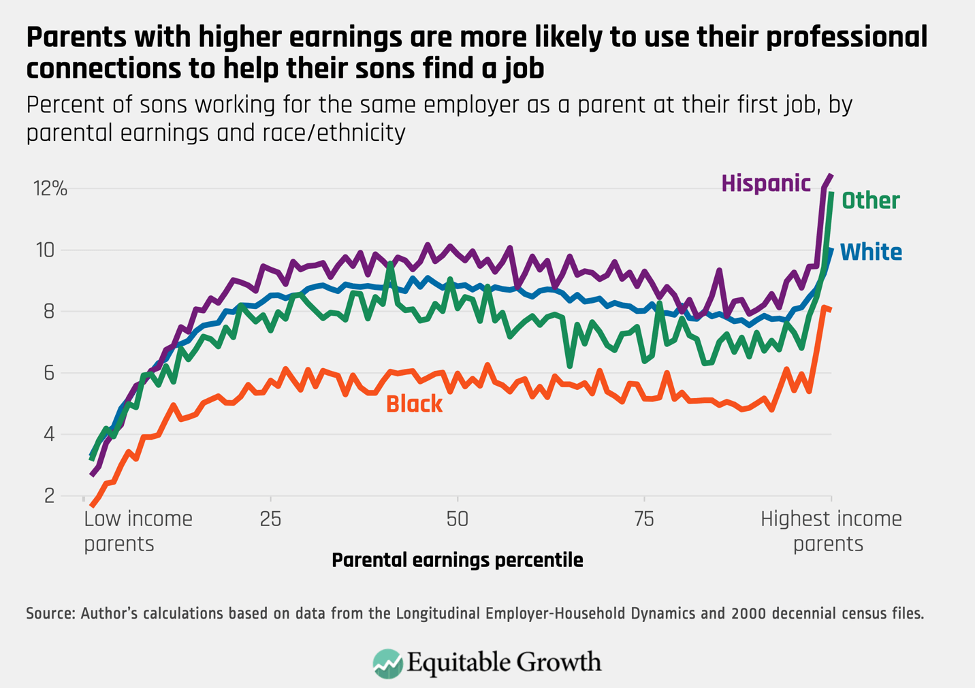
In the United States, an individual’s income is not only determined by level of skills or education, but also by the opportunities they have to deploy those skills in jobs that value them—which often comes down to networking. This balance between what you know and who you know in opening doors for economic prosperity makes it hard to break the cycle of poverty, writes Matthew Staiger, and runs counter to the American ideal of equality of opportunity. Staiger’s recent working paper looks at individuals who work at the same employer as a parent and the effects this has on earnings and opportunities. He finds that around 7 percent of individuals work for a parent’s employer at their first job and 29 percent do so by age 30—a trend which is associated with large earnings benefits, including 31 percent higher initial income at a first job. This exacerbates existing economic and racial inequalities in the labor market, Staiger shows, with non-Black males with high-earning parents benefitting the most.
The child care industry in the United States is facing twin crises: immediate challenges as a result of the coronavirus pandemic and recession that leave child care providers and families alike struggling, and larger structural challenges that were present even before the coronavirus began to wreak havoc on the country earlier this year. Sam Abbott explains how reforms to U.S. child care policy, while a step in the right direction, would benefit from further research to ensure that proposals appropriately target the right issues. Abbott highlights three gaps in child care research: the child care experiences of children of color, low-income children, older children, and their families; the experiences and impact of providing child care through home-based providers, as opposed to center-based care; and improving job quality and support for the child care workforce and the ways in which that increased support would improve care quality. He concludes with several opportunities and suggestions for those interested in conducting further research.
Every month, the U.S. Bureau of Labor Statistics releases data on the labor market. Today, it released data for the month of November, which showed that the jobs recovery is stalling, threatening low-wage workers and workers of color in particular. Kate Bahn and Carmen Sanchez Cummingexplain that despite an overall unemployment rate of 6.7 percent, it is 10.3 percent for Black workers and 8.4 percent for Latinx workers. They look at how the pandemic has affected different wages groups and why these effects are problematic for future economic growth. (You can also check out Bahn and Sanchez Cumming’s five graphs highlighting important trends in the data.)
Links from around the web
Instead of tax cuts, let’s talk about higher wages to grow the economy, writesThe New York Times’ Editorial Board. The pervasive narrative about economic growth has largely been about tax cuts—on both sides of the political aisle—and has been so pervasive, in part, because other policy ideas have not been seriously discussed as an alternative. But increasing workers’ wages should be the priority of economic policymakers under the new administration, the Board continues. Doing so can boost economic growth, which will be badly needed amid the continuing coronavirus recession, because workers who are paid more can also spend more across the U.S. economy. Higher wages must be paired with other policies, such as strengthening the safety net, addressing structural racism, and protecting the environment, in order to ensure a minimum quality of life, the board concludes. Wage growth alone is not a silver bullet, but it is a useful organizing principle and a valuable counterweight to tax cuts in the debate on how to grow the economy and increase productivity.
The lack of additional pandemic relief from the U.S. Congress is killing people and making the pandemic worse—a scary prospect considering the current surge in coronavirus cases and COVID-19 deaths we are experiencing, writes Vox’s Anna North. She explains the effects that Congress’ inaction is having not only on U.S. families, small businesses, and state and local governments, but also on the virus and its spread. North shows how the expiration of various emergency programs, from expanded Unemployment Insurance to eviction moratoriums, enacted to address pandemic early on has led to heartbreaking decisions for both employers and employees, pitting the U.S. economy against public health and safety. North urges policymakers to pass additional economic relief in order to help Americans contain the virus by staying home and sheltering in place without facing negative consequences at work.
One group of workers toiling around the clock to feed those who are lucky enough to stay home is food delivery workers. While food delivery app usage surged, the workers who are essential to these apps are struggling under worsening working conditions, reports Kimiko de Freytas-Tamura for The New York Times. Looking at New York City in particular, Freytas-Tamura writes that many of those who lost their jobs early on in the pandemic turned to gig work such as delivering food to users of DoorDash, Uber Eats, and GrubHub—all three of which are booming with heightened demand from people working from home. These gig workers already faced precarious conditions—from low wages to lack of benefits such as health insurance—prior to the onset of the coronavirus pandemic, and things have only gotten worse since. And not only are these often overlooked workers more vulnerable to getting the virus due to their inability to work from home and exposure to large swaths of the public; they also are facing rising crime rates in the city, including assault and bike theft. Freytas-Tamura tells the story of several of these workers and the various struggles, fears, and challenges they are facing.
An essential worker restocks the shelves at a Walmart in Salem, Ore., May 2020.
Today’s U.S. Bureau of Labor Statistics Jobs Report demonstrates a stalled jobs recovery following the deep and rapid economic decline brought about by the coronavirus pandemic. The unemployment rate has decreased slightly to 6.7 percent, but still remains higher than the 3.5 percent unemployment rate in February prior to the start of the coronavirus recession.
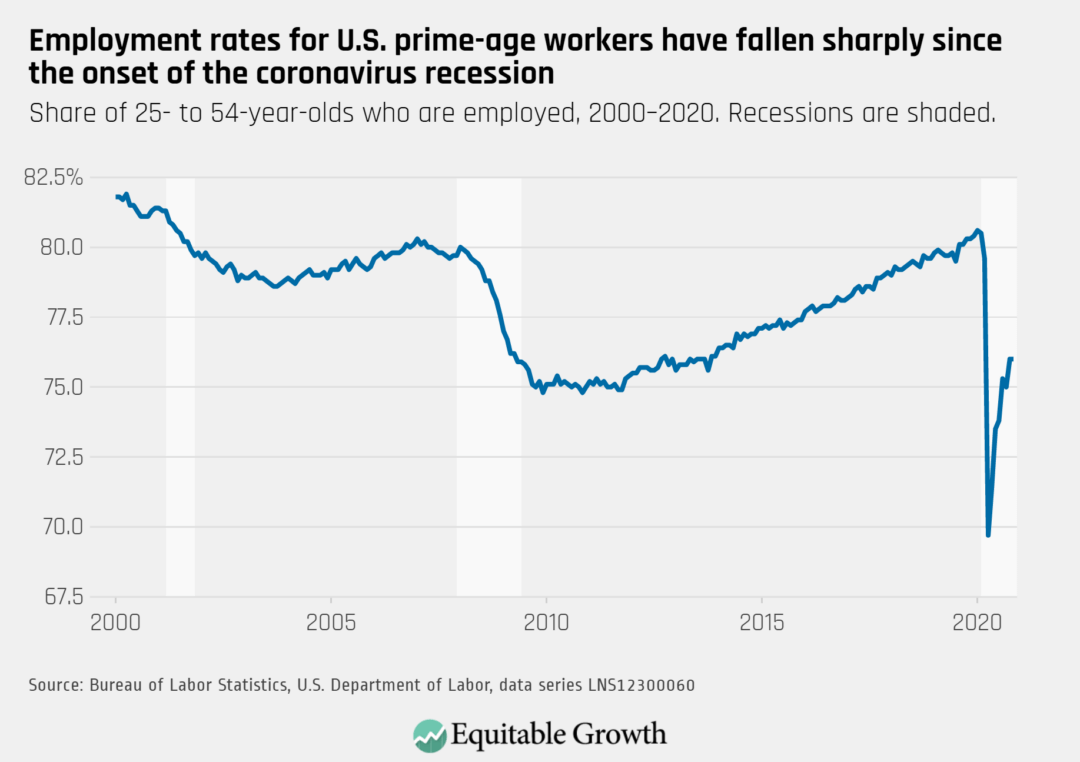
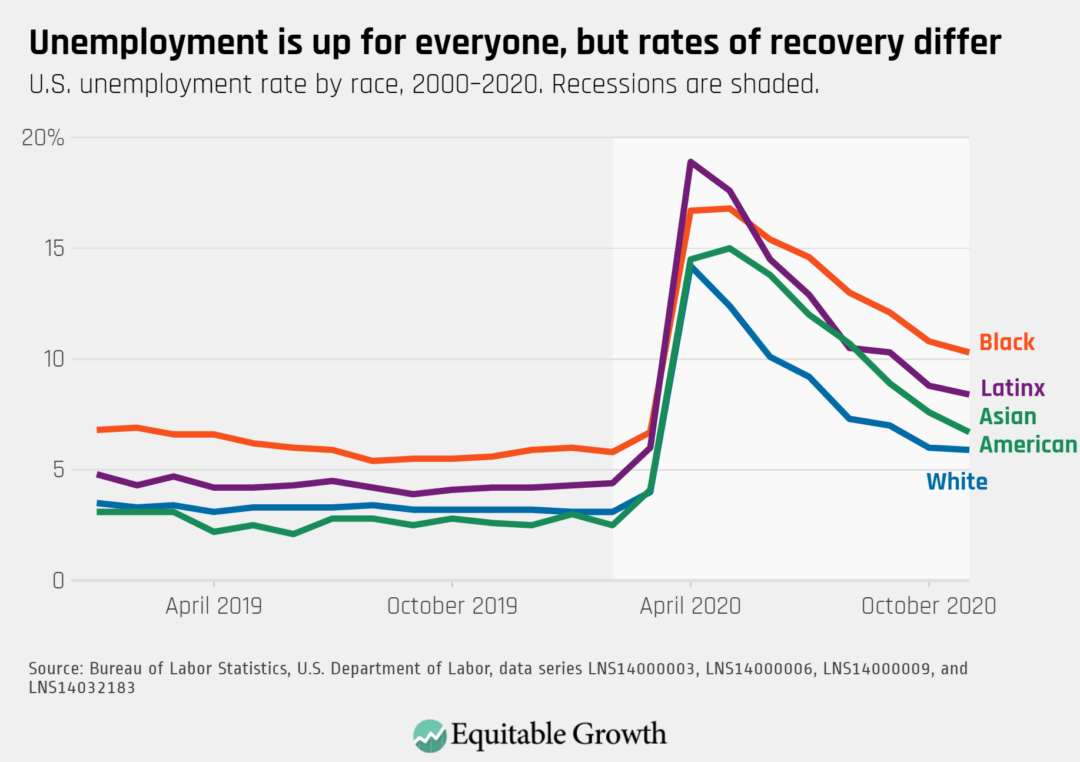
The workers who have been hit the hardest continue to be Black workers (10.3 percent), and Latinx workers (8.4 percent). Women workers saw a decrease in unemployment (6.1 percent) that was accompanied by a slight decline in labor force participation (57.1 percent). These workers are also disproportionately low-wage workers as the service sector industries in which most of these workers are employed are among the hardest hit. To put this in context, when the deepest effects of the pandemic hit the economy in April, the unemployment rate reached a post-World War era high of 14.7 percent and the prime-age employment-to-population ratio plummeted to 69.7 percent—a 10 percentage point drop from the previous month.
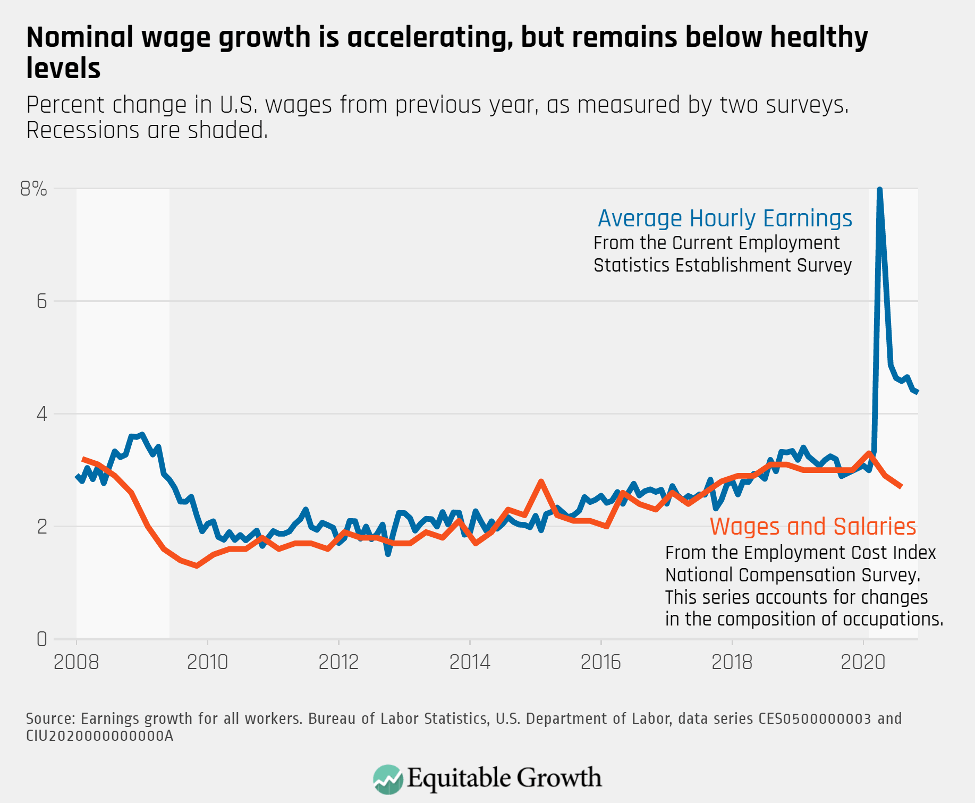
The same month, however, one important economic indicator pointed to another direction. Seemingly contradicting one of the main laws of economic theory, just as labor demand plummeted—when economists would expect wages to decline in tandem—average hourly earnings jumped 8 percent in April relative to the same month of 2019. This massive rate of growth is not even observed during booms: Using this same measure, average wage growth did not surpass 3.8 percent at any point during the 2009–2020 economic expansion. This month wage growth normalized somewhat, with an average worker in the private sector earning $29.58 $an hour, a 4.19 percent increase from the year before.
The Bureau of Labor Statistics provides a disclaimer in the Employment Situation Summary that “the large employment fluctuations over the past several months—especially in industries with lower-paid workers–complicate the analysis of recent trends in average hourly earnings.” While higher-wage workers are more likely to be able to telecommute during the current public health crisis, low-wage workers are more likely to lose their jobs. The coronavirus recession has led to a unique contraction of the service sector, changing the composition of employment in the overall U.S. labor market.
As research by Peter Ganong at the University of Chicago Harris School of Public Policy and Pascal Noel and Joe Vavra at the University of Chicago Booth School of Business shows, unemployment this year is greater for low-income workers. They estimate that workers’ whose pre-job loss weekly earnings put them in the bottom 20 percent of earnings distribution were experiencing a jobless rate of 16 percent between April and July of 2020. Those in the top 20 percent of the income ladder, by contrast, were experiencing an unemployment rate below 4 percent.
As lower-income workers disproportionately lost their jobs, higher-earning workers were more likely to remain employed, which taken together mechanically increases average earnings. Similarly, research by the Federal Reserve Bank of San Francisco shows that in these first months of the coronavirus recession, workers in the bottom quartile of the earnings distribution represented about 1 in 2 of all transitions out of employment.
When looking at other metrics of wage growth, another picture emerges. Accounting for changes in the composition of occupations by measuring wage and salary growth for a fixed set of jobs, the Employment Compensation Index of the National Compensation Survey shows that rather than accelerating, wage growth has slowed down. (See Figure 1.)
Figure 1
At the onset of the pandemic there was some expectations that the earnings of essential and front-line workers would rise. According to the hypothetical premise of “compensating wage differentials” in labor economics, employers need to make more attractive offers in order to convince workers to do risky or undesirable jobs. In the early months of the health and economic crises, there was some evidence that this would be the case. Companies such as Amazon.com Inc., Costco Wholesale Corp, and Walmart Inc. offered front-line and essential workers—cashiers, warehouse, and fast-food workers, for example—hazard pay, bonuses, and sick paid leave.
That is largely no longer the case. Many workers on the front lines and concerned about getting sick are no longer receiving extra compensation. According to a poll commissioned by the Economic Policy Institute, in mid-May only about 30 percent of respondents working outside from home were receiving some kind of hazard pay, even as more than 50 percent were concerned about contracting the coronavirus and falling ill from COVID-19, the disease caused by the virus. Throughout the late summer and fall, even as the health crisis continued to put workers at risk, many businesses cut those benefits.
As the public health crisis worsens, states are maintaining partial opening or strengthening so-called lockdowns to limit the surge of the pandemic. Economist Trevon Logan at The Ohio State University estimates that hour reductions during peak hours for bars after 10 p.m. as well as limited capacity requirements in restaurants and bars are translating into at least a 50 percent wage cut for many service workers.
It’s important for economists and policymakers alike to consider where the U.S. labor market is today compared to prior to the pandemic. Back then, wage growth had finally started to ramp-up for the first time in years. As many states and cities increased their minimum wage and the labor market tightened, wage growth accelerated the most for the lowest earners, yet significant income inequality and differences in unemployment rates by race remained persistent. Now, after the coronavirus recession caused an unprecedented number of jobs lost and widespread pay cuts, elevated unemployment rates will likely exert downward pressure on wages as workers find fewer jobs options and grow increasingly desperate as unemployment benefits expire.
This is why it’s essential to put forward policies that help maintain labor standards, including increasing earnings through minimum wage increases and ensuring workplace safety amid the pandemic so that an eventual recovery is robust and resilient, rather than further entrenching economic inequality. Recent research and today’s Job Report further emphasizes the need to center economic policies around the well-being of the hardest hit workers to ensure they won’t have to wait another 10 years for strong wage growth.
On December 4, the U.S. Bureau of Labor Statistics released new data on the U.S. labor market during the month of November. Below are five graphs compiled by Equitable Growth staff highlighting important trends in the data.
Prime-age employment held steady at 76 percent showing no improvement in November, after a steep decline in the spring and only a partial recovery in the summer and fall.
The unemployment rate for Black workers remained in double digits at 10.3 percent, while the unemployment rate for White workers declined slightly to 5.9 percent due to workers dropping out of the labor force.
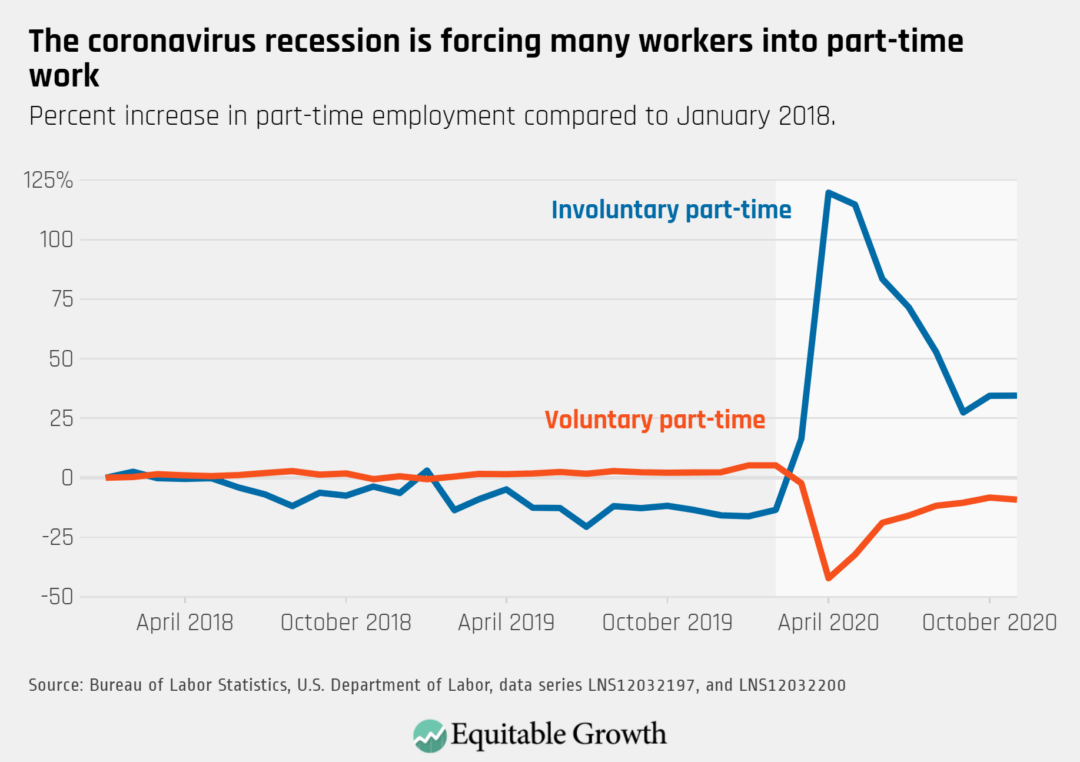
Part-time workers who would prefer full-time work saw no improvement in November as involuntary part-time employment remains 2.3 million above the February level.
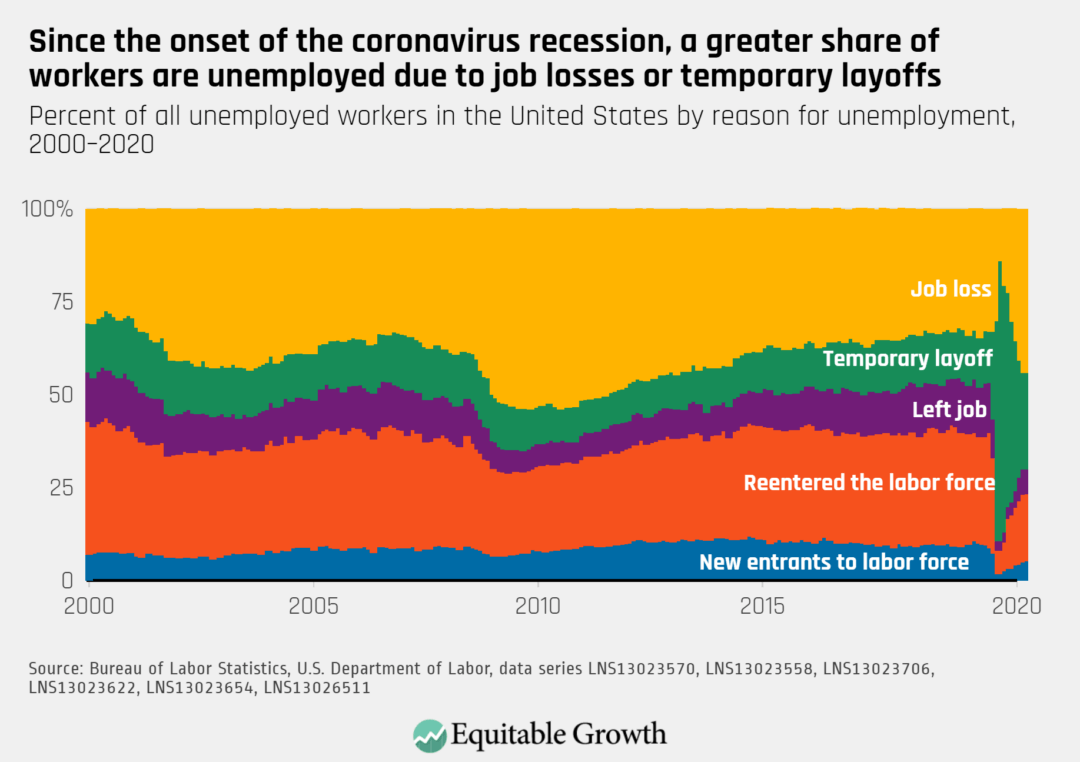
An increasing proportion of unemployed workers are permanent job-losers with those on temporary layoff, voluntarily leaving their job, and reentering the labor market all declining.
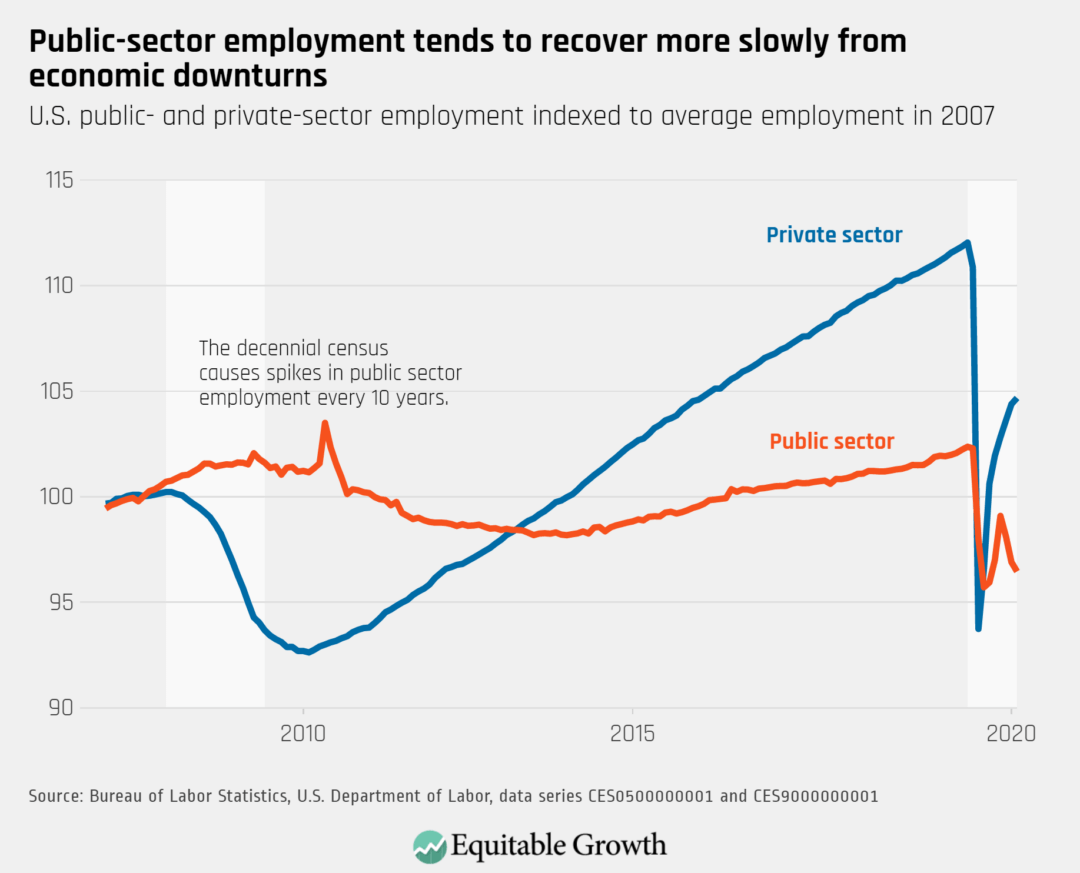
Employment in government dropped for a third consecutive month, decreasing by nearly 100,000 jobs in November.
Working for a parent’s employer increases an individual’s initial earnings at a first job by 31 percent.
In the United States, an individual’s income tends to be closely related to their parents’ income. This fact—that children born into poverty in this country are likely to remain in poverty as adults—runs counter to the American ideal of equality of opportunity. Furthermore, this pattern raises the concern that the U.S. economic system fails to provide all individuals with the opportunity to reach their full potential.
Individuals from disadvantaged backgrounds may earn less because they lack opportunities to developskills that are rewarded in the U.S. labor market, or because structural barriers in the labor market prevent them from fully deploying their skills. The vast majority of research in economics focuses on the development channel, finding that families, neighborhoods, and schools all play an important role in shaping the development of skills. Yet an individual’s income is not just determined by their skills (“what you know”), but also by the opportunities they have to deploy those skills in the marketplace.
Recent evidence suggests that the firm at which an individual is employed is also an important determinant of earnings. Furthermore, more than half of all jobs are found through a social contact, and thus, access to jobs at high-paying firms depends, in part, on who you know.
This is why parents also can affect how the skills of their children are deployed in the U.S. labor market, by using their connections to provide access to high-paying firms. In a recent working paper, “The Intergenerational Transmission of Employers and the Earnings of Young Workers,” I study one way in which parents might do this by focusing on the connections that operate within the parent’s current employer.
My paper has three main findings. First, it is not uncommon for an individual to work for a parent’s employer. I study the experiences of 17 million young workers by linking survey data from the 2000 decennial census, which measures the relationship between parents and children, to administrative data from the Longitudinal Employer-Household Dynamics program, which measures the earnings of the individual, as well as characteristics of their employer. I find that 7 percent of individuals work for a parent’s employer at their first job and 29 percent do so at some point between the ages of 18 and 30.
There are a number of explanations for why someone might work at the same firm as a parent. For example, parents and their children may tend to work for the same employer if there is a single employer that dominates the local labor market. However, individuals who work for a parent’s employer are no more likely to work at large firms and tend to be located in urban areas. Rather, several pieces of evidence suggest that parents use their connections to help children who would have otherwise struggled to find a decent-paying job.
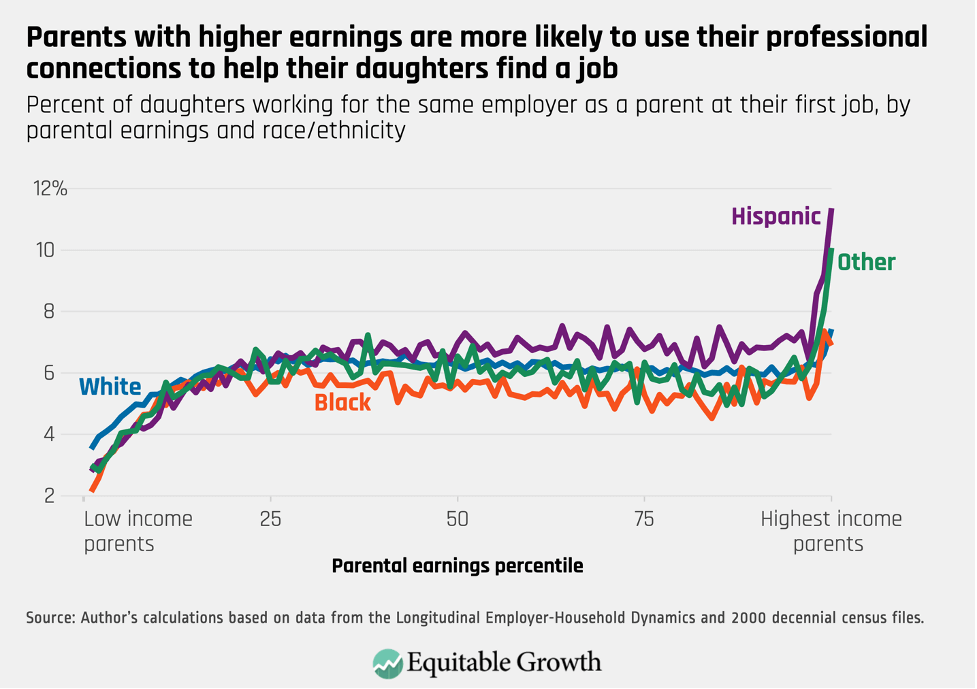
Figure 1 below presents the proportion of daughters who find their first job at the same employer as a parent, broken out by parental earnings and race/ethnicity. The estimates indicate that individuals with higher-earning parents are more likely to work for the employer of a parent, which could be attributable to the fact that parents with higher earnings are more likely to be employed and more likely to hold a position of authority within the firm. Figure 2 demonstrates that the same pattern is evident for sons.
Figure 1
Figure 2
Second, there are large earnings benefits associated with working for a parent’s employer. Estimating the causal effect of working for a parent’s employer is difficult because individuals who work for a parent’s employer are likely different from those who do not. I address this concern by using an instrumental variables estimator that exploits exogenous variation in the availability of jobs at the parent’s employer. Intuitively, some individuals will only find a job at their parent’s employer when there are many job opportunities at that firm (the firm is hiring intensively).
My empirical strategy compares individuals who are looking for a job in times when their parent’s employer is hiring intensively to individuals who are looking for a job in times when their parent’s employer is not hiring intensively. This comparison provides a way of estimating the causal effect of working for a parent’s employer since the only difference between the two groups (after controlling for differences across the parents’ employers and local labor market conditions) is that one group is more likely to work for their parent’s employer.
I find that working for a parent’s employer increases an individual’s initial earnings at a first job by 31 percent, and individuals with higher-earning parents experience a larger increase in earnings. By looking at the characteristics of the employers, I find compelling evidence that the individual-level earnings gains are explained by parents providing access to higher-paying firms. For example, parents provide access to jobs in construction, which tend to pay much better than jobs at fast-food restaurants. The earnings benefits persist for years after the individual starts their first job, suggesting that parents provide access to jobs that have higher starting wages and also offer better opportunities for career advancement.
Third, the close relationship between an individual’s earnings and their parents’ earnings is partly attributable to individuals with higher-earning parents being more likely to work for a parent’s employer and benefit more when they do. The magnitude of the effect is modest—the association between an individual’s earnings and their parents’ earnings would be about 10 percent weaker if no one worked for the employer of a parent. But it is important to keep in mind that parents may have other connections through friends, classmates, or former co-workers.
In this way, my results raise the possibility that parental labor market networks (more broadly defined) are an important channel through which parents shape the earnings of their children. When cutting the results by race/ethnicity, sex, and parental earnings, I find that non-Black males with high-earning parents benefit more from working for a parent’s employer than any other group, further exacerbating racial disparities in earnings.
Both within academic and policy spheres, the prevailing narrative surrounding economic opportunity focuses on the development of skills. Educational programs such as Head Start, which provides access to early childhood education, and the Pell Grant program, which helps low-income students and their families pay for college, are both examples of programs that promote the development of skills for individuals from disadvantaged backgrounds. Yet my results highlight that even with equal skills, individuals from disadvantaged backgrounds will tend to earn less because their parents are less able to use their connections to provide their children with access to high-paying jobs. This is just one example of how structural inequities in the U.S. labor market are an important channel through which equality of opportunity is undermined and why, therefore, a focus solely on improving education and skills is insufficient to ensuring true equality of opportunity.
These dynamics are particularly important in the current U.S. economic environment. I find that less-educated workers searching for jobs in periods of high unemployment are most likely to rely on parental connections. So, as policymakers begin to think about how to power the economic recovery from the current coronavirus recession, closing the skills gap is likely to be an insufficient solution to eliminating disparities in earnings across groups. Instead, education-focused policies should be combined with additional efforts that aim to directly address disparities in access to jobs—for example, programs that provide job guarantees or mentorship opportunities.
At the outset of the coronavirus pandemic earlier this year, millions of U.S. workers lost their jobs. In March, the U.S. Congress took notice and decided that the 26 weeks of Unemployment Insurance typically provided by states were not enough for an employment crisis that would likely extend beyond 6 months. Through the new Pandemic Emergency Unemployment Compensation program, it provided people who lost jobs through no fault of their own with an additional 13 weeks of benefits.
Today, coronavirus cases counts are skyrocketing, hospitals are filling, businesses are closing, and long-term unemployment is surging. But some workers have already run out of benefits, and the PEUC program is set to expire on December 26, leaving 8.1 million workers without any income support through this emergency 13-week benefit extension.
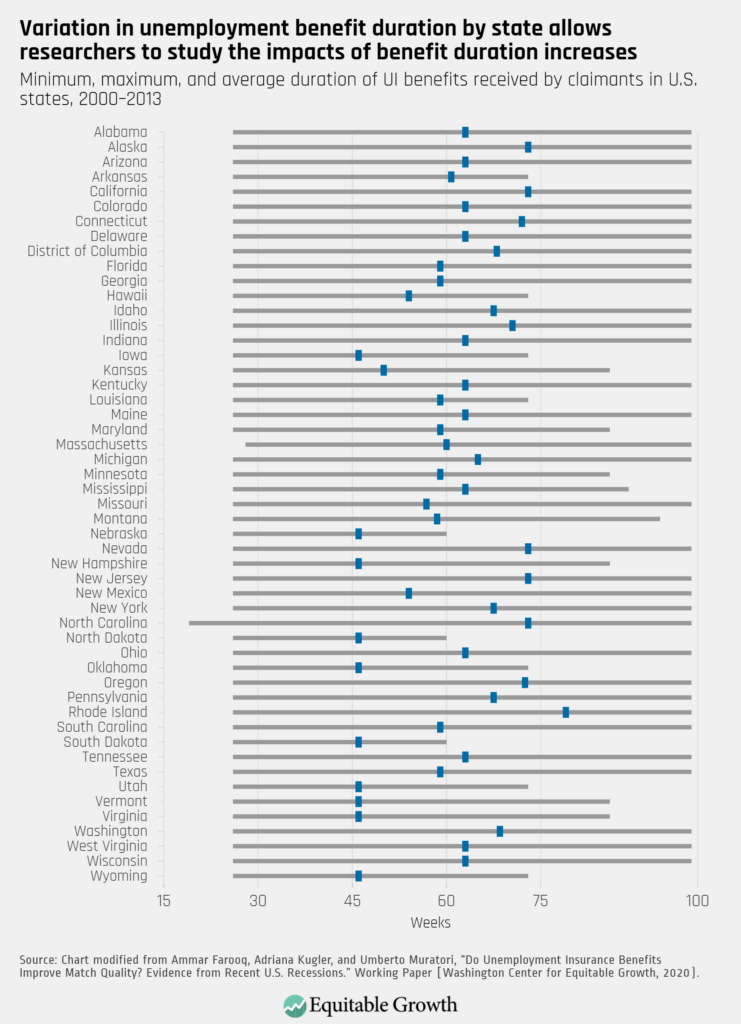
The expiration of the Pandemic Emergency Unemployment Compensation program means devastation for workers and their families this December. But research released earlier this year by Adriana Kugler and Umberto Muratori at Georgetown University and Ammar Farooq at Uber Technologies Inc. shows that the effects of the PEUC expiration are likely to persist far into the future for workers whose benefits expire, and ripple through the U.S. economy to affect firms and workers searching for well-matched employment relationships.
The basic idea behind this research is intuitive. When people have resources to meet their basic needs while out of work, they can take the time they need to find the right job for them, rather than taking the first work opportunity that comes along. Workers benefit because they find jobs that pay more and meet their needs more broadly, and firms benefit because they recruit workers with the right skills for the job. While the idea makes sense, it hasn’t been backed by much evidence in the U.S. context, in part because of data limitations.
This makes it particularly exciting that this research team was able to access data from the Longitudinal Employer Household Dynamics database, which matches administrative information about workers and their earnings with administrative information about their employers. Using these data, as well as information from the Current Population Survey and the natural experiment that occurred when different states offered different durations of unemployment benefits during the Great Recession of 2007–2009 and its aftermath, Farooq, Kugler, and Muratori take a close look at how job seekers and firms fare when the duration of unemployment benefits is extended. (See Figure 1.)
Figure 1
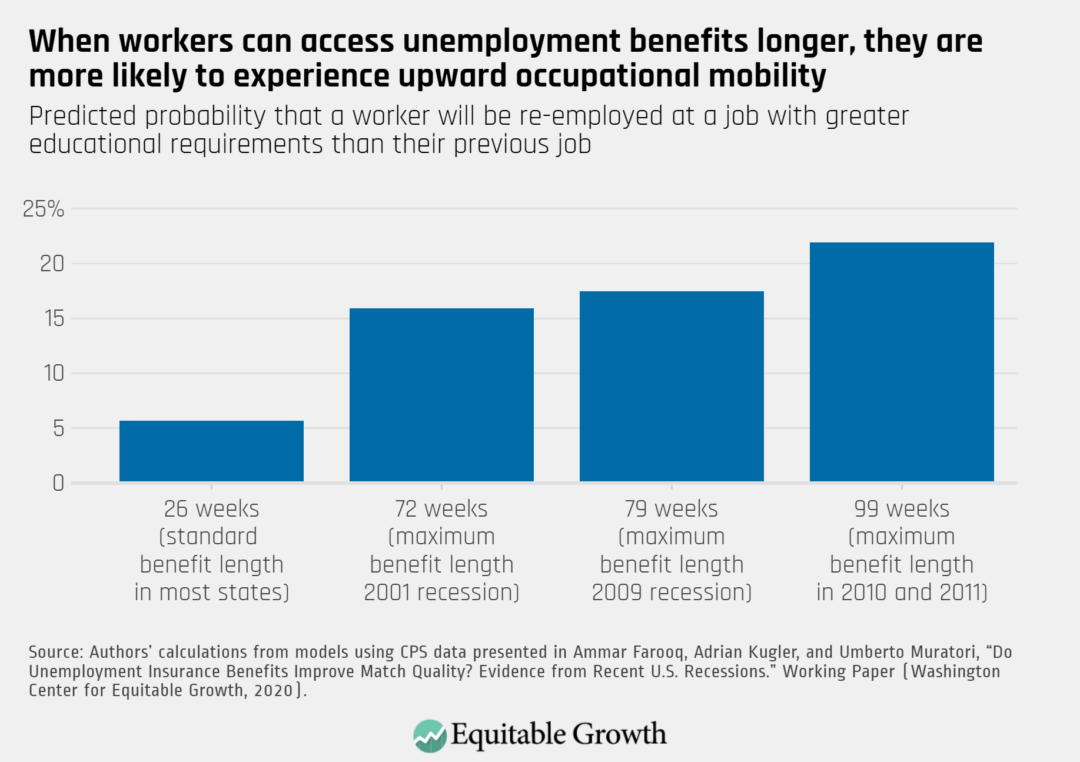
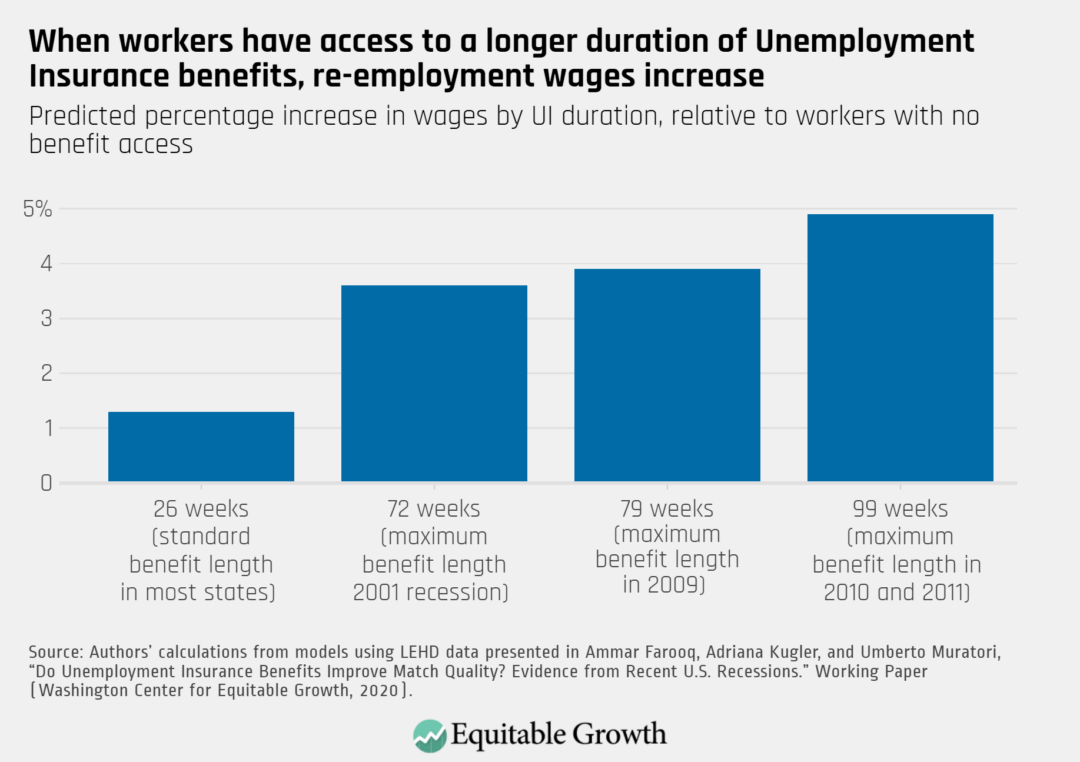
Farooq, Kugler, and Muratori find that the longer you have access to unemployment benefits, the higher paying the job that you eventually find is and the more your skills and training get put to use. (See Figures 2 and 3.) Access to the full extended emergency benefits during 2009, which increased benefits from 26 weeks to 79 weeks, increases re-employment wages by 2.6 percent and also increases the probability that a worker will be re-employed in a job that requires more education than their previous job by 11.7 percentage points.
Figure 2
Figure 3
The idea that workers match their talents with job openings that put their skills to use is not just good news for those workers. It matters for firms and the broader economy as well. Farooq, Kugler, and Muratori take advantage of their dataset, which allows them to follow individual workers over time and also to see the full workforce of the firms with which they eventually find re-employment. Using these features of the data, they find that higher-quality firms are better able to recruit workers that have the abilities they need. This creates a chain reaction that spreads through the U.S. economy. The authors describe it eloquently:
These results suggest that if a worker can receive UI benefits for a longer period, she will be able to find a job with an employer that is closer to her in terms of quality. This worker then is likely to leave another job open for someone else who is also likely to be better matched, and in turn that other worker can also leave vacant another job and relieve it to someone else, generating a chain reaction that makes many other workers, beyond the one receiving the UI extension, match better in the labor market.
In this manner, the benefits of extended unemployment benefits ripple past a worker’s current situation to affect their future job prospects, the productivity of firms, and the experiences of workers across the economy.
Particularly striking is the fact that the positive effects of extended unemployment benefits are larger for workers who are members of groups that lack funds for a rainy day. Because of labor market discrimination, unequal access to education and training, caregiving obligations, and stagnating wage levels, members of demographic groups, including women, people of color, and less-educated workers, typically lack the private savings held by their counterparts who are members of more advantaged groups.
Indeed, this research finds that during the Great Recession and its aftermath, women, people of color, and low-educated workers improve their job matches when they have access to unemployment benefits even more than their counterparts who are members of wealthier demographic groups. The research team finds that a 53-week increase in UI benefits improves the job-match quality by 0.9 percent for White workers, but improved match quality even more for workers of color: The effect size for workers of color is 1.2 percent.
Similarly, Farooq, Kugler, and Muratori find that workers of color (along with women, less-educated workers, and young workers) see larger returns to increased weeks of benefits when it comes to wage levels. This supports the idea that the improved fit between workers and the jobs they find stems from workers’ ability to spend more time searching for a job that is a good match, without sacrificing their basic needs in the short term.
Their findings also suggest that insufficient durations of unemployment benefits during moments of macroeconomic contraction exacerbate inequality in the U.S. labor market. This concern is magnified during today’s coronavirus recession because the sectors of the U.S. economy that have been hardest hit are the same ones where women, people of color, and low-educated workers are overrepresented.
There is another reason that policymakers should be deeply concerned about the relationship between job matching and extended unemployment benefits during this crisis in particular. While this research speaks to job match in terms of workers’ education levels and wages, we can guess that the extended time provided for job search also allows workers to find jobs that are better matches for them along other dimensions—schedule flexibility, location, and working conditions. During the current public health crisis, working conditions are of outsize importance. The ability to be choosy about the health and safety conditions of one’s workplace is more likely to be the difference between life and death for a worker or a member of the worker’s family than is typical outside of the context of a public health crisis.
So, what to do about the upcoming expiration of the PEUC program? There is the obvious short-term fix—extend the duration of PEUC benefits so that all workers who are unemployed through no fault of their own can receive unemployment benefits for the amount of time it takes to find a job that is a good match for their skills and their health.
And then, there is the bigger structural issue. It’s clear from a macroeconomic perspective that the duration of unemployment benefits should extend automatically during moments of economic contraction. Indeed, a permanent program called the Extended Benefits program is designed to do just this. But the formulae we rely on (known as “triggers”) to turn on Extended Benefits are broken, and we are repeatedly left in the situation we find ourselves in today: waiting on political horse trades to enact common sense, economically necessary policy decisions through one-off emergency benefit extensions.
So, to make unemployment compensation work for workers and for the economy as a whole in both the short- and long-term, policymakers should extend PEUC today, but they shouldn’t stop there. They should also redesign Unemployment Insurance permanently with improved automatic stabilizers so that payment extensions trigger automatically when economic conditions warrant.
The child care industry in the United States is facing a crisis on two fronts. In the short term, the coronavirus pandemic and the recession it caused leaves child care providers struggling to stay afloat and families embattled in work-life conflicts with no clear end in sight. Yet structural problems with the nation’s child care industry existed long before the novel coronavirus came to our shores.
The coronavirus recession is shining a light on ongoing challenges within the child care industry and the patchwork of public policies designed to help families access care—an economic crisis decades in the making. Child care has long been too expensive, hard to access, and low quality.
Advocates, experts, and even presidential candidates across the political spectrum have proposed long-term reforms to U.S. child care policy. Frequent components of these reforms—including increased subsidies to families, training and support for the workforce, and investments in communities’ supply of child care centers and providers—are likely to make meaningful differences in families’ experiences with the child care system.
Even the most comprehensive plans, however, would benefit from additional academic research. New data-driven scholarship would ensure that any reforms are appropriately targeted, structured, and culturally attuned for the families that use this care.
There is a rich body of literature on child care in the United States, but several policy-relevant research gaps persist that could have implications for proposed reforms to the child care system. To begin filling these gaps, this past September, the Washington Center for Equitable Growth convened a roundtable of researchers who study child care and related topics. The purpose of this roundtable was to discuss where such holes in the literature might exist and promising strategies for future studies.
This column summarizes these conversations and points toward potential opportunities for scholars interested in engaging in policy-relevant child care research. Equitable Growth is committed to supporting this research. (See inset.)
Equitable Growth supports new, policy-relevant child care research
The experience of the coronavirus recession refocused policymakers’ attention on child care. As the Biden administration and the incoming 117th Congress work to address the economic recovery and the structural inequalities exposed by the public health crisis, child care policy must be top-of-mind in 2021 and beyond. High-quality, policy-relevant research can help policymakers craft child care reforms that are more accessible, more affordable, and more equitable than the current system.
The Washington Center for Equitable Growth is committed to supporting researchers engaged in this work. That’s why, in 2021, Equitable Growth is interested in funding academic research projects that can inform this critical policy conversation. Child care researchers interested in applying for funding support—or learning more about Equitable Growth’s other funding priorities—are encouraged to review the 2021 Request for Proposals for more information.
Research gap 1
Research on the child care experiences of children of color, low-income children, older children, and their families
The roundtable began with a conversation about the children and families that use child care, and how our understanding of families’ behaviors may be limited by existing research. Many child care reform options, such as expanded subsidies or local investments in the child care infrastructure, are built on assumptions about the type of care families want and need, as well as the appropriateness of available care types. If these assumptions are incorrect or cannot be generalized beyond a specific subpopulation or care type, then they limit the impact of any policy change.
Scholars have information on the types of care that families use now, but these family decisions are constrained by the system that is currently available. This makes it difficult for researchers to determine how a significantly altered child care landscape would satisfy or fail to meet families’ needs. For certain subgroups and populations, there is a deep lack of high-level understanding of current child care use.
The roundtable participants noted that questions of child care “preferences” are a difficult concept. These preferences are often fluid with family circumstances and the available child care landscape. The primary challenges with this type of research are limitations in available data sources—a point repeated throughout the roundtable discussion.
These limitations arise in longitudinal data sources that may not capture the necessary nuance of families’ child care experience or contain insufficient samples of specific subpopulations, including racial and ethnic groups, immigrants, and refugees, to conduct statistically rigorous analyses. Data on the supply of child care providers are often insufficient as well, compounded by difficulties identifying and classifying home-based child care providers. Without such data, even understanding the menu of options available to families in different communities and subpopulations is difficult.
For researchers interested in studying child care users, there is space for research on the type of child care that families want and need, disaggregated by family demographic characteristics, labor force status of parents/guardians (including occupational characteristics and work schedules), family income, and local economic factors. Research should be highly targeted to these groups, which include underrepresented racial minorities, immigrant communities, refugee communities, and territorial communities.
Research gap 2
The experiences and impacts of providing care through home-based providers
Following the discussion on child care users, the roundtable shifted focus to provider types, particularly home-based providers. While most children are currently cared for in a home setting, much of the attention among researchers and policymakers has been directed toward larger child care centers. In the absence of additional information, policymakers may choose to invest public dollars primarily in center-based care, even if home-based or informal care settings can better meet the needs of families. Home-based care, rather than center-based care, is a vital component of the child care industry and would benefit from additional attention from researchers and policy experts.
In this roundtable conversation, the participating scholars focused on how the notion of “quality”—how it is defined, measured, and valued—can be obscured in home-based settings. Many formal definitions of quality may be too narrowly focused on child development and cannot account for the unique features of care offered in a home setting.
Because benchmarks for quality are tied to the subsidies families can use to offset the cost of care, applying quality measures better-suited for center-based care to the home environment could have the unintended consequence of preventing families from accessing care that best meets their needs. Policymakers and researchers should focus on these questions of quality in home-based settings. And they must be explicit in their definitions and responsive to the strengths of each provider type.
For researchers interested in studying child care providers, more research on home-based care that drills into the differences between care types would contribute to the policy conversation. Specific attention should be paid to unlicensed providers—including those legally unlicensed or operating in an “underground” market—and to the practices, needs, and viable support options for informal providers, including families, friends, and neighbors. Within these provider types and subpopulations, questions remain about how quality can be accurately measured and supported in these settings, particularly in comparison to center-based care. This research could help policymakers better support providers in qualifying for subsidies and other funding opportunities.
Research gap 3
Improving job quality and support for the professional and the family, friends, and neighbors, or FFN, workforce and the impact of that support on the quality of care
The roundtable concluded with a discussion of the child care workforce. Research suggests that the characteristics of the child care workforce are associated with the quality of care children receive. Yet the relationship between the quality of care and the experience of the workforce is not always clear. Understanding the workforce that provides care—their methods, experiences, needs, and preferences—is critical to understanding how to adequately support and pay workers so that care quality improves without sacrificing affordability.
In addition to the professional workforce, more information is needed on the experiences and needs of nonprofessional or quasi-professional caregivers such as grandparents and neighbors. While often uncompensated, these caregivers are an important part of the child care workforce and could benefit from public support, including financial assistance, training, curriculum development, and more. Yet limited information on who these providers are, what supports they require, and what supports are effective limit the reach and effectiveness of policy interventions.
In discussing these topics, the participating scholars pointed to the siloed nature of child care research as one factor limiting the understanding of the child care workforce. The roundtable participants pushed future scholars to undertake research and partnerships that examine the intersections of children, families, providers, and the workforce in tandem. The workforce has a significant impact on the children and families they encounter and should be front and center in any evaluation of program quality or families’ experiences and outcomes.
For researchers interested in studying the child care workforce, there are several policy variants they could explore, including regional increases to the minimum wage or local requirements that workers have college degrees. Of course, these policy variations cannot be examined in a vacuum and should be explored across types of care. For example, self-employed home-based providers are exempt from minimum wage laws, but policymakers have an interest in knowing if such laws have any spillover effect on these self-employed workers’ wages, hours worked, or number of enrolled children.
For the family, friends, and neighbors, or FFN, workforce, policymakers simply need more information. More research is needed on the types of care this workforce is providing, the methods for effectively supporting FFN caregivers, and the effects of providing this care on caregivers. Previous research on this population calls for further work that can illuminate FFN caregiving practices by race/ethnicity, parental work status, family structure, and subsidy access. Since so many families rely on families, friends, and neighbors to get the child care they need, these caregivers warrant attention from researchers and policymakers on par with their professional counterparts.
Opportunities and suggestions for future research
In comments that wove throughout the roundtable discussions, the participating scholars had several ideas and recommendations for researchers studying these topics.
Engage families, providers, and caregivers in the research process
Community-based participatory research, a more common practice in the fields of public health and social work, can connect researchers with actors in the child care sphere who may be obscured by traditional methods of data collection. Engaging and empowering all parties involved in the child care industry will help researchers develop a more holistic understanding of how child care policy is impacting the families and providers entrenched in the system.
Take advantage of mixed-methods research to overcome data limitations
Multidisciplinary research teams and mixed-method research designs may shed light on certain subpopulations currently masked by available data sources. Supplementing quantitative analyses with qualitative methods can help researchers in the field engage with parents, workers, and FFN caregivers on a more intensive level, capturing the nuance of their needs and experience in the current child care system.
Think outside the box to identify novel data sources
Researchers at the roundtable encouraged creativity in finding data sources that can shed light on the child care industry. One participant, Christ Herbst of Arizona State University, shared his experience using data from the websites Yelp and Google Trends to learn more about families’ child care preferences. These data sources could supplement the “alphabet soup” of federal surveys and administrative datasets, and fill in information that’s often obscured in these traditional sources.
Approach child care research with a wide-angle lens
For researchers interested in studying child care, the overarching advice from scholars at the roundtable was to approach the industry from a broad perspective. This involves analytical frameworks that account for the industry’s myriad of interdependent components influencing child and adult experiences. In addition to the traditional factors used to assess child care (cost, quality, and accessibility), researchers should also consider concepts of job quality and child care’s role as a work support for families.
Conclusion
The Washington Center for Equitable Growth is committed to supporting researchers engaged in this work. That’s why, in 2021, Equitable Growth is interested in funding academic research projects that can inform this critical policy conversation. Child care researchers interested in applying for funding support—or learning more about Equitable Growth’s other funding priorities—are encouraged to review the 2021 Request for Proposals for more information.
1. Read Bill Baer, Jonathan B. Baker, Michael Kades, Fiona M. Scott Morton, Nancy L. Rose, Carl Shapiro, & Tim Wu, “Restoring competition in the United States,” in which they write: “The incoming administration and the 117th Congress present an important opportunity to rethink fundamental questions surrounding U.S. antitrust laws and their enforcement. We need a new, bolder vision for competition policy. Antitrust enforcement must optimize deterrence, and promoting competition must be a priority across the government, not just for antitrust enforcers … Three fundamental changes [needed are] … Devote resources to the passage of new antitrust legislation and increase resources for antitrust enforcement … Revitalize antitrust enforcement with a focus on strengthening deterrence … Commit to a “whole government” approach to competition policy.”
2. Read Aaron Kesselheim, “How to bring down the price of drugs such as the novel coronavirus therapy remdesivir,” in which he writes: “This issue brief discusses the ownership and costs of prescription drugs, as well as potential policy initiatives in this area, through the lens of one prescription medication, the antiviral drug remdesivir.”
Worthy reads not from Equitable Growth:
1. I plead for more expansionary fiscal policy in “The Siren Song of Austerity,” in which I write: “Among the many lessons of the 2008 financial crisis and its aftermath in the United States is that there is no good reason to start worrying about debt when unemployment remains high and interest rates low. The hasty embrace of austerity derailed the last recovery, and it must not be allowed to do so again: Ten years and ten months ago, U.S. President Barack Obama announced in his 2010 State of the Union address that it was time for austerity. ‘Families across the country are tightening their belts and making tough decisions,’ he explained. ‘The federal government should do the same.’ Signaling his willingness to freeze government spending for three years, Obama argued that, ‘Like any cash-strapped family, we will work within a budget to invest in what we need and sacrifice what we don’t.’ So great was the perceived need for austerity that he even vowed to ‘enforce this discipline by veto,’ just in case congressional Democrats had something else in mind.”
2. This is extremely destructive, pointless, and stupid. With coronavirus cases rising rapidly, with uncertainty rife, and with Congress gridlocked, the U.S. Treasury should not be in the business of putting caltrops in front of the Federal Reserve. Read James Politi and Colby Smith, “US Treasury refuses to extend some of Fed’s crisis-fighting tools,” in which they write: “The U.S. Treasury has decided not to extend several emergency lending facilities set up by the Federal Reserve at the start of the coronavirus pandemic, prompting a rare expression of disappointment from the central bank, which warned that the economy remained “strained and vulnerable.” In a letter to Fed chairman Jay Powell on Thursday, Steven Mnuchin, Treasury secretary, asked the central bank to return unused funds from five emergency programs that are set to expire in late December.”
This is a post we publish each Friday with links to articles that touch on economic inequality and growth. The first section is a round-up of what Equitable Growth published this week and the second is relevant and interesting articles we’re highlighting from elsewhere. We won’t be the first to share these articles, but we hope by taking a look back at the whole week, we can put them in context.
Equitable Growth round-up
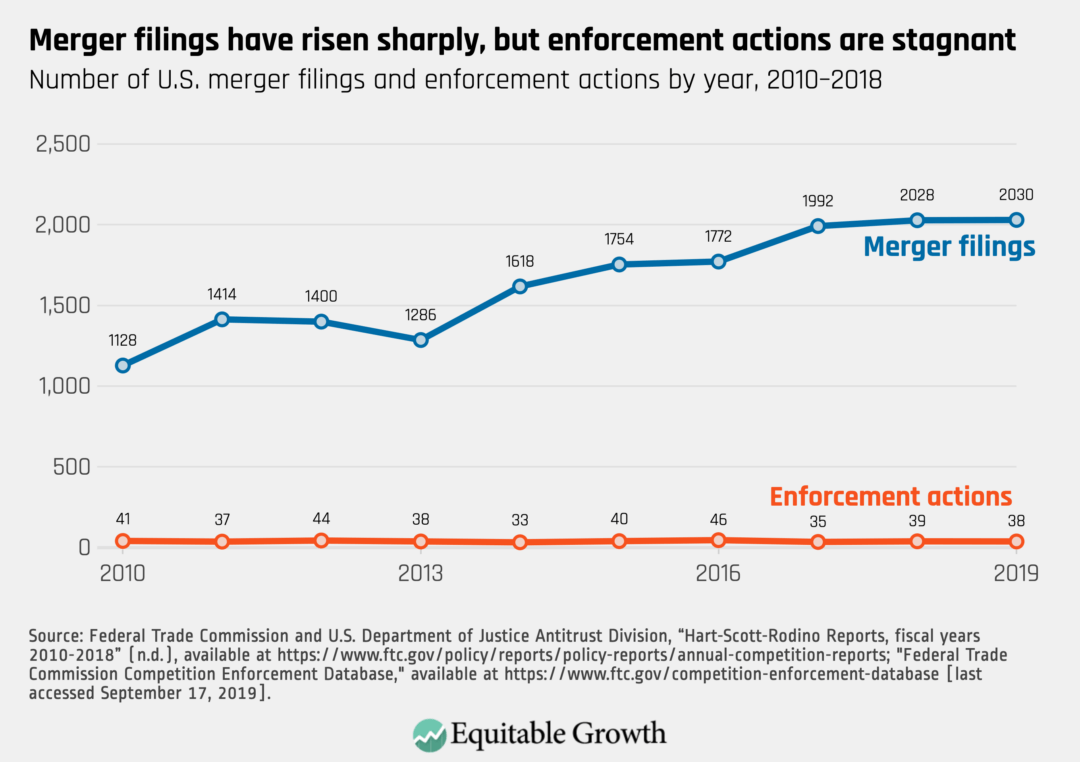
The next administration and the incoming 117th Congress being sworn in early next year provide important opportunities to address the U.S. antitrust laws and ways in which we can restore competition across the U.S. economy. Market power is now at the point of being untenable in many U.S. industries and areas, disrupting the operation of free and fair markets, harming consumers and workers, and hindering the success of small businesses and innovators. In a new report for Equitable Growth, Michael Kades and six co-authors—Bill Baer, Jonathan B. Baker, Fiona M. Scott Morton, Nancy L. Rose, Carl Shapiro, and Tim Wu—lay out a robust antitrust plan, explaining in detail how Congress and the executive branch can institute a procompetitive agenda. Summarizing the current state of antitrust enforcement and its flaws, the report’s co-authors provide three key areas where the next administration can make fundamental changes to the status quo that will have an important effect on market power in the United States: passing new antitrust legislation and allocating more resources to antitrust enforcement at the Federal Trade Commission and the U.S. Department of Justice’s Antitrust Division; revitalizing enforcement and focusing on strengthening deterrence; and committing to a “whole government” approach to competition policy, which acknowledges that several executive branch agencies—not only the antitrust enforcement agencies—impact competition in the United States. Enacting these policy recommendations will not only address rampant market concentration, but will also work to alleviate the harmful effects of inequality and structural racism in the United States.
One specific area of the U.S. economy that would benefit greatly from added competition is the pharmaceutical industry. Aaron S. Kesselheim uses the example of remdesivir—the antiviral drug that the U.S. Food and Drug Administration recently approved as a hospital treatment for COVID-19, the disease caused by the new coronavirus—to show how current policy surrounding the ownership and costs of prescription drugs leads to market concentration, reduces innovation in drug development, and raises prices for consumers. Kesselheim summarizes the brief history of remdesivir’s development, as well as the intellectual property laws that govern the development of pharmaceuticals in general. He suggests several policies, which he divides into the stages of drug development, approval, and production, that would reduce prices for consumers and ensure a robust, competitive pharmaceutical market. The recommendations he makes would not only ensure that remdesivir and other COVID-19 treatments are made widely available and affordable for all those who need them, but also are applicable to a broad range of drugs.
Racism harms the whole U.S. economy, not just those who are its immediate targets. According to new research, writes Lisa D. Cook in The New York Times, while discrimination unquestionably hurts its intended victims the most, it also has an impact on everyone else—even those who do not see themselves as traditional victims. Across the economy, discrimination reduces the wealth and income of millions of workers, who are paid less and have less access to educational opportunities than their peers and who frequently are given jobs beneath their skill levels. This brings down the wages and wealth of others who are not the target of discriminatory policies, and reduces aggregate economic output. Cook summarizes her own research on the drag effect that hate-related violence has on long-term U.S. economic growth and innovation, as well as other research, explaining the outcomes that could have been if racism and discrimination were not as widespread as they are. She then offers some possible solutions that would address rampant discrimination and racism, and improve the standard of living of those who suffer the most from these societal ills, which would work to improve the lives and livelihoods of all U.S. workers and their families.
Unemployment Insurance claims rose last week for the first time in more than a month, reports Anneken Tappe for CNN, reinforcing that the coronavirus pandemic and recession are far from over. Around 742,000 Americans filed for first-time unemployment benefits on a seasonally adjusted basis, more than three times more compared to the same time period last year, and approximately 320,000 workers applied for Pandemic Unemployment Assistance, a temporary program designed to support those who are not eligible for traditional UI benefits during the coronavirus recession. Workers are exhausting their states’ UI benefits, and when the temporary benefits expire at the end of this year, Tappe writes, experts worry that economic suffering could get a lot worse in the coming weeks and months—especially considering the dangerous increase in coronavirus infections.
One way to curb rising coronavirus case numbers may be closing some of the businesses that contribute to outbreaks, such as bars, restaurants, and gyms—rather than doing what New York City recently did and closing schools. But one reason we haven’t seen this course of action in the United States, as opposed to other similar countries in Europe that are trying to curb new waves of infection, is the lack of help from the federal government, writes Anna North on Vox. What is behind these decisions guiding the government’s coronavirus response? Money, North answers. No stimulus package seems likely to pass through Congress in the near future, which leaves many business owners wary of closing down again, as many did in the spring when the Coronavirus Aid, Relief, and Economic Security, or CARES, Act provided some aid to those in need. Policymakers are wary of the economic effect that shutting down these sectors without financial supports in place would have on the economy—and are very aware that shutting down schools doesn’t have the same immediate economic impact. But forcing working parents to juggle care responsibilities and their jobs will hamper the future economic recovery, North explains, and the government’s prioritization of businesses over schools is causing needless pain across the economy.
Remdesivir may be one possible drug to combat COVID-19.
Overview
The extraordinary ongoing effort to find treatments to cure, ameliorate symptoms of, and vaccinate against the novel coronavirus and COVID-19, the disease caused by the virus, is a reminder of how much the U.S. healthcare system, the U.S. economy, and we as individuals and families rely on these products, as well as the public research that goes into discovering them and the pharmaceutical companies that develop and manufacture them. This issue brief discusses the ownership and costs of prescription drugs, as well as potential policy initiatives in this area, through the lens of one prescription medication, the antiviral drug remdesivir.
Remdesivir is important because it became the first signal of hope amid the coronavirus pandemic, when research published in April 2020 suggested that it reduced the duration of symptoms for patients with severe COVID-19 infections by about 4 days on average, although it did not have a significant effect on mortality. Those results led the U.S. Food and Drug Administration to permit its use under an emergency use authorization, and for months, it was the only drug available with at least some proven real clinical benefits for COVID-19. On October 22, the agency formally approved remdesivir for the treatment of COVID-19 requiring hospitalization.
Approval by the Food and Drug Administration, however, means that a drug has some benefit but it does not guarantee any particular level of benefit. Indeed, in a recent study, we found that only about one-third of new drugs approved by the agency over the past decade were rated as having high therapeutic value. For remdesivir, recent data have shaken the foundations of its therapeutic potential. According to a pre-print of a major World Health Organization solidarity study from October 2020, remdesivir does not appear to affect patients’ mortality or their hospitalization duration, and it is not clear whether its effects on symptoms are additive to dexamethasone, another drug shown to work for severe COVID-19. Remdesivir still seems to display some anti-COVID-19 activity and may have a role in physicians’ therapeutic armamentarium, but what that role will be will continue to evolve as further data emerge.
Gilead Sciences Inc. owns all the relevant patents for remdesivir. After the drug was authorized for use against COVID-19, the company announced plans to donate 1.5 million doses. But that commitment will not meet demand, and the company announced in June a list price of more than $3,000 for a full treatment regimen. At that price, Gilead is reportedly on track to make more than $9 billion in revenue on remdesivir in 2020 and 2021 alone. With FDA approval in hand, the company will be able to set whatever price it wants for the drug for likely more than a decade.
Remdesivir, then, offers a good reminder of the need for policies that can achieve continuing prescription drug innovation, while also maintaining a fair price for U.S. patients and the health care system more broadly. This issue brief will provide a short history of the development of remdesivir, summarize the intellectual property laws governing prescription drugs in general and remdesivir in particular, and present policy options to affect the pricing of remdesivir and drugs like it going forward.
Briefly, the policy recommendations detailed below are divided among four basic stages of drug development, approval, and production:
Stage 1: the discovery process, leading up to approval by the U.S. Food and Drug Administration
Stage 2: the 12- to 14-year period of market exclusivity for brand-name drugs
Stage 3: the transition to a competitive market with the introduction of generic versions of the medication
Stage 4: the period when multiple generic versions of the drug can be on the market
Remdesivir has just completed stage 1. Other potential treatments for COVID-19, such as monoclonal antibodies, are at even earlier stages. While these policy recommendations represent an ambitious agenda with significant implications for a broad range of drugs, the crisis brought on by the coronavirus pandemic makes clear that such an agenda not only is necessary but can and should be considered in the near future.
In short, now is the best time to put many of these provisions in place, before remdesivir and other treatments and vaccines make further progress along the approval path.
Let’s turn first to the history of the development of remdesivir to demonstrate the clear role of public financing in the discovery and development of the drug, and its public policy implications.
The discovery and development of remdesivir
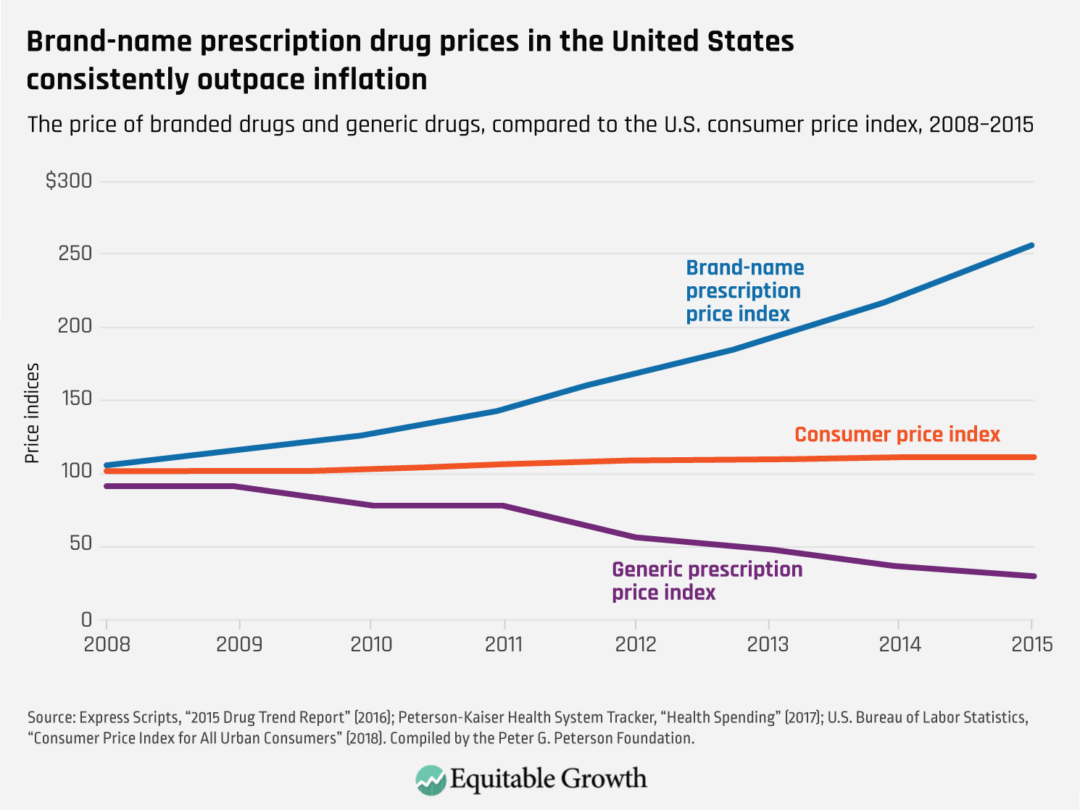
Prescription drugs can be very costly, which affects not only U.S. healthcare and the economy broadly but also individual health outcomes. High prices can keep important medications out of the hands of patients who need them to get well, or even to live. The price of brand-name prescription drugs has risen markedly faster than overall inflation over the past two decades. (See Figure 1.)
Figure 1
The federal government and not-for-profit organizations, especially U.S. universities—funded in good part by federal agencies—support or conduct most of the basic and translational research that lays the foundation for the medications we use. The role of public funding is more pronounced among the most transformative new drugs. The prescription drug industry also invests a great deal in bringing brand-name products to market—usually at the clinical testing, regulatory approval, and manufacturing phases of development—but the prices they charge are not related to the costs they incur in developing medications.
Yet U.S. patent laws give what is essentially monopoly pricing power to companies that hold the intellectual property related to valuable drugs, even if that intellectual property is derived from insights originating in the basic and translational research completed by publicly funded institutions and their scientists. And these firms sometimes use that power to charge prices far beyond the value that the drug provides. Given the federal government’s critical role, and the vital public interest in supporting public health, there are a number of concrete steps U.S. policymakers could take to better manage prescription drug costs at every stage of the approval process for these medications—without stifling innovation.
Remdesivir is a potent case in point.
The road that led to remdesivir’s development so that it could be effective against COVID-19 was paved by public funding and university research. Its initial development was the culmination of several years of collaboration between Gilead Sciences, the U.S. Army Medical Research Institute of Infectious Diseases, and the U.S. Centers for Disease Control and Prevention. The company and the two federal agencies were already collaborating in search of possible antiviral candidates in Gilead’s library of nucleoside analogues when the Ebola virus broke out in West Africa in 2014. The initiative identified the precursor to remdesivir, which company researchers and the government, led by the Army’s infectious diseases institute, further developed.
Researchers at Gilead Sciences and universities then turned to studying remdesivir as a potential treatment for various viruses, including coronaviruses, supported in part by another U.S. Department of Defense research agency. This joint public-private research involved groups such as the National Institutes of Health, that included the University of Alabama, the University of North Carolina, Chapel Hill, and Vanderbilt University. This research led to the discovery that remdesivir could be useful against Middle East Respiratory Syndrome, or MERS, and severe acute respiratory syndrome, or SARS.
Eventually, research conducted during the Ebola outbreak, sponsored by the government of the Democratic Republic of Congo and the African Coalition for Epidemic Research, Response, and Training, determined that remdesivir was not sufficiently effective against Ebola. But remdesivir was one of the earlier products tested against COVID-19, based on its usefulness against other coronaviruses causing MERS and SARS. Clinical trials were launched around the world beginning in early 2020 to evaluate the safety and efficacy of remdesivir in hospitalized patients with severe cases of the disease.
After several promising but insufficient trials, the National Institute of Allergies and Infectious Diseases, or NIAID, initiated the first double-blind randomized U.S. trial of remdesivir in February 2020. The trials showed that the drug could reduce recovery time by 4 days but did not lead to a significant reduction in deaths. It was not a gamechanger, but it was effective—and was the first drug identified to have a palliative effect on COVID-19.
Intellectual property and remdesivir
The results of remdesivir’s NIAID trial, along with other supporting data, led to its emergency use authorization and Gilead Sciences’ announcement in May that it would provide a set number of free doses of remdesivir, and then to its subsequent price announcement. Gilead set a price, however, that raised important concerns about the cost and availability of what was then the primary useful drug against COVID-19. Indeed, a number of state attorneys general urged federal action to address these issues, and state treasurers are calling on Gilead Sciences to lower the drug’s price. These calls have become more compelling with the recent data from the large multinational trial suggesting that the drug does not have benefits in terms of mortality or hospitalization.
Now that the drug is FDA-approved, Gilead remains in control of manufacturing, pricing, and distribution until its patents and other statutory exclusivities expire, and generic versions are approved by the Food and Drug Administration. There are several laws that provide exclusivity to manufacturers, but two that apply specifically to new medicines are especially relevant when discussing remdesivir. The Drug Price Competition and Patent Term Restoration Act of 1984—the Hatch-Waxman Act—gives drug companies a minimum of 5 years to 7 years of exclusivity for new drugs. Yet most drug manufacturers have patents lasting much longer than that. In fact, Gilead currently owns at least 12 patents on remdesivir. The last of them does not expire until 2039. But such patents can sometimes be challenged or, if necessary, designed around to enable generic drugs to enter the market long before patents expire. The Hatch-Waxman Act created a pathway for such challenges to occur, and it created a mechanism for generic manufacturers to seek FDA approval when the patents expire.
Another law offering exclusivity at the time of drug approval is the Orphan Drug Act, enacted in 1983, which provides 7 years of exclusivity and a valuable tax credit for drugs used in treating rare diseases (those affecting fewer than 200,000 people). The purpose of this law was to encourage pharmaceutical companies to develop drugs for rare diseases that might not be profitable, given the limited market for them. Early in the COVID-19 pandemic, when the number of infections was below 200,000, Gilead Sciences requested Orphan Drug Act designation for remdesivir for the treatment of COVID-19. The Food and Drug Administration approved this status in March, despite the rising numbers of cases—until public scrutiny led the company to withdraw this designation voluntarily.
Public financial support for development of remdesivir
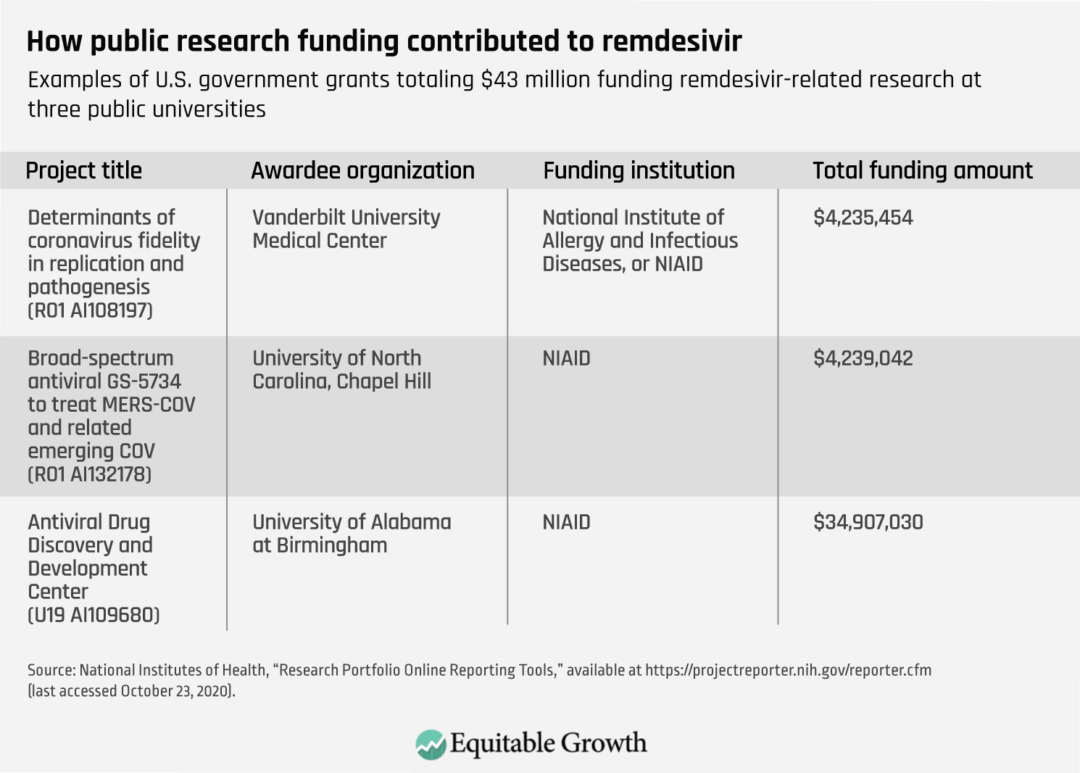
As noted above, remdesivir, like most drugs, stands on the shoulders of federally funded research. In some respects, that is truer for this drug than for many others, given the specific partnerships formed between federal agencies and Gilead Sciences, culminating with the recognition that the drug might be useful for COVID-19. (See Table 1.)
Table 1
U.S. government research laboratories and university research funded by the federal government—mainly the National Institutes of Health—are the origin of many fundamental discoveries on which new drugs are based. Drug companies then spend a considerable amount developing and bringing a product to market. This is generally accomplished by the pharmaceutical company that comes to own the intellectual property for a given compound. Yet companies charge high prices to the very taxpayers who funded the research that made their product possible, and do not direct proceeds to the federal government to help fund new research. In the case of remdesivir amid the coronavirus recession, these considerations are now front and center for policymakers.
Policy options
There are numerous legislative and regulatory actions that policymakers could take to address drug prices that have risen far beyond inflation in the past three decades. All of them taken together would significantly lower spending on prescription drugs while ensuring continued funding for true innovation. Applying such measures to the case of remdesivir can be further justified by the federal funding that provides all or part of the foundation for the advances subsequently funded by Gilead. (For a more thorough description of these ideas, which address problems in four key periods of the development of pharmaceuticals, see my essay in Equitable Growth’s Vision 2020: Evidence for a stronger economy.)
Drug discovery period
When it supports research that could lead to the discovery or understanding of prescription drugs, the National Institutes of Health could require a reasonable pricing provision to be attached to the provision of funding. This provision could, for example, require that the ultimate price of the product be no greater than its value-based price—a price reflecting the drug’s potential ability to improve patient outcomes over comparable interventions—as determined by independent organizations.
In the case of remdesivir, the Institute for Clinical and Economic Review used cost-effectiveness analysis to judge that a fair price for remdesivir initially would be $4,460, assuming it had an effect on mortality, which was not statistically significant in the initial trial. Without an effect on mortality, as was confirmed by the more recent multinational trial, the institute estimated that a cost-effective price of remdesivir would be just $310 for a course of therapy.
Another option—not relevant in the case of remdesivir—would be for the National Institutes of Health to change its interpretation of the “march-in” provision of the Bayh-Dole Act of 1980, which established the basic rules for commercialization of technology arising from government funding. Under Bayh-Dole, the NIH retains a license on patents resulting from federally funded research and can “march in” to invalidate an exclusive commercialization license if the product is not made available on “reasonable terms.” The institute has never applied this provision to pricing matters, but this can be a tool for curbing high prices in a limited number of cases. This provision would not be relevant in the case of remdesivir because the government does not have a direct stake in the patents held by Gilead.
Brand-name-only period
Until the availability of generic substitutes for remdesivir, there will be no direct competition to bring down prices. Introduction of other brand-name products indicated for the same purpose have generally not been shown to lower prices to a substantial extent. Until generic competition, then, the best way to achieve fair prices for brand-name drugs is to empower the buyers to negotiate better terms with the manufacturers. There is no larger U.S. buyer than the 44 million Americans covered by Medicare.
Medicare, however, is barred from negotiating drug prices—unlike the U.S. Department of Veterans Affairs—a prohibition that does not apply to any other health care service it covers. So, the best solution for managing drug prices during this period is to provide the entire federal government, including Medicare, the authority to negotiate reasonable prescription drug prices that better reflect the value of treatments, as well as the government’s budget and the drugs’ origins.
To accomplish this, the United States could follow the model established by numerous other countries. U.S. policymakers could create a health technology assessment organization that would evaluate a newly approved drug’s clinical value and help determine a fair price based on how well it is expected to perform against other available treatments as well as other relevant factors. That assessment would provide the basis for negotiations with the manufacturer. Future prices could rise and decline based on inflation, how well the drug continues to perform in real-world use, and the introduction of related products. It would make sense to create such an organization within the U.S. Department of Health and Human Services.
Another way of addressing prices during this period is to provide better information to prescribing physicians and patients. Currently, the vast majority of information that both doctors and their patients receive is a result of the billions of dollars that companies spend promoting their products. What is needed is more objective, noncommercial information about drug benefits, risks, and cost effectiveness. Policymakers should support independent programs that generate unbiased information about evidence-based management of disease and disseminate this educational information to physicians. This can translate into more cost-effective prescribing.
Transition to a competitive market period
Because the only type of competition that consistently and substantially lowers drug prices comes from the introduction of interchangeable, FDA-approved generic drugs, brand-name manufacturers often employ strategies to extend market exclusivity periods. Companies exploit ambiguities in the Patent Act to obtain dozens of “secondary” or “tertiary” patents on peripheral aspects of their approved brand-name drugs. The subjects of these follow-on patents can include anything from the medicine’s coating or a change in its delivery from a pill to a capsule, to using a new device such as an injectable pen. Incremental changes are commonly covered by these patents, but they often do not provide advancements in drug efficacy, safety, or convenience that are commensurate to the higher prices being charged.
In addition, manufacturers have usedvarious other strategies to prevent the timely entry of generic drugs. These have included filing citizen petitions with the Food and Drug Administration raising frivolous concerns about the interchangeability of a potential generic, restricting supplies of their product for generic manufacturers to use in the bioequivalence studies needed to prove that a generic matches the original drug, and entering into settlements with generic manufacturers to drop patent challenges and delay their plans to market a competing generic product.
Policies to make those strategies more difficult or impossible to carry out can speed the introduction of competition and thus price reductions. A number of bills have been considered in Congress that address generic-delaying strategies in a piecemeal way. And in 2019, Congress passed and President Donald Trump signed into law bipartisan legislation intended to stop the practice by brand-name drugmakers of keeping supplies of medications out of the hands of generic manufacturers to prevent them from creating competing products.
Other measures Congress could take include requiring greater disclosure of a product’s patents (particularly for biologic drugs), preventing abuses of the Food and Drug Administration’s petition process, addressing remaining problematic settlement agreements with generic manufacturers, and giving the Food and Drug Administration greater authority to approve as interchangeable generics that are slightly different from the original drug if the differences are not clinically relevant. More frequent use of the Patent Trial and Appeals Board’s administrative patent review process—such as automatic review at the time any drug patent is FDA-listed—also could help weed out insufficiently innovative patents.
Another policy solution that Congress could enact is to restrict a brand-name drug’s market exclusivity period to a particular time period and not permit secondary or tertiary patents—or any of the other strategies—from being able to block FDA approval of a generic version. Manufacturers could be restricted to the single patent for which they seek and receive patent term restoration (a period of up to 5 years to account for time spent in clinical trials and FDA review), plus the 6-month patent extension manufacturers receive for testing their drugs on children. At the end of this period, generics would be permitted to enter, no matter what other patents have been obtained.
Multisource generic drug period
After a drug has lost exclusivity protection, prices may not fall if there are not enough generic manufacturers in the market, and other market conditions might also work against price declines. The Food and Drug Administration has deployed user fees, which began in 2012, to make substantial reductions in previous delays in the approval process for generic drugs. More resources must be invested at the agency to ensure that there are no unnecessary delays in generic drug approval, as well as in providing guidance on the types of studies generic manufacturers need to complete to receive FDA approval.
There are also some instances of older pharmaceuticals that no longer have exclusivity but for which not enough generic manufacturers have entered the market to reduce price substantially. In these cases, importation is a possible solution. This would involve setting up a regulatory system that would allow mutual recognition between the Food and Drug Administration and similar regulatory systems in Europe and in Canada, Australia, and Japan.
Another solution would be to authorize government manufacturing of generic drugs. Some private organizations and other nonprofit drug manufacturers have emerged in recent years, and a government-run manufacturing plant could ensure a continued supply of off-patent products that for-profit generic manufacturers have lost interest in producing. This idea has been proposed at both the national and state levels.
Conclusion
The pricing of remdesivir is emblematic of problems with the current process of developing and marketing prescription drugs in the United States. The policies described in this issue brief won’t discourage innovation, and they won’t reduce the availability of lifesaving and life-extending drugs—quite the opposite. They will turn the attention of successful companies away from efforts to create incrementally innovative products or to extend patent protection for their existing money-making products and toward the development of new ones. And they will relieve the financial burden that high prices place on consumers, businesses, and governments.
1. Four pieces from Equitable Growth’s “Vision 2020” initiative are especially worth your attention this week—not because they are the most important but because they are the most doable in the current environment.
The first is “Combating the market power of U.S. corporations over workers and consumers.” The post reads in part: “The United States suffers from a growing market power problem. Market power, often referred to as monopoly power, means consumers pay more for the goods and services they need. Workers earn less. Small businesses have a harder time succeeding. Innovation slows. Market power exacerbates wealth inequality, too, because those who benefit from monopolies—the high-paid executives and stockholders of corporations—are wealthier, on average, than the consumers, workers, and small businesses who bear monopolies’ costs … Antitrust enforcement is typically handled at the federal level by the Federal Trade Commission, the U.S. Department of Justice’s Antitrust Division, and federal courts. It is governed primarily by Congress’ century-old policy direction in the Sherman Act, the Federal Trade Commission Act, and the Clayton Act. The key resources below provide solutions for corralling corporate power through these antitrust enforcement tools.”
The second is “Reforming Unemployment Insurance across the United States.” The post reads in part: “Longstanding problems with the Unemployment Insurance system in the United States are immediately evident amid the coronavirus recession and echo the problems experienced during the Great Recession more than a decade ago. These include: (a) Administrative failures at state Unemployment Insurance agencies. (b) Lack of a permanent Unemployment Insurance program that includes the self-employed and others traditionally left out of the program. (c) Low benefit levels that require emergency top-offs. (d) The temporary nature of fixes when recessions hit, which, in turn, requires renegotiations just months after political compromises are reached. The current disarray in the Unemployment Insurance system is neither a surprise nor an accident. It is the result of decades of conscious choices made by policymakers at the state and federal levels: Over the past decade, many states limited Unemployment Insurance benefits, made accessing the program more difficult, and allocated insufficient funds for program administration. This results in chaos and uncertainty just when Unemployment Insurance is critical.”
The third is “Revamping U.S. Small business rescue programs amid the coronavirus recession.” The post reads in part: “Heading into 2021, policymakers should prioritize restructuring business aid so that small firms can be rescued with the same speed as large firms. The Paycheck Protection Program should be altered to help firms in high-rent areas, firms that are smaller and less well-connected to the banking system, and firms owned by Black and Latinx entrepreneurs. Longer term, policymakers should build public financial systems to make our economy resilient for the next downturn, including: (a) Increasing the capacity of the Small Business Administration. (b) Building a faster payment system. (c) Ensuring universal access to the banking system. (d) Creating established alternatives to ad hoc business rescue programs via the Federal Reserve.”
The fourth is “Building worker power in the United States.” The post reads in part: “Labor market policies, such as minimum wages or premium pay amid the coronavirus pandemic, are not keeping up. Meanwhile, labor laws meant to protect collective action and unionization efforts, guarantee freedom from discrimination, and promote workplace safety are not well-enforced. Furthermore, trends such as domestic and international outsourcing and the fissuring of the workplace are changing the U.S. economy in ways our labor market institutions were not built to handle. These trends unbalance power between workers and corporations so that workers are not able to share in the high profits they create and the economic growth they drive.”
Worthy reads not from Equitable Growth:
1. I think Tim Duy here overlooks the next year. Lots more damage will be done to the U.S. economy and the society over the next two months of the interregnum. Then there remains at least a six-month gap before large-scale vaccine distribution is likely to begin. The Biden economy is likely to have a great 2022, and a good 2023 and 2024. But the next year will be hellish. Duy is, I think, very overoptimistic in overlooking that. Read his “Economy Has Momentum, But So Does the Virus,” in which he writes: “[President-elect] Biden might have been dealt something of a lucky hand with respect to the economy. As a general rule, it is much better to have the recession at the front end of your administration than the back end. Even though he will likely face a recalcitrant Senate, do not mistake the current situation for the last recovery. A vast stockpile of savings is sitting in the background to fuel the economy next year, giving Biden a massive economic tailwind. Moreover, there was nothing wrong with the economy at the beginning of the year; there were no structural problems that needed to be fixed. Biden also has the opportunity to ride the downside of the current Covid-19 surge and the upside of the coming vaccine. And he has a Fed that has already committed to holding rates zero; President Obama had a Fed that was always looking to unwind. Looking past the current Covid-surge, there is a lot to like here.”
2. Freedom of speech, freedom of association, freedom of non-association, rights to equal respect in the public sphere, and rights to economic advantage and security all mix together in a strange public-sphere debate chopped salad. I confess I have not thought all these issues through satisfactorily. Read Steve Randy Waldmann, “Social democracy and freedom,” in which he writes: “In 1962, Milton Friedman famously argued that liberal capitalism and political freedom go together [:] … “Viewed as a means to the end of political freedom, economic arrangements are important because of their effect on the concentration or dispersion of power. The kind of economic organization that provides economic freedom directly, namely, competitive capitalism, also promotes political freedom because it separates economic power from political power and in this way enables the one to offset the other…” Capitalism and Freedom was written in the heyday of the Kuznets curve, which posited that extreme inequality was self-correcting and had largely already self-corrected … Friedman celebrated moderate inequality, on the theory that a world with many captains of industry would have many and diverse philanthropists to whom partisans of unpopular causes could make their case and find sponsorship. The logic of the argument rests on the notion that capitalism preserves political diversity that cuts across the structure of wealth and power … There is an obvious critique of this from the left. Political diversity won’t cut across structures of wealth and power evenly … There’s lots more scope to make a living at Mercatus than at People’s Policy Project, for partisans willing to adjust their politics accordingly. Capitalism, then, buys the appearance of political diversity (every voice is in the room!), but puts a fat thumb on the scale for the interests of the wealthy and powerful.”