Republicans in the U.S. Senate recently passed a version of the One Big Beautiful Bill Act, championed by President Donald Trump. The House of Representatives passed an earlier version of this bill in May and are expected to vote on the Senate’s modified version over the next several days.
As we have argued in a companion report, this enormous bill would, if enacted, be the most regressive U.S. tax and budget law in at least the past four decades—and possibly ever.
The core of the Republican bill is more than $4 trillion in tax cuts that overwhelmingly benefit the affluent. These tax cuts are financed in part by draconian spending cuts focused on middle- and lower-income Americans, including several hundred billion dollars in cuts to the Supplemental Nutrition Assistance Program, or SNAP, income-driven repayment loans and Pell grants for lower-income college students, and approximately $1 trillion in cuts to publicly funded health insurance—Medicaid, affordable coverage in the Affordable Care Act marketplaces, and Medicare for dually eligible beneficiaries who receive assistance through Medicaid.
Polls indicate that the One Big Beautiful Bill Act is highly unpopular. Indeed, the only law passed since 1990 that was as unpopular as the current bill before it passed is the 2017 tax cuts that Republicans are now seeking to extend and expand. At the same time, most Americans admit they know relatively little about the bill, with two-thirds responding to a Washington Post poll on June 9 that they had heard “a little” (40 percent) or “nothing at all” (26 percent) about it.
How are Americans’ views of the bill affected by information about its regressive effects? Current polling cannot reliably tell us for two reasons. First, no poll has presented Americans with precise estimates of the bill’s distributional effects. Second, existing polls are not designed to assess the causal effect of information. To make causal claims about how the bill’s regressivity affects public support, respondents must be randomized into groups that receive varying amounts of information about the bill’s effects.
This is the approach we took as part of a larger survey experiment we conducted with 4,500 Americans, asking about their attitudes toward the One Big Beautiful Bill Act roughly 2 weeks after it passed the House. We asked our control group about the bill without any distributional details, whereas two treatment groups received specific estimates of the distributional effects of the House-passed version of the bill, based on microsimulation modeling by the Yale Budget Lab.1 Both treatment groups learned about the regressivity of the bill, but the first was shown the regressive effects of the tax cuts alone, while the second saw the more regressive effects of the bill’s combined tax and spending cuts.
In line with other recent surveys, we found that baseline opposition among those who were asked directly for their opinion of the bill was high, with a ratio of 2-to-1 opposing its passage. Opposition was much higher, however, in the first treatment group (which only heard about the regressive tax cuts) and higher still in the second (which heard about the combined tax and spending cuts). When shown the combined effects, the ratio of opposition-to-support increased to more than 7-to-1, with only 11 percent of respondents in this latter group supporting the bill. Among Republicans, the difference across groups was even larger: Support and opposition flipped between the control group and the second treatment group, from nearly 3-to-1 support to nearly 3-to-1 opposition.
Our results confirm that the One Big Beautiful Bill Act is broadly unpopular. They also show, however, that Americans have not yet learned about the bill’s regressive distributional effects—and those who are informed about these effects overwhelmingly oppose the bill.
The distributional effects of the One Big Beautiful Bill Act
What makes the current bill distinctive is that it would both cut taxes in ways that mostly benefit the affluent and impose large spending cuts that disproportionally hurt less affluent Americans. Because of these combined tax and spending cuts, the One Big Beautiful Bill Act dwarfs the overall regressivity of the 2017 Trump tax cuts and is more regressive than even the famously upwardly skewed Bush tax cuts of 2001, as we show in our report.
According to the Yale Budget Lab, the tax cuts in the House-passed Republican bill would increase disposable incomes among households in the top 1 percent of the income distribution by nearly 4 percent, on average. By contrast, the tax cuts would boost disposable incomes by just 0.5 percent, on average, among households in the lowest income quintile (hereafter the bottom 20 percent). When the spending cuts are factored in, however, the bottom 20 percent would experience an average income loss of nearly 4 percent, on average, while the top 1 percent would be unaffected. (See Table 1.)
Table 1
How we designed our experimental survey
Our survey was structured as follows. We started with a few questions regarding respondent demographics, including education, political affiliation, and household income. Then, we noted that the House had recently passed a budget bill that would make changes to taxes and government spending over the course of the upcoming decade. Given all the recent developments regarding tariffs and trade deals, we clarified that in the questions that followed, we were not referring to those types of policies.
Before we asked respondents about their opinions of the bill, we randomly assigned a subset of our respondents to one of three groups, which received varying degrees of information regarding the bill. First, our control group was given only minimal context—that the budget bill had recently passed in the House. They then were asked to answer several questions regarding their attitudes toward the bill.
The other two groups received information about the bill’s distributional components. The first treatment group was shown the average percentage change in disposable income that the bill’s tax cuts would produce among households in the bottom 20 percent, compared with the effects on households in the top 1 percent. The second treatment group was shown how the combined effect of the tax and spending cuts would affect the bottom 20 percent and top 1 percent.
In both cases, we presented our results visually, in ways that previous research has suggested respondents can better understand.2 (The large treatment effects—as well as open-ended responses that we collected—suggest that those who took the survey grasped the basic implications of the figures we displayed.) We showed the percentage change in income, rather than dollar changes in income, because we feared dollar amounts would give a misleading impression. Moreover, assessing percentage changes in disposable income at different points in the income distribution is widely considered the gold standard for distributional analysis.
Following these informational interventions, we asked respondents to indicate their support or opposition toward the bill. We also asked them to indicate how their U.S. senator voting “yes” on the bill would affect the likelihood of their voting to reelect them. As a second measure of political commitment, we asked respondents if they would be interested in receiving additional information on a petition either in favor of passing the bill or urging senators to oppose it.
Finally, we asked respondents whether they had previously heard about certain provisions included in the bill. We turn first to these knowledge questions, then discuss the effects of the information we provided.
Americans have received limited information about the most regressive tax provisions of the bill
Those who responded to our survey had heard very little about the big-ticket regressive tax cuts in the bill, which account for most of its cost. For example, just 22 percent had heard anything about the expanded and permanent deduction for pass-through business income in the bill. By contrast, Americans were much more likely to have heard about Trump-supported tax provisions, such as no tax on tips or on overtime—provisions that Vice President JD Vance recently pointed to as proof of the party’s populist priorities. (See Figure 1.)
Figure 1
Yet these putatively populist tax provisions are a rounding error compared to the big-ticket tax cuts benefitting the rich, and they do little or nothing to reduce the bill’s regressive effects.
Media coverage of the bill provides further suggestive evidence of successful framing by Republicans. We looked at news headlines from the beginning of 2025 until the day the One Big Beautiful Bill Act was passed by the House of Representatives, counting the number of articles featuring the phrases listed in Figure 2, as well as some mention of “Trump,” “Congress,” or “Republicans” in the body of the article. As Figure 2 shows, the “no tax on tips” provision garnered a great deal of media attention, and even “no tax on overtime” headlines exceeded references to some of the more regressive provisions.
Figure 2
While the regressive tax cuts in the bill have not been well-covered by the media or well-understood by the public, our survey suggests that Americans were more aware of the spending cuts in the bill. Around two-thirds of our respondents had heard about proposed cuts to nutrition assistance and Medicaid, as seen in Figure 1.
Nonetheless, as we show in the next section, they still overwhelmingly opposed the bill upon learning more about the adverse distributional effects of these cuts.
Information about the distributional effects of the bill greatly increased opposition to it
Despite many respondents having little familiarity with the more regressive tax provisions in the bill, baseline opposition already outpaced support in our control group by nearly 20 percentage points.3 Nearly 50 percent of respondents opposed the bill, while only 28 percent supported it. For the group getting information on the effects of the regressive tax provisions—that is, seeing that the bill would cause incomes for the top 1 percent to increase by nearly 4 percent, on average, while only increasing by 0.5 percent for the poor—opposition increased by 18 percentage points relative to our control group, from 47 percent to 65 percent.
We saw even larger effects among those in our second treatment group, who received information on the combined effects of the tax cuts and spending cuts. In this group, opposition increased by more than 30 percentage points relative to our control group, from 47 percent to 78 percent. Additionally, relative to the control group, support in this group dropped by more than half, from 28 percent to just 11 percent. As a result, the proportion of respondents opposing the bill was seven times higher than those supporting it. (See Figure 3.)
Figure 3
Information about the bill increased opposition most among self-identified Republicans
Given the tendency for partisans to resist negative information about their own political party, we were particularly interested in how the effect of providing distributional information varied by political affiliation—that is, among Democrats, Independents, and Republicans.
Baseline support for the One Big Beautiful Bill Act among Democrats and Independents was already low. For Democrats in the control group, just higher than 10 percent supported the bill, with nearly three-fourths opposed. Among self-identified Independents, opposition exceeded support by nearly 30 percentage points.
In both cases, however, opposition was higher in the two treatment groups. Among Democrats, opposition was 17 percentage points higher among those who received information about the combined effects of the tax and spending cuts, while support dropped by half, compared with the control group. Among Independents, opposition was 32 percentage points higher among those who received information about the combined effects, while support dropped by more than half.
Most striking, however, are the results for Republican support. In the control group, 54 percent of Republicans supported the bill and only 20 percent opposed it—a ratio of 2.7-to-1. Yet among Republicans in the first treatment group shown the skewed tax provisions, support and opposition became nearly identical. And among those in the second treatment group shown the more regressive combined effects, opposition tripled relative to the control group, increasing by 41 percentage points, while support dropped by more than half. As a result, the ratio of opposition-to-support increased to 2.65-to-1—nearly the exact opposite of the baseline ratio. (See Figure 4.)
Figure 4
In short, simply showing Republicans how the bill would affect the incomes of the bottom and top income quintiles caused support and opposition to flip. These are striking effects for a bill backed by President Trump and supported by nearly all Republican members of Congress in the House and, more recently, the Senate.
Congressional representative support for the bill might affect future political behavior
We also examined how distributional information about the House-passed One Big Beautiful Bill Act affected two additional outcomes: whether respondents would be more or less likely to reelect their senator in the future if he or she came out in support of the bill, and whether respondents would be interested learning more about a petition by a group urging senators to oppose or pass the bill.
Compared to the control group, respondents in both groups who received information on the regressivity of the bill indicated they would be less likely to vote for their senator if they were to vote “yes” on the bill. (See Figure 5.)
Figure 5
Respondents who heard about the bill’s regressive elements were also far more interested in obtaining additional information about a petition urging their senators not to pass the bill. (See Figure 6.)
Figure 6
These effects were directionally consistent across Democrats, Independents, and Republicans. As with support for the bill, however, the biggest effects were seen among Republicans. For example, 45 percent of Republicans in the control group said they would be more likely to vote for their senator if he or she supported the bill, but among Republicans shown the combined distributional effects of the bill’s tax and spending cuts, just 27 percent said they would support their senator in future elections, while 51 percent said they would be less likely to reelect their senator if he or she supported the bill. (See Figure 7.)
Figure 7
Americans do not support the ‘Big Beautiful Bill’
The One Big Beautiful Bill Act is the most regressive policy package in living memory. With its distinctive mix of tax cuts that help the rich and spending cuts that hurt middle- and low-income Americans, it shifts more resources up the income ladder than any bill passed since fiscal scorekeepers started keeping track 40 years ago.
The public is already against the One Big Beautiful Bill Act. Yet our survey results show that when its historic regressivity becomes clearer and more concrete, Americans across the political spectrum become overwhelmingly opposed.
This should not be surprising. Only two major bills since 1990 rivaled the unpopularity of the Republicans’ current bill when they were debated. The first, as noted, was the tax cuts of 2017, which the current bill seeks to extend and expand. The second was the failed effort to repeal and replace the Affordable Care Act in 2017, which, similar to the current Republican bill, threatened the largest increase in the share of Americans without health insurance in U.S. history.
Republicans are, in effect, seeking to combine two remarkably unpopular bills into one historically regressive one, combining top-heavy tax cuts such as those pursued in the 2017 Trump tax law with draconian spending cuts similar to those pursued in the repeal and replace bill. Little wonder that Americans oppose the One Big Beautiful Bill Act—or that the more they learn about its regressive distributional effects, the more they reject it.
Acknowledgements
We would like to thank Emilie Openchowski, Elena Waskey, and David Mitchell at Equitable Growth for providing feedback, encouragement, and assistance in assembling this report; Kris-Stella Trump, David Hope, Julian Limberg, and Charlotte Cavaillé for valuable feedback on our survey design; and Eric Scheuch for valuable logistical assistance in getting the survey up and running.
Did you find this content informative and engaging? Get updates and stay in tune with U.S. economic inequality and growth!
The U.S. Congress is in the midst of debating a budget bill that would make massive changes to U.S. tax and spending policy over the course of the next decade and beyond. On May 22, the Republican majority in the House of Representatives passed its One Big Beautiful Bill Act, which spends more than $3.7 trillion over the next 10 years to cut taxes, mostly for the richest Americans.
To finance these tax cuts, the bill cuts federal spending focused on middle- and lower-income Americans. These spending cuts amount to roughly $1.3 trillion over the next decade (net of new spending) and would—among other estimated effects—reduce funding for the Supplemental Nutrition Assistance Program by almost one-third and increase the number of Americans without health insurance by 11 million through changes to Medicaid eligibility and affordable coverage in the ACA marketplaces. The remaining $2.4 trillion of tax cuts would be financed by deficit spending, driving up the federal debt by $3 trillion when increased interest costs on the debt are factored in (and by $5 trillion if temporary provisions are made permanent, as the bill’s designers hope).
In short, the Republican’s budget bill is enormous, largely unpaid for, and overwhelmingly regressive, transferring income from less affluent Americans to the most privileged.4 Indeed, we estimate that, if enacted, it would be the most regressive tax and budget law in at least the past 40 years—and possibly ever (though we lack precise distributional estimates for earlier periods).5 This regressivity reflects big, complex tax cuts for the rich—which have received limited attention, relative to simple but small-bore tax cuts for the middle class—as well as cuts to health and social programs that are designed to hide their true impact by imposing new administrative burdens on beneficiaries and by shifting costs onto states.
In this report, we shine a light on the hidden regressive elements of the House-passed One Big Beautiful Bill Act. We show that they are not only large in historical relief, but also large when compared with such putatively populist features as “no tax on tips.” We also argue that they are likely to be even bigger than current estimates suggest because they are designed to create self-reinforcing political and economic dynamics—what political scientists call “policy feedback effects”—that will make the law’s impact bigger, more favorable to the rich, and more harmful to everyone else.
In the first section, we substantiate our claims about the unprecedented regressivity of the bill, comparing it with the two other leading contenders for this dubious distinction: the Bush tax cuts of 2001 and the Trump tax cuts of 2017. In the second section, we explain why the most complex and little-discussed tax provisions in the bill are so regressive, focusing on the highly inegalitarian changes to the tax treatment of pass-through business income, of huge estates, and of the ever-rising incomes of the richest taxpayers.6
The third section looks at the bill’s draconian and deceptive spending cuts, which are designed to push tough decisions—and, congressional Republicans hope, accountability—down to the states, where millions of Americans will lose health insurance and nutrition assistance, among other valued benefits. In the fourth section, we show that, compared with these large losses, the so-called populist provisions of the bill—notably, the provisions for no tax on tips and overtime—are tiny. These “shiny objects” are not only fiscally trivial, compared with the bill’s big tax cuts for the wealthy, but also time-limited and designed in ways that limit their benefits for less affluent taxpayers.
In the last two sections of the report, we examine the likely dynamic policy feedback effects of the bill in a transformed fiscal and policy context. These effects—which are not incorporated into existing estimates of the bill’s distributional effects—are virtually certain to increase the bill’s regressivity. In the fifth section, we show that if the Trump administration continues to decimate the capacities of the IRS, the costs of the bill’s tax cuts for the rich are likely to balloon, due to increased tax avoidance and evasion concentrated among the affluent. In the sixth section, we show that the cuts for lower- and middle-income Americans are also likely to expand because they are designed so that states facing restricted and risky fiscal circumstances will be under increasing pressure to cut benefits and use administrative burdens to discourage people from receiving these reduced benefits.
Because of these likely feedback effects, even the best distributional estimates of the Republican bill—which, as we show, indicate that it would be the most upwardly redistributive law in at least 40 years if enacted—are biased toward underestimating its skewed distribution.
The One Big Beautiful Bill Act is more regressive than other modern tax and budget bills
Tax and budget laws that shift income from low-income Americans to the affluent are rare. From 1982 until 2001, virtually every major budget bill raised taxes in progressive, or relatively distributionally neutral, ways.7 Of course, regressive tax cuts have been passed under unified Republican control of the executive and legislative branches before. The Economic Growth and Tax Relief Reconciliation Act of 2001—the first of the so-called Bush tax cuts—contained tax changes that were highly skewed toward the wealthy, as did the Tax Cuts and Jobs Act of 2017.
What makes the current Republican bill so distinctive is that it would also impose large spending cuts that disproportionally hurt less affluent Americans. Because of these cuts in Medicaid, Affordable Care Act coverage, food assistance, support for lower-income college students, and other valuable benefits for poor and middle-income Americans, the One Big Beautiful Bill Act dwarfs the overall regressivity of the 2017 Trump tax cuts and is more regressive than even the famously upwardly skewed Bush tax cuts of 2001.
Despite many expert analyses of the House Republican legislation (on which we gratefully draw), its radically inegalitarian character is still not adequately appreciated. This is in part because Republicans have described what they are doing in false terms—saying, for example, that they are not “cutting” Medicaid, when in fact millions will lose coverage.
Yet it also reflects the fact that the bill is designed to hide its biggest, least popular, and most regressive elements, while proponents tout its more popular provisions that have comparatively miniscule impacts. Chief among these is President Donald Trump’s promise of eliminating taxes on tips, which accounts for just 1 percent ($40 billion) of the $3.7 trillion in tax cuts in the bill and would do nothing to boost to the take-home pay of 98 percent of U.S. households.
We calculate that the combined tax and spending cuts in the One Big Beautiful Bill Act, if enacted, would produce a transfer of income from less affluent Americans to the rich that is without precedent in at least the past 40 years. We look at a simple measure of regressivity that compares the average percentage changes in income at different points in the income distribution. In essence, this measure tells us how much larger the percentage change is for affluent households than for lower-income ones. (We discuss these calculations further in the technical appendix, where we also present more information about the effects of the bill across the full income distribution—which only bolsters our case.)
We compare changes in income between the poorest and richest 20 percent of the income distribution stemming from each of the three aforementioned Republican tax bills. Because these tax cuts, especially the Bush tax cuts of 2001, were highly skewed toward the very top, we also compare changes in incomes of the poorest 20 percent to changes for the top 5 percent and top 1 percent.
According to our calculations, the three most upwardly skewed tax and budget laws of the past half-century are—from most to least regressive—the One Big Beautiful Bill Act (2025), Economic Growth and Tax Relief Reconciliation Act (2001), and the Tax Cuts and Jobs Act (2017).8 Figure 1 compares these three laws, showing the percentage change in income by quintile, as well as for the top 5 percent and top 1 percent of households. It also presents our three different measures of regressivity. (See Figure 1.)
Figure 1
If enacted, our calculations show that the current bill would reduce income among the poorest 20 percent of Americans by an average of 3.8 percent while increasing it by 3.7 percent for the richest 20 percent—a difference of 7.5 percentage points. By comparison, the 2017 tax bill increased income among the poorest 20 percent by an average of 0.4 percent and increased it among the richest 20 percent by an average of 2.9 percent—a difference of 2.5 percentage points.
For its part, the first Bush tax cuts increased income among the poorest 20 percent by an average of 0.5 percent and increased it among the richest 20 percent by an average of 3.2 percent—a difference of 2.7 percentage points. When the comparisons focus on the highest-income households, however, the Bush tax cuts appear more regressive. Looking at the top 1 percent, for example, reveals an absolute difference from the bottom 20 percent of 7.2 percentage points—an extremely sharp skew, but still slightly short of the 7.8 percentage point difference projected for the current bill, according to this measure.
As Figure 1 makes plain, the One Big Beautiful Bill Act is much more regressive than the 2017 Trump tax cuts and either substantially or modestly (depending on the comparison group) more regressive than the Bush tax cuts of 2001. But what exactly makes the bill so regressive? In the next two sections, we bring to light some of the key reasons, focusing on its tax cuts and spending reductions, respectively.
Regressivity driver #1: Tax cuts that benefit the rich
Some of the key regressive elements on the tax side of the One Big Beautifull Bill Act are complex or little-known, certainly to the public. This, however, does not make them unimportant. Indeed, the three key provisions we discuss below—an expanded deduction on pass-through business income, cuts to marginal tax rates, and a large increase in the federal estate tax exemption threshold—would cost $3.2 trillion over 10 years. Moreover, the bill seeks to make all three of these components permanent, entrenching this regressivity into the U.S. tax code and raising the cost burden for years to come.
Before delving into these provisions, it is important to note that the key permanent provision—and single most-expensive item—in the 2017 Trump tax cuts was a huge reduction of the corporate income tax rate from 35 percent to 21 percent. Despite claims from the (first) Trump administration and congressional Republicans that slashing corporate tax rates would substantially increase workers’ wages, recent empirical evidence suggests that typical workers saw very few, if any, actual gains. On the contrary, these studies show that gains disproportionately flowed to the affluent.9
While the key regressive and permanent provisions of the Tax Cuts and Jobs Act dealt with corporate taxation, the key regressive (and, as proposed, permanent) provisions in the current tax bill involve changes to taxes on wealthy individuals. We start with one of the largest and least-understood provisions: much more favorable treatment of hard-to-verify business income.
The expanded deduction on pass-through business income
The Republican tax bill seeks to make permanent an expanded deduction on qualified business income of pass-through business entities, such as sole proprietorships, partnerships, and S corporations. In the past, income earned via these entities was typically taxed at the same rate as ordinary income. The Tax Cuts and Jobs Act of 2017, however, introduced a 20 percent deduction on this type of income, and the current bill would not only make this deduction permanent, but would also expand it to 23 percent. If implemented, this could lower the top marginal tax rate on pass-through incomes by nearly 10 percentage points.
Pass-through income makes up a much larger fraction of the income of high earners than it does for lower-income earners, and income from these types of entities is highly concentrated among those in the top 1 percent of the income distribution.10 In fact, nearly 70 percent of pass-through income goes to those in the top 1 percent of the income distribution. By comparison, “only” 45 percent of corporate income and 21 percent of national income do, respectively. According to recent research, roughly 40 percent of the rise in top income shares from 1980 to 2013 reflects sharp increases in pass-through business income.
The Tax Policy Center estimates that, if the current pass-through provisions were enacted, those in the top 0.1 percent of the income distribution would receive an average tax break of more than $120,000, representing the largest percentage increase in after-tax income of any group. (See Figure 2.)
Figure 2
Two final points about the expanded and permanent pass-through deduction are relevant. First, making the 23 percent expanded deduction permanent would cost around $820 billion over 10 years—much more than some of the much-touted provisions emphasized by the bill’s proponents. And second, pass-through entities are a major vehicle for tax avoidance, which is particularly relevant to our discussion later in this report of the evolving policy dynamics surrounding cuts to IRS enforcement.
Cuts to most individual marginal tax rates that nonetheless mostly benefit the rich
The One Big Beautiful Bill Act would make permanent rate cuts on the top marginal tax rate (from 39.7 percent to 37 percent), as well as on four of the next five brackets below the top. This not only would be the costliest provision of the bill (at $2.2 trillion over a 10-year period), but also would be 1.5 times more costly than the corporate tax provision of the Tax Cuts and Jobs Act of 2017.
It is easy to assume that reduced tax rates on all but the lowest tax bracket provide a roughly proportional boost to the after-tax incomes of taxpayers across the board. But nothing could be further from the truth.
First, cuts to tax rates on higher brackets exclusively benefit individuals with very high levels of taxable income. The reduction of the top marginal tax bracket, for instance, only benefits single filers with taxable incomes of more than $626,350 and married couples filing jointly with taxable incomes of more than $751,600.
Second, because tax brackets are marginal—that is, different levels of income are taxed at different rates, with everyone paying the same rate on income earned up to the next bracket—the most affluent taxpayers also receive the benefits of reduced rates on lower brackets.
How these components combine with changes in tax bracket thresholds and different filing statuses is complicated. Thankfully, researchers at the Tax Policy Center have done the math. Their results show that those in the top 1 percent would receive the largest increase in their after-tax incomes as a result of these provisions, at 2.1 percent. To put these numbers in dollar terms, members of this group would receive a tax cut of nearly $45,000 on average.
Permanently exempting even extremely large estates from taxation
While not as costly as the previous two items, the One Big Beautiful Bill Act also contains changes to the federal estate tax that would cost more than $200 billion over 10 years and would further increase economic inequality. Wealth inequality is not only high in the United States, compared with other rich democracies, but is also growing at a faster rate.11 Though estimates vary, the share of wealth that comes from inheritances also is large: On the lower end, more than one-third of wealth is inherited among U.S. households, and high estimates put the share closer to two-thirds.
Rather than strengthening a key policy tool that could reduce the ability of dynastic wealth to be transferred across generations, the Republican tax bill follows a trend that began at the turn of the 21st century. Dramatic increases in the estate tax exemption threshold have resulted in an infinitesimally small fraction of the nation’s wealthiest individuals facing any liability at all. (See Figure 3.)
Figure 3
Specifically, the current Republican tax bill calls for increasing the individual estate tax exemption threshold to $15 million ($30 million for couples) and making these changes permanent.12 From our own survey research, we know that telling middle-income Americans that the current exemption threshold is about $14 million for individuals usually comes as a large shock—most people believe that the exemption level is far lower.13 What should be equally shocking is that the bill, if passed, would increase this amount and make the change permanent. The benefits of these changes would accrue exclusively to the wealthiest individuals in the country.
In short, the tax cuts in the One Big Beautiful Bill Act widen the economic divide at a time when it is already large and growing. The picture looks even worse when we look at the spending side of the bill, to which we turn next.
Regressivity driver #2: Spending cuts for the rest of Americans
Our ongoing survey research shows that Americans do not support the large spending reductions that make the Republican bill so regressive. They are particularly opposed to the more than $900 billion in cuts to Medicaid and Affordable Care Act coverage.
Recognizing this political reality, President Trump recently warned congressional Republicans, “Don’t f–k around with Medicaid.” Yet they did not heed his advice. Instead, House Republicans have sought to portray unprecedented cuts to Medicaid, nutrition assistance, and student loans for low-income borrowers as efforts to reduce waste, fraud, and abuse.
These claims are demonstrably false. The unpopular spending cuts in the One Big Beautiful Bill Act will slash eligibility and benefits for critical policies that reduce poverty, safeguard health security, and promote equal opportunity. The biggest of these cuts affects health care (at $900 billion), but the bill also reduces spending by a combined $650 billion on the Supplemental Nutrition Assistance Program ($300 billion) and student loans ($350 billion).
Similar to the tax cuts they help finance, the bill’s spending cuts are guaranteed to substantially increase inequality. They share another feature, too: These are complex changes to policy details that few Americans recognize or understand. Indeed, many involve the imposition of new administrative burdens on people who receive or apply for public benefits at the state level.
There is only one way that regressive spending cuts can free up $1.3 trillion to finance regressive tax cuts: by taking away valued benefits from tens of millions of Americans. We now detail the cuts to health care, nutrition assistance, and student loans.
Cuts in Medicaid and Affordable Care Act coverage
The largest single source of spending “offsets” for tax cuts, the proposed cuts to Medicaid and changes to the Affordable Care Act would result in the biggest loss of health insurance coverage in U.S. history. According to the Congressional Budget Office, roughly 11 million Americans would become uninsured due to the OBBBA provisions. Another 4 million would lose coverage, according to CBO estimates, because the bill, despite extending regressive tax cuts, would not extend expanded premium tax credits for insurance purchased in the ACA marketplaces, which are set to expire at the end of 2025. And another 1 million Americans would lose health care coverage because of changes in the marketplaces being pursued through executive action.
As Figure 4 shows, these total losses of 16 million rival the 23 million that was projected for the bill that House Republicans passed in 2017 to repeal and replace the Affordable Care Act—an effort that eventually failed in the U.S. Senate, in part because it was the least popular major piece of legislation in at least a generation. (See Figure 4.)
Figure 4
This time around, Republicans are seeking similar health care losses but in a way that would better obscure their responsibility for the fallout—namely, by simultaneously restricting funding for and imposing new requirements on states and beneficiaries.
On the funding side, states will not be able to use health-care-related assessments or taxes—an important source of revenue for state Medicaid programs in every state but Alaska—to increase revenues for their programs. Some states may even be required to restructure their existing assessments in ways that reduce revenues or abandon them altogether. In addition, states that expanded Medicaid under the Affordable Care Act will be severely penalized if they provide coverage to noncitizens, even if those beneficiaries are lawfully living in the United States and even if states fully fund this coverage.
However, the biggest administrative burdens will be imposed on people who rely on Medicaid, in the form of stringent work requirements that entail both intrusive screening of applicants and frequent recertification of Medicaid beneficiaries. It is crucial to recognize that most of those who lose coverage under this rule will, in fact, be working or would qualify for an exemption based on having a disability, being in school, or other factors. Based on past experience with work requirements in state Medicaid programs, the Center on Budget and Policy Priorities estimates that at least 2 in 3 enrollees losing coverage would be wrongly cut off from coverage or mistakenly prevented from gaining it. According to the Congressional Budget Office, these severe administrative burdens would do nothing to increase employment.
Finally, although President Trump has repeatedly promised he would not cut Medicare, the current Republican bill would have major negative effects on Medicare enrollees who are “dually eligible” for Medicare and Medicaid—almost 9 in 10 of whom had annual incomes below $20,000 in 2020. Indeed, according to the Congressional Budget Office, just one provision would cause nearly 1.4 million low-income people with Medicare to lose access to state-run savings programs that lower their premiums and out-of-pocket costs.
Cuts to nutrition assistance
A similarly grim story can be told about the Supplemental Nutrition Assistance Program. If enacted, the One Big Beautiful Bill Act would end the federal commitment to funding 100 percent of food benefits, shifting a significant share of these costs to the states for the first time in the almost 50-year history of nationwide food assistance. Under the bill, states would be required to pay for at least 5 percent of benefits. In many states, however, the share would be even higher—as much as 25 percent of benefit costs—because of new requirements and penalties in the bill.
These tough new rules are being presented as penalizing states that have high error rates, whether they be over- or under-payments. Yet virtually all states have mis-payment rates that are, or in the recent past have been, above the new minimum standard, and such mis-payments almost always reflect unintentional mistakes by state workers and households rather than fraud.
Even as the Republican bill would impose these penalties, it would slash by half dedicated federal funding for the administration of state programs. This would not only push more costs onto states but also would increase the chance that states incur penalties.
As draconian as these requirements are, the bill would impose at least as devastating cutbacks directly onto beneficiaries in the form of expanded work requirements. As a result of these new administrative burdens, the Congressional Budget Office estimates that 3.2 million fewer people would receive SNAP benefits in a typical month, while the Center on Budget and Policy Priorities estimates that 11 million people—including 4 million children—would be at risk of losing SNAP benefits or seeing the benefits for their families cut. As Figure 5 shows, these losses would be widespread but concentrated in congressional districts in poorer parts of the nation. (See Figure 5.)
Figure 5
Cuts to subsidized student loans for low-income students
The bill’s large cuts to student loans have received relatively little attention, in part because they are so abstruse. Yet these cuts are as large in the aggregate as the cuts to SNAP—and similarly focused on restricting access to federal support for the least affluent Americans.
The bulk of these changes concern income-driven repayment, a means of reducing the risk of costly human capital investments for students who don’t have the safety net of substantial family wealth. Higher education is risky because, while average returns are high, there is substantial variability in post-graduate earnings—both because of deliberate choices, such as going into valuable but relatively low-paying professions such as teaching, and because of unexpected shifts in demand for specific occupations and skills.
In effect, income-contingent loans allow students whose incomes after graduation are lower to make smaller repayments, while conversely, students whose earnings are higher pay more of their loans back. These plans therefore foster not only greater economic opportunity but also greater economic security.
The One Big Beautiful Bill Act replaces existing income-driven repayment plans with a single new plan, the Repayment Assistance Plan, or RAP. The Urban Institute has compared the effects of this plan on borrowers relative to the main existing federal options, finding that “undergraduate borrowers with the lowest incomes (below $34,000) would be required to pay substantially more of their debt under the RAP than under current options.”14 Similarly, its calculations show that graduate borrowers with high levels of student debt would pay more under the proposed Repayment Assistance Plan until they earn around $70,000 per year.
Part of the reason for this disproportionate impact on lower-income borrowers is that the proposed plan, unlike existing plans, would apply to the first dollar of income, whereas existing options do not require repayment when earnings are below 150 percent of the federal poverty level. In other words, payments would be newly required for the poorest borrowers. By contrast, higher-income borrowers would be little affected, both because of the repayment formula and because they generally are not eligible for or opt out of income-driven repayment.
Finally, the bill alters eligibility standards for the federal Pell grant—the main source of support for low-income students attending college. Though again complex, the main changes would tighten eligibility for the program in ways that would reduce eligibility and benefits. According to the Congressional Budget Office, more than half of Pell grant recipients would see their awards decline, and roughly 7 percent would lose eligibility altogether.15 It is worth emphasizing that two-thirds of Pell grant funds currently go to families with less than $30,000 in annual household income, and 93 percent go to families with less than $60,000.
In short, Republican tax cuts for the affluent are being financed through cuts to programs that allow lower-income students and their families to achieve a better future.
Putatively populist provisions distracting from the bill’s regressive skew
Proponents of the One Big Beautiful Bill Act have focused on its provisions for no taxes on tips and overtime. These putatively populist provisions have garnered a lot of attention-grabbing headlines, and their perceived policy effects are more readily grasped by larger swaths of the public.
The day the bill was passed by the House of Representatives, we conducted a headline search of news stories dating back to the beginning of 2025 using NexisUni, a platform often used to examine media mentions of a given topic. Coverage of “no tax on tips” dominated the press, and mentions of “no tax on overtime” also rivaled or exceeded mentions of these more regressive elements. Unsurprisingly, then, in a survey we conducted in early June, Americans were more likely to have heard about these allegedly populist tax provisions than the bill’s more hidden regressive components. (See Figure 6.)
Figure 6
Despite the disproportionate attention devoted to these “no tax” provisions, their effects would be strikingly limited. Tipped workers make up less than 3 percent of all U.S. employment. Moreover, many tipped workers earn low wages and thus already pay little or nothing in federal income taxes, making these provisions meaningless. The Tax Policy Center estimates that only around “2% of all households … would receive a tax cut” from provisions similar to those proposed in the One Big Beautiful Bill Act. Similarly, relatively few workers (around 6 percent) reported working overtime in 2024.
Given these realities, the average tax cut for individuals in middle- to lower-income quintiles also would be extremely small. According to the Tax Policy Center estimates, those in the lowest quintile would see virtually no benefit; the second and middle quintiles would see an average increase in their after-tax incomes of only 0.1 percent—that is, one-tenth of 1 percent.
What’s more, the Center on Budget and Policy Priorities has shown that a no tax on tips type of provision would do almost nothing to make the bill less regressive. As for overtime, similar provisions to those in the bill would result in the second-lowest quintile getting an average annual tax cut of only around $80; for those in the lowest quintile, this drops to about $10.
Lastly, as Figure 7 shows, the costs of these provisions pale in comparison to the more regressive pieces of the legislation, which lawmakers are seeking to make permanent, while these putatively populist provisions would sunset at the end of 2028. Indeed, even if these provisions were extended over a 10-year window, their costs would still fail to come close to those of the biggest regressive tax cuts in the bill. (See Figure 7.)
Figure 7
Policy feedback effect #1: IRS funding cuts will increase tax evasion and income reclassification
When policy analysts discuss “dynamic” effects, usually they are referring to the extent that growth will result in additional revenue, partially offsetting the cost of different pieces of legislation. For the One Big Beautiful Bill Act, researchers at the Joint Committee on Taxation have found little evidence that the bill would induce any noticeable growth or that any revenue generated due to these growth effects would come close to allowing the bill to “pay for itself.”16 Indeed, the CBO’s dynamic score concluded that the bill would actually increase deficits by an additional $423 billion if it were scored dynamically because small growth effects would be outweighed by higher interest rates.
In this section and the next, we focus on a different set of potential future dynamics that are highlighted by scholarship on policy feedback—that is, the ways in which the bill will create political-economic and fiscal pressures that increase tax evasion among the affluent and compound cuts in benefits and enrollment, especially at the state level.
Because these dynamic effects result from the interaction of the Republican bill and changing features of its context, such as cuts to the IRS and the eroding fiscal situation of the states, they are not factored into standard distributional analyses. When we consider them in light of policy feedback scholarship, however, it becomes clear that the One Big Beautiful Bill Act is likely to be even more regressive than current projections indicate.
We turn first to the cuts to IRS funding and enforcement capabilities.
The assault on the IRS, and tax avoidance and evasion by the rich
The current Trump administration and the Department of Government Efficiency have put the Internal Revenue Service and its employees in their crosshairs. Both IRS staff and spending are on the chopping block, including enhanced IRS resources authorized by the 2021 Inflation Reduction Act. Some reports have suggested that the administration is seeking a “reduction in force” that would rid the agency of approximately 50 percent of its staff, or up to 50,000 workers. This is against the backdrop of dramatic declines in IRS funding and staffing that were occurring prior to the enactment of the Inflation Reduction Act of 2021.
These mind-boggling cuts, if implemented at anything close to the envisioned scale, are certain to translate into significantly less enforcement capacity for the agency, which would allow high-income individuals to avoid or evade taxes to an even greater extent than they already do. They are also highly likely to result in large—and, under certain assumptions, drastic—reductions in federal revenue collected, which is of course needed to fund the vital programs discussed above.
Declining tax enforcement helps those at the top for two simple reasons: They are the most capable of avoiding or evading their legal tax obligations, and, with their higher incomes, they have a greater incentive to do so. For most earners—especially those with middle-class and lower incomes—the vast majority of their earnings come from wages and salary, and taxes are regularly withheld from their paychecks. Higher earners, however, tend to earn much more of their incomes from sources other than wages, including pass-through entities, which we highlighted earlier. As a study from the Brookings Institution shows, the top 0.1 percent of earners receive more than 75 percent of their incomes in forms other than wages, the top 0.01 percent receive nearly 85 percent from these other sources, and the top 0.001 percent receive more than 93 percent of their income from nonwage sources.
Relative to wage income, the IRS typically has less—and, in some cases, far less—information on these sources of income. As such, noncompliance generally increases with income. Moreover, higher-income taxpayers simply earn more, making tax evasion by this group more costly to the government. Underreported income from pass-through businesses, for example, is a major driver of the tax gap—or the difference between taxes collected and those legally owed. (See Figure 8.)
Figure 8
Unsurprisingly, then, high-income taxpayers contribute to the tax gap to a substantially greater degree than those with lower incomes. Our colleagues at the Yale Budget Lab estimate that the bottom 50 percent of taxpayers are responsible for less than 6 percent of the total amount of unpaid taxes in a given year. By contrast, those in the top 5 percent are responsible for half of the total tax gap, and the top 1 percent alone is responsible for nearly 30 percent.
Why cutting IRS enforcement is counterproductive
Study after study shows that IRS enforcement generates much more revenue than it costs, especially from corporations and those with high-incomes. One study found, for instance, that increasing spending on IRS audits raises just over $2 in additional revenue for each dollar spent. Audits of those in the 99th percentile to the 99.9th percentile bring in about $3.20 per dollar spent, while audits of those in the top 0.01 percent yield a stunning $6.30 per dollar.
As impressive as these numbers are, they do not include so-called deterrence effects. When audited, taxpayers who have misreported taxes become much more cautious in the future, which typically means increasing their reported income and, as a result, revenue raised. The same study referenced above also finds that these deterrence effects bring in more than 3 times as much revenue as the audits themselves and lead to a combined total of $12 of revenue generated for each dollar spent on audits above the 90th percentile.
The key takeaway is that the direct and indirect revenue effects of additional spending on auditing high-income individuals are large. Moreover, voters overwhelmingly agree that the IRS should conduct more audits on high-income earners and corporations.
Instead, policymakers are heading in the opposite direction. The Yale Budget Lab estimates that reductions in force of about 7,000 IRS employees would lead to net foregone revenue—that is, net of any savings the IRS would accrue thanks to a lower head count—of approximately $64.3 billion over the next decade. This is already a sizable drop when compared to the lab’s estimates that the $80 billion in expanded funding under the Inflation Reduction Act would have generated more than $600 billion in net revenue over the course of a decade. However, if the Trump administration lays off closer to 50,000 IRS workers, the 10-year net revenue decrease would total nearly $350 billion. And these numbers do not include indirect deterrence effects.
Incorporating increases in behavioral responses that lead to decreased compliance, a reduction in the IRS workforce by about 50,000 jobs could lead to an additional $2.4 trillion added to the tax gap over the next decade, with most of this gap, again, resulting from declining tax enforcement at the top of the income distribution.17 If $2.4 trillion sounds familiar, it is because it is equivalent to the amount that the Congressional Budget Office estimates would be added to the primary deficit over a 10-year period under the One Big Beautiful Bill Act. (See Figure 9.)
Figure9
Policy feedback effect #2: Restricted fiscal and economic circumstances will increase pressure on states to cut benefits
The dynamic feedback effects that are likely to increase tax evasion and the exploitation of tax loopholes by affluent Americans have their counterpart in the dynamic feedback effects that are likely to increase the losses imposed on less affluent Americans.
A large body of research has analyzed what is sometimes called bureaucratic disentitlement—the ways in which the administrators of programs, under fiscal pressure and facing new rules and messages from above, reduce spending and access to programs for which citizens are technically eligible.18 The design and context of the Republican budget bill’s provisions are almost perfectly calibrated to produce a dramatic upswing in such retrenchment, compounding the decline in health insurance, food assistance, and access to financial aid for low-income students.
These cascading effects could make the bill even more devastating for less affluent Americans than projected by the already-grim forecasts we have reviewed. Importantly, the resulting benefit cuts would be the result of complex administrative and spending decisions that would often play out in highly decentralized ways—making them difficult to attribute to federal lawmakers. For national politicians seeking to impose unpopular policy outcomes, this is a feature, not a bug, and could make it much harder to muster the focused political response necessary to slow or reverse these changes.
Intense new pressures on states to cut eligibility and benefits
The major site of these cutbacks will be cash-strapped states. States are required (legally or effectively) to balance their budgets, and as a whole, they are already facing one of the worst fiscal situations in decades. They will now have to face it with major cuts in federal Medicaid and SNAP funding, including targeted cutbacks in federal support for state administration, while being required to implement administratively challenging new requirements.
All the estimates of Medicaid and SNAP cuts we have discussed in this report incorporate specific assumptions about how much of the shortfall that states face under the proposed Republican bill will be made up by increased state spending. The general assumption used by the Congressional Budget Office in its cost projections, for instance, is that roughly half of federal cuts will be covered by states. These assumptions imply that to cover the shortfall, states will either cut spending elsewhere in their budgets or raise taxes—both highly difficult in the current environment.
If states cannot cover the expected share of the growing gap in funds, the coverage and benefit losses will be even greater than expected. But even if states are able to cut spending in other policy areas to finance continued Medicaid or SNAP benefits, these spending cuts would have negative effects on lower-income state residents that are not included in distributional estimates of the bill’s direct consequences. Either way, states will be under enormous pressure to reduce the cost of affected programs.
How states might pursue such cost reductions is little mystery. The One Big Beautiful Bill Act contains mandates and penalties that are designed to pressure the states to increase administrative burdens so eligible beneficiaries are pushed or kept off the rolls. Remember that most of those who fail to receive benefits will actually be eligible for those benefits but will simply fail to run the administrative gauntlet or be discouraged from even trying.
The history of state-level programs focused on less affluent residents provides strong expectations about how front-line administrators are likely to operate in this new context. Responding to new rules, incentives, and messages, they will likely lean toward more draconian implementation of eligibility and benefit rules. Here again, the feedback effects of the bill could cascade to produce much larger losses for less affluent Americans than projected.
The darkest of scenarios would play out if the United States experiences a significant economic downturn—a prospect that has become much more likely in recent months due to federal spending cutbacks, high and ever-changing tariffs, erratic trade policy, and much-increased political uncertainty. During the Great Recession of 2007–2009, states not only cut back on Medicaid but also slashed spending on public elementary and higher education to stay afloat. With states forced by the Republican tax bill to shoulder much more of the costs of health and nutrition benefits themselves, the negative effects of the next economic downturn could be even larger—not just on Medicaid and nutrition assistance, but on other crucial state-level policies that reduce inequality as well.
Confusion, delay, and cutbacks for federal student loans and grants
While student loans for higher education are a federal responsibility, negative feedback effects are likely to operate in this realm too. First, as just discussed, states already face a challenging situation funding higher education. Nearly 90 percent of Pell grant funds go to public universities, which are already under severe financial pressure. In the context of an economic downturn, state funding for public universities could be further compromised, reducing the capacity of these vital institutions to enroll less affluent students.
Second, federal-level political and economic dynamics are profoundly challenging, too. Just as IRS funding and staff are under threat, so too is the U.S. Department of Education, which administers both the Pell grant program and income-driven repayment plans. In addition to changes in these programs that raise costs for lower-income students, the One Big Beautiful Bill Act would require that the federal Department of Education implement a complex proposal that is designed to penalize colleges with lower levels of student loan repayment—penalties that could reduce the ability of these colleges to serve lower-income students.
Quickly implementing the bill’s envisioned changes to Pell grants and loan repayment programs, as well as its new rules for colleges, would be challenging if the Department of Education were at full capacity. But the department is, in the words of Secretary Linda McMahon, “winding down,” having already lost nearly half its staff. As new rules are being worked out, borrowers are likely to face severe confusion, bureaucratic unresponsiveness, and interim solutions that will raise their costs. As with the Medicaid and SNAP cuts, the most severe effects will hit those with fewest resources—lower-income students most reliant on federal grants and loans to attend and remain in school.
Similar to the potential increase in tax evasion that would result from deep cutbacks at the IRS, these processes of bureaucratic retrenchment defy precise distributional estimates, which is why they are a means of obscuring the bill’s true effects. Yet what’s crucial about these uncertain effects is that they all point in one direction: toward bigger tax cuts and bigger spending cuts, producing bigger regressive distributional impacts than current analyses suggest.19
Conclusion
Our review of tax and budget laws from the past four decades shows that the Republicans’ current legislation is unprecedented in the extent to which it shifts income from low- and middle-income Americans to the rich. That regressivity is striking on its own terms—no other law of this period has combined large tax cuts concentrated on those at the top with large spending cuts focused on those lower down the economic ladder.
Yet it is all the more striking because leaders of the Republican Party, and especially President Trump, have presented themselves as economic populists. The truth is that the few allegedly populist provisions, such as no tax on tips, are miniscule compared with the huge tax cuts for the richest Americans. Similarly, claims that the bill “would not actually be cutting” popular programs are at odds with the reality that millions of Americans—most of them workers or those living in working households—would lose health insurance, food assistance, and other crucial benefits if the bill became law.
Once we look beneath the surface of the bill’s deliberate complexity, its big regressive provisions reveal their ugly heads. These provisions are historically skewed toward the affluent even when we look at them in isolation. When we examine them not on their own but in parallel with other co-evolving dynamics, such as cuts to IRS funding and the strained fiscal situations of many states, the likely regressive effects look even bigger.
If populism means standing up for the ordinary workers and their families, this bill does exactly the opposite. After a half century of rising gaps between the rich and the rest, it will only deepen citizens’ concerns about a political system that seems highly responsive to economic elites while compounding the strains facing ordinary Americans. The best way to start restoring confidence in that system is to defeat this historically regressive bill.
About the authors
Jacob S. Hacker is Stanley Resor Professor of Political Science at Yale University and director of the American Political Economy eXchange, or APEX, at the Yale Institution for Social and Policy Studies. He is also faculty co-director of the Ludwig Program for Public Leadership at Yale Law School.
Patrick Sullivan is a postdoctoral scholar at APEX and an associated researcher at “The Politics of Inequality” Cluster of Excellence at the University of Konstanz.
Acknowledgements
We would like to thank Emilie Openchowski, Elena Waskey, and David Mitchell at Equitable Growth for providing us with feedback, encouragement, and assistance; Lucas Kreuzer for his valuable research assistance; Alex Hertel-Fernandez and Philipp Rehm for reading and responding to draft versions of our arguments; Natasha Sarin, Harris Eppsteiner, John Ricco, and Martha Gimbel of the Budget Lab at Yale University for providing and explaining their distributional data; and Chuck Marr and Brendan Duke at the Center on Budget and Policy Priorities for discussing early ideas related to this project.
Did you find this content informative and engaging? Get updates and stay in tune with U.S. economic inequality and growth!
The budget reconciliation bill recently passed by the U.S. House of Representatives proposes to make large cuts to Medicaid, the Supplemental Nutrition Assistance Program, and other social programs to pay for the extension of the 2017 Trump tax cuts. The Senate is poised to make changes to the proposed Medicaid and SNAP cuts in the House bill, but early indications are that they will be at least as drastic, if not more so.
Most analysis of the impacts of the reconciliation bill has focused on the consequences for the 11 million people who stand to lose their health insurance and the 4.5 million people at risk of losing their SNAP benefits. But these analyses overlook an even larger group that will be affected: workers and business owners who live and operate in the communities where program beneficiaries live. These stakeholders stand to lose key customers in the form of SNAP recipients who will no longer be able to afford their grocery bills and health care workers who may lose their jobs as a result of hospital and care center closures.
When someone uses nutrition assistance to purchase groceries, that money goes directly to the grocery store, which uses it to hire employees and buy food from suppliers. Similarly, Medicaid dollars go to hospital workers, doctors, and mental health care providers, who then spend their earnings in the local economy. In this way, Medicaid, the Supplemental Nutrition Assistance Program, and other income support programs perform a similar role as industries that produce tradable goods, such as manufacturing or farming. They bring money into a region—federal funds playing the role that payments for tradable goods do in export industries—which then circulates among local businesses such as restaurants, hardware stores, and barber shops, among others.
In a new working paper, I show that these types of social programs are a major part of the local economic lifeblood across the country. In total, I find that Medicaid amounts to an average of 11.2 percent of the economic base of regions nationwide. In other words, Medicaid contributes roughly as much to metropolitan Detroit as the auto industry, more to Houston than chemical manufacturing, and more to Boise than the electronics industry.
Though I find that SNAP benefits contribute a smaller amount, at an average of 1.36 percent of the total economic base of local regions, the program is still worth more to Nashville than the music recording industry—and is worth twice as much to McAllen, Texas, as pipeline transportation, the largest private-sector industry of that region’s economic base.
On average, my research suggests, each additional dollar of economic base income (from government transfers or traded-goods industries) generates roughly another dollar in wages paid and sales made by local businesses. Cutting Medicaid and SNAP by $1.2 trillion over 10 years, as the Republican budget bill proposes, is likely to cause an additional $120 billion per year in lost local income, as grocery stores lay off cashiers, restaurants close, and housing construction slows down. At the national average annual wage of around $75,000 per job—likely an overestimate, since local jobs tend to pay less than jobs in manufacturing or other traded-goods industries—that works out to about 1.6 million local jobs lost.
Of course, the tax cuts in the bill are likely to prompt some additional spending from those who receive them—or, rather, continue to receive them, as most of the proposed cuts simply extend current law. Yet that additional spending is unlikely to offset the extent of the job losses for two reasons.
First, according to the Joint Committee on Taxation, about 70 percent of the tax cuts will go to tax filers earning more than $150,000 per year. Because high-income households spend a smaller portion of their income than low-income households, the additional dollars these affluent households take home from the tax cuts will likely stimulate less total economic activity than the medical and nutrition support programs they replace.
Second, the households that stand to benefit the most from the tax cuts don’t live in the same places as current Medicaid and SNAP beneficiaries. Medicaid beneficiaries are concentrated in places such as New Mexico, Louisiana, Arkansas, and Kentucky, in addition to parts of New York and California, while incomes are highest in large metropolitan areas, especially on the coasts. This means that the congressional Republicans’ reconciliation bill features not just economic but also spatial redistribution, funneling billions of dollars from less affluent districts to places such as Boston, San Francisco, and Washington, DC.
The economic fallout from this bill would be especially large in parts of the United States where Medicaid and other transfers form a greater portion of the economic base. (See Figure 1.)
Figure 1
U.S. Rep. Hall Rogers (R-KY), for example, who voted for the bill, represents a district where Medicaid makes up more than one-fourth of the local economic base. My calculations show that the projected cuts to federal Medicaid spending, combined with a 27 percent cut to SNAP benefits—the CBO estimate of the bill’s effect—would be the economic equivalent of losing more than one-third of all private-sector traded-goods industries in this district, all at the same time.
Similarly, Rep. Monica De La Cruz (R-TX) also voted for the bill, which does the equivalent of eliminating the pipeline transportation industry from her district—the second-largest private-sector industry there. The bill’s impact on Rep. Dan Bacon’s (R-NE) district would be as large as losing 85 percent of the farming industry in his district, while that on Rep. Tom Kean’s (R-NJ) district is about as large as losing its food manufacturing industry.
At the state level, the cuts to Medicaid and SNAP benefits would be the equivalent of losing 60 percent of the oil and gas extraction industry in Alaska, the entire logging and paper manufacturing industries in Maine, the plastics and rubber manufacturing industry in Ohio, and the machinery manufacturing industry in Pennsylvania. In North Carolina, it would be akin to losing all of the remaining textile and furniture manufacturing industries, while in Missouri, it would be as though 80 percent of military bases closed at once.
As my research makes clear, not only will the bill adversely affect beneficiaries of important social programs that bolster middle-class and low-income households, but its cuts to social programs will have a major impact on local economic activity as well. As the contours of the bill continue to be debated in the halls of Capitol Hill, policymakers should keep these broader economic impacts in mind.
Want to know how the proposed cuts compare to industries where you live? You can download a full searchable and filterable file listing the contribution of Medicaid and SNAP to the economies of each U.S. congressional district and state, as compared to their leading private-sector industries, along with my working paper.
Did you find this content informative and engaging? Get updates and stay in tune with U.S. economic inequality and growth!
Senator Kaine, Senator Murphy, and members of the Forum, thank you for the opportunity to be here today.
I’m going to make three key points.
First, the Republican budget bill that passed the House of Representatives and is now under consideration here in the Senate is an unprecedented transfer of income and wealth from the bottom to the top. Never in modern U.S. history has one single bill taken so much from working families and directly deposited it into the pockets of the wealthy.
Second, in addition to being morally indefensible, this budget bill is also economically backward, likely to impede growth and prosperity for everyone while directly making life worse for huge numbers of American families.
And, finally, distributional analyses of the current bill are, if anything, likely to be understating the degree to which the poor and the middle class will be harmed by this bill.
To begin with, let’s step back and understand the basic contours of the Republican budget bill. The bill starts by cutting more than $1 trillion in funding over the next decade from health care, nutrition assistance, and education. The bill then takes that $1 trillion and uses it to partially offset the cost of more than $4 trillion in tax cuts. The difference of roughly $3 trillion is added to the national debt. Those are the fundamental building blocks of this bill, and those facts are confirmed by every independent analysis, including from the official Congressional Budget Office.
But what does all that mean in practice? Well, fundamentally, it means that millions of Americans will lose their health care coverage, pay more for their health care, lose nutrition assistance, and pay more for higher education. And, critically, those costs will fall much more heavily on poorer Americans, while rich Americans will, by and large, not be affected at all by these cuts.
Sixteen million Americans will lose their health insurance if this budget plan becomes law.20 Of those 16 million, none are wealthy. They are all middle-class and low-income people and families who rely on Medicaid and the Affordable Care Act for their health insurance. And, of course, the bill’s enormous cuts to the Supplemental Nutrition Assistance Program will fall entirely on people who are currently eligible for that program’s aid—households who are either living under the poverty line or are very near the poverty line.21
By contrast, the tax provisions in the law are heavily skewed to the top. Of the roughly $4 trillion in net tax cuts proposed by the House bill, more than half of the total benefit goes to the richest 10 percent of Americans.22 The average tax cut for someone in the top 0.1 percent is roughly $250,000.23
When you put these pieces together, it’s easy to see that this bill will directly take money out of the pockets of tens of millions of lower-income Americans and put that very money into the pockets of the rich. And that is precisely what every single independent analysis—from experts across the ideological spectrum—has found.
The conservative-leaning Penn-Wharton Budget Model found that roughly half of the total benefit of the bill goes to the richest 5 percent, while the bottom 40 percent will pay more.24 The independent, nonideological Tax Policy Center and Yale Budget Lab both found the same.25 The nonpartisan Congressional Budget Office similarly found that when the bill is fully phased in, the benefits actually are even more concentrated at the top, with more than 80 percent of the benefits going to the richest 5 percent. In fact, the CBO analysis found that, on average, over the course of the next 10 years, the bottom 10 percent of Americans will end up with $1,600 less, while the richest 10 percent will reap $12,000 more.26
In our lifetimes, there has never been a bill that so directly and brazenly takes from the poor to give to the rich. No major piece of U.S. legislation in at least the past 40 years—and likely much longer—has simultaneously made the poor poorer, while making the rich richer.27 It is true that there have been bills that have increased inequality. The 2017 tax law, for example, delivered much larger tax benefits to the rich than it did to the middle, and the poor were largely left out.28 But this bill goes even further than that, directly reducing the incomes of the poor, leaving the middle class out of most of the gains, and showering essentially all of the major benefits on the top. This is an unprecedented transfer of income and wealth from the bottom to the top.
Almost all Americans agree that taking money from the poor to give to the rich is morally indefensible. But it is also the case that making the rich richer at the expense of everyone else is a huge economic blunder. Growth and economic prosperity do not trickle down from the rich. Instead, shared growth and prosperity flows from the contributions of everyday Americans who participate in the economy to their fullest as workers, consumers, caregivers, and innovators. Extreme inequality is itself a barrier to and a drag on robust economic growth because it leads to fewer opportunities for the vast majority of everyday people, distorts economic incentives that would otherwise be aligned for better outcomes, and undermines our collective ability to solve economic problems.29
This bill will raise all of those barriers to growth and prosperity. It will reduce opportunities for economic mobility by making more costly the basic necessities that families need to give their children a better shot at prosperity. It will encourage the already-wealthy and powerful to further concentrate their resources by rewarding behavior that encourages taking a bigger share, rather than growing the pie. And, finally, by once again cutting taxes for the rich, it will further reduce the resources available to us as a society to solve the problems that can only be solved together. The reason why it always feels as though there is not enough funding to meet the basic expectations of the American people is because that money keeps getting spent on tax breaks for the rich.
This is one reason why several macroeconomic analyses of the bill have found that, far from boosting growth, it may very well impede it. The most recent analysis comes from American University’s Institute for Macroeconomics and Policy Analysis. It finds that the bill would reduce growth, resulting in a smaller economy by the end of the decade, in part due to its regressive nature.30 Other analyses have also found that the bill will reduce growth in the medium and long term.31
Indeed, the negative effects on the overall economy are just one reason why the bill is actually likely to be even harsher on the middle class and the poor than it seems. The impacts of slower growth and a smaller economy are typically felt most acutely by middle- and low-income households. But there are additional reasons to be concerned that this bill is even more redistributive from the bottom to the top than it appears at first glance.
For one, many other policies pursued by this Trump administration—policies that they have explicitly tied to this budget bill—are also regressive in nature. The administration’s proposed cuts to science and technology research, to food and consumer safety, to disease prevention, and to housing are all going to hurt middle- and low-income families far more than they hurt the rich and large corporations. The promise of these future cuts has been explicitly tied to arguments in favor of passing this budget bill.
Similarly, the Trump administration’s across-the-board tariffs have recently been cited as another part of the overall package. Tariffs, similar to sales taxes, are regressive, as lower-income families have to pay out a larger share of their income in the form of higher prices than richer families do. In fact, one analysis from the Yale Budget Lab found that, after including the tariffs as part of the total budget package, 80 percent of Americans would pay more under the Trump and Republican budget plan, while the richest 1 percent would pay less.32
Regardless of one’s views on the usefulness and efficacy of tariffs as a tool of economic policy, I think we can all agree that they should never be used to pay for tax cuts that primarily benefit the wealthy and large corporations.
And finally, I must mention that the overall reduction in federal revenue is likely to once again lead to future cuts that fall most heavily on poor and middle-class families. Supporters of this very budget bill point to the federal fiscal imbalance as the primary reason why we “must” cut health care and nutrition assistance and why middle-income families must face higher costs for education and energy. But, in fact, the main culprit responsible for our weakened fiscal situation is the series of repeated, large tax cuts that primarily benefited wealthy individuals and corporations.33 Put simply, over the past 25 years, Congress has spent many trillions of dollars on unpaid-for tax breaks, and that is the main reason why our debt is on an upward trajectory.
Another series of expensive tax cuts that further reduces federal revenue and increases federal debt will inevitably lead to disingenuous future calls to reduce federal funding for critical services and basic necessities, even though the cause of that rising debt will have been tax cuts. Tax cuts for the rich are not free. Someone will pay for those tax cuts, and if this bill is any indication, it won’t be rich people in the future—it will be middle- and low-income people.
Let me be as plain as I can be. This bill will take money away from millions of poor and middle-class Americans and put that money into the bank accounts of the richest people on the planet. Underneath all of the policy details and analyses and talking points and distributional tables, that is the simple truth. This is the most upside-down bill in modern U.S. history.
Did you find this content informative and engaging? Get updates and stay in tune with U.S. economic inequality and growth!
The United States often has been touted as a land of opportunity, where hard work leads to success and children do better than their parents. But increasingly, these notions of opportunity and mobility are being challenged as economic inequality has widened over the past several decades.
This factsheet provides an overview of the different types of economic mobility in play across the U.S. economy and society, alongside key facts about economic mobility in the United States and potential policy solutions to increase upward mobility.
What is economic mobility?
Economic mobility refers to changes in the economic status of individuals or groups, generally as measured by income, over time. Economic mobility can be measured as intragenerational or intergenerational:
Intragenerational mobility looks at changes in economic status within a generation, such as how individuals’ incomes change over their adult lives.
Intergenerational mobility looks at changes in economic status over generations, such as how the economic status of adults compares to that of their parents at a similar point in their lives.
Economic mobility can also be viewed as absolute or relative:
Absolute mobility considers whether the incomes of adults are higher than their parents’ income or similar cohort’s income at a similar age at different points in time, when adjusted for inflation.
Relative mobility looks at how individuals’ status in the income distribution changes among their peers.
Key facts about economic mobility in the United States
Women on average earn less than men, and that gap increases with age. Women earned about 83 cents per dollar earned by men in 2023, the most recent year for which full data are available, with Black women earning only about 67 cents and Latinas earning only about 58 cents per dollar earned by White men. Research shows that human capital factors, such as education and experience in the labor market, do not explain the current gender wage gap. Instead, the disparities are driven by factors such as occupational and industry segregation and differences in the division of labor by gender, particularly in caregiving for children.
Factors driving economic mobility levels in the United States
Parental economic status is the primary determining factor for children’s mobility
One study estimates that parents’ income determines about half of the mobility level of their child or children, when averaged across the parental income distribution. That rate is even higher for children from low-income families, with the same study finding that about two-thirds of the economic differences between low-income and higher-income families persist among their children.
High economic inequality is correlated with low intergenerational mobility
High levels of U.S. economic inequality are correlated with lower intergenerational mobility, also known as the Great Gatsby Curve. In other words, the more unequal the U.S. economy becomes, the less likely children from the lower end of the income distribution will be better off economically than their parents.
Structural barriers limit opportunity and mobility
Low levels of economic and social mobility across generations are largely due to structural issues, which limit opportunity and keep economic statuses in place over generations. U.S. tax and transfer policies, for example, have become increasingly regressive due to policies such as the preferential treatment of capital gains, compared to income from work. Many transfer policies also disincentivize saving, thereby increasing inequality, which, in turn, limits mobility.
Or consider residential segregation by socioeconomic status, which remains a barrier to economic opportunity and critical social connections. Similarly, racial discrimination, both historical and current, keeps Black Americans and Native Americans largely stuck in place at the lower end of the income distribution.
Much of the discussion around improving economic mobility in the United States focuses solely on human capital development, such as education. Yet many of the factors driving mobility are structural, rather than tied directly to individuals, which means that fostering more equitable opportunities to advance economically requires action on a broad range of policies, including:
Tax reform to significantly improve progressivity and lessen inequality
The current reconciliation bill now before Congress won’t correct for the low tax rates paid by the richest Americans
Overview
Calculating the effective tax rate of the richest Americans can be complicated, but it is critical for ensuring tax policy debates—such as the one currently raging in the U.S. Congress about massive new tax cuts that likely will favor the well-off—are well-informed. This complexity was exemplified during a 2024 Senate Finance Committee hearing on income taxation of high-income and high-wealth taxpayers. Then-committee chairman Sen. Ron Wyden (D-OR) called the Joint Committee on Taxation’s computation of a 34 percent overall federal tax rate for those in the top 0.01 percent income group “funny math” (and “junk math,” too, at one point).34
Sen. Wyden’s remarks were more than just a passing comment or political barb. One of the most knowledgeable U.S. senators on tax issues was referring to a fundamental calculation made by the stewards of federal tax legislation. We view the remarks as generally applying to two types of tax rates—the “special” JCT method that produced the 34 percent tax rate for the top 0.01 percent by using a comprehensive income denominator that was presented in the pamphlet for that hearing, and the standard JCT rate that uses cash-like income as the denominator, resulting in a federal tax rate of 28.7 percent for the top 0.1 percent income group in the pamphlet’s appendix (the numerators were the same, except the latter excluded the relatively small estate and gift tax).
This column is not about one funny tax rate as much as two applications that imply implausibly high tax rates for the very well-off:
Funny math #1: The standard JCT distributional approach that relies on capital income voluntarily recognized on tax returns misses too much high-end income.
Funny math #2: Neither the standard JCT approach nor its special method were extended to very top incomes, creating a tax rate void that can be misread.
We now break down these two approaches and compare them to other approaches taken by leading academics to demonstrate that Sen. Wyden’s “funny math” quip highlights the seriously inequitable tax rates paid by the wealthiest Americans.
Funny math #1: Defining income
Interpretation of U.S. tax rates is affected by two popular (and generally correct) intuitions. First, people—not corporations or other entities—pay the corporate income tax. Second, cash in hand generally is of more use than unrealized capital gains or undistributed corporate earnings, but noncash income (such as when a 401(k) or savings account grows) also is of value.
The standard income approach is used by the JCT staff to evaluate proposed policy changes, such as the tax bill now being considered. The committee’s standard method calculates tax rates with a denominator that is composed primarily of information from tax returns, including wages, pass-through business income, corporate dividends, and realized capital gains. This method—also used in some form by the Congressional Budget Office, the joint Brookings Institution-Urban Institute Tax Policy Center, and the U.S. Treasury Department—often is referred to as cash-based because of a focus on resources in hand, including capital gains realized by individuals, as well as dividends received from corporations.
In contrast, notional income, such as appreciation of stock in a 401(k) or owner-occupied housing, is not included in the denominator of the JCT standard tax rate.35
Because, in effect, people pay the corporate income tax, the Joint Committee’s cash-based approach makes an exception by allocating to shareholders a corporation’s tax payment (though not actually paid in cash by people) to the numerator of that individual’s tax rate, as well as an amount of pre-tax corporate earnings (though not actually received in cash by people) equal to the corporate tax payment to the denominator. So, if it is determined that a corporation pays $10 of corporate tax on your behalf, you are deemed also to have earned $10 of pre-tax income. (This tax “gross-up” is also used for employer payroll taxes, which are attributed to workers as both income earned and taxes paid.)
Why include this one kind of notional capital income but not others, such as post-tax corporate earnings that are not distributed (more than $1 trillion annually in the official aggregate economic statistics) or unrealized capital gains (the accumulation of which by high-wealth persons is estimated to exceed $13 trillion)?36 This inconsistency is especially problematic when calculating the tax rates of the wealthy, to whom a disproportionate amount of this other notional income accrues, rendering the JCT standard approach (as well as the cash-based methods used by other groups) ineffective in describing the tax rates of those at the very top of the income distribution.
Getting beyond cash
A more comprehensive income concept that includes a broader swath of notional income is needed to describe very well-off Americans. In this regard, a common approach includes all corporate earnings, whether retained, used to pay corporate tax, or paid out to individual shareholders by corporations as dividends, but omits realized capital gains to prevent double counting. The method also includes imputed rent from homeownership and takes account of economic depreciation37 of capital assets.
In the pamphlet prepared for the 2024 Senate hearing described above, the staff of the Joint Committee on Taxation offered a non-cash-based capital income method (referred to here as the “special” method), which includes notional income and is the source of the 34 percent tax rate that Sen. Wyden called funny math. The special method resembles the widely cited income and tax distributional analyses of economists Thomas Piketty at the Paris School of Economics and Emmanuel Saez and Gabriel Zucman at the University of California, Berkeley.38 Both of these methods rely on the National Accounts’ concept of national income, which offers comparability across time and geography but still requires imputations of things, such as tax evasion, that don’t always show up in administrative data.39
There are differences in which types of taxes the various researchers include in tax rate numerators. Piketty, Saez, and Zucman portray the total tax burden on these high-income Americans, including all federal, state, local, and even foreign taxes paid. Neither the JCT special nor standard method includes state and local taxes, and other researchers often exclude certain taxes that are thought to not make much difference for very high-income people, such as payroll taxes. This narrowness in the Joint Committee on Taxation’s approach makes it especially surprising that its tax rates are higher than most other estimates.
Funny math #2: Granularity at the very top
Figure 1 shows overall tax rates for the top 1 percent group, as well as even higher-income groups when the data are available, for the JCT standard method (the blue columns), the JCT special method (orange columns), and the approach by Piketty, Saez, and Zucman (purple columns).40 For context on the income levels, in the JCT special method, the top 1 percent has average per-capita income of $788,000, the top 0.1 percent about $3 million, and the top 0.01 percent about $13 million (all in 2019 levels). The top 400 families refers to a very select group at the top of income spectrum, though not as selective as two of the richest U.S. billionaires, Jeff Bezos and Warren Buffett, shown all the way on the right in Figure 1. (See Figure 1.)
Figure 1
The results from Piketty, Saez, and Zucman are regressive at the very top beyond the truncation points at which the two JCT methods do not offer results, indicating wide variation even among the roughly 16,000 tax units in the top 0.01 percent. The Joint Committee’s top income tax rate is 34 percent for the special method that focuses on the top 0.01 percent of U.S. households and 28.7 percent for its standard percentile-based method focused on the top 0.1 percent, while Piketty, Saez, and Zucman’s top rate for the richest 400 families group is 23 percent. The latter rate aligns with a 2018 case study by Saez and Zucman of tax rates for Bezos and Buffett, seen in the green column of Figure 1, which relied heavily on tax and other administrative data in finding an overall 18 percent tax rate for the two billionaires.41
Digging deeper, much of the debate about overall tax rates at the very top of the U.S. income ladder is about individual income tax rates (as opposed to corporate, property, or sales tax rates), especially because the 0.01-percent-and-above groups receive so much income from pass-through business entities and own so many assets that appreciate so much.42 For the top 0.01 percent, Figure 2 shows that the JCT special model finds a 30.6 percent federal individual income tax rate, compared to the 17.2 percent rate calculated by Piketty, Saez, and Zucman, the latter being inclusive of state and local individual income taxes. (See Figure 2.)
Figure 2
What’s more, Piketty, Saez, and Zucman find the top 400 families income group faces a 9.2 percent individual income tax rate. This finding punctuates the unraveling of top-end tax progressivity, consistent with case studies undertaken by economists Greg Leiserson (then at the White House Council of Economic Advisers) and Danny Yagan at UC Berkeley, which used a combination of administrative and survey data to find individual income tax rates of less than 10 percent for the top 400 families income group.43 And, even more stunning, Saez and Zucman calculate a 0.5 percent individual income tax rate for the two billionaires, Bezos and Buffett.
Administrative data as a tiebreaker
The case studies finding low tax rates for the top 400 families and for billionaires (even if just for two of them) are highly instructive. Why? Because when two or more competing tax rate calculations rely on different imputations, in addition to learning more about the competing imputations,44 those interested in tax policy ought to consider any available individualized administrative data.
An example of a helpful test using administrative data as a tiebreaker is a consistency check conditioned on the relation between the individual income tax rates of the top 400 families and the top 0.01 percent income groups. If we accept the case study findings that the individual income tax rate for the top 400 families is 10 percent or lower (as shown in Figure 2), then, because the top 400 families are by definition part of the 16,000 households that comprise the top 0.01 percent group, that implies that the other households in the top 0.01 percent group would face a federal individual income tax rate of 35 percent or higher in the JCT staff’s special approach.
Yet such a high federal individual income tax rate for the top 0.01 percent less the top 400 families seems implausible, given all the tax benefits available to the well-off, including the elective inclusion of capital gains at a lower tax rate, the deduction for charitable contributions,45 the 20 percent deduction for pass-through income, and corporations that don’t pay dividends. Unlike how both the JCT regular and special methods display uniform progressivity through the upper-income groups, other studies have shown that moving from cash-based to more comprehensive capital income methods reduces progressivity at the top.46
And, for an example of a new test using administrative data, there is a recent paper by economists Cole Campbell at the Federal Communications Commission and Jacob Robbins and Sam Wylde at the University of Illinois Chicago, on the distribution of realized and unrealized capital gains.47 They find an all-in tax rate of 25.5 percent for the top 0.01 percent income group.48
A ProPublica investigation using actual U.S. tax records also corroborated that the richest Americans pay a relatively small amount of individual income tax, with the top 15 families (by income), top 25 families (by wealth), and top 400 families (by income) paying an average individual income tax rate of 20 percent, 16 percent, and 22 percent, respectively, over 5 to 6 years in the mid-2010s. It is important to note that these relatively low rates are calculated with the very narrow denominator of reported Adjusted Gross Income, which does not include unrealized gains or proceeds from loans and is reduced by charitable donations, among other credits and deductions.49
Conclusion
Decades of U.S. tax policy has been influenced by the notion that federal tax rates are uniformly progressive, so whether there is a regressive tax rate notch for the very well-off is more than a nit. That regressivity is a gateway for confronting and fixing a U.S. fiscal system skewed to benefit the very wealthy—particularly today, given the tax and spending regressivity50 evident in the reconciliation bill passed by the House of Representatives on May 22, 2025, that is now before the U.S. Senate for consideration.
Perhaps at some point, that regressivity will spark the enactment of a billionaire’s tax51 in light of the evidence that the top 400 families income group pays a federal individual income tax rate of about 10 percent. Even if that tax rate were as high as, say, 20 percent, it still would mean, assuming other things remain unchanged, that there is a regressive notch within the top 0.01 percent income group. In the vernacular of Sen. Wyden’s comments, the math describing such top-end tax regressivity seems less funny than the math of the Joint Committee on Taxation’s 34 percent rate.
Did you find this content informative and engaging? Get updates and stay in tune with U.S. economic inequality and growth!
When workers choose jobs with predictable schedules, safer conditions, or greater autonomy, they are often paying a price: lower wages. In some cases, these hidden trade-offs are considerable. Indeed, my research shows that these “amenity trade-offs” can account for as much as two-thirds of the gender pay gap.
In this column, I first introduce a new approach built upon my research to measuring these nonwage amenities trade-offs and then explain what the findings mean for both economists and policymakers seeking to understand and address persistent income inequality. I close with suggestions for how to foster a more equitable U.S. labor market that reframes how our nation values work, wages, and amenities.
A new approach to measuring job amenities
Economists have long recognized that workers care about more than wages. Surveys consistently show that people value features such as better scheduling options, safety, autonomy, and meaningful work. Yet preferences don’t always translate into prices.
Suppose men prefer coffee in the break room, for example, while women are more likely to want tea. As long as both options are equally costly for employers to provide, even large differences in preferences won’t contribute to the gender pay gap. Though simple, this example illustrates the importance of a broader question: When workers choose jobs with certain amenities, how much do they have to sacrifice in foregone wages?
Prior research has struggled to capture how much workers must trade off when choosing between wages and amenities. Traditional approaches often rely on wage comparisons across workers with different amenities but the same observable characteristics, such as education or experience, to estimate how much certain job features are worth to workers. But these methods assume that once economists control for observable factors, workers have roughly equal access to all jobs.
In reality, the U.S. labor market is segmented such that some jobs are better than others, and factors that are not easily observable such as search frictions or difficult-to-measure skills also influence which job options workers have.
Another common strategy compares workers’ own job changes over time, but this too can be misleading. Workers who move to higher-paying jobs typically also gain better amenities, such as safer conditions, suggesting that simple within-worker comparisons confound amenity choices with career advancement.
To address this gap, I developed a new estimation strategy—what my colleagues have since dubbed the anti-instrument method—that treats observed productivity factors, such as education, not as perfect controls but as shifters of the set of offers available to workers. This method recognizes the vertical segmentation of the labor market, where access to better jobs depends not only on observable characteristics but also on unobserved or structural factors.
By using information on how these observable traits on average increase access to better job options rather than fully explain job choice, this estimator captures the real trade-offs workers face between pay and amenities. This approach reveals clear and consistent estimates of amenity costs, overcoming the biases that have plagued standard methods.
Figure 1 below illustrates how four different estimation approaches compare in practice: simple correlations, the strategy of controlling for observed abilities, the within-worker method, and my anti-instrument approach. We can easily see that using raw correlations or simple controls often leads to implausible conclusions—for example, that safer jobs pay more. Yet this finding contradicts basic economic reasoning that a trade-off should exist between safety and pay.
Even after including controls for observed ability measures, for example, within-worker comparisons can misleadingly suggest that higher-paying jobs come with better amenities. In contrast, the anti-instrument method reveals a more intuitive pattern: Workers must often give up pay to obtain safer conditions, more decision-making autonomy, more meaningful work in nonprofits, and more regular schedules. (See Figure 1.)
Figure 1
These results are striking. They overturn longstanding assumptions about the ability of researchers to detect this hidden structure of job choice. They show that standard approaches overlook the way workers are sorted into different levels of the U.S. labor market, where some jobs come with better pay and amenities and others do not. This hidden hierarchy plays a powerful role in shaping workers’ opportunities and compensation—and as a result also shape income inequality and the gender wage gap. These types of findings using the anti-instrument approach are being echoed by work in many fields, including labor, management, environmental, urban, and macroeconomics.
Amenity trade-offs and the gender pay gap
These findings reframe how researchers think about income inequality and, in particular, the gender pay gap. Figure 2 below illustrates how these patterns relate specifically to gender and stable schedules. At nearly every level of compensation, women are more concentrated in roles with regular schedules, while men are more likely to hold jobs in which the schedule changes with demands of the employer or customer. The data also show that the U.S. labor market requires workers to sacrifice some pay to obtain a job with a more predictable schedule. (See Figure 2.)
Figure 2
Taking into account a wide range of amenities, I find that the costliness of amenities explains a substantial portion of the gender pay gap—up to two-thirds. Yet my findings look different for racial and socioeconomic inequality.
For workers from lower-income backgrounds or Black workers, for example, pay gaps are less about amenity choices and more about access to high-paying jobs in the first place. In these cases, the data show that workers from marginalized groups often face structural barriers to entering better-compensated roles, regardless of the amenities those roles offer.
When I decompose the pay gap by parental background, however, a small but consistent pattern suggests that intergenerational preferences for work characteristics—such as working in a job that conveys a sense of meaning—may contribute to persistent income gradients. This hints at a mechanism where preferences for certain job features passed down through families may help perpetuate class-based inequality, though the effect is quantitatively much smaller than for gender. (See Figure 3.)
Figure 3
This pattern points to a broader issue in how researchers and policymakers alike approach the gender pay gap today. It is more than a matter of women being paid less than men for doing the same work. Rather, the gap increasingly reflects the fact that women are often boxed out of higher-paying roles because those jobs come with different nonwage attributes, such as unpredictable schedules or long hours.
In many cases, the U.S. labor market presents a steep earnings trade-off to access a job with amenities such as predictable schedules, autonomy, and workplace safety. Given the constraints that society also often imposes on women, such as those related to child care or caring for an elderly family member, what deserves more attention is whether workers—and especially women workers—should have to make this kind of trade-off at all.
Moving toward a more equitable U.S. labor market
These findings carry significant implications for both research and policy. A “good” job today is defined by more than just wages—it is also about myriad other factors, such as meaning, predictability, and autonomy. Yet the way the U.S. labor market prices these features often penalizes workers for seeking them. Importantly, these penalties aren’t simply reflections of individual choices but additionally are shaped by structural constraints, including limited access to higher-paying jobs and societal expectations around caregiving and other gender norms.
For policymakers, this means that raising wages alone is unlikely to close the gender wage gap. Instead, policymakers need to rethink how different job attributes are valued and how regulations and standards can reshape the trade-offs workers face. Workplace safety regulations have already shown that public policy can influence amenity trade-offs through standards and enforcement by the U.S. Department of Labor’s Occupational Safety and Health Administration.
Many studies also are exploring how increasing the provision of a wide array of amenities—including predictable schedules and work-from-home arrangements—can potentially reduce the gender pay gap. Expanding protections against unstable schedules or ensuring compensation for predictable hours also could help narrow gender gaps.
At the same time, tackling racial and class-based pay gaps requires a different approach. These gaps are primarily driven by barriers to entry into highly compensated roles. Policy efforts to address these disparities should focus on expanding access to education and training for underrepresented groups, addressing systemic biases in hiring and promotion, and reducing structural obstacles that limit access to lucrative career paths.
My research introduces a new approach—the anti-instrument method—to uncovering the trade-offs workers face between pay and job attributes, such as safety, predictable schedules, and meaningful work. By identifying how these trade-offs shape who holds which jobs and at what cost, the findings reveal a U.S. labor market where essential job features come with a hidden price.
This hidden cost disproportionately affects women and is a major contributor to income inequality by gender. The talents of many workers, including many women who are boxed out of roles where they could contribute the most, will continue to be squandered because of these hidden trade-offs that create barriers to advancement. Policymakers and other stakeholders should act swiftly to rethink and revise the rules of the U.S. labor market and reverse these trends.
Did you find this content informative and engaging? Get updates and stay in tune with U.S. economic inequality and growth!
In 2003, women in the United States earned on average approximately 80 percent as much as U.S. men did per hour. By 2024, the gender pay gap had grown to 84 percent, after peaking at around 86 percent in 2022. (See Figure 1.)
Figure 1
Yet the gender wage gap is not equal across all occupations in the U.S. labor market. Female financial service sales agents, for example, currently make 52.7 percent of their male counterparts’ earnings on average, while women working in media and communications make on average 12.9 percent more than men in their field.
The gender wage gap changes across occupations because men and women have not been equally likely to work in all occupations—though this is less true now than it was 20 years ago because occupations have become more gender-balanced since 2003. Figure 2 below shows the share of all workers who are in occupations with a given percentage of female workers, with the left side of the graphic being more male-dominated jobs and the right side being female-dominated occupations. Each line represents the percentage of workers who are employed in occupations that have up to a given percentage of female workers. (See Figure 2.)
Figure 2
Figure 2 suggests shifts in employment over time: The 2024 line has a lower percentage of employment that is majority male than the 2003 line and a (mostly) higher percentage of employment that is majority female. In 2003, for example, 64.4 percent of workers were employed in occupations that were 0 percent to 50 percent female. These shifts suggest that overall U.S. employment has moved toward more gender-balanced or female-majority occupations since 2003.
Figure 2 also demonstrates that, despite these shifts, many U.S. occupations are still dominated by males. Indeed, in 2024, fewer than half of all U.S. workers were employed in occupations with either equal male-female employment or majority-female employment.
So, why are women more likely to work in some occupations than others? Aside from previously studied factors, such as differences in education and treatment in the workplace, some of the answer may be found in what makes a job “good” for women workers, compared to the broader workforce. As such, examining the gender wage gap across occupations by job content is helpful.
Using O*NET data to study the gender wage gap
Data from the Occupational Information Network, or O*NET, provides insight into which worker tasks and talents are valued in different occupation. O*NET measures the degree of importance and complexity for 128 skills, abilities, and work activities for approximately 970 occupations in the U.S. labor market as of 2024. Looking at these elements can tell us more about how the jobs done by women and men differ and how these differences affect income.
The importance of various abilities, skills, and work activities to the average worker of an occupation are quantified by O*NET on a scale of 1 to 5 and are available for the years 2003 to 2024. By consolidating U.S. Census Bureau data with O*NET metrics, one can see how importance scores differ for men and women and how those differences have changed over time. This gender-importance gap is calculated by averaging the importance value of each O*NET element across occupations, based on employment by gender, then subtracting the women’s scores from the men’s. Positive values indicate that an element is on average more important in men’s jobs, while negative values indicate that an element is more important in women’s jobs.
We find that the skills, abilities, and activities correlated with higher wages for women are different than those for men, and that changes to these differences over time have contributed to the reduction of the hourly wage gender gap. Figure 3 charts the 2024 importance gap against its 2003 equivalent, with each point representing a different O*NET element. (See Figure 3.)
Figure 3
As Figure 3 shows, there is consistent grouping close to the 1:1 line of correspondence—the dotted diagonal line—indicating that few gaps in element importance have changed much over the past 20 years. In fact, of the 128 O*NET elements, only 29 have larger gaps of importance now than they did before, as seen in the darker points on the figure. Most of the elements have 2024 importance scores that are more equitable across gender than 2003 and fall within the shaded areas. For the few points that are both lighter blue and in unshaded areas, the overall importance gap shrunk, but the sign of the importance gap changed. For instance, the gap was negative in 2003 but positive in 2024. On average, reductions in the importance gaps were more profound than increases.
Interestingly, the elements that were once more valued in high-female-employment occupations but are now valued similarly across both high-female and high-male occupations are primarily social skills and administrative tasks, such as “social perceptiveness” and “scheduling.” Conversely, the elements that were most valued by high-male occupations and have now more narrowed importance gaps consist of physical movement or strengths, including “dynamic flexibility” and “explosive strength.”
Differences in gender-importance scores make sense, given the sorting by gender that occurs in certain occupations. In 2024, for example, the most important work activity in high-female occupations was “getting information.” Two occupations that highly value this activity are medical assistants and speech-language pathologists, both of which were 90 percent female in 2024. Conversely, 2 percent of electricians were women in 2024, reducing the average valuation of “installation” skills. This sorting, and how it has shifted since 2003, offers a potential explanation as to why certain types of elements display importance gaps.
Figure 3 illustrates that jobs with different employment ratios value job characteristics differently. Our recent column on how the content of different jobs affects wages demonstrated that job characteristics can in fact impact earnings, but did not touch upon whether the aspects of an occupation that increase men’s wages are the same as those that increase women’s wages. In other words, are workers’ daily tasks—and the skills needed to perform them—valued equally by gender?
How job characteristics affect the gender wage gap
We find that the job characteristics that predict the greatest changes in women’s hourly wages are indeed, at times, different than those characteristics that predict the greatest changes in men’s wages. What’s more, when an element does impact both women’s and men’s wages, the degree of these impacts differ by gender and are not stable over time.
To come to these findings, we performed linear regressions on women’s wages from 2022–2024 on the 128 O*NET elements, with controls for worker demographics and industry. We then repeated the regressions for men’s wages and performed the same regressions by gender for the years 2003–2010. The years 2003 through 2010 contain the same U.S. Census Bureau measurements, which allow for ease of aggregation. The same is true for the 2020s, but we dropped 2020 and 2021 to remove any potential distorting effects of the COVID-19 pandemic.
For visual ease, the results are split by three O*NET domains: abilities, or the permanent talents that can help people do their jobs (seen in Figure 4); skills, or the capabilities people develop that help them learn or do their jobs (seen in Figure 5), and work activities, or sets of similar actions or tasks performed together across different occupations (seen in Figure 6).
Figure 4 below shows that of the 52 abilities measured by O*NET in 2024, 42 of them currently impact wages at a statistically significant level. Sixteen of these abilities—including “extent flexibility,” “memorization,” and “written expression,” among others—influence the wages of both genders, albeit differently. In nearly all of these cases, the importance of these abilities either reward the wages of both genders or penalize both, with the exception of increases in the importance of “dynamic strength,” which positively affects men’s wages, while women’s. In addition to these common abilities, women have 14 unique elements, while men have 13. (See Figure 4.)
Figure 4
Figure 5 below illustrates how different skills affect wages differently for men and women and how those gaps have changed since 2003. There are 35 skills in the O*NET database. Twenty-eight of these skills predicted women’s and men’s wages in 2024, 10 of which men and women have in common, including “equipment selection,” “operations monitoring,” and “programming.” Only two skills—“social perceptiveness” and “active learning”—affected men’s and women’s wages differently. (See Figure 5.)
Figure 5
Figure 6 below represents the effect of work activities on wages. Of the 41 O*NET work activities, 33 are statistically significant factors that affect women’s and men’s wages. Less than half these work activities are shared between genders, however, and only one—“handling and moving objects”—currently affects each gender’s wages differently. See Figure 6.)
Figure 6
One key takeaway from Figures 4 through 6 is that the O*NET elements influencing women’s wages tend to have a greater impact than those influencing men’s wages. Across abilities, work activities, and skills, the range of effects is higher for women than men. On average, as the importance of job characteristics increase, women’s wages both rise and fall more than men’s wages.
Additionally, the way these elements have changed over time is similar, in the sense that there is a different set of important abilities, skills, or work activities that are relevant to women’s and men’s wages in 2003–2010 versus 2022–2024, though there is some overlap. Furthermore, the early lists consist of fewer elements that impact wages, and these elements are much less likely to overlap by gender.
The effect of job characteristics on the gender wage gap over time
The nature of men’s and women’s work, how they perform it, and its impact on wages have all changed since 2003. But to what extent do these differences contribute to the gender wage gap, and how has this relationship changed?
Figure 7 below presents the results of a Blinder-Oaxaca decomposition, which breaks down the wage gap into three components—differences in the prevalence of certain job characteristics by gender, differences in the returns to those characteristics, and the interaction between the two—for the periods 2003–2010 and 2022–2024. (For visual simplification, the effects of abilities and skills are combined.) The results show the impact of worker talents and tasks, as well as other demographic and industry factors. (See Figure 7.)
Figure 7
The data suggest that for both periods of time, the gender wage gap is largely driven by differences in returns to job characteristics, rather than by differences in the prevalence of those characteristics in certain occupations. In 2024, work activities and other factors contribute to the wage gap less than they did before. Conversely, worker talents (abilities and skills) now contribute to, instead of mitigate, the gender wage gap. The findings reveal that differing returns to job characteristics have been and continue to be a nontrivial component to gender wage disparities.
Conclusion
Gender employment ratios, job characteristics, and how they can predict disparities between women’s and men’s earnings have all fluctuated over time. Job characteristics meaningfully influence differences in wages across occupations but also are a key component in shedding light on differences in wages across gender. Incorporating these findings into established explanations might offer more clarity into shifts in the U.S. labor market and how those, in turn, may account for the gender wage gap in the 21st century.
Did you find this content informative and engaging? Get updates and stay in tune with U.S. economic inequality and growth!
This article was drafted with assistance from Perplexity AI.
The Washington Center for Equitable Growth in mid-May hosted an event on “The rise of populism and the future of economic policy,” in Washington, DC. The event featured speakers from the policymaking and advocacy communities, as well as from academia, who have studied the connections between populism and policy both in the United States and abroad. In particular, they discussed what is causing the recent surge in support for right-wing populism and the ways in which policymakers can enact economic and social policies to counter the rise of this anti-democratic movement.
The event opened with a welcome from Equitable Growth Vice President of Impact and Special Initiatives Melissa Grober-Morrow, who highlighted the launch of a new essay series exploring the causes of rising right-wing populism and offering policy solutions to strengthen democracy. Then, Equitable Growth President and CEO Shayna Strom emphasized that dissatisfaction with politics and economic conditions is growing in the United States and other advanced democracies, noting how economic policies in recent decades have often led to rising inequality, stagnant growth, higher costs of living, and declining job quality. This, she continued, has fueled support for right-wing populist parties and politicians, particularly those with authoritarian leanings.
The audience then heard from former U.S. Sen. Sherrod Brown (D-OH), who delivered a keynote address on the dignity of work. Sen. Brown argued that true populism is about lifting up all people, not dividing them, and that economic policy must put workers at the center of policymaking. He described how the U.S. economy has increasingly failed to reward work, especially for those without college degrees, with stagnating wages and rising cost of living prevalent across the country.
Sen. Brown traced much of the current discontent to trade agreements such as North American Free Trade Agreement in the late 20th century and the normalization of trade relations with China at the turn of the 21st century. He recounted how these policies led to job losses, the decline of working-class communities, and a sense of betrayal—especially among workers who felt abandoned by both political parties. He also critiqued decades of economic policy that prioritized financial markets and corporations over workers, leading to diminished job quality, weakened labor protections, and eroded trust in government.
The remarks set the tone for a day of evidence-based discussion on the intersection of economic policy and democracy, which continued with the second keynote address, from Sara Nelson, the international president of the Association of Flight Attendants-CWA. She began by recounting her own journey from aspiring teacher to flight attendant, highlighting how economic pressures and the promise of union-negotiated benefits shaped her career path.
Nelson then traced the decline of union membership in the airline industry and across the U.S. workforce, linking it to policy changes such as deregulation, the weakening of labor protections, and high-profile anti-union actions. She showed how these trends have coincided with rising income inequality and the erosion of hard-won labor standards, including the eight-hour workday and weekends reserved for rest and leisure. She emphasized that the decline in union density has not only reduced workers’ economic security but also undermined their agency and voice in the workplace, contributing to a broader sense of disempowerment and division.
Following Nelson’s remarks, she was joined onstage by Columbia University’s Alexander Hertel-Fernandez and Yale University’s Jacob Hacker. The three of them discussed how anti-union strategies—summed up as the “four Ds,” or divide, delay, distract, and demoralize—have weakened worker power. They noted that tactics such as stoking racism, sexism, and political divisions have been used to pit workers against each other and undermine collective action.
The conversation then touched upon the failures of recent economic policies, which have prioritized corporate profits and tax cuts for the wealthy over workers’ well-being. The panel critiqued the narrative that “workers vote against their own interests,” pointing out that policy choices—not individual voting behavior—are responsible for declining economic security. The group discussed how people’s faith in democracy is eroded when they experience government as unresponsive or captured by special interests, and called for straightforward, bold policies—such as jobs with living wages, universal health care, and accessible education—that tangibly improve people’s lives and restore belief in collective action.
The event then turned to the first of two panels, moderated by Jia Lynn Yang of The New York Times and featuring scholars Jonathan Cohen of the American Academy of Arts and Sciences, Suzanne Mettler of Cornell University, and Paul Pierson of the University of California, Berkeley. The panelists identified the global surge in populism as a response to profound economic and social transformations, including the shift to a knowledge-based economy and the decline of traditional industries, particularly in rural America.
The discussion highlighted how the unique structure of U.S. political institutions amplifies the influence of right-wing populism. The rural bias in the U.S. Senate and Electoral College, coupled with the two-party system, for example, enables minority political movements to wield outsized power. This institutional landscape, combined with the growing concentration of political donations among a small elite, has increased political inequality and diminished responsiveness to the demands and expectations of the broader public.
Panelists then raised how traditional economic indicators such as Gross Domestic Product, the unemployment rate, and financial market performance indexes often fail to capture the lived experiences of many Americans, emphasizing the need for alternative measures that more accurately reflect economic security, opportunity, health, and political voice. Understanding both objective economic conditions and subjective perceptions, they argued, is crucial for designing policies that address the underlying causes of disaffection and support a more inclusive democracy.
In the second panel, moderator Jerusalem Demsas of The Atlantic led a discussion with Tim Bartik at the W.E. Upjohn Institute, Adam Dean of George Washington University, Chirag Mehta at Community Change, and Jamila Michener of Cornell University, exploring actionable strategies to address the challenges posed by rising populism and economic insecurity. Bartik emphasized the potential of place-based policies—targeted investments tailored to the unique strengths and challenges of specific communities—to revitalize distressed local economies.
Michener expanded on the challenges of delivering federal programs at the state and local levels. She noted that the effectiveness of policies such as Medicaid or rent relief often varies dramatically by location, leading to uneven experiences and deepening the disconnect between people and government. She and the other panelists emphasized that this disconnect is at the heart of rising populism: When individuals feel government is not responsive to their needs, trust erodes and political discontent grows.
This event reinforced Equitable Growth’s commitment to highlighting academic research as a foundation for effective policymaking and its commitment to connect academia and policymakers as they delve into some of the biggest challenges facing the United States in the 21st century.
Did you find this content informative and engaging? Get updates and stay in tune with U.S. economic inequality and growth!
Picture this scene: After sharing a meal with friends, someone in the group grabs the check and says, “I’ll take this so I can expense it through my company.” It seems like a win-win. The business owner “writes off” the expense to save on the firm’s taxes, and the rest of the group gets a free meal.
Yet this isn’t a victimless crime. In fact, according to my recent study using detailed data from Portugal, personal consumption disguised as tax-deductible business expenses carries a loss in government revenues equivalent to at least 1 percent of Gross Domestic Product. To put that in perspective, this tax gap (the difference between taxes owed and taxes paid) is larger than the estimated losses from individual cross-border tax evasion, which range from 0.22 to 0.62 percent of GDP for Portugal (and are not above 1 percent for any European country).
The study, released today in Equitable Growth’s Working Paper series, focuses on the personal consumption expenditures of individuals who move from being employees of firms to owning or operating those firms or their own businesses. I find that people who become high-level business managers or entrepreneurs report up to a 36 percent drop in personal consumption in the months following the switch. I also find that the consumption of the spouses of these owners and operators also falls by 12 percent, despite their sources of income not changing. (See Figure 1.)
Figure 1
What drives the drop in business owners’ consumption?
This drop in consumption could be due to a number of things. It might be that entrepreneurs have significantly lower income than salaried employees. Or perhaps the investment needed to start their businesses lead to a permanent reduction in consumption. But another hypothesis is that part of their personal consumption is now being recorded as business expenses.
To distinguish between these explanations, I check whether the effect is driven by a drop in income that coincides with the transition to business owner or manager. The data show that reported income for new entrepreneurs falls by 3.7 percent in the first year but then recovers. This change seems too small to explain a drop of more than 30 percent in reported personal consumption.
Next, I determine what kinds of expenses new business owners cut back on to see if that helps explain the drop in consumption. I find substantial drops in reported spending at supermarkets and car repair garages—a nearly 50 percent reduction. Reported spending at hotels and restaurants also falls by about 30 percent, as does spending on professional services, such as lawyers and accountants, and communication technologies including internet and mobile-phone services.
In all of these categories, I also find a decline, albeit smaller, in reported spending by the spouses of business owners. Importantly, these expense categories fall into the gray area between personal consumption and what could plausibly be considered legitimate business expenses for tax purposes.
It therefore could be that new business owners are simply tightening their belts to spend less and put all their savings into their new business. If that were the case, then we should see a similar reduction in spending across other categories that are harder to justify as business expenses, including nonessential health care, private education, or basic utilities, such as water, electricity, and gas. Yet the data do not show such a drop in this spending around the time individuals switch from being employees to owning or managing their businesses.
As such, it is likely that these business owners are not reducing their actual consumption at all, but instead are consuming through their firms when they can get away with it.
Perhaps the most compelling evidence of this is how company spending on hotels and restaurants changes during the month of the business owner’s birthday, compared to the birthday month of a randomly selected employee. The results are striking: Spending on hotels and restaurants is 10 percent higher in the month of the business owner’s birthday, while there is no change at all during the birthday months of other employees at the same company. (See Figure 2.)
Figure 2
It seems likely, then, that business owners are mischaracterizing birthday celebration expenditures—clearly a personal expense—as a tax-deductible business expense.
Implications for tax revenue and income inequality
In Portugal, when business owners report personal expenses as business expenses, they are simultaneously evading multiple taxes. They avoid paying personal income tax on the distribution of business income, inflate business costs to reduce reported profits, and lower the company’s tax liability. They also evade the Value Added Tax—akin to a sales tax on all personal consumption of goods and services within the country, ranging from 6 percent to 23 percent—by claiming business expenses as a tax credit to offset the VAT charged by the company on its sales.
The percentage of tax savings from this evasion depends on the tax rates. Specifically, I estimate that the tax savings amount to about 45 percent under the Portuguese tax system. For every euro of personal consumption reported as a business expense, the owners would have to pay themselves 1.80 euros in salary to achieve the same level of consumption while complying with the law.
The general perception has been that this behavior, although common, likely has little impact on public finances at the aggregate level. Yet my paper shows that the fiscal cost can be quite significant. I estimate that it results in a revenue loss of at least 1 percent of Portugal’s GDP.
Furthermore, my analysis demonstrates that this behavior is not limited to the low- and middle-income owners of mom-and-pop stores, but is prevalent among owners and operators of highly profitable businesses at the top of the income distribution, too. I estimate that if this behavior were detected and personal expenses correctly reported, income inequality in Portugal (as measured by the Gini coefficient) would increase by 1 percentage point, while the income share of the top 0.1 percent of the income distribution would increase by nearly 10 percent. (See Figure 3.)
Figure 3
Implications for U.S. tax policy
The detailed, individual-level consumption data my study uses comes from a VAT compliance policy introduced in Portugal in 2013. Though the United States does not have a comparable policy in place, I believe the findings would hold if a similar hypothesis were tested here.
Like Portugal, the United States has a large number of closely held businesses, sometimes called pass-through firms because of the way these firms’ tax liability is “passed through” to owners’ personal income tax returns. As in Portugal (and other countries), the owners of these U.S. firms have a strong tax incentive to use the firm to pay for personal expenses, and, in fact, the standard for tax-deductible expenses in the United States—what the Internal Revenue Code describes as “ordinary and necessary”—is both broad and ill-defined, opening the door to either intentional or unintentional mischaracterization.
There are some bright-line limits, though. Since business meals are known to be borderline cases, for example, the IRS allows a $0.50 deduction for every $1 spent. Additionally, the 2017 Tax Cuts and Jobs Act repealed the business entertainment deduction, which had previously allowed a tax deduction for the expense of entertaining business associates at bars, country clubs, and sporting events, among other locales. Yet the 2017 bill moved in the other direction on the depreciation deduction for use of a passenger-vehicle for business, significantly increasing the cap on this notoriously hard-to-enforce deduction.
Business owners are supposed to keep records to substantiate any deductions claimed, but there is very little third-party reporting and audit rates are low. As such, many experts suspect that mischaracterization of pass-through business expenses substantially contributes to the U.S. tax gap. The nonpartisan congressional investigative arm of the U.S. Congress, the Government Accountability Office, finds that 76 percent of sole proprietors—those who own and operate their own businesses, which are treated as pass-throughs in the United States—misreported their total business expenses to the tune of $92 billion on average per year between 2013 and 2015. The most likely expenses to be misreported were car and truck expenses, utilities, travel, and business use of home.
If true, and if, as in Portugal, mischaracterization is more prevalent among high-income U.S. business owners, then already-high measures of U.S. inequality are likely to have been significantly understated—and thus the link between inequality and the problems partially caused by it (namely democratic erosion and slow economic growth) likely are also understated.
Overall, my study indicates that policymakers in Portugal and across the globe should be redoubling efforts to better define and enforce the tax laws that govern appropriate deducting of business expenses.
—David Leite is an applied economist focusing on public finance. He recently completed his Ph.D. in economics at the Paris School of Economics and will start a postdoctoral fellowship at the National Bureau of Economic Research in September 2025.
Did you find this content informative and engaging? Get updates and stay in tune with U.S. economic inequality and growth!

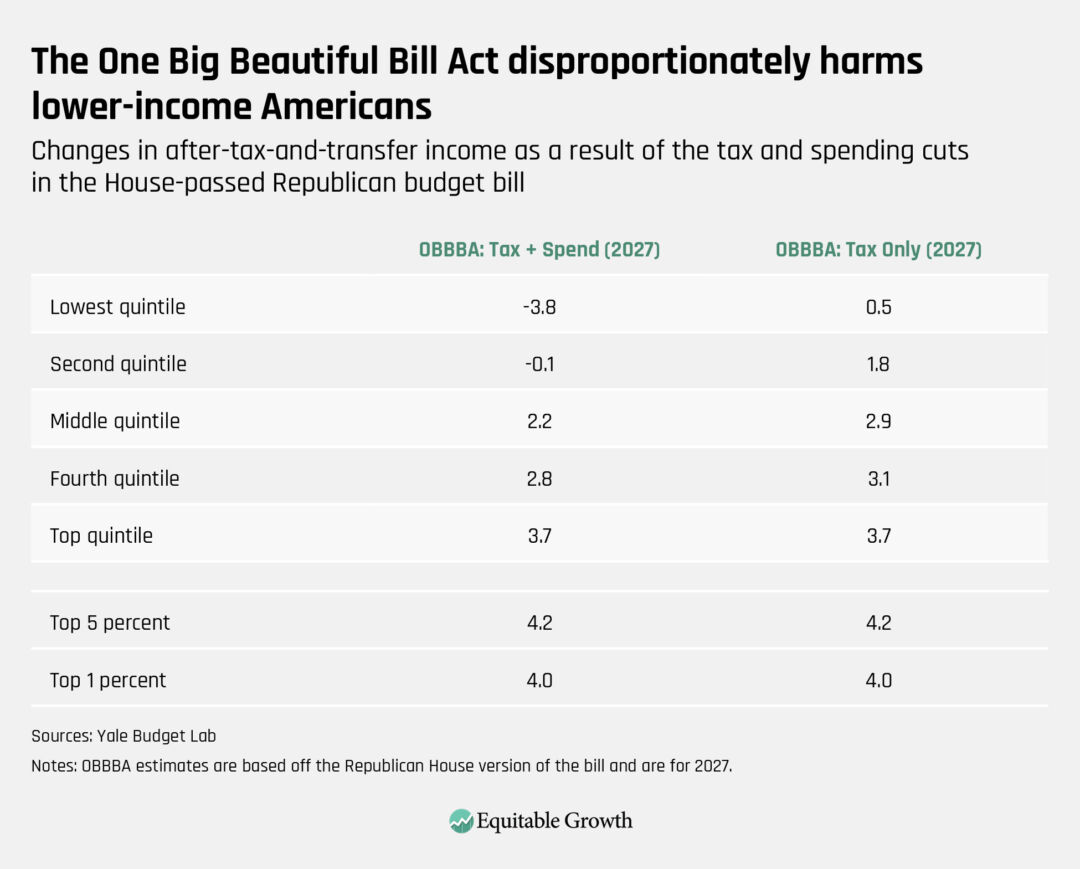
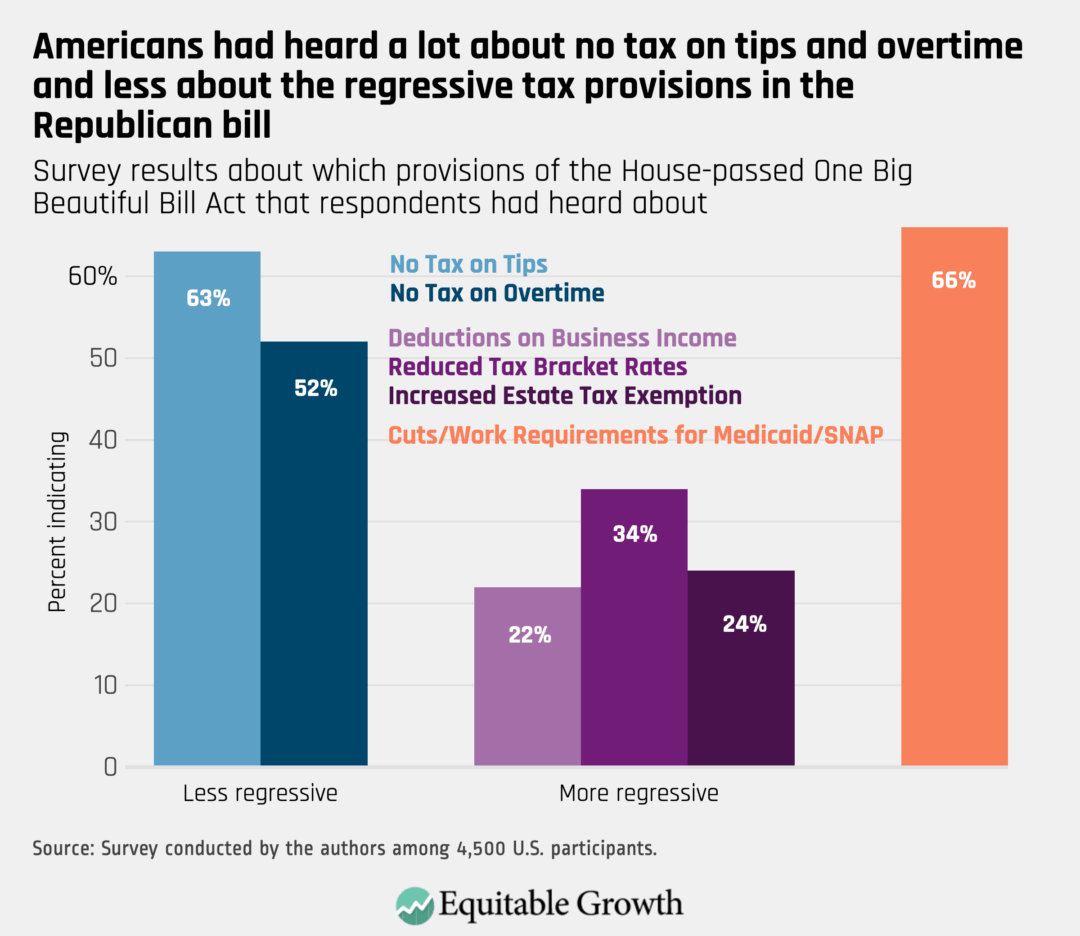
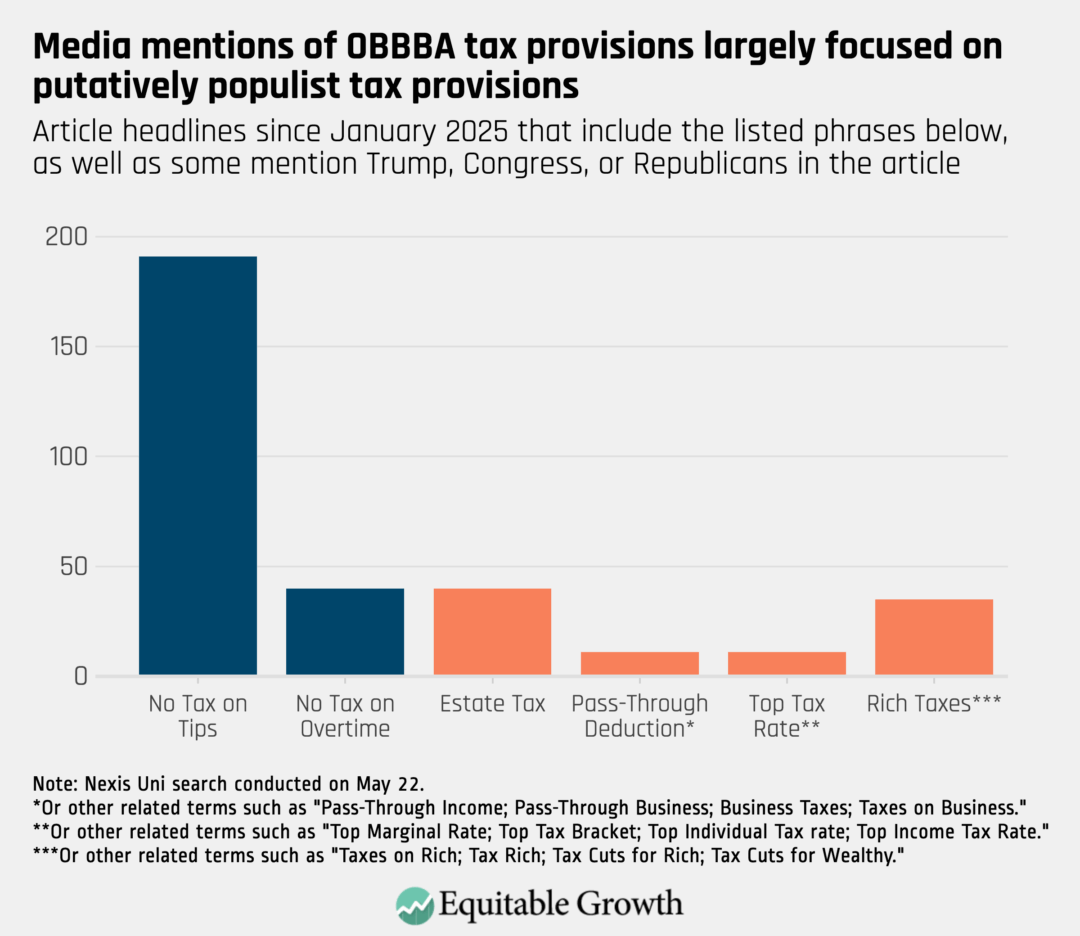
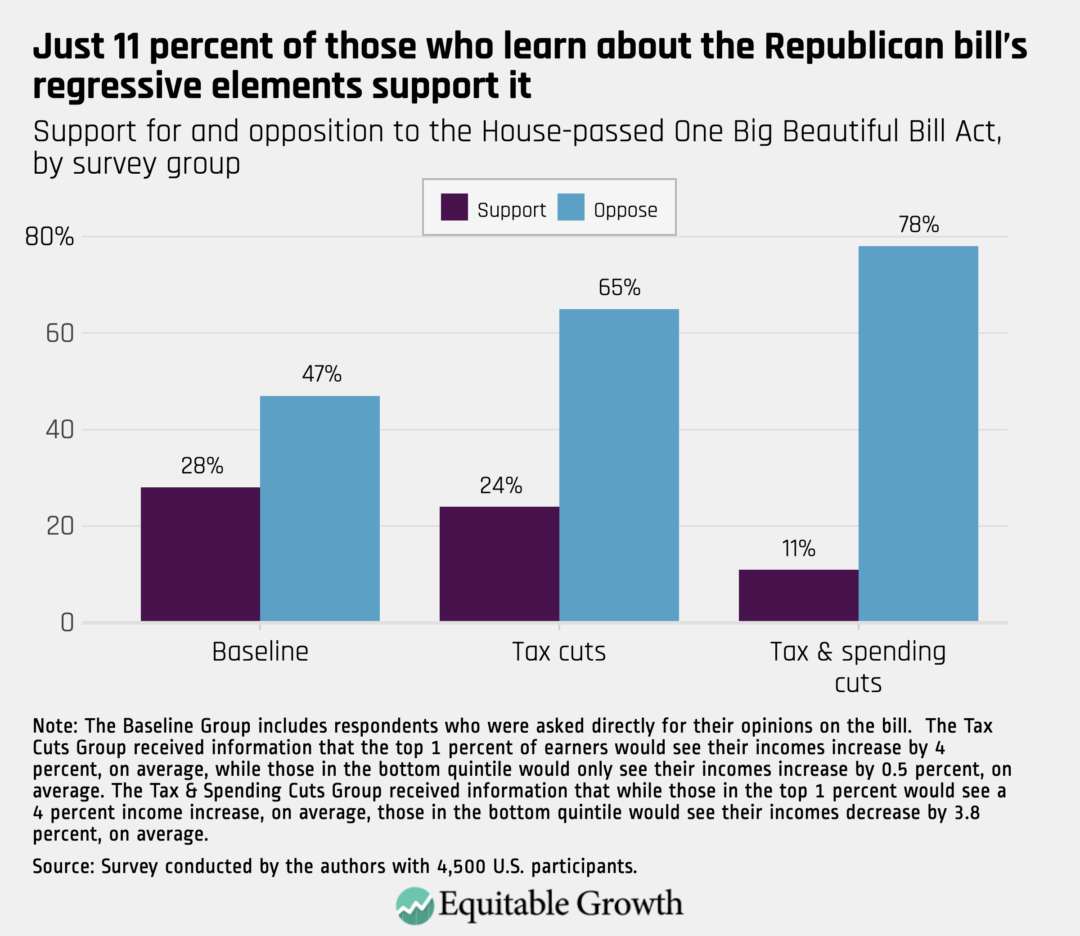
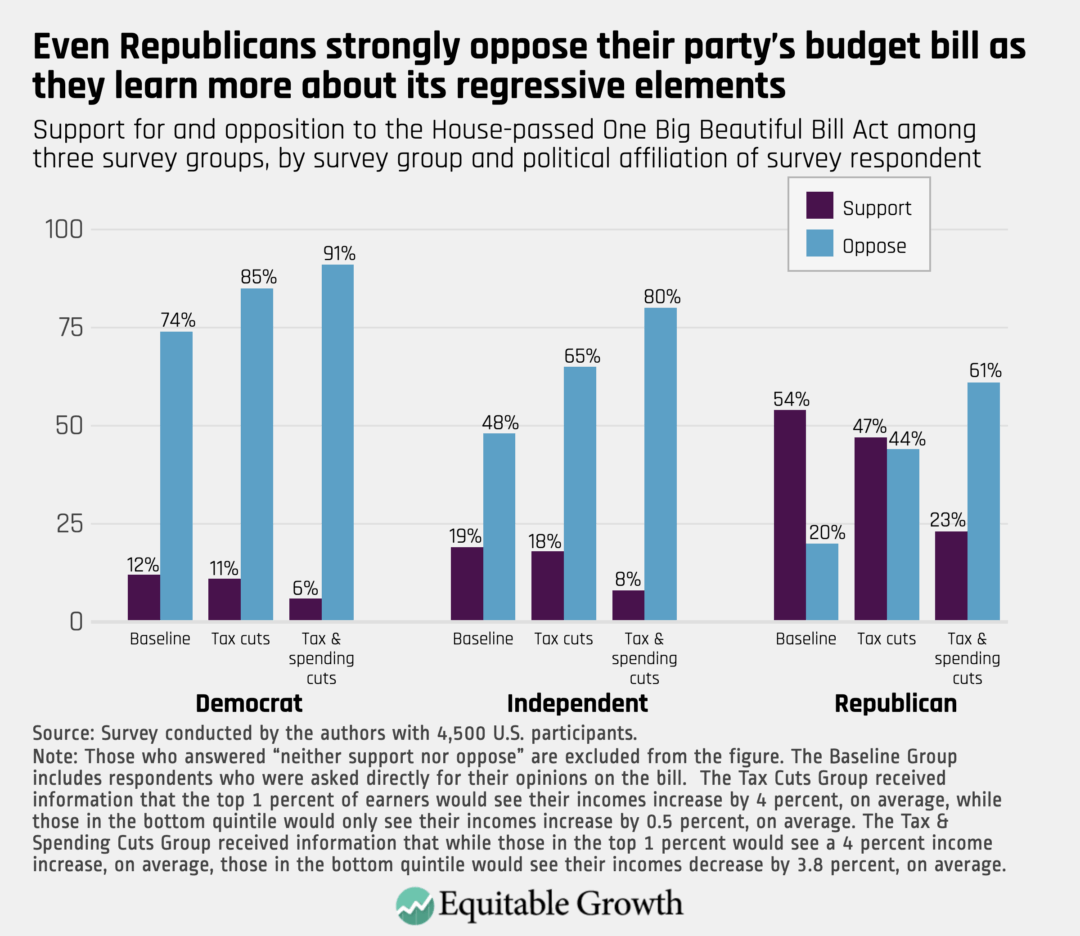
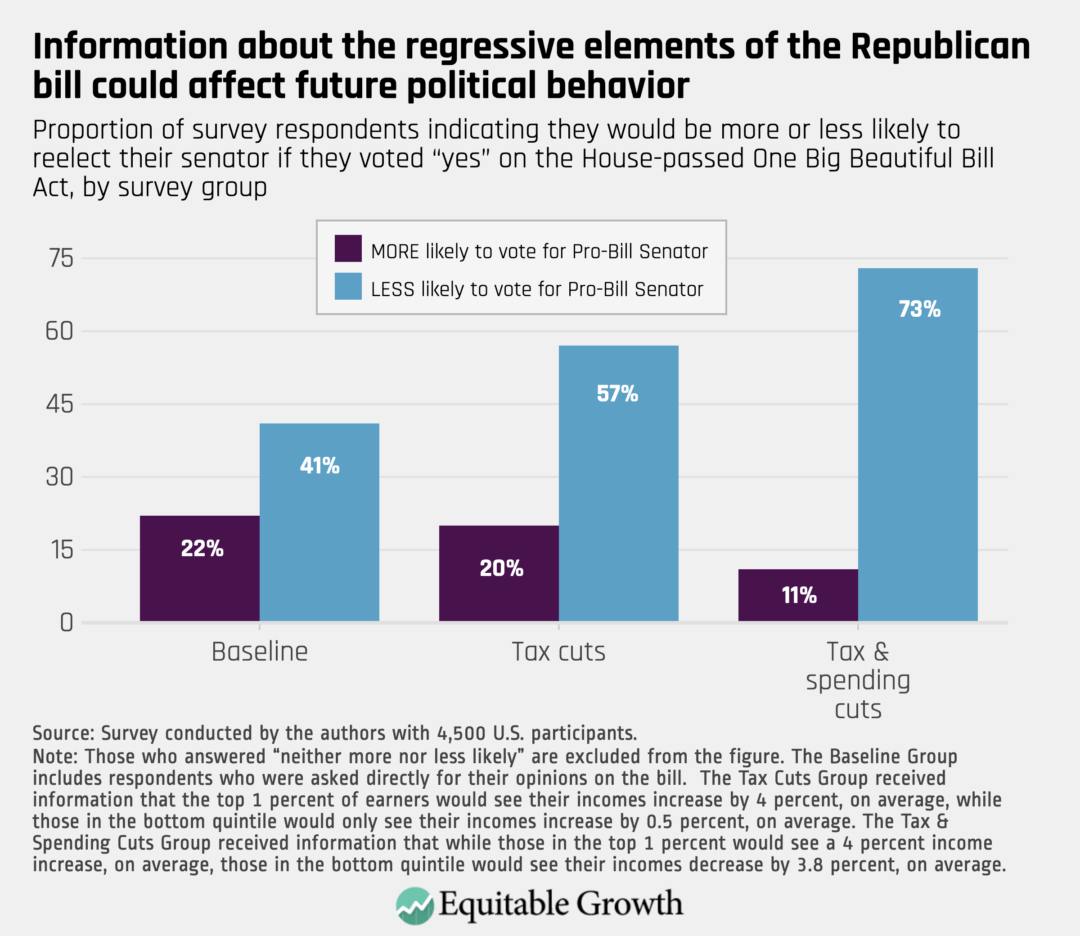
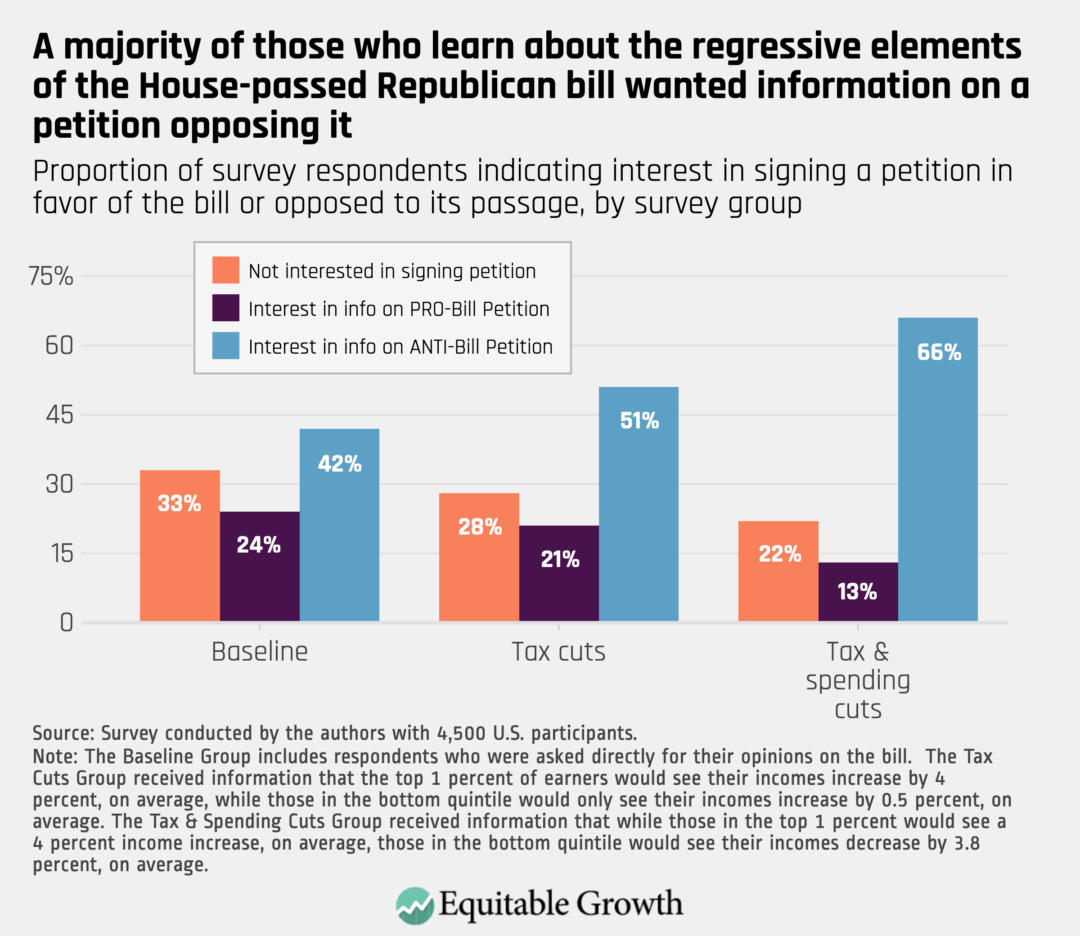
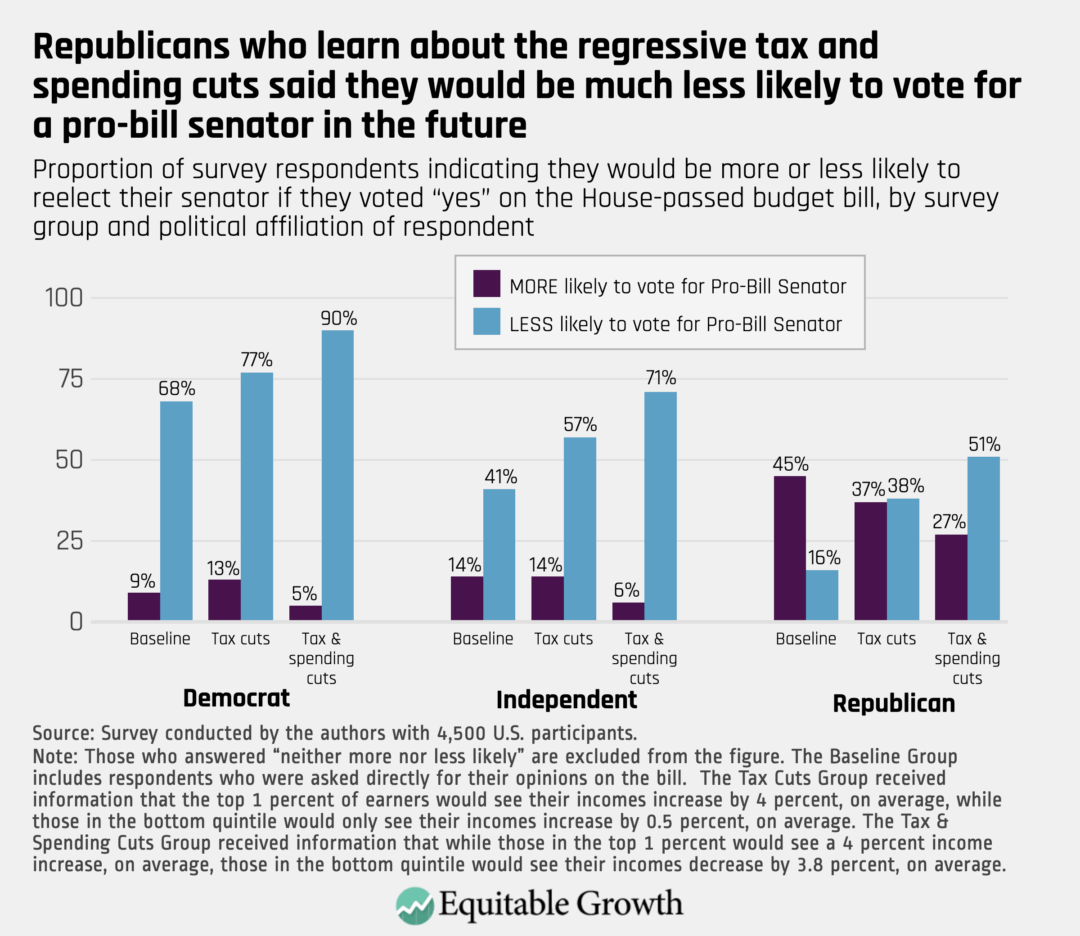

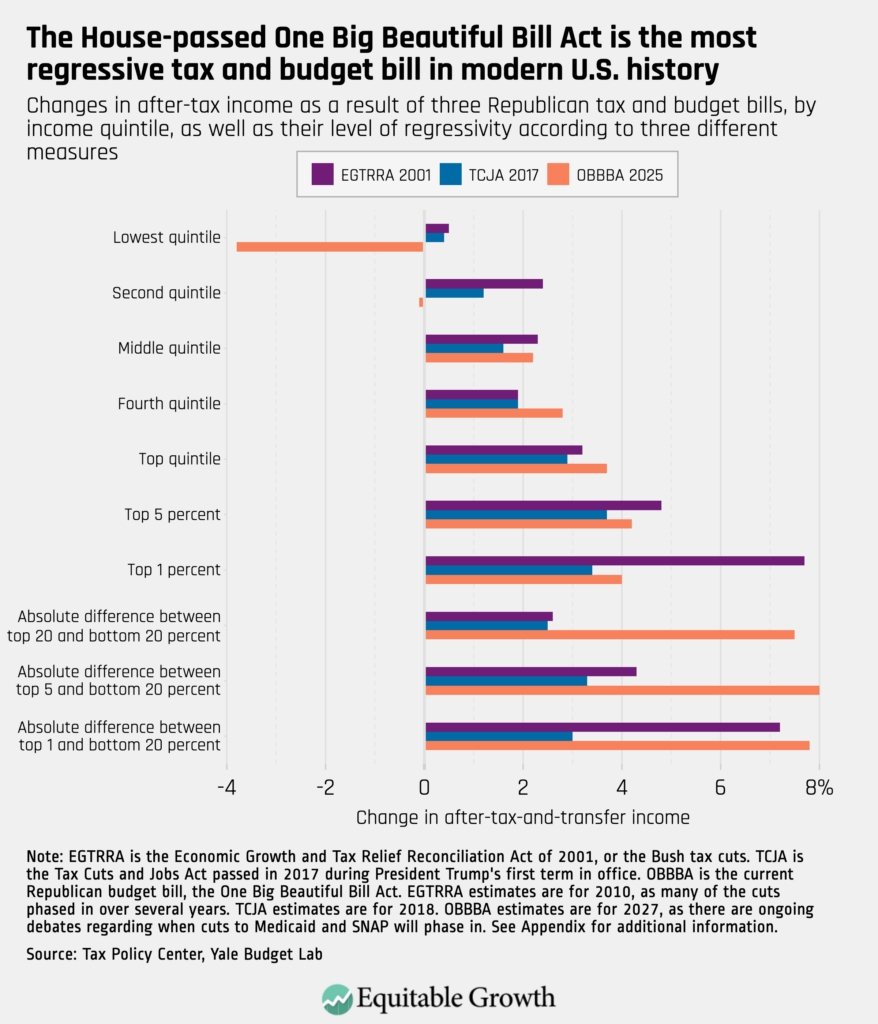
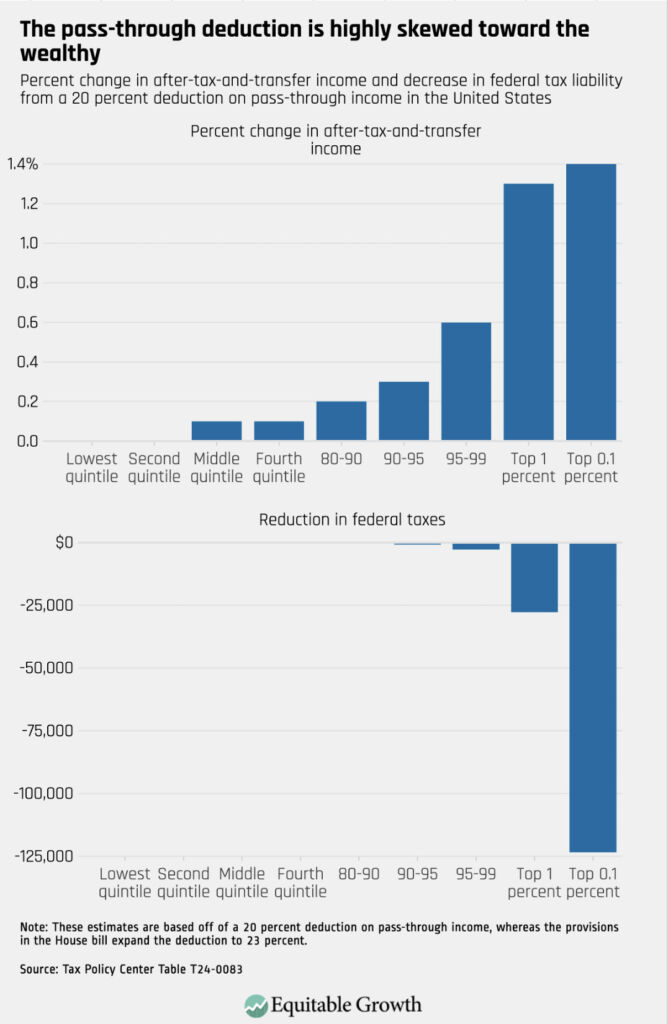
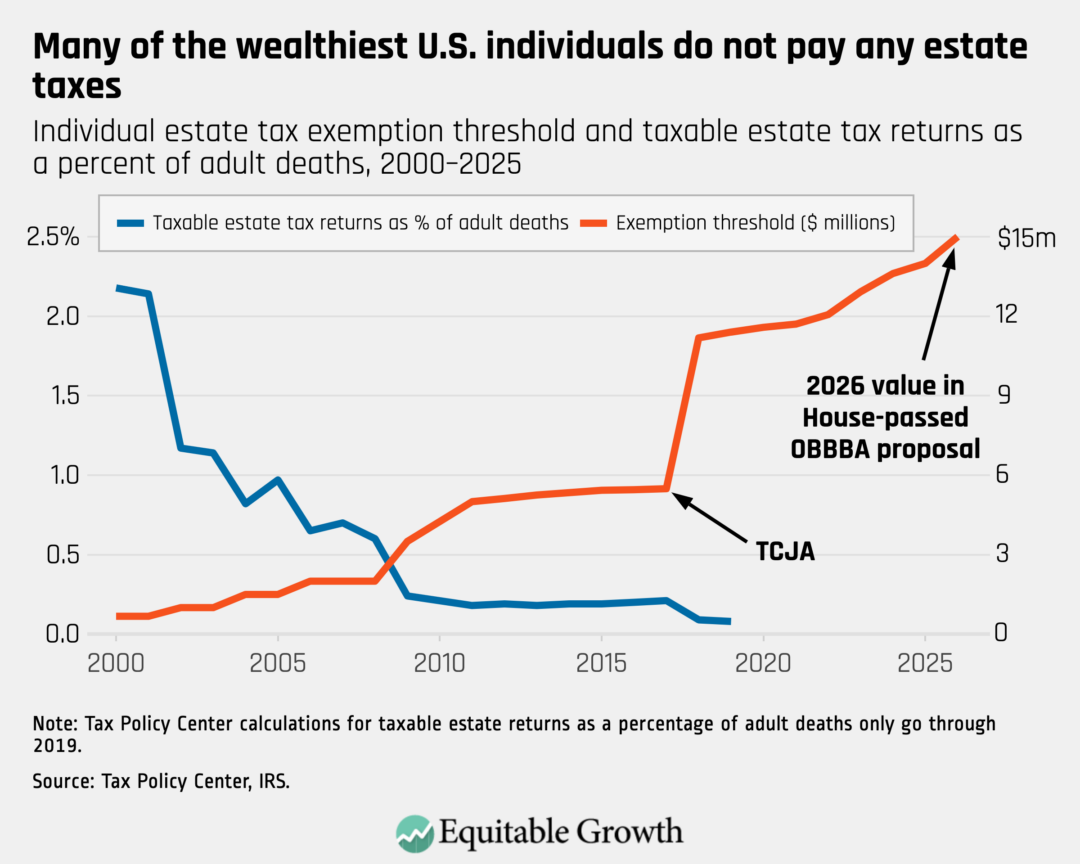
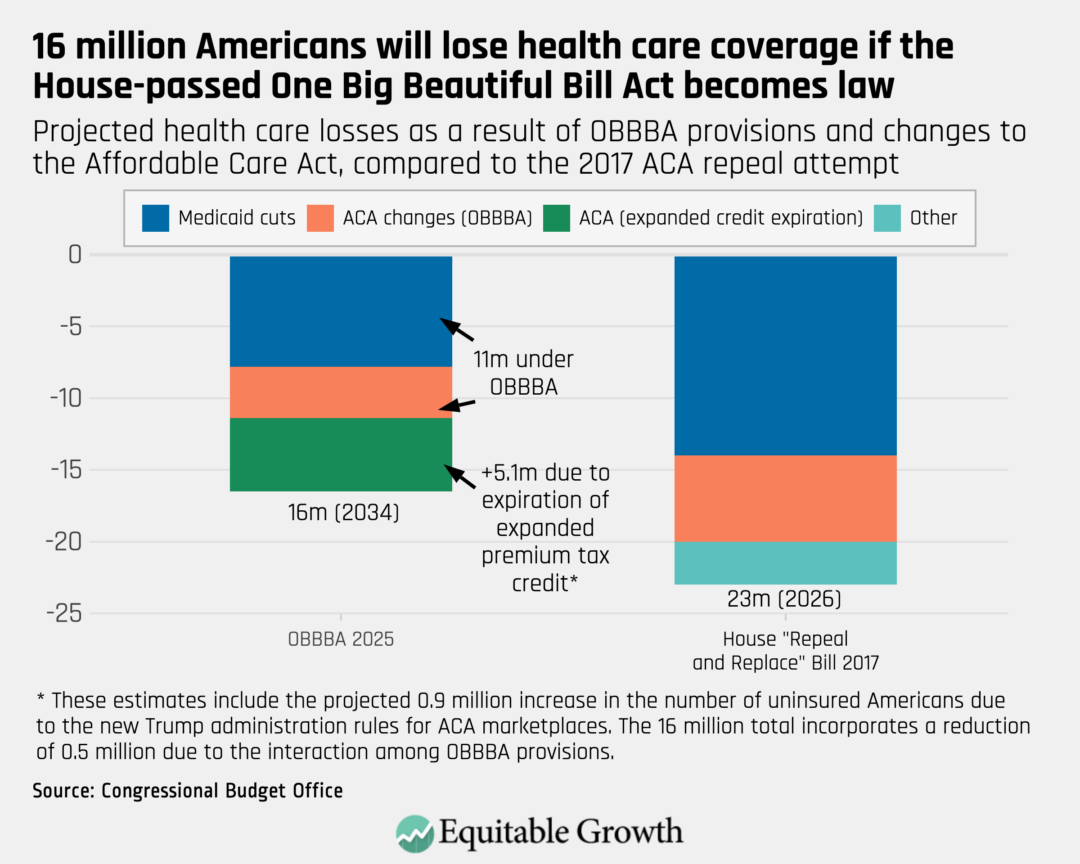
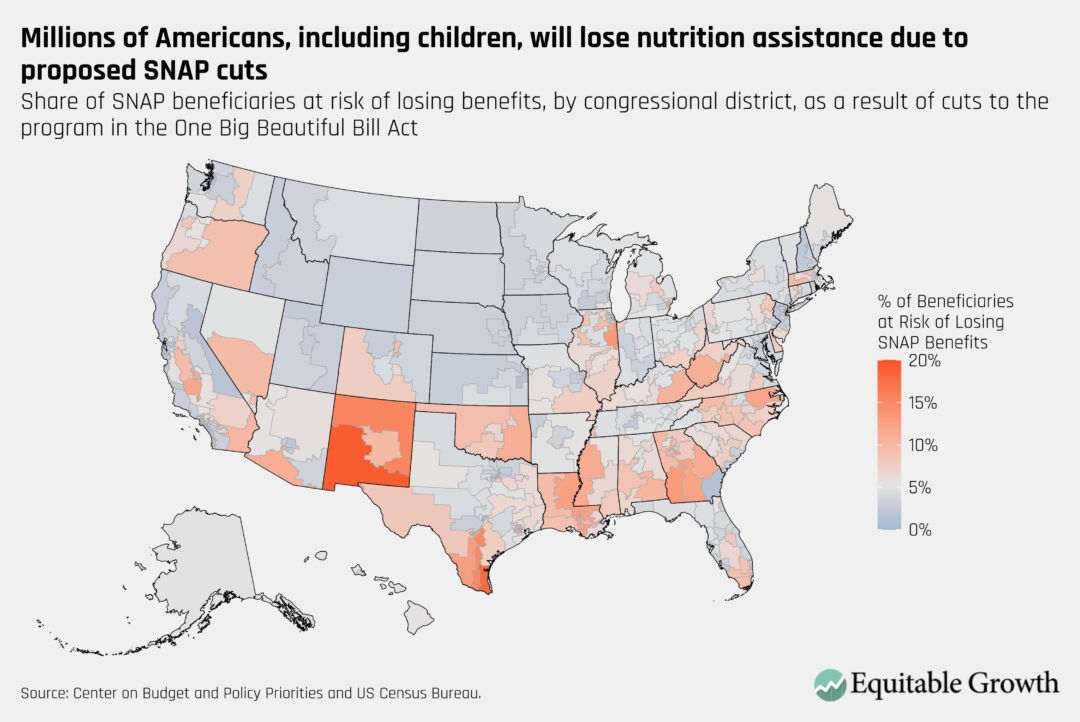
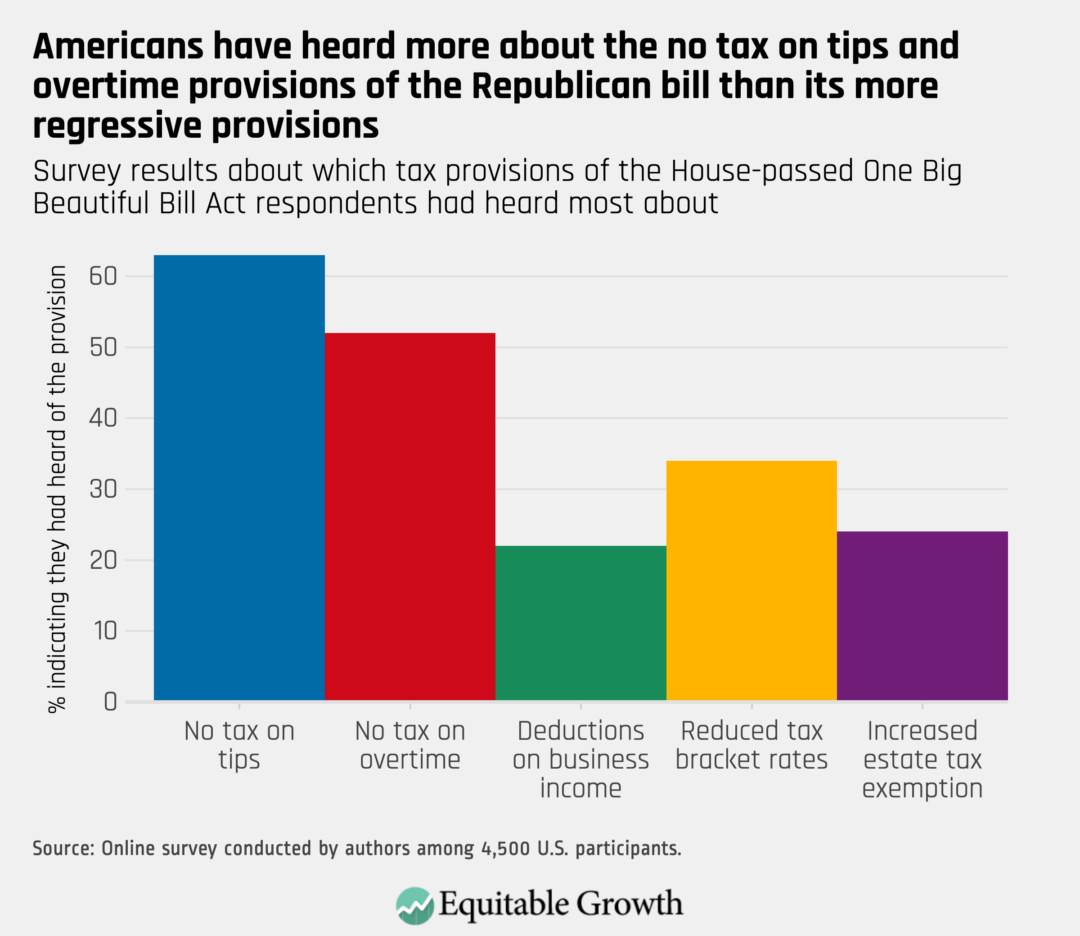
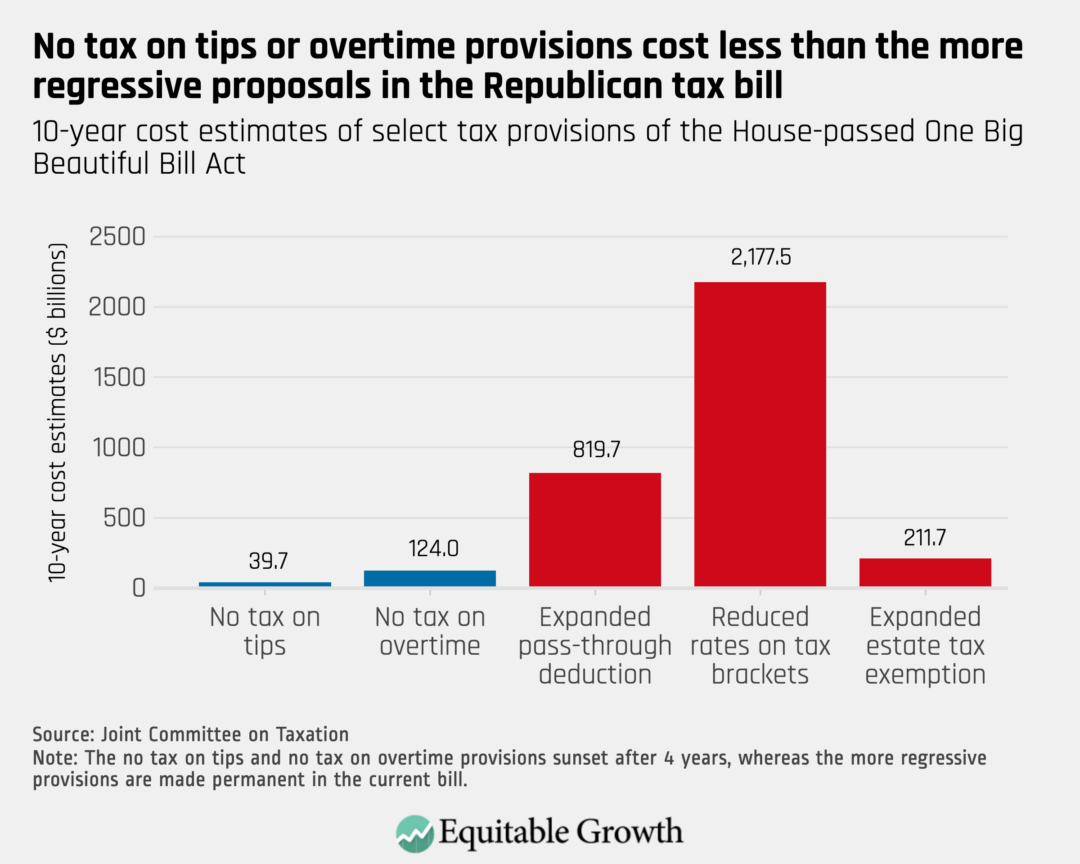
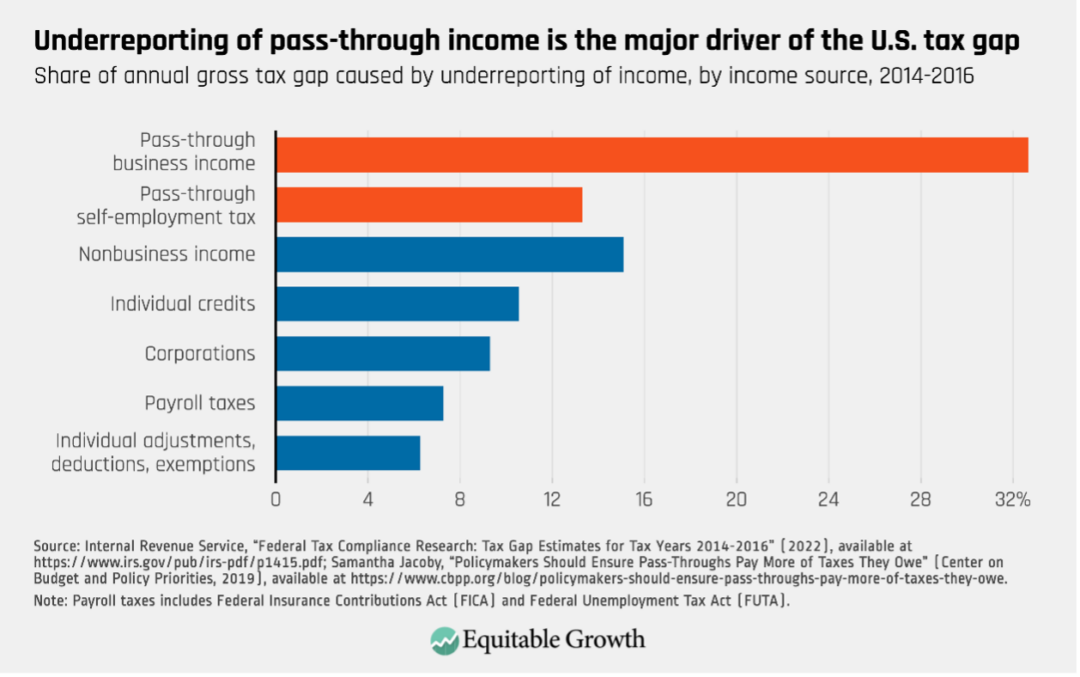
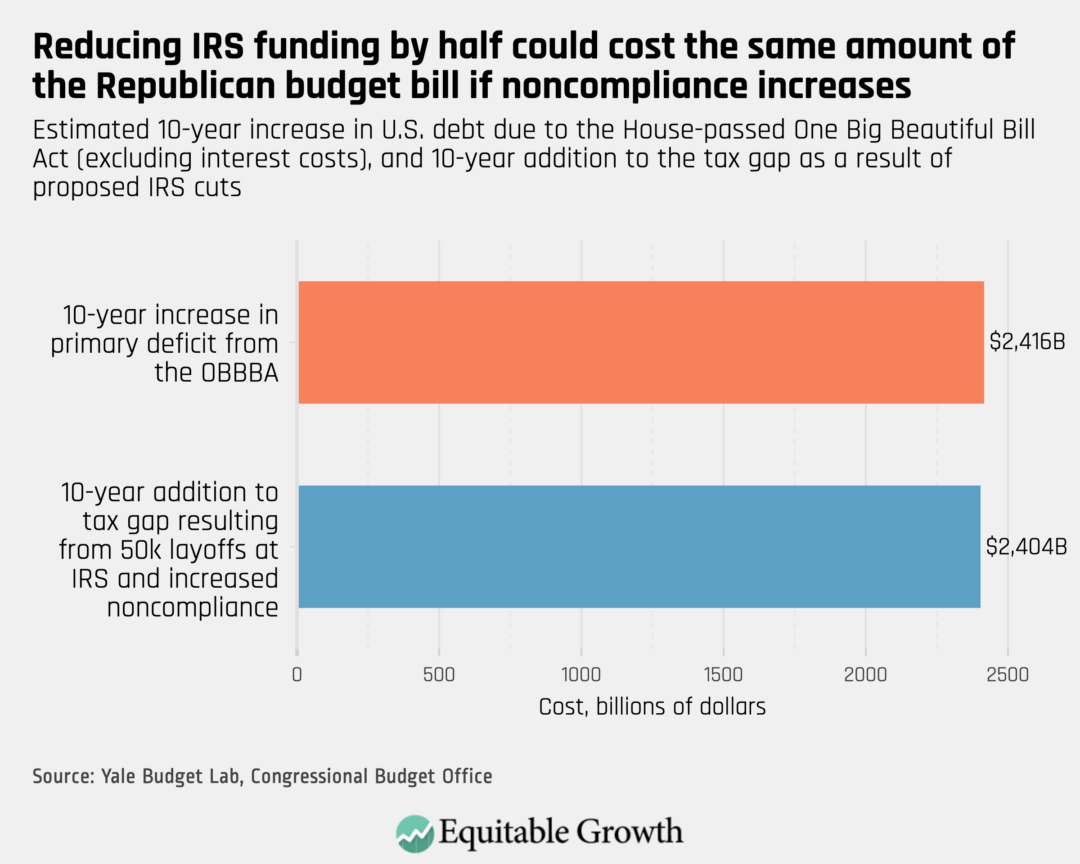

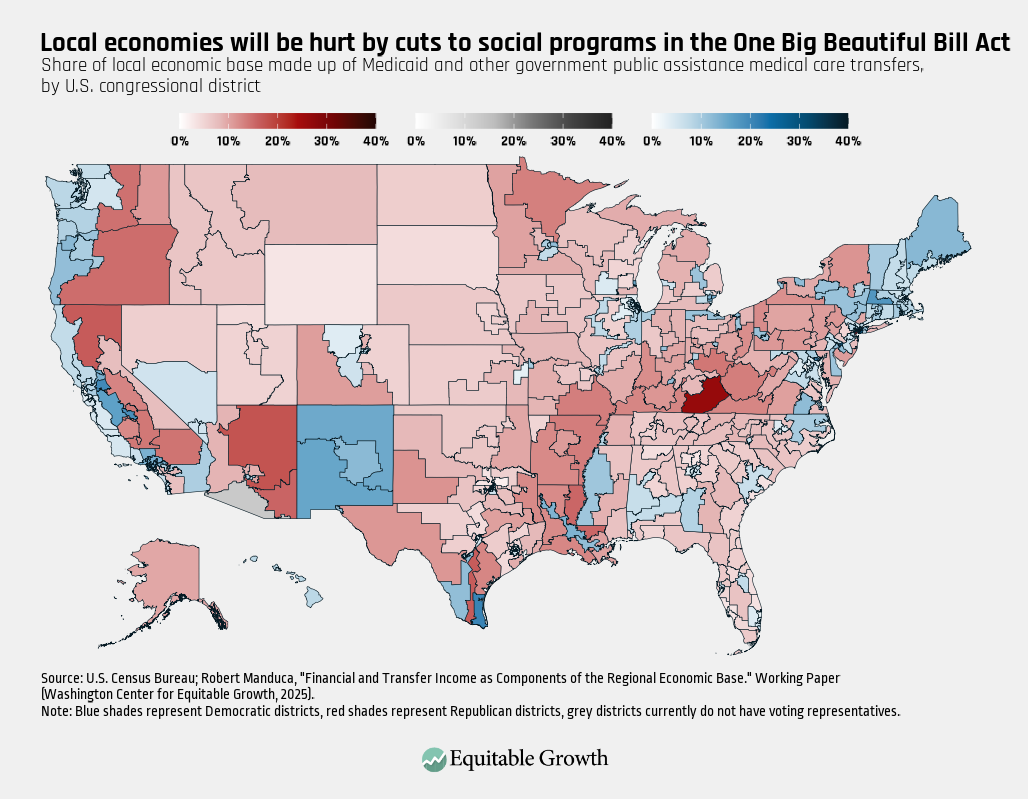


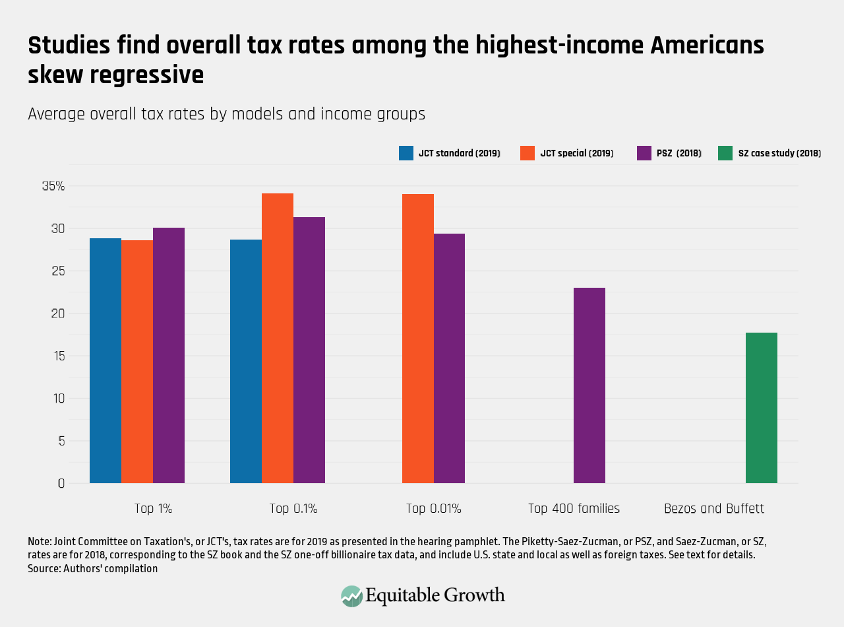
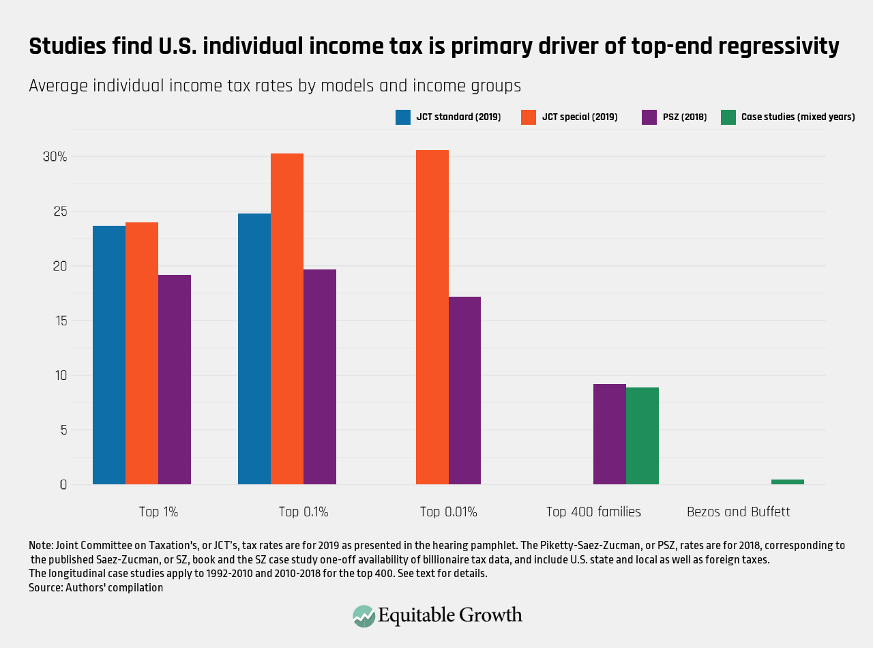

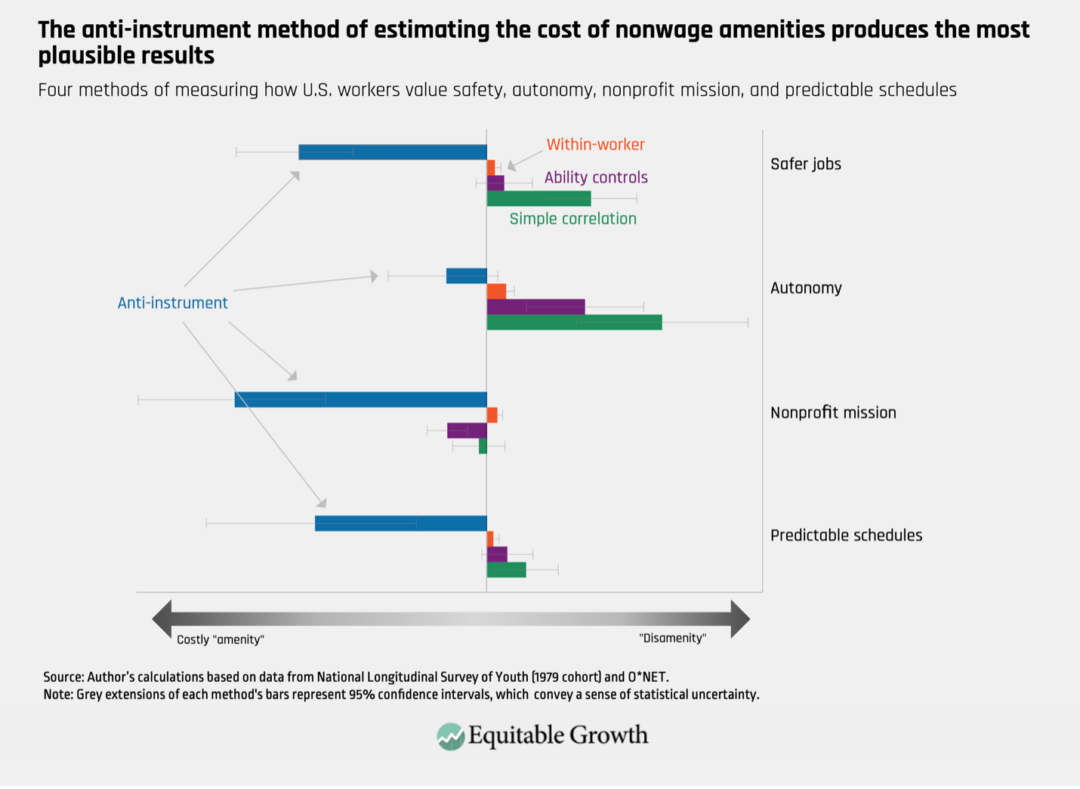
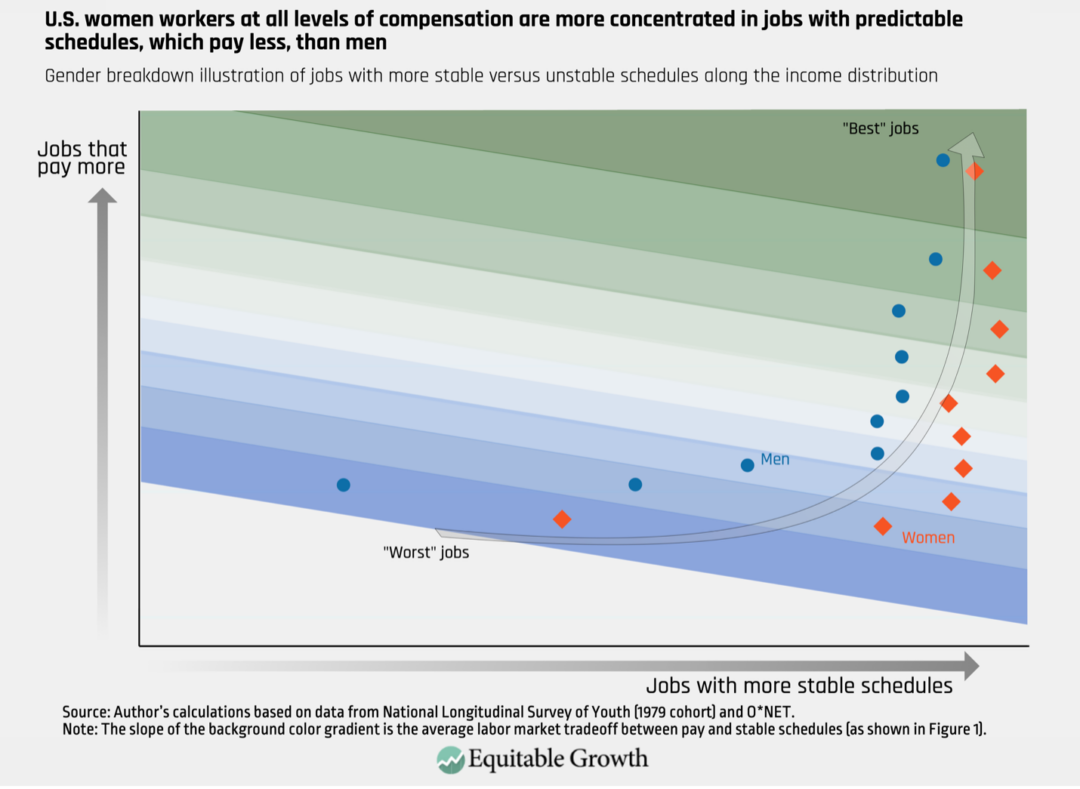
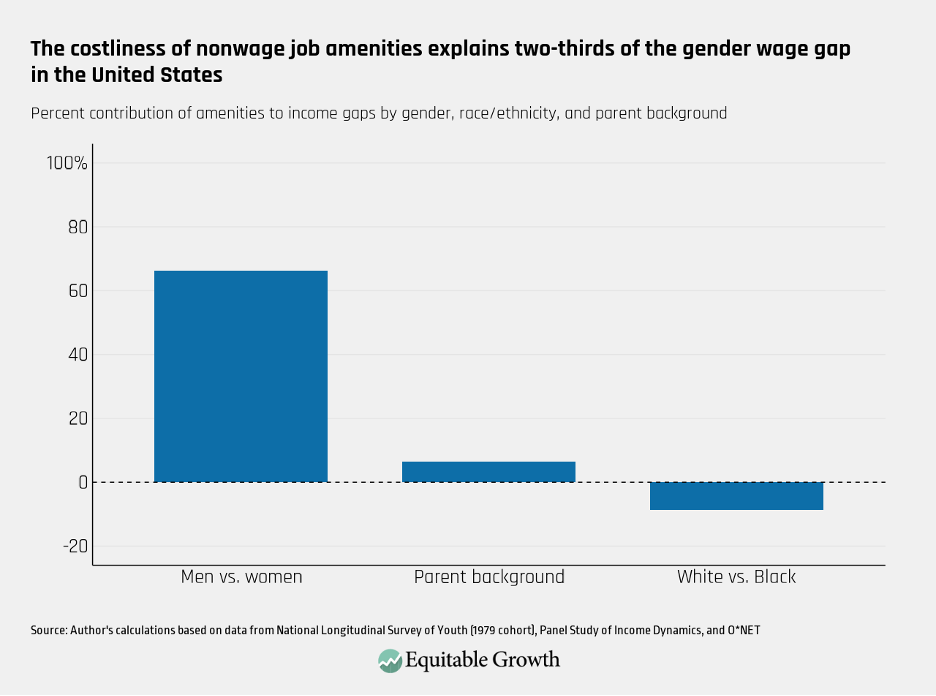


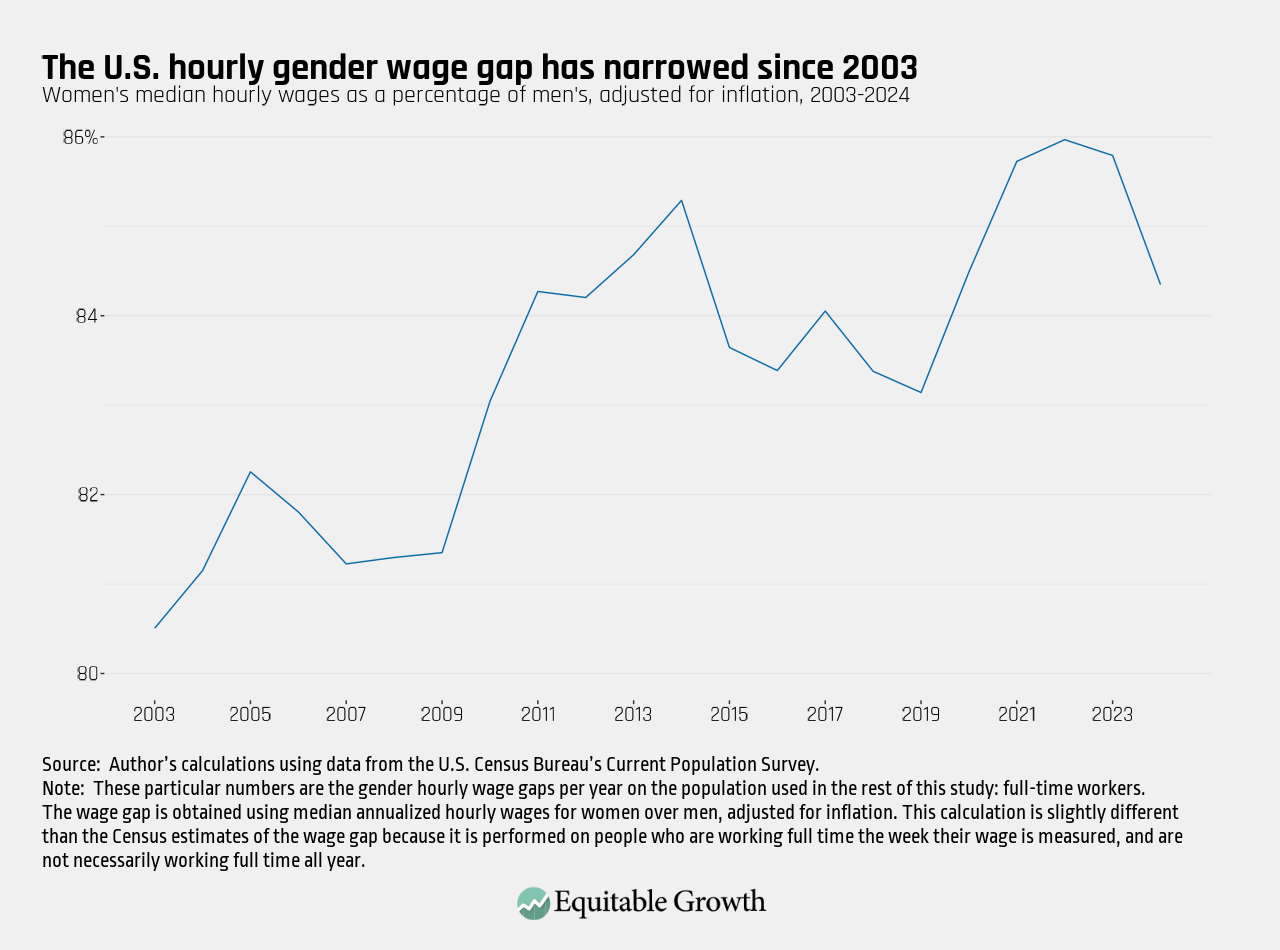
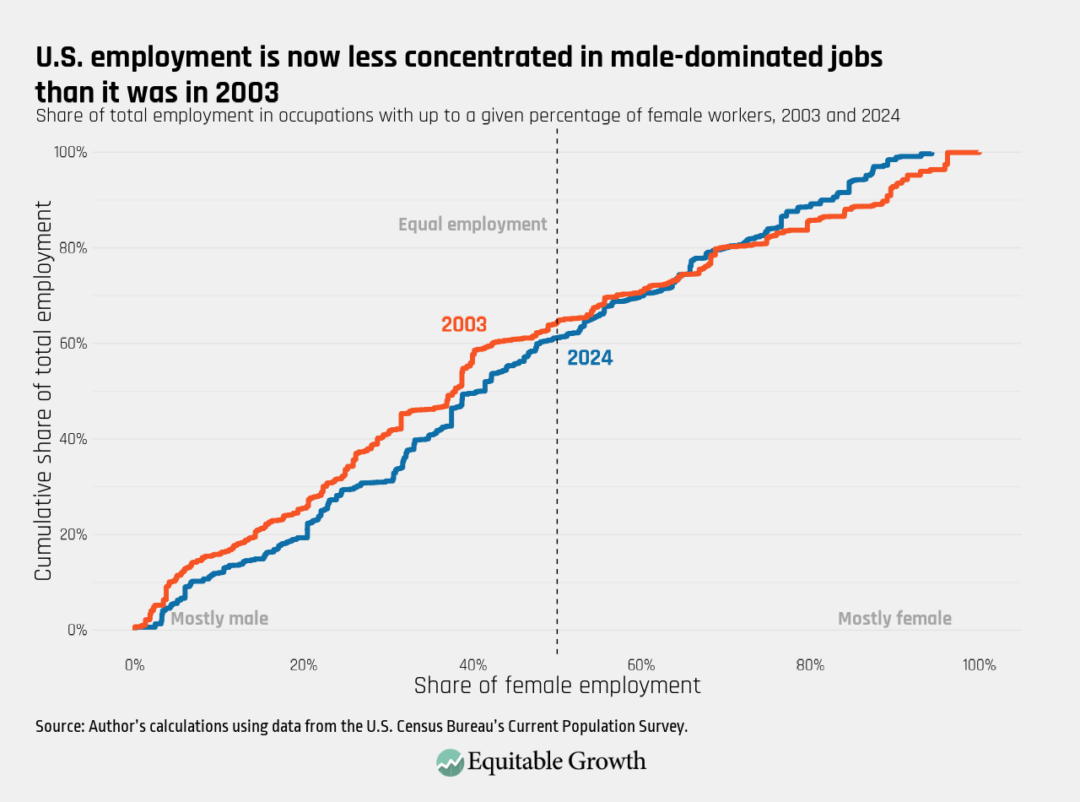
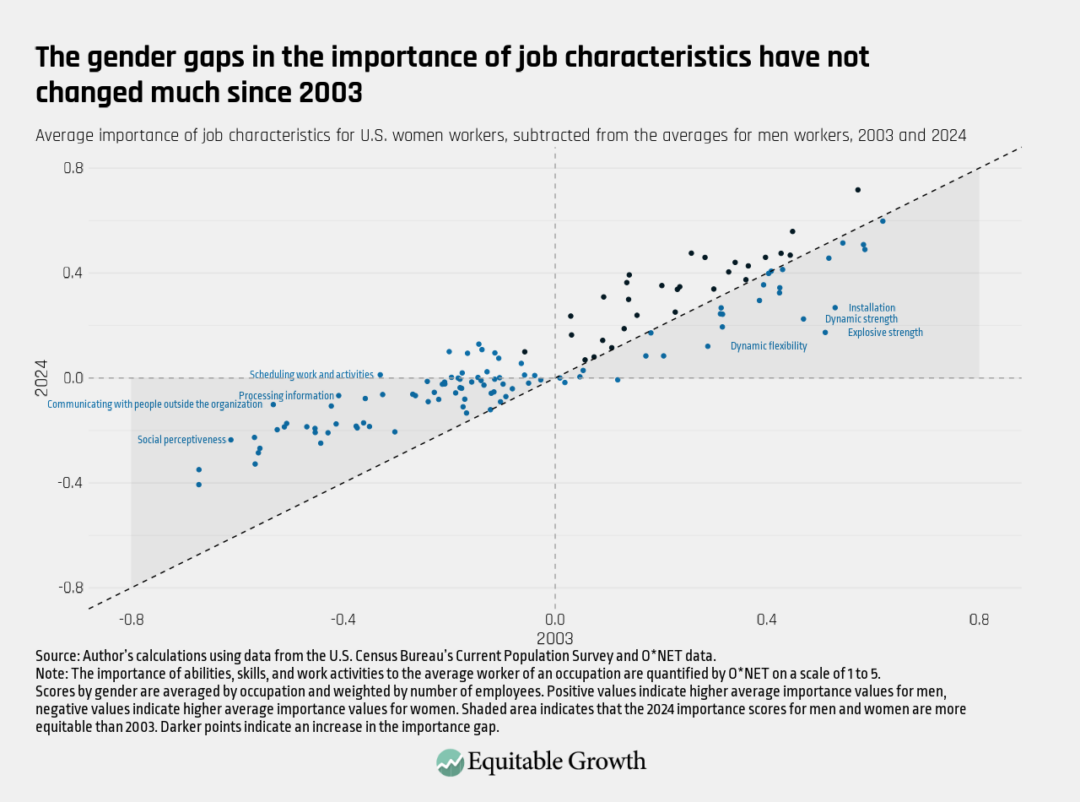
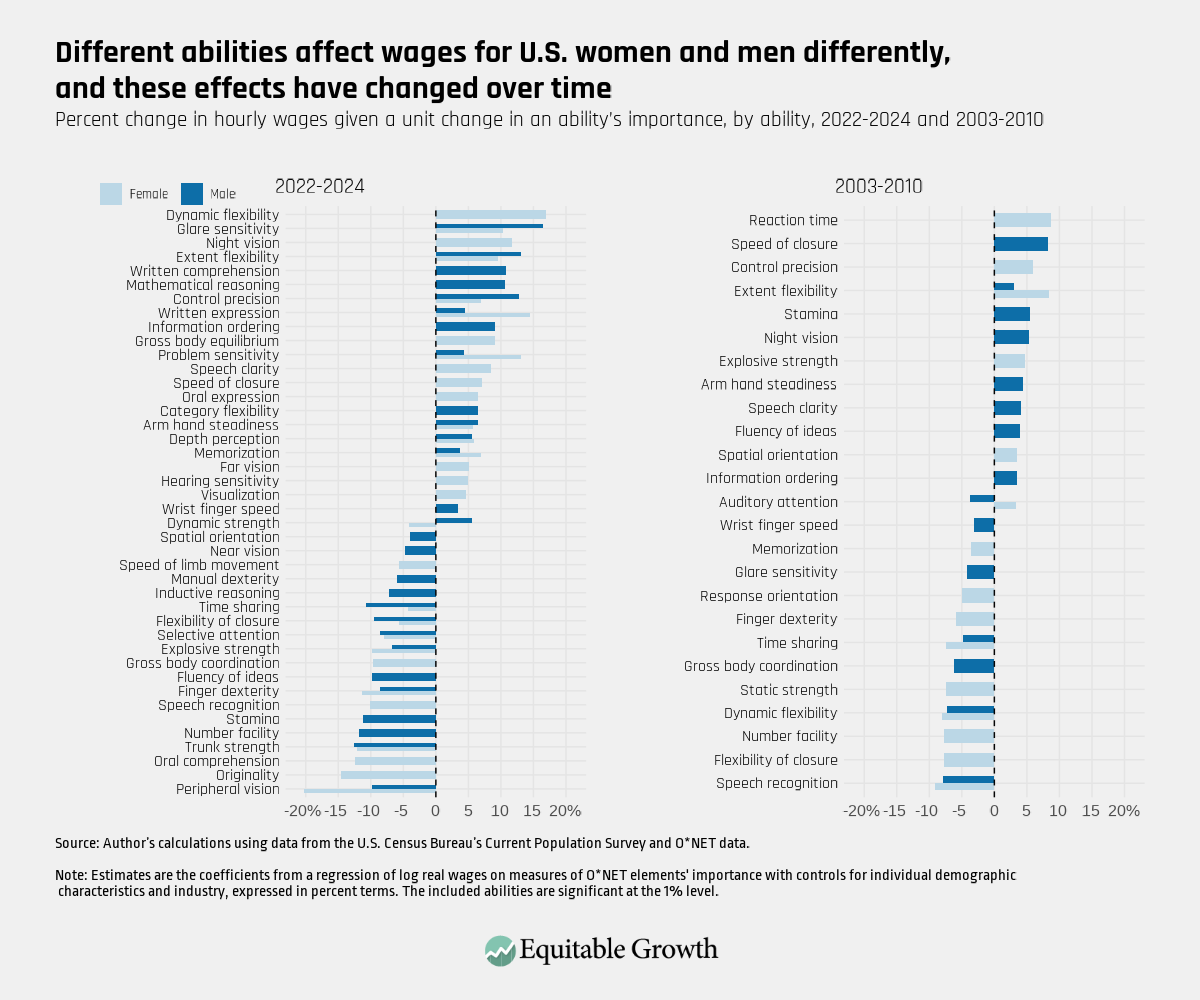
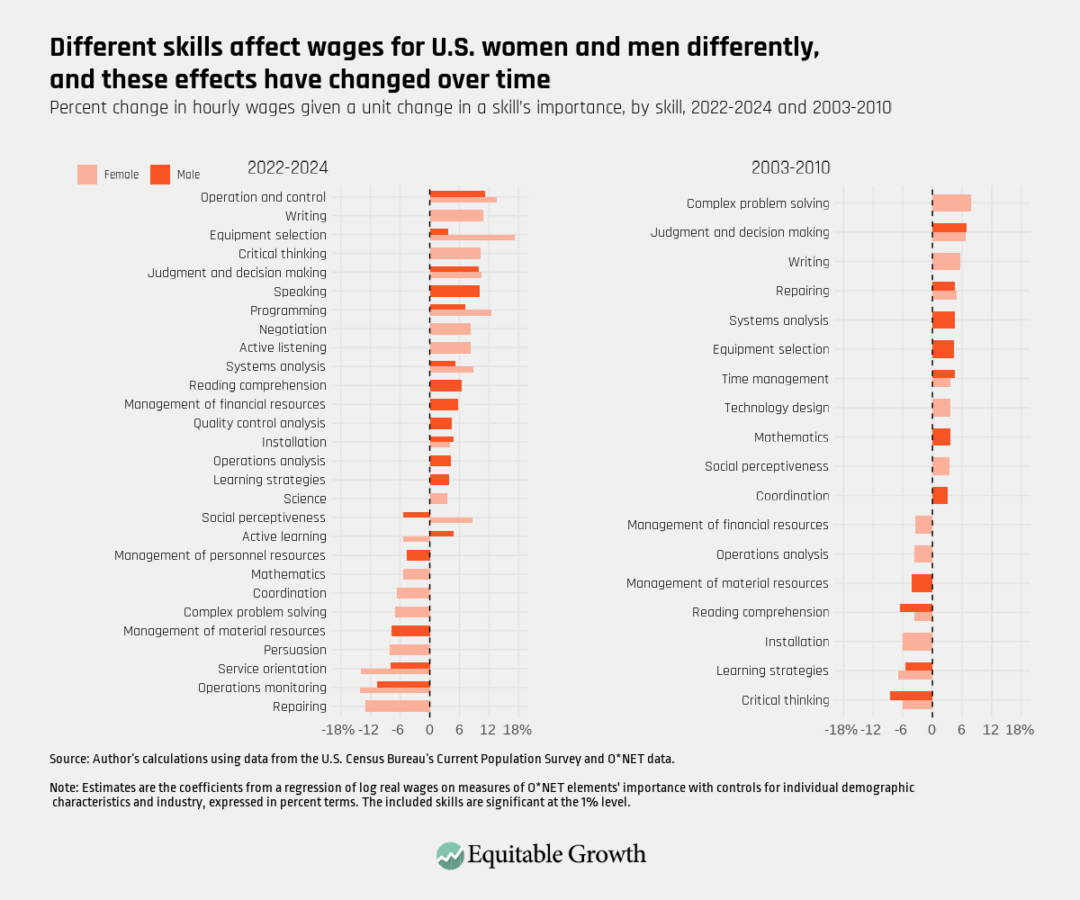
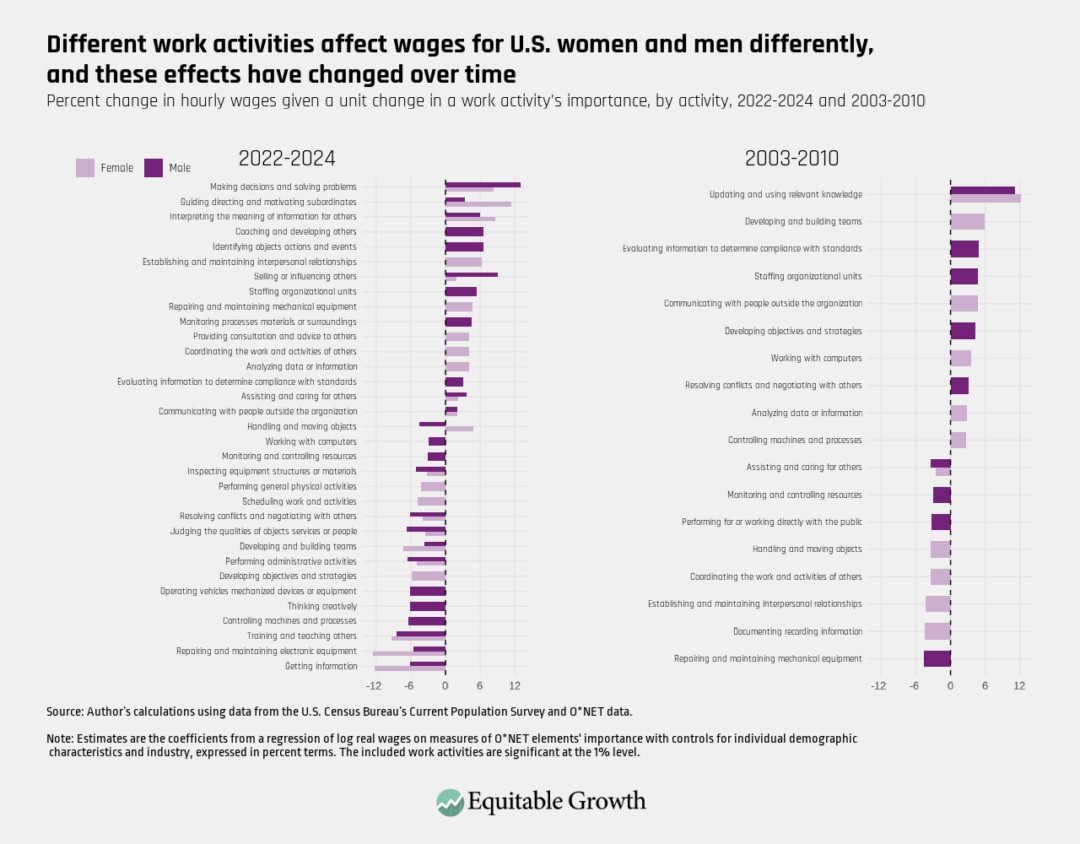
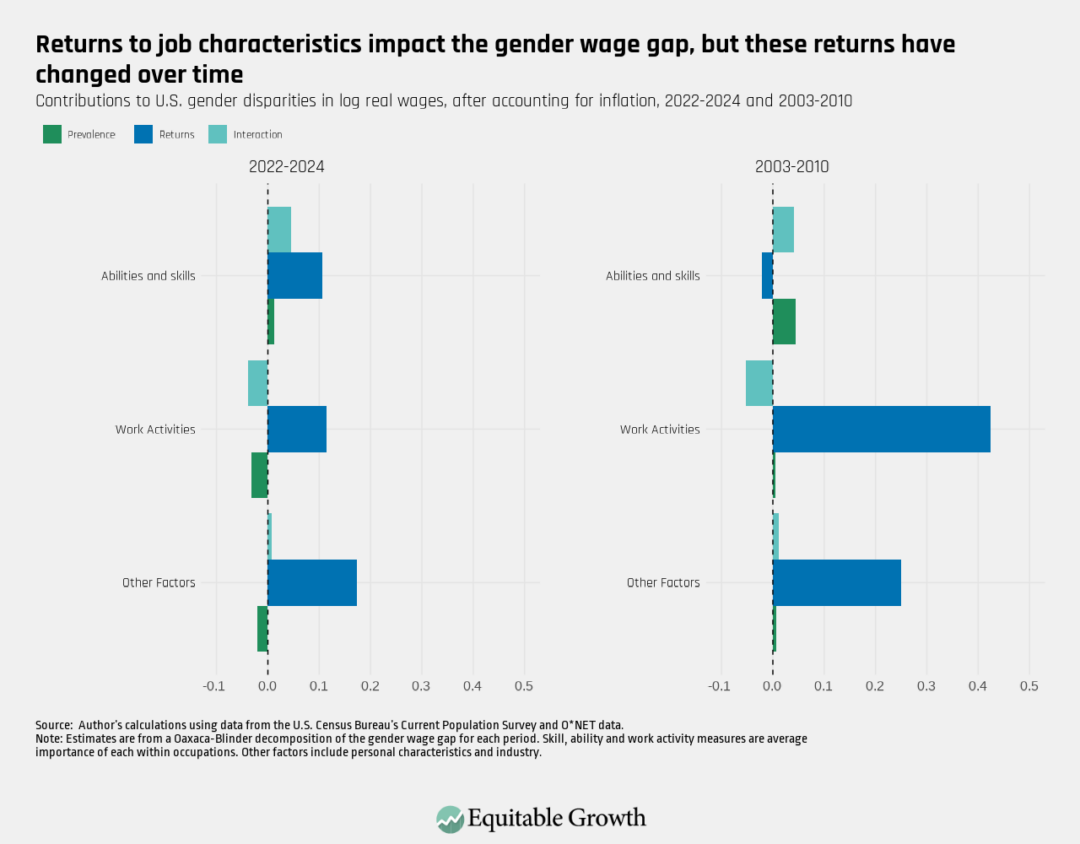


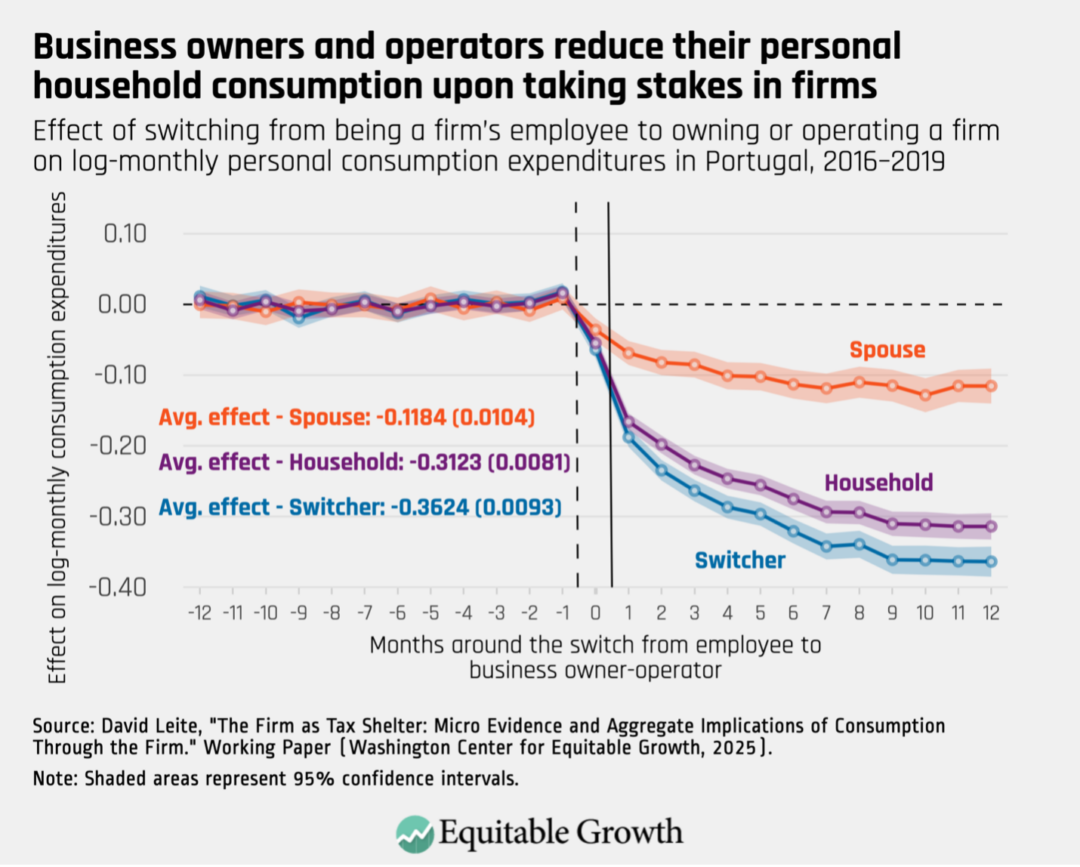
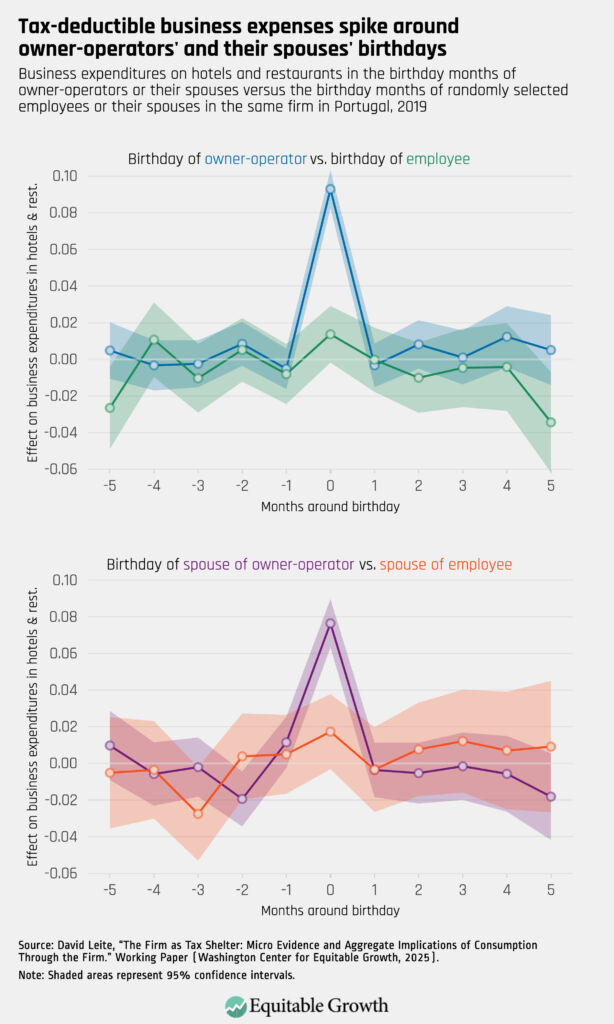
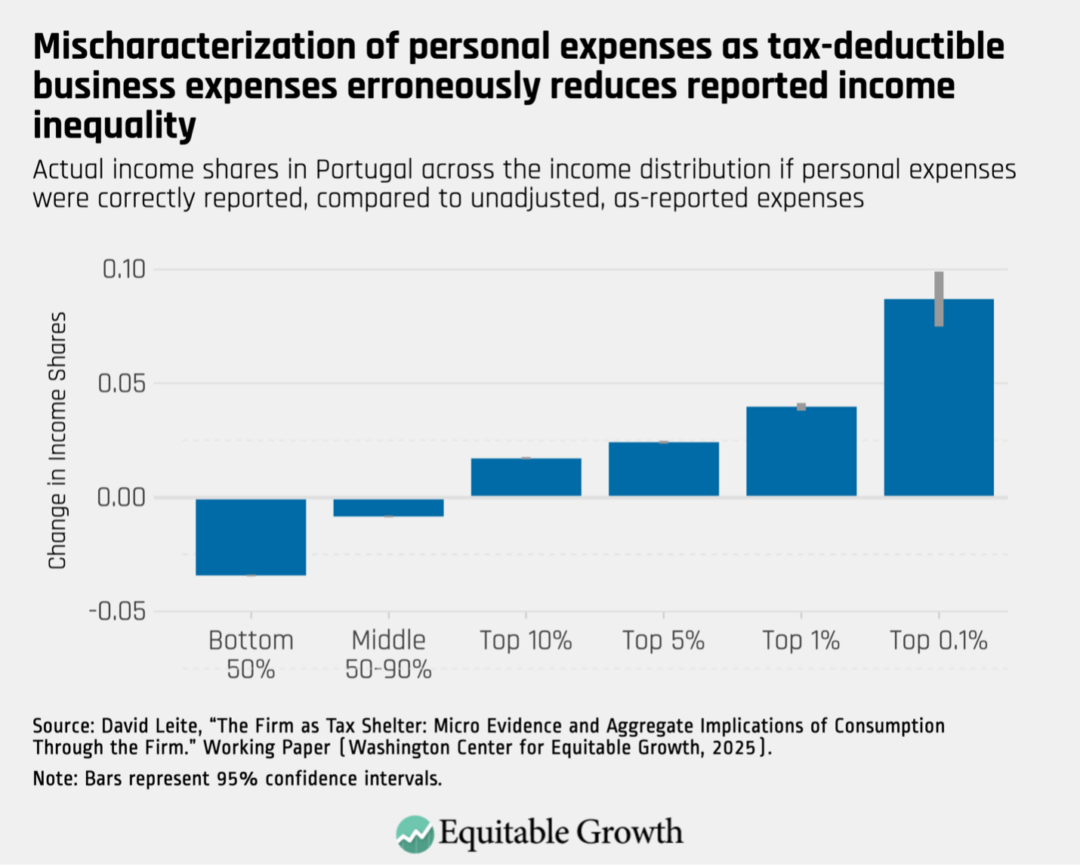
Stay updated on our latest research