President Donald Trump is attempting to fire Federal Reserve Board Governor Lisa Cook, the first Black woman to serve in that role. He probably lacks the legal authority to do so, but that is for the courts to decide. Regardless, this unprecedented move by a U.S. president directly threatens the Fed’s independence—and therefore the stability of the U.S. economy.
We take central bank independence as a given, but it was not always that way. Until the end of the 1980s, central bank independence was the rare exception—mostly in Switzerland, (West) Germany, and the United States—not the rule. But since then, it has come to dominate both thinking and practice around the world.
There have been attacks on central bank independence before, both in the United States and in other countries, and the resulting economic pain was often severe. In this country, perhaps the most egregious example of the Federal Reserve doing the bidding of politicians came in the lead up to the 1972 presidential election, when then-President Richard Nixon and Federal Reserve Chairman Arthur Burns coordinated to expand both fiscal and monetary policy in tandem to boost the economy and thereby President Nixon’s reelection chances. It worked politically. But to contain the inflationary pressures these actions unleashed, the president was compelled in 1971 to put in place the only peacetime wage-price controls in U.S. history. They were a disaster.
It is unfair to blame Burns and his colleagues on the Fed for the entire extraordinary inflation that followed. Supply shocks, especially from food and energy, were important determinants of inflation starting in 1972. Ironically, the U.S. economy is now similarly facing several potential supply shocks—from tariffs, from the potential for current deportation policy to disrupt U.S. labor supply, and even from the possibility that the wars in Ukraine and the Middle East could affect oil prices.
Monetary policy is the primary policy tool for fighting inflation. While fiscal policy can boost demand, it has less ability to curb inflation—and is virtually never used for that purpose. What will happen if we face serious inflation, and the Federal Reserve does not respond with tighter monetary policy?
Again, we should look to the past for insight. Years after the unwise and coordinated expansionary fiscal and monetary policy mix of the early 1970s, the notable and strong-willed inflation hawk Paul Volcker was put in charge of the Fed and took to fighting inflation with high interest rates. The price of taming inflation was the twin recessions of 1980 and 1981–82, caused significantly by tight money and credit. Volcker’s policies worked and restored the Fed’s anti-inflation credibility. But the pain was palpable.
The supply shocks of the 1970s and 1980s, of course, were global. So were the recessions that followed. Today’s supply shocks in the United States—from tariffs and shrinkage of the labor force—are, by contrast, mostly homemade. If President Trump succeeds in his campaign to eviscerate the Fed, our main bulwark against inflation will be weakened, if not destroyed.
Policymakers in a central bank subject to short-term political influence may face pressures to overstimulate the economy to achieve short-term output and employment gains that exceed the economy’s underlying potential. Such gains may be popular at first, and thus helpful in an election campaign, but they are not sustainable and soon evaporate, leaving behind only inflationary pressures that worsen the economy’s longer-term prospects. Thus, political interference in monetary policy can generate undesirable boom-bust cycles that ultimately lead to both a less stable economy and higher inflation.
The Federal Reserve’s Open Market Committee is technocratic, not political. The seven governors are appointed by the usual political appointee process: nominated by the president and confirmed by the U.S. Senate. But they are expected to check their politics at the door—and they generally do. The 12 regional Reserve Bank presidents are not politically appointed.
These technocrats base their interest rate decisions on data, theory, and lessons from history, not on political calculations. That does not mean they never err. But it does mean that the Fed’s errors are not designed to help the party in power—which would generally mean setting lower interest rates no matter what. President Trump, for example, has been clamoring for a 1 percent federal funds rate for years, though markets do not believe that will happen. If they did, expected inflation, and hence interest rates, would be much higher right now.
If Congress and/or the courts do not stop the president from eviscerating the Fed’s independence, it stands to put the U.S. economy at risk of a 21st century version of the 1970s and ‘80s, with high inflation, high unemployment, and stagnant economic growth—a true recipe for economic disaster.
Did you find this content informative and engaging? Get updates and stay in tune with U.S. economic inequality and growth!
Correction: Freddie Mac and Udemy contacted the Washington Center for Equitable Growth on March 18, 2026 and April 2, 2026, respectively, to say they no longer had business relationships with Betterworks. Freddie Mac said Betterworks “provided technology project management” services and did not provide pay or surveillance practices. Udemy said that it “ceased being a Betterworks customer on May 30, 2024” and did not use AI-driven tools to set or influence employee wages. We have updated the piece to reflect this. The researchers’ methodology rigorously analyzed the products offered by AI early-stage companies that specialize in workforce management, employee monitoring, and labor performance and identified those at “high risk” for enabling algorithmic pay systems. They similarly identified employer characteristics, such as reliance on performance metrics, that would enable an employer to use algorithmic pay systems. The original piece included a lengthy list of companies across industries whose characteristics would allow for algorithmic pay systems that have or have had contracts with “high risk” AI vendors. Because we cannot confirm the specifics of these contracts, we have removed reference to specific companies.
Workers’ pay is increasingly shaped by opaque algorithms and artificial intelligence systems, shifting compensation decisions away from human managers, clear legal standards, and collective bargaining. This phenomenon—known as algorithmic wage discrimination1 or surveillance pay2—was first documented in app-controlled ride-hail and food-delivery work. Now, it is spreading to a range of other industries and services.
Our first-of-its-kind audit of 500 AI labor-management vendors suggests that traditional employers in industries including health care, customer service, logistics, and retail are now using automated surveillance and decision-making systems to set compensation structures and to calculate individual wages. Without policy interventions, we fear that these practiceswill become normalized, thus growing income uncertainty, entrenching bias, and eroding wage-setting transparency.
Government enforcement agencies and legislators working together should affirmatively and proactively prohibit these practices. This can be done by legislatively proscribing the use of real-time data to automate workforce compensation structures (such as tiered bonuses, performance-based incentives, or penalties for low productivity) and to automate wage calculations. To ensure a positive correlation between hard work and fair pay, wage-setting practices must be, at the very minimum, predictable and scrutable.
In this issue brief, we first examine how surveillance pay practices work and where they are increasingly deployed in the U.S. economy. We then present our audit findings in detail before turning to our policy recommendations to ensure fairness and transparency in setting and calculating workers’ pay.
How surveillance pay practices work and where they are becoming more prevalent in the U.S. economy
Nicole picked up a part-time job with ride-hailing firm Lyft Inc. to help cover her mortgage payments after its adjustable interest rate increased.3 After a long week of working at her regular day job in health care, she would wake up early on Saturday mornings and begin her second job—a ride-hail shift at Lyft. For a few weeks, Nicole would drive until she earned $200—the amount she needed to make her higher loan payment—and then go home.
Within 2 months, however, she found that it took her longer to earn that target amount of $200 per shift. For some inexplicable reason, her daily gig earnings dropped by as much as $50. Though she maintained a high driver score and worked harder than ever, over the course of the following year, Nicole’s Saturday wages dropped an additional $50. To make ends meet, she picked up a shift on Sundays, too. It seemed like the longer Nicole worked for Lyft, the less she earned.
On-demand workers such as Nicole were among the first to experience what has become known as algorithmic wage discrimination, also referred to as surveillance pay: digitalized wage-setting in which firms use large swaths of granular data, including data gathered in real time through automated monitoring systems, to establish compensation brackets and/or to calculate individual pay.4 Studies of on-demand workers dating back to 2016—including those initiated by workers themselves—have found that the introduction of these black box AI systems to determine remuneration has consistently led to low, erratic, and uncertain incomes for app-controlled ride-hail and food delivery workers. Perhaps unsurprisingly, this has led to increased worker stress, higher workplace injury rates, and decreased overall job satisfaction.5
Under surveillance wage systems, different people may be paid different wages for largely the same work, and individual workers cannot predict their incomes over time. These pay practices—especially those that rely on panoptic worker surveillance and on algorithmic intelligence or machine learning systems—invert the deeply held maxim that long, hard work steers toward higher wages and economic security. Not only has pay for app-controlled jobs, such as Nicole’s work for Lyft, decreased over time, suggesting shifting compensation brackets within firms, but industry research also affirms what workers like her have described: People who work longer hours are paid less per hour.
Alarmingly, this uncoupling of hard work and secure, fair pay is no longer just a concern for app-controlled or “gig” workers. The intense pace of funding for AI firms that specialize in labor management has fueled the growth and sale of automated products that aim to increase workforce efficiencies through the introduction of monitoring and decision-making systems that may affect or determine wages. But because software companies do not typically advertise their systems’ abilities to lower labor costs by generating dynamic wage structures and calculations, little is known about these products, their features, and the individual and social implications of their use.
Questions therefore abound. Which sectors of workers are experiencing disruptions in how they are monitored on the job, evaluated for their performances, and paid? What are the capabilities, limitations, and risks of these systems? And, critically, are these systems helping or hurting everyday workers?
To begin to fill this knowledge gap and identify the sectors most likely affected by algorithmic wage discrimination systems, we did a first-of-its-kind analysis of 500 AI vendors who market machine-learning products for use in labor management. Through a risk evaluation of these 500 firms, we then identified a subset of 20 vendors whose products are highly likely to use machine-learning systems to generate surveillance pay. To our knowledge, this is the first systematic study of the spread of algorithmic wage discrimination practices outside of the context of gig work.
Unlike set wages that are determined through contractual negotiations between employers and employees, wages determined by machine-learning systems are generated in real-time, rendering them variable, uncertain, and inscrutable to the workers who rely upon them. Despite this, the vast majority of products in our research detailed below also lacks any transparency or feedback mechanisms. Thus, though the experiences of people such as Nicole were once limited to app-controlled jobs, they are now likely to be spreading to other, more traditional sectors of employment, fundamentally changing the relationship between work and pay for workers across the U.S. labor market.6
The potential impacts of these findings are startling. The spread of surveillance pay practices to critical, human-centered industries such as health care and customer service not only changes the relationship between hard work and fair pay, but also meaningfully alters workplace norms and culture, impacting how patients are treated in hospitals and how consumer problems and interests are addressed. Lessons from research on app-controlled work suggests that the introduction of surveillance pay incentivizes workers to perform in ways that lower labor costs but may de-center patient well-being or customer satisfaction.
The potentially catastrophic consequences, then, of surveillance pay extend far beyond its implications for the insecurity and unpredictability of individual worker pay.
The surveillance pay practices enabled by AI vendors and deployed by their customers
Analyzing the initial 500 AI firms using the parameters listed in our methodology (See Box above), we identified 20 vendors whose products we determined to be at high risk for producing algorithmic wage discrimination. While algorithmic pay practices began in the transportation and delivery sectors, our findings suggest that they have spread to workforce management in a number of industries, most prominently health care, customer service, logistics, and retail.
Of the 20 AI vendors at high risk for enabling surveillance-based wages, five created products specifically for customer serviceworkforce management (including one focused on call centers); four designed products for monitoring and managing workers inhealth care; one focused specifically on workforce management for last-mile delivery in logistics; and one targeted management in the manufacturing sector. The remaining nine vendors developed cross-sector tools that include platforms designed to be integrated across a range of industries, including retail, finance, education, transportation, and technology.
These vendors typically market their products as general-purpose workforce optimization or performance management systems. While not tied to a single sector, they are often deployed in metric and performance-intensive environments and can be integrated with existing HR and payroll systems, thus enabling algorithmic wage-setting across a wide range of workplaces. Overall, these cross-sector tools and platforms create a new standard of workforce surveillance, with plug-and-play solutions for performance monitoring, decision-making, and compensation management across diverse industries.
We found that some vendors embed into their platforms the ability to not only adjust workers’ pay in real time but also steer how pay tiers and bonus structures are set over time. These processes are frequently automated with limited-to-no human review.7 A vast majority of the vendors we reviewed (16 out of 20 firms) also links their products directly into payroll or HR systems. Most products give workers zero visibility into the data or logic behind pay calculations, and only a small subset offer built-in channels for employees to review or contest algorithmic decisions. Finally, we also found that many vendors apply identical performance benchmarks across diverse roles and contexts, ignoring factors such as task complexity, local market conditions, and worker accommodations (in possible violation of disability laws and protections).
Across the vendors and products we reviewed, we found that all relied on an extensive amount of data collected on and through their workforce and customer markets. Whether the firms quantified subjective metrics, such as performance and customer satisfaction, or whether they aimed to analyze real-time behavior for purposes of allocating tasks or determining quotas, the products all relied on data collection and processing. The systems did not provide a means for workers to access the personal or social data that are collected. They also lacked mechanisms to help workers understand and contest either the accuracy of the data collected or the decisions of the machine-learning systems.
The use of these products to suppress wages and produce variable income is concerning, as are the collateral effects. The collection and storage of these workforce data implicate workers’ privacy, ability to negotiate higher pay in this job or their next one, and their federally protected right to organize their workplaces.
To better understand our findings—and the practices and harms that emerge—we propose a framework to understand surveillance pay systems. Some of these systems produce frameworks for automated workforce compensation, while others produce automated wage-calculation decisions, and still others do both. In our taxonomy, automated workforce compensation systems are those that create dynamic but broad frameworks affecting wage distribution and restrictions across a workforce. These automated systems are less likely to produce day-to-day variability for individual workers, but in so much as they yield wage bands or brackets, we expect that they are a driving factor in workforce wage suppression and wage discrimination.
Similarly, automated wage-calculation systems enable firms to make dynamic wage adjustments based on the system’s machine-learning analysis of an individual’s behavior, temporal and spatial market conditions, and other unknown factors. These systems can be integrated with automated workforce compensation systems. Both together and individually, these processes are likely to exacerbate the impacts of long-term wage stagnation and worker insecurity.
In Table 2 below, we further detail this taxonomy, the types of data both systems may rely on, how the data are used, and in what sectors the tools are currently deployed. The two AI surveillance processes are most likely to overlap when automated compensation structures are used to structure wages, such as worker-pay tiers, base rates, or compensation models based on performance, commissions, fixed or hourly pay, or salary, and where workers are simultaneously rewarded or punished through wage calculations based on a granular analysis of their performance, behaviors, and risk factors. (See Table 2.)
Table 2
Our analysis, for example, suggests that some AI vendors, such as med-tech startups Aidoc Medical Ltd and ARYAHealth, appear to focus more on using machine learning systems shape wage structures. Other AI vendors—among them call center-tech firm Level AI, governance and compliance-focused Cognitiveview, and conversation-analytics firm Uniphore—have developed products with notable workplace decision-making capabilities, including task allocation and performance-based reviews, which very likely result in automated wage calculations.
AI vendors that create and sell products that enforce strict productivity benchmarks, customer satisfaction metrics, and key performance indicators include Insightful, dba Workpuls, Netomi Inc., AssemblyAI, and kore.ai, as well as Level AI and Uniphore. But because these firms’ products are not integrated into metric-based pay systems, we suspect their customers use their products for automated workforce compensation decision-making.
Still other AI vendors, among them Symbl.ai, Betterworks Systems, Inc., and SupportLogic, offer products that enforce productivity benchmarks and key performance indicators and appear to integrate dynamic pay models with real-time metrics, such as performance-based compensation, bonuses, and penalties. Since earnings are frequently adjusted based on performance data, customer interactions, and behavioral analytics, this approach is likely to result in automated wage calculations, resulting in wage variability and unpredictability for workers.
Notably, our research finds that employers across the customer service, finance, manufacturing, computer science, and health care sectors have or have had contracts with these vendors, including major U.S. companies. Yet public visibility into how employer-vendor relationships function in practice is often limited. These tools can spread under conditions of opacity, limited disclosure, and weak worker visibility into how performance data may shape pay, scheduling, or discipline. This limitation is itself part of the accountability problem concerning AI-driven workforce systems.
How surveillance pay practices match up to existing U.S. labor laws and traditional workplace practices
In the United States, four major federal laws govern wages and working environments. Surveillance pay managed by algorithmic wage systems—both that set workforce structures and that automate wage calculations—may violate the letter and spirit of these laws. The impacts of low and variable wages on workplace safety and the ability of employers to use automated monitoring systems to detect worker organizing and punish it with low pay are instances in which surveillance pay practices may directly violate existing employment and labor laws.
Even in instances where the wage outcomes of automated compensation structures and automated wage calculations do not directly violate minimum wage laws, overtime regulations, labor protections, or anti-discrimination laws, their impacts offend the legislative intent behind wage regulations—namely, the creation of predictable, living wages, in which people are paid equally for equal work. In this section of our issue brief, we describe the federal laws that currently govern wages and the working environments produced through wage-setting practices and detail the ways that algorithmic wage-setting practices that power surveillance pay may be upending these protections and the norms they have produced.
Minimum wages and compensable time on the clock
The most widely known federal work law governs how long workers labor and how little they can be paid. In response to labor agitation created by widespread unemployment and poverty during the Great Depression nearly 100 years ago, Congress passed the Fair Labor Standards Act, a centerpiece of the New Deal legislation of the 1930s. The law sets minimum wages, overtime, and record-keeping laws and sets the floor (not the ceiling) for wages across the country. The federal minimum wage is set by Congress and has been a staggeringly low $7.25 per hour since 2009. In the face of congressional inaction and changing standards of living, many states and local municipalities have periodically passed legislation to set and raise the local minimum wage to near living wage levels of about double that amount.
Algorithmically determined wage structures and calculations do not necessarily violate minimum wage laws, but, to date, they have been used by firms to make it more difficult to identify violations and to enforce the law. In app-controlled ride-hail and food-delivery work in the United States, for example, firms have maintained that their workers are only entitled to pay after work is sent to them, not when they are waiting for work. This piece-pay practice disconnects time and pay, making it impossible for individual workers to know how much they might earn for work over any period of time.8
The Federal Labor Standards Act abolished piece-pay in many industries. Yet these algorithmic wage structures and calculations raise the problem anew by setting wages that are variable and difficult for workers and enforcement agencies to decipher.
What’s more, some of the firms that use digitalized piece-pay practices are trying and succeeding at amending state laws to make it legal to discriminate between workers in this way. In California, for example, the ride-hail and food-delivery firms with the largest market shares—Uber Technologies Inc., Lyft Inc., DoorDash Inc., and Maplebear Inc.’s Instacart—sponsored and won a 2020 referendum9 to cement their algorithmic wage discrimination practices into state law. Under the law, workers laboring for so-called transportation and delivery network companies are formally exempt from state minimum wage and hour protections and instead guaranteed 120 percent of the minimum wage of the area in which they are working—but only after they have been disseminated work, not while they are awaiting this work.
After this firm-sponsored law was enacted in 2020, a worker-led study found that Uber and Lyft drivers in California were making $6.20 per hour, with an hourly wage floor of about $4.20.10 In contrast, in 2025, the California minimum wage is $16.50 per hour.
Even the study’s authors were surprised by the low algorithmically determined earnings because they said that most drivers work until they hit a certain wage target, not accounting for the tolls, airport fees, gas, insurance, and vehicle depreciation costs that they incur in the process. And, in another California worker-led experiment, Uber and Lyft drivers themselves affirmed what they had long suspected—that they were being allocated different wages for the exact same work, a topic we turn to in the next section.11
Together, automated workforce compensation and calculation systems violate the spirit of local minimum wage laws and may also violate the Fair Labor Standards Act. In practice, the California model exists in many other states where local legislatures have cemented the status of ride-hail and food-delivery workers as “independent contractors” for the purposes of state law. But state laws do not preempt FLSA obligations. As of the time of writing, the federal government has not initiated an enforcement action in any state.
Equal pay for equal work
In response to social and labor movements and persistent age, disability, gender, and race-based wage gaps, Congress has passed laws over the past seven decades that, in theory, guarantee that workers doing broadly similar work earn the same wages for that work. The idea of “equal pay for equal work” emerged from the women’s movement and civil rights movement in the 20th century, and can be found most clearly in Title VII of the Civil Rights Act of 1964, the Age Discrimination in Employment Act of 1967, the Equal Pay Act of 1963, and the Americans with Disability Act of 1990.
Together, these laws prohibit differential pay becauseof race, color, religion, sex, national origin, age, or disability. They have been notoriously difficult to enforce, and identity-based wage gaps remain persistent in the U.S. labor market. Still, they create baseline aspirations for wage-setting in the labor market.
Algorithmic wage practices often violate the spirit of “equal pay for equal work” laws, and in some cases, they may also be violating the letter of the law. Indeed, wage-calculating AI is rooted in pay discrimination—differentiating between workers on the basis of any number of known and unknown factors, including, as discussed above, predictive analytics that attempt to determine a worker’s potential tolerance for low pay.
While some AI vendors claim their products enabling surveillance pay using their algorithmic wage-calculation software are based on objective analysis of workers’ performance, their systems often do not provide mechanisms for workers’ feedback or share clear information on how workers are evaluated in relation to their pay. Anecdotal evidence suggests that algorithmic performance analysis may also produce uncorrectable errors, resulting in unfair outcomes.
One case in point was included in the Biden administration’s “Blueprint for an AI Bill of Rights.” The White House Office of Science and Technology included the following example in the blueprint’s Safe and Effective Systems section: “A company installed AI-powered cameras in its delivery vans in order to evaluate the road safety habits of its drivers, but the system incorrectly penalized drivers when other cars cut them off or when other events beyond their control took place on the road. As a result, drivers were incorrectly ineligible to receive a bonus.”12
In turn, these undetectable and unfair errors may have devastating impacts on a worker’s ability to put food on the table or to pay rent for their homes. Studies suggest that low-income workers rarely contest wage violations in offline labor markets. If the wage errors themselves are inscrutable, then, by extension, workers in online labor markets would be even less inclined to do so.
These practices—in addition to resulting in discriminatory wages between any two workers doing broadly similar work at the same time and in the same way—may also exacerbate existing identity-based wage inequalities. Though Uber rarely shares pay data with third parties, research produced alongside Uber’s own chief economist, Jonathan Hall, found that “although neither the pay formula nor the dispatch algorithm for assigning riders to drivers depend on a driver’s gender,” women working for Uber make roughly 7 percent less than men.13 As one of us has argued elsewhere, “On its own terms, the publication of this finding signals a troubling moral shift in how firms understand the problem of gender discrimination and their legal responsibility to avoid it.”14
Collective organizing and bargaining
The National Labor Relations Act of 1935 created a nationwide industrial system in which collective worker organizing became a protected right for most workers and collective bargaining became systematized through national oversight.15 The law resulted both in the growth of labor power and, over time, a decrease in industrial unrest. Notably, at the behest of Southern Democrats at the time, who hoped to maintain the racialized nature of Southern plantation economies, the law excluded both domestic and agricultural workers from its protections, and Congress later also included a carveout for independent contractors.16
African American civil rights advocates at the time objected to the exclusion of these largely Black and minority workforces, understanding this exclusion as having devastating impacts on any post-Civil War gains made by these workers. They maintained that lower wages for Black workers would, in effect, “relegate … [African American workers] into a low wage caste,”17 and “destroy any possibility of ever forming a strong and effective labor movement.”18
The use of wage-calculating algorithms to differentially set wages in sectors comprised largely of workers of color, as is the case with platform-enabled ride-hail and food-delivery firms, has indeed had the impact of not only creating a second tier of wages—or, as one of us has called it, “a new racial wage code”—but it has also disrupted efforts at collective organizing. As one of our studies that explores the wage experiences of Uber drivers found, “The fact that different workers made different amounts for largely the same work was a source of grievance defined through inequities that often pitted workers against one another, leaving them to wonder what they were doing wrong or what others had figured out.”19 This, in turn, may be used as an employer tactic to violate the spirit of the National Labor Relations Act, making it more and more difficult for workers to collectively organize.
Additionally, algorithmic wage discrimination may be used to retaliate against workers for protected union-organizing activities. A union of Japanese workers, for example, has alleged that algorithmic wage-setting software has been used to target union organizers, effectively punishing those workers with lower wages.20 Of course, the nature of the black box systems that firms use to set wages and wage structures make it difficult to understand or to challenge an outcome such as this. In the United States, the use of an algorithmic wage-setting system to punish organizers would be unlawful retaliation under the National Labor Relations Act.
Safety and health standards at work
Workers in the United States have the broad and often-unrealized right to safe and healthy workplaces under the Occupational Safety and Health Act of 1970. Extant empirical evidence from around the globe suggests that algorithmic wage practices utilized by firms have resulted in high rates of psychosocial and physical injuries.21 These outcomes can be traced, in part, to the way workers are paid through algorithmic wage structures and setting systems.
Cornell University’s Worker Institute and the Worker’s Justice Project/Los Deliveristas Unidos together found that in New York City, 42 percent of delivery workers “reported non-payment or underpayment of their wages, with almost no recourse because of how the firms control them through digital machinery.”22 The under and non-payment of wages set and distributed by algorithms result in workers laboring in ways that make them vulnerable to risk-taking and injury. As one of us has argued elsewhere:
[T]he launch of ride-hailing companies in cities has been associated with a three-percent increase in the number of traffic fatalities. Working long and hard, with low wages and little predictability… may give rise to workplace dangers, including more crashes. A joint study of the California Public Utilities Commission and the California Department of Insurance found that ride-hailing accidents in that state alone generated 9,388 claims that resulted in a combined $185.6 million loss in 2014, 2015, and 2016.23
The low and unpredictable wages created through surveillance pay practices powered by these algorithmic systems can also result in emotional injuries. The fear of not earning enough, to accept all work without fail because not doing so will result in lower wages or termination, and working at great speeds to earn more can all cause psychosocial injuries. In a large study of workers who received algorithmically set wages in the European Union, researchers “found that workers suffered high rates of depression relative to other jobs.”24
Federal laws and some state protections place the responsibility on employers to create safe and healthy workplaces, but algorithmic wage-setting systems create new health and safety problems that have yet to be addressed robustly at the state or federal level.
Recommendations to ensure surveillance pay practices do not harm workers and depress their earnings
As detailed above, algorithmic wage discrimination practices are proliferating across an increasing number of sectors in the U.S. economy. The large body of evidence produced by researchers who study these practices in on-demand work settings suggest that firms that use these systems may risk violating the existing employment and labor protections detailed in the previous section. The practices may also violate antitrust and consumer laws.25
Yet, to date, few agencies have attempted to enforce these laws at the federal or state level. Opportunities to do so remain, however, even if wages do not fall below the minimum wage or state agencies do not have data to determine a violation of anti-discrimination laws. Why? Because if surveillance pay practices lend themselves to health and safety violations—for example, by incentivizing workers to labor longer in ways that cause physical and psychological injuries—then state and municipal agencies may enforce existing health and safety protections.
With the extraordinary speed of production of AI for workforce management, and the implications of algorithmic wage-setting practices across the U.S. labor market, we believe that both state and federal legislators are well-situated to step in. One approach, for which we advocate here, is to craft legislation to ban the use of real-time data to both automate workforce compensation structures and to automate wage calculations. Wage-setting has traditionally been transparent—at least to the workers receiving said wages—and the new opacity of wage structures and wage calculations creates new and alarming harms.
A second, less comprehensive approach, is for legislators to focus specifically on banning the use of automated wage calculation systems. Such laws should extend both to employers and hiring entities who use independent contractor labor and should apply to wages for all the time that their employees work and wait for work. In this context, providing for both private and public enforcement will make firms more reticent to engage in these practices.
Critically, we argue that legislation mandating transparency of algorithmic wage-setting systems alone will not do enough to mitigate these harms. Existing case studies of workers attempting to use their General Data Protection Regulation rights in the European Union to understand wage and termination practices underscore transparency’s limitations. These workers in the EU argue that even when they are given explanations for how they are paid, the systems change too frequently to effectively use this information to create income predictability. They also generally lack the power and technical expertise to use data releases to locate and correct violations of practice or law.26
Conclusion
Scholars, policy analysts, lawmakers, and labor advocates alike have raised significant concerns about the immediate and long-term financial insecurity of workers in the United States. Observers have identified macroeconomic trends, including historical wage stagnation,27 inflation’s effects on real wages,28 and widening structural and geographical wage disparities,29 as contributors to national problems of precarity and immobility. Despite significant productivity growth since the 1970s, most U.S. workers’ wages have stagnated, leading to a significant productivity-pay gap.30 This means workers have not benefited from productivity and efficiency gains arising from the growing use of technology for labor management.
More recently, these structural challenges have been compounded by the growing discretionary use of novel technologies at work. Developments in artificial intelligence and other digital machinery have led to well-documented problems, including worker displacement,31 reduced job quality,32 and the perpetuation of bias and discrimination in the labor market.
Across the political spectrum, workers and politicians agree that hard work should be positively correlated with fair pay. This essay has identified the empirical reality that machine-learning systems that very likely uncouple fair pay and hard work, leading to wage uncertainty, discrimination, and suppression, are rapidly spreading across the U.S. labor market. This should alarm analysts and lawmakers concerned about economic inequality.
The American dream—however fraught and unreachable for many—is directly under attack. In this moment of income insecurity for most U.S. workers, legislators across the aisle should be motivated to write laws at both the federal and state level to address the problems endemic to the algorithmic wage-setting systems that power inequitable surveillance pay practices.
About the authors
Veena Dubal is a professor of law and legal anthropologist at the University of California Irvine School of Law. Her research focuses broadly on law, technology, and precarious workers, combining legal and empirical analysis to explore issues of labor and inequality.
Wilneida Negrón is a political scientist, technologist, and strategist whose work bridges labor rights, emerging technology, and public policy. As the architect behind field-defining initiatives on workplace surveillance and ethical innovation, she has shaped how funders, organizers, and policymakers address the future of work and tech accountability.
Did you find this content informative and engaging? Get updates and stay in tune with U.S. economic inequality and growth!
The Washington Center for Equitable Growth announced today that it has awarded funding to seven scholars seeking to better understand the effects of economic inequality in the United States and who are interested in engaging beyond academia to inform evidence-backed policymaking. These researchers are all in the early years of their careers, either currently enrolled in a Ph.D. program or those who received their degrees in the past 8 years.
The funded research projects range in topic, from the housing crisis to child care to supply chain resilience. Below, we detail each grant awarded funding in this year’s cycle.
Ph.D. students
The following projects are headed by students currently enrolled in Ph.D. programs at a U.S. university:
Market Power in Homebuilding and the U.S. Housing Shortage. Anna Croley at Yale University will study housing shortages and market power in the United States. She seeks to answer the question of whether market power among homebuilders can explain the undersupply of new housing, particularly entry-level units, or whether their economies of scale reduce costs.
Empirical Evaluations of Child Care Subsidy Policies. Serena Goldberg at Yale University aims to inform the policy design of child care subsidies for the U.S. child care sector to improve access to and affordability of high-quality care while also improving the wages of care workers. First, she will evaluate the effect of reimbursement-rate policies on local maternal labor force participation, child care worker wages, child care prices, and quality of care. Then, she will simulate the effects of counterfactual subsidy policies on parents’ use of child care, worker wages, mark-ups, and the distribution of quality.
Determinants of Irregular Worker Schedules. Whitney Zhang at the Massachusetts Institute of Technology will examine the impacts of schedule instability on workers. Utilizing third-party scheduling data that is well-suited to investigate schedule volatility, she seeks to document novel facts about worker schedules, evaluate the effect of predictive scheduling and minimum wage laws on schedule-related outcomes for firms and workers, and understand the welfare effects of the regulation of schedules on workers.
Pre-tenure academics
The projects below are led by early career scholars who received their Ph.D.s within the past 8 years:
The Distribution of Federally Insured Mortgages: 1935–1975 Evidence from Local Land Records.Omer Ali of the University of Pittsburgh seeks to create systematic data on the mortgage activity of the Federal Housing Administration and Veterans Administration—two federal agencies whose policies are understood to have contributed to racial disparities in homeownership, wealth, and neighborhood opportunity in the United States. He will digitize and publicly release a dataset of FHA-insured and VA-guaranteed mortgages issued between 1935 and 1975 to assess who received these loans, how they were distributed across neighborhoods, and whether FHA and VA insurance accelerated White flight and exacerbated segregation.
Corporate Governance and Labor Market Outcomes. Andrew Baker of the University of California, Berkeley will study a new potential explanation for the declining relative earnings of workers: changes in corporate governance. He will use the Longitudinal Employer-Household Dynamics, Longitudinal Business Databases, Census of Manufacturers, and the Annual Survey of Manufacturers to analyze changes generated by activist hedge fund investors, then changes in equity-based compensation of managers, and their impacts on worker outcomes.
Unlocking Opportunity: The Long-Term Effects of EITC-led Migration on Families and Intergenerational Mobility. Jacob Bastian of Rutgers University will evaluate the role of the Earned Income Tax Credit in supporting families’ decisions to move and outcomes for both parents and children. Leveraging detailed linked administrative data—including the American Community Survey, Current Population Survey, and individual tax records—the author will conduct a longitudinal analysis of U.S. families’ migration patterns and economic outcomes.
Supply Chain Resilience and Economic Growth: Evidence from Global Shipping Disruptions. Diego Känzig of Northwestern University will provide new causal evidence on the economic implications of supply chain disruptions. Leveraging the fact that global supply chains rely on maritime trade, which depends on a few critical choke points, he will identify disruptive incidents, which are plausibly exogenous to the U.S. economy, and then isolate the market impact of the disruption using high-frequency financial data. He will then use these shipping cost surprises to identify a structural supply chain shock.
Supporting the next generation of researchers
Equitable Growth is committed to seeding and supporting the next generation of economic and social science scholars, particularly those who are interested in how their research relates to policy. Preference in this year’s application process was given to those students and early career scholars eager to work with the media and policymakers to translate their findings for a broader audience and wider impact.
We thank all of this year’s applicants and are looking forward to following along as the recipients of these awards produce results that can help shape the U.S. policy environment for years to come.
Did you find this content informative and engaging? Get updates and stay in tune with U.S. economic inequality and growth!
Estimates in this brief were generated July 21, before the announcement of trade deals with Japan and the European Union. All data and code used in the Equitable Growth tariff analysis, including instructions to update the analysis with the latest tariff rates, can be found in our Github repository.
Overview
During his first term in office, President Donald Trump in 2018 made good on a campaign pledge to introduce new U.S. tariffs on imported goods33—steel and aluminum in particular—in a purported effort to protect domestic jobs and shrink the trade deficit. Those tariffs largely targeted products from China—the world’s second-largest economy, largest single source of U.S. imports, and the United States’ preeminent geopolitical rival.
In the subsequent administration, President Joe Biden maintained many of the Trump tariffs and enacted a series of new targeted trade restrictions intended to protect U.S. industry and national security.34 The moves reignited a popular debate about the function and fairness of tariffs—a debate that weighed the costs for U.S. consumers in the form of higher import prices against the benefits for U.S. workers in the form of increased demand for domestically produced goods.
Many economists argued that targeted tariffs, and specifically those on some auto imports, for example, could benefit domestic industry without pushing the overall consumer price level higher. That logic was upended, however, when President Trump returned to the White House for his second term, promising national “liberation” through a series of sweeping tariffs against countries deemed to cheat the United States in international markets.35
Rather than targeting a narrow industry or set of commodities, as he did in his first term, the second Trump administration’s tariff policy covers nearly all dutiable imports, with some limited exceptions. Energy and potash from Canada, for example, are subject to a lower tariff rate than the overall rate imposed on goods from Canada. Separately, U.S. automakers were awarded credits they can use to offset the cost of tariffs on imported materials, though these credits will be phased out within 3 years.36 (These commodity-specific exemptions are omitted from the baseline analysis in this issue brief due to limited public data on how industries source inputs.)
President Trump’s far-reaching tariff policy is sure to have deep and often contradictory economic consequences for the United States and the world. Some U.S. industries may indeed experience a revival, as their products become more competitive in domestic markets compared to tariffed imports. But it is unclear whether those potential benefits will outweigh the costs of tariffs, not only for consumers facing higher prices but also for U.S. workers themselves.
Retaliatory tariffs enacted by other countries on U.S. exports, for example, will harm U.S. workers as foreign demand for U.S. goods dries up. Also harmful to U.S. workers are the tariffs on intermediate inputs imported by domestic industries, such as the raw and finished metals used in auto assembly.
This Equitable Growth analysis focuses on the question of how tariffs on imported inputs could raise costs for U.S. industries and workers, and how those costs might be distributed geographically. More specifically, this analysis compiles data representing:
How U.S. industries use and import commodities as inputs
How a given tariff regime could impose additional input costs on U.S. industries
How those additional costs could impact employment in key industries and geographic regions
While it does not directly calculate the cost of tariffs or their effects on employment, it does draw an empirical picture of how tariff costs could be distributed across industries, relying on a few key assumptions drawn from the available data.
In the spirit of open and equitable research, this analysis is published alongside raw and finished datasets, as well as the Stata code required to reproduce this work and generate new datasets of interest. The code grants users the flexibility to compile datasets of interest by industrial and geographic specificity and produce metrics to judge industrial exposure to imports and tariffs. (More information on the Stata code can be found in the GitHub repository.37)
Tariffs pose a particular threat to U.S. manufacturing
Our analysis finds that U.S. manufacturing industries are clearly more exposed to tariffs on intermediate inputs compared to other U.S. industries, undermining a key Trump administration argument about the effectiveness of tariffs. Manufacturing industries—including the politically and economically sensitive vehicle production sector—will face increased input costs imposed by the very tariff regime intended to boost their competitiveness with imported final goods (finished cars, in the vehicle production example).
Importantly, manufacturing would likely be the most vulnerable industrial category regardless of the commodity or country specifics of a given tariff regime. Some manufacturing subsectors may be less harmed than others, but the overall reliance of the sector on imported inputs means manufacturing will face greater intermediate tariff costs compared to other industries. Indeed, of the top 25 subsectors of the U.S. economy that are most affected by tariffs, 19 are in manufacturing. (See Figure 1.)
Figure 1
Before diving into more detail, it is important to note that this analysis produces two distinct yet important metrics to predict or track the impacts of a given tariff regime:
An industry’s imported share of inputs, or the fraction of that industry’s inputs that are sourced from outside the United States. This measure represents an industry’s exposure to tariffs generally, before the application of any specific trade policy. In this analysis, this import share value is first generated at the specific industry-commodity level, showing import intensity for each input, before being aggregated at the industry level.
Tariff costs as a percent of all input costs. After trade policy has been layered into the analysis, estimates of the costs of tariffs can be generated at the industry level, as a fraction of an industry’s total input costs. These tariff cost estimates are a representation of the hit to the profitability or bottom line of an industry as a result of a specific tariff regime. The baseline tariff regime modeled in this analysis includes all reciprocal tariffs due to come into effect in August, except those on Canada and Mexico (see the Appendix for further discussion).
Figure 2 below plots the exposure rate of certain industries to tariffs using each of these two measures. The tariff cost measure reflects tariffs both threatened and enacted by the Trump administration, as discussed further in the appendix section. The measures produce nearly identical pictures of industrial exposure to tariffs, as the diagonal plot line makes clear. As we can see, both measures show particular vulnerability for the manufacturing sector, with the tariff cost measure showing most manufacturing industries facing cost increases of 2 percent to 4.5 percent. (See Figure 2.)
Figure 2
A few outliers do exist, including the movie and sound recording industry and insurance carriers (the dark blue outliers on the bottom of the graph) and the petroleum and coal products industry (the purple dot in the upper right corner). The former two are more exposed in the import share measure compared to the tariff cost measure because while they import an unusually large amount of inputs, they are primarily nondutiable goods: Insurance products imported by insurance firms and foreign films imported by domestic movie companies. The latter is an outlier because the overwhelming majority of coal and petroleum imported inputs are sourced from countries (mostly Canada, but also Mexico and Saudi Arabia) that are subject only to the 10 percent base tariff rate, compared to the much higher reciprocal rates imposed on many other countries, including China.
Impact on upstream industries
The construction industry (the teal bubble in Figure 2) faces relatively lower tariff exposure compared to manufacturing subsectors but still substantially more than other industries. This is due in large part to imports of raw materials that are often sourced from China. The repair and maintenance industry (seen in red in Figure 2), which includes auto repair shops and commercial and household equipment repair, is also highly exposed to tariffs. Mining and fossil fuel extraction (marked in orange in Figure 2) are less exposed to tariffs than manufacturing but are meaningfully more exposed than the rest of the U.S. economy.
These three groups—construction, repair and maintenance, and mining and extraction—in addition to manufacturing, are upstream in the U.S. economy, meaning their products are often used as inputs by other industries further down a supply chain or are used as infrastructure in the facilitation of economic exchange broadly. Domestic vehicle parts manufacturers, for example, will face additional costs as they import raw metals and finished components to produce engines, transmissions, brakes, and other systems.
Some of those domestic vehicle parts will be sold (with a mark-up to account for the tariff cost) to domestic auto producers and the domestic repair and maintenance industry. This will impose additional costs on these domestic producers, on top of the tariffs they have to pay directly on their own imported inputs.
In the case of construction, additional costs of imported materials will burden the building of transportation infrastructure, as well as commercial and industrial facilities. It also means residential construction will become more expensive, and projects will slow or halt, constraining the supply of new housing and potentially putting upward pressure on housing prices. These second-order costs are not captured in this analysis but could be an important focus of future work.
Impact in highly exposed industries
The particularly high tariff exposure of manufacturing and construction industries is important for the U.S. economy not only because those industries are upstream but also because they employ large numbers of people. More than 8 million workers were employed in construction in an average month in 2025, while nearly 13 million people were employed in manufacturing industries—more than 1 in 10 U.S. workers.38
Numerous factors outside the purview of this analysis will dictate how domestic employers pass down tariff costs to workers, including union coverage, gender and race, and other workforce characteristics. The U.S. Bureau of Labor Statistics says, for example, that more than 10 percent of construction workers and 7.9 percent of manufacturing workers are covered by a union contract,39 meaning those workers might be marginally more protected against tariff-caused job losses, compared to the average worker in the U.S. private sector, where the union coverage rate is 5.9 percent.
It is unclear whether those protections will be sufficient for firms facing estimated tariff-related hits to their bottom lines of 2 percent to 4.5 percent, as is the case in most manufacturing industries shown in Figure 2. Already, seasonally adjusted employment in highly tariff-exposed industries is beginning to decline. (See Figure 3.)
Figure 3
Many highly exposed industries also are important to the stated national security goals of this and prior administrations—namely, the protection and cultivation of a domestic semiconductor and computer tech industry, including AI development, and reinvigoration of domestic energy production. Without targeted tariff carveouts, as the Trump administration has sporadically attempted, these nationally strategic industries will suffer.
Computer and electronic product manufacturing, for example, is one of most highly exposed subsectors of the U.S. economy, importing more than 20 percent of its inputs and facing an estimated more than 3.5 percent increase in total input costs because of the current tariff regime. Similarly, though domestic energy production is less exposed—a little less than 10 percent of inputs are imported and estimated cost increases are close to 1.5 percent—even a modest shrinking of profit margins could disrupt production in an industry known for its high sensitivity to prices. (See Figure 4.)
Figure 4
While these industries important to national security may see a boon in tariffs on competitor goods, those same tariffs will increase input costs and mitigate—or even eliminate—any leg up in the market, creating political complications for the Trump administration.
Geographic impact of tariffs
Also likely to produce political complications for President Trump is the geographic incidence of tariffs. A core limitation of this analysis is that U.S. Census Bureau import data only captures a shipment’s initial destination rather than its final destination, so it is difficult to know how states will be directly impacted by tariffs on various countries or commodities.
To paint a general picture of how states could be differently impacted by the current tariff regime, we use employment by industry in each state to construct a measure of relative industrial employment compositions. We determine states to be highly exposed to tariffs if a large share of state employment is in industries with high tariff exposure. Using this metric, we find that midwestern states, including Michigan, Wisconsin, and Indiana, will likely face higher tariff costs compared to other states. (See Figure 5.)
Figure 5
These high tariff costs could put pressure on many workers and their families in these politically important states, where votes on the margin have swung elections for one candidate or another in recent elections.
Areas for future research
This analysis should be seen as a foundation or a framework for estimating the potential industry-level effects of a given tariff and trade policy regime, providing several avenues for further research. The first option would be to combine this analysis of tariffs on intermediate inputs with comparable industry-level estimates of the effects of tariffs on final goods—both U.S. tariffs on imported competitor products and retaliatory tariffs imposed by other countries on U.S. industries’ exports.
Similarly, the positive effects of import substitution on domestic industry—for example, when U.S. steel producers see higher revenue as steel-consuming domestic industries reshore supply chains—are not captured by this analysis and could similarly be incorporated to provide a more complete picture of tariffs’ effects on the U.S. economy.
Additionally, tariff policy does not exist in a vacuum. The recently passed Republican budget reconciliation law will have broad and deep impacts on the U.S. economy, including on industries impacted by tariff policy.40 Many of the industries likely impacted by the budget law, including hospitals and doctors’ offices hurt by $1 trillion in Medicaid cuts,41 are not particularly exposed to tariffs directly. But the medical equipment and supplies manufacturing industry is both highly exposed to tariffs and potentially harmed by the law’s Medicaid cuts due to slowing demand for equipment from hospitals and doctors across the country.
As discussed above, workforce characteristics—including union coverage, race and gender identity, and immigration status—could determine how easily U.S. employers pass down tariff costs to workers in the form of stagnant wages, layoffs, or firm closures. Incorporating industry-level workforce characteristics from the Current Population Survey or other data sources would greatly improve the predictive capacity of this analysis.
Conclusion
This baseline prediction of how U.S. industries will be impacted by tariffs on imported inputs finds the manufacturing sector is highly exposed to tariffs, despite some exemptions granted by the Trump administration. Also relatively vulnerable to tariffs are construction, mining and energy production, and repair and maintenance.
The more than 23 million people employed in 2024 in these more exposed industries could face wage stagnation or even job losses as their employers seek to pass down the costs of tariffs onto workers. Considering the geographic concentration of the impact of the tariffs in midwestern and other electorally important states, the impact of the Trump “liberation” tariffs could reach beyond the economy or the specific industries most vulnerable to trade policy shifts.
Future research is needed to expand and further detail the potential impacts of tariffs and trade policy. This analysis can be used as a stepping off point for many avenues of future study, as it offers a novel interlinked dataset and code accessible to other researchers.
The Washington Center for Equitable Growth’s recently launched U.S. Inequality Tracker uses data from the U.S. Bureau of Economic Analysis to show how income and wealth inequality have evolved in the 21st century. Our analysis of the data through 2023 shows that income inequality has been relatively stable over this time span, while wealth inequality has grown in that same period.
But the Bureau of Economic Analysis does not keep track of capital gains in the U.S. economy, or increases in the value of an asset, such as stocks and property. When an asset is sold, the profits or losses on that asset are called realized capital gains, whereas when an asset increases or decreases in value but is not sold off, it is referred to as unrealized capital gains. Capital gains in the United States are large and are distributed very unequally along the income distribution, with the bulk of them going to the very top.
Indeed, we find that adding capital gains to the BEA income series shows that the share of income earned by the top 10 percent of households between 2002 and 2021 actually increased by 5 percentage points, rather than the 1.1 percentage points shown in the BEA data alone.
To reach this finding, we worked with a team of economists—the Federal Communications Commission’s Cole Campbell and the University of Illinois at Chicago’s Jacob Robbins and Sam Wylde—who recently put out a working paper tracking capital gains. Their team shared estimates of U.S. capital gains from 2002 to 2021 for three income groups: the bottom 50 percent of households, the upper 40 percent of households (those in the 50th percentile to 90th percentile), and the top 10 percent of households. Their measure, which they call pure capital gains, includes both realized and unrealized capital gains.
In 2021, pure capital gains on assets held by U.S. households came in at $16.2 trillion, making them the single largest component of income in that year. But capital gains are highly volatile because of conditions in the stock market and can sometimes yield enormous losses, particularly amid economic downturns. Adding capital gains to other forms of income can thus both increase and decrease inequality. During recessions, when asset values plunge, adding capital gains to income measures will tend to decrease income inequality, with the reverse happening during booms.
To create more stable and interpretable income trends, we used the 5-year running average of pure capital gains to make our calculations about their impact on income inequality. Yet even this measure is volatile, as shown in Figure 1. During the Great Recession of 2007–2009, for example, they reached lows exceeding -$2.5 trillion in 2017 dollars, while they reached highs of close to $5 trillion in 2022. (2017 is the index year for the Personal Consumption Expenditures Price Index, which is a key measure of U.S. inflation and the official deflator for BEA’s Personal Income series, which we use here.) (See Figure 1.)
Figure 1
Figure 2 below shows the share of income earned by U.S. households in the top 10 percent over time, both with and without pure capital gains. To make the numbers comparable, we use a 5-year running average of other forms of income as well, which greatly reduces the variation in this series.
When capital gains are not included, the share of income earned by the top 10 percent increased 1.1 percentage points over the two decades studied, from 36.9 percent to 38 percent. With capital gains, the difference is more pronounced, with the share of income earned by the top 10 percent of households increasing from 37.1 percent in 2002 to 42.1 percent in 2021. (See Figure 2.)
Figure 2
As Figure 2 shows, the series with capital gains included was quite volatile over this time, with the top 10 percent’s share dipping as low as 34 percent before bouncing back in the early 2010s. Unsurprisingly, this was a result of asset values crashing during the Great Recession.
These findings echo estimates from the Congressional Budget Office’s distribution of income report. This report, which is currently only updated through 2021, also tracks U.S. income inequality over time but uses a different income concept than the Bureau of Economic Analysis and includes realized capital gains. In the CBO data series on income after taxes and transfers, the top 10 percent’s share of income increased by 5 points between 2002 and 2021.
Overall, these findings reinforce that income inequality has been high but stable through the 21st century—but there are serious warning signs just beneath the surface. We pointed to two such warning signs in our initial analysis: First, income support programs have propped up U.S. households in a period of weak wage growth, and second, that these government transfers have been increasing as a share of income, implying that economic welfare has increased much more slowly for the bottom 50 percent than for the top of the distribution.
Rising levels of capital gains wealth is another warning sign. Capital gains significantly increase the wealthiest households’ share of income and are growing over time. All these warning signs suggest U.S. income inequality will rise further in coming years.
Did you find this content informative and engaging? Get updates and stay in tune with U.S. economic inequality and growth!
The 2025 budget reconciliation law that was enacted earlier this month is a sprawling piece of legislation, touching almost every corner of the federal budget and the U.S. economy. It will take years for all the consequences of the law to be fully felt and understood.
A preliminary economic analysis, however, reveals 10 especially harmful policies that were included in the final bill and which run counter to the evidence on what spurs equitable economic growth. Below, we detail each of them and their implications for Americans and economic growth over the next decade and beyond.
Phony populism
Though the so-called populist tax provisions in the new law—partial deductions for tip income, overtime income, auto loan interest payments, and a larger standard deduction for some seniors—got a lot of attention, they are overly complicated, will benefit few U.S. workers, and will expire after 2028. These tax provisions are not pro-growth because very few workers will be able to work more in order to qualify (find a job in the right industry, for instance, or have the right amount of income and tax liabilities, and have control over their hours and pay).
In fact, by making these provisions effective in 2025, the bill’s authors are rewarding economic decisions that have already been made—the definition of a tax windfall—which simply generates a (small) political treat for favored constituencies. That is, of course, assuming an under-resourced IRS can quickly get these policies up and running while protecting against any game-playing, including attempts to recategorize ordinary income as tip income, which will be a challenge.
Slashing the Affordable Care Act
The 2010 Affordable Care Act ushered in a new era for health care in the United States: protection for those with preexisting conditions, state marketplaces with affordable insurance options, and an expansion of Medicaid. The result was near-universal coverage and a bent cost curve, freeing up space in families’ and governments’ budgets for other productive investments.
While the ACA insurance reforms and marketplaces are both still intact, the reconciliation law cut Medicaid by $1.15 trillion, a 15 percent reduction in federal spending on the program. Enhanced premium tax credits for marketplace plans also were allowed to expire, which will lead to a spike in premiums for millions of middle-income families. These provisions will lead to an estimated 16 million Americans losing their health insurance coverage over the next decade—11.8 million from Medicaid cuts and 4.2 million from the failure to extend the premium tax credits.
Increased hunger
Similar to the Medicaid cuts, the reconciliation law severely curtails the federal government’s contribution to the Supplemental Nutrition Assistance Program, which, in 2023, provided food stamps to an average of 42 million Americans per month. It is unlikely that states will be able to make up for the $186 billion reduction in federal aid. The official estimate is that more than 22 million families will lose some or all of their SNAP benefits, effectively raising food costs for many families already struggling under high prices.
It is not just SNAP beneficiaries who will suffer; their local economies will feel the ramifications as well. Recent research from Equitable Growth grantee Robert Manduca of the University of Michigan finds that nutrition assistance and Medicaid are a major contributor to the economic base of local communities, or the portion of its economy that brings money into a region from the outside world and then circulates locally, creating jobs and additional economic activity.
Indeed, Manduca finds that the cuts in the reconciliation bill are the economic equivalent for many states and congressional districts of losing a big chunk of their largest private industry. (See Figure 1.)
Figure 1
Large tax cuts for the wealthy
Instead of using the savings from cuts to Medicaid and nutrition assistance to, say, pay down the multitrillion dollar federal debt, the law uses the money to partially offset a huge tax cut that disproportionately benefits the rich. The bill’s authors in the Republican-led U.S. Congress didn’t just extend the expiring provisions of the 2017 Tax Cuts and Jobs Act, which was the stated rationale for the reconciliation bill, but instead went on a tax-cutting spree, doling out more than $5 trillion in tax cuts over the next 10 years—not including the added cost of interest payments on the debt or the potential cost of a future Congress extending temporary tax breaks, which often happens.
The signature provision was a $2.2 trillion cut to marginal income tax rates. The top bracket, for example, is now permanently set at 37 percent, rather than the 39.6 percent from the Obama and Clinton eras. Indeed, the richest Americans are some of the law’s biggest winners. The average household in the top 0.1 percent of earners, making more than $2 million annually, will get a $308,763 tax cut in 2027. Millionaires receive 21 percent of the tax benefits that year, which amount to more than $113 billion—roughly equal to the average annual cut to Medicaid.
This combination of tax cuts for the tippy top of income earners and spending reductions for programs that aid low-income Americans makes the new law the largest upward transfer of wealth in a tax and budget bill in at least the past 40 years.
Indefensible tax giveaways
The budget law also gifted the wealthiest Americans additional, completely unjustified hand-outs. Three of the most egregious examples, which Equitable Growth has written about elsewhere, are a permanent extension of the 199A qualified business income deduction, a permanent increase in the estate tax exemption, and an enhanced qualified small business stock exclusion. Almost all of the benefits of these three policies—which have a total combined cost of $966 billion—accrue to those in the top decile of income earners, and a large majority of the benefits go to the top 1 percent.
In particular, pass-through business owners, including venture capital investors, are some of the law’s biggest winners, since they are uniquely positioned to take advantage of these tax breaks. What’s more, the two most concrete proposals from President Trump on raising taxes on the rich—crackdowns on the carried interest loophole and on a tax break used by owners of sports teams—both fell out of the final bill.
Even worse, while the law severely restricts eligibility for many social programs, creating onerous layers of administrative burdens, the legislation’s authors made qualifying for these tax breaks easier for the rich. Their explanation is that these cuts will spur investment and eventually trickle down to workers, but these views fundamentally misunderstand how economic growth works.
Budget gimmicks
While the sausage-making of legislating has always been messy, the Republican-led Congress took an especially untransparent approach to this law that will likely further erode adherence to institutional norms and ultimately reduce trust in Congress. Most notably, the Senate deployed a novel “current policy baseline” to fraudulently conceal $3.8 trillion in tax cut extensions. This unprecedented abuse of the budget reconciliation process—a process originally designed to reduce long-term deficits—paves the way for a permanent deficit-financed tax cut that will heighten the fiscal risk facing the nation for decades to come.
These and other budget gimmicks send an unfortunate signal to investors and consumers here and abroad about the United States’ ability to responsibly manage its fiscal affairs and remain the leader of the global financial system.
Underappreciated macroeconomic consequences
There has been a lot of focus lately on the Federal Reserve keeping interest rates elevated because of inflationary pressure from tariffs. Meanwhile, there has been less attention on how a budget bill that adds $3.4 trillion to the deficit over the next 10 years will also put upward pressure on prices and could cause even higher interest rates. Spending on this scale while the U.S. economy is at near full employment is a recipe for a short-term economic sugar-high but long-term weakness.
This is just one reason why economic modelers don’t expect the tax cuts to be pro-growth—despite their proponents’ arguments—because any increase in economic activity will be counteracted by the risk of inflation and the Fed reacting accordingly by raising its prime rate. As much as President Trump wants Fed Chair Jerome Powell to lower interest rates, in the face of tariffs and a massive tax cut, the Fed’s hands will be tied.
At the same time, the reconciliation law provides roughly $170 billion for the Trump administration’s mass deportation efforts, including an unprecedented budget increase for U.S. Immigration and Customs Enforcement. Economic evidence demonstrates a labor force contraction of the scale currently planned by the Trump administration will have negative effects on native-born workers and the economy as a whole, reducing total employment and economic growth.
Missed opportunity on child care
The Section 45F tax credit for employer-provided child care is a flawed policy that has not effectively expanded access to affordable child care. Fixing the broken child care market in the United States requires more than an employer subsidy or a modest and selective increase in the Child Tax Credit. Rather, a comprehensive approach that includes higher wages for child care workers and more high-quality child care facilities is needed.
Unfortunately, the budget law makes just a few small improvements to the 45F tax credit and to the nonrefundable Child and Dependent Care Tax Credit, as well as expanding a different tax credit for paid family and medical leave—a woefully inadequate effort for addressing the scale of the problem.
One especially clear example of how this works is in the pharmaceutical industry, which took advantage of outsourcing loopholes embedded in the 2017 Tax Cuts and Jobs Act. Loosening taxes on outsourcing is part of this administration’s larger, misguided goal of unwinding the global tax deal negotiated by the Biden administration, which would have created a long-overdue global minimum tax on multinational corporations.
Politically targeted ‘pay-fors’
Despite the reconciliation law being an overall tax cut,some unlucky constituencies will see their taxes raised by the legislation. These politically targeted “pay-fors” include research universities, legal immigrants, blue-state homeowners, and clean energy producers, investors, and consumers.
Perhaps the most destructive of these tax increases are those targeting Biden-era clean energy tax credits. Though saving some money in the short run, conceding a major front in the fight against climate change will likely cost the country dearly over the long term.
It doesn’t take a degree in political science to see the pattern. Nor does it take a degree in economics to know that designing tax policies purely to score political points is bad for both equity and growth.
Conclusion
From the beginning, this piece of legislation was built on the false premise that the 2017 Tax Cuts and Jobs Act—and the many regressive tax cuts that came before it over many decades—spurred economic growth. But any policymaker who still believes that is ignoring the economic evidence, which has definitively shown that these kinds of lopsided tax cuts neither pay for themselves nor boost wages, despite continued claims to the contrary.
Yet pro-growth tax reform is possible. The expiration of many of the 2017 tax cuts this year presented a unique opportunity to write a simpler and more equitable tax code that raised needed additional revenue while encouraging economic competition and innovation that boosts productivity and growth. This budget law moves in the opposite direction on every front, with the 10 policies above leading the way.
Did you find this content informative and engaging? Get updates and stay in tune with U.S. economic inequality and growth!
In a recent working paper, Equitable Growth grantee Robert Manduca of the University of Michigan, Ann Arbor demonstrates that government transfers make sizable contributions to local economies in much of the United States—and, in many places, comprise a larger part of the local economic base than the largest local private industry. This finding is relevant following the passage of the Republican budget reconciliation bill, which makes extensive cuts to Medicaid, the Supplemental Nutrition Assistance Program, and other social programs. In addition to direct impacts on Americans’ access to health care and food, the cuts to social programs will prevent money from circulating among local businesses in affected regions and damage these regions’ economies.
The economic base of an area is typically defined as the portion of its economy that brings money into the region from the outside world, which then circulates through the local economy. In his working paper, Manduca provides the example of a manufacturing plant that exports its goods to an international market, but he also points out that the earnings entering and circulating in a region do not come exclusively from exporting locally produced goods.
Indeed, payments to individuals from national or state governments or from private sources, such as dividends, also contribute to the local economic base. From this perspective, the loss of such transfers to households within a region also are a reduction of its economic base and can be compared to the impact of losing private industries in the area.
In several congressional districts, Manduca actually finds that the resulting loss to the economic base from cuts in the Republican reconciliation bill will far exceed the revenue generated by the largest local private industries. In Kentucky’s 5th congressional district, for example, which has historically been ranked as one of the most impoverished districts in the United States, the losses in transfers income will be 3.5 times larger than the economic contributions of the district’s most profitable private industry, motor vehicles manufacturing. The same is true for many other districts across the United States. (See Figure 1 for a handful of examples.)
Figure 1
Even in places where the cuts represent a relatively smaller percentage of the economic base, transfers are still significant contributors to the local economy. These data reinforce how vital government transfers are to local economies and how some congressional districts will experience severe economic damage as a result of the reconciliation bill—including districts whose representatives voted in favor of passing the bill. Not only will the cuts to social programs affect the specific households that will lose out on access to health care and nutrition assistance (among other programs), but the reverberations will be widespread across many local regions and their inhabitants, too.
Download the dataset used to make the calculations in this column. Derived from Manduca’s research, it compares the projected losses from these cuts to government transfers with the contributions of private industries across U.S. congressional districts. The dataset, ranked by which districts will be hurt most, can be used to see how the reconciliation bill may financially impact every congressional district in the United States and how the cuts compare to each region’s most important industries (the first and second largest private industries in each district).
To dig deeper on the research or methodology, see Manduca’s original column and working paper.
Did you find this content informative and engaging? Get updates and stay in tune with U.S. economic inequality and growth!
Generative artificial intelligence promises to profoundly reshape labor markets, much like previous automation waves did, but with clear differences. Unlike earlier technologies, such as computerization, which primarily automated routine administrative tasks, or robotics, which impacted manual tasks in manufacturing environments, generative AI targets cognitive tasks.42
Exemplified by commercially available large language models, or LLMs, such as GPT-4, generative AI can execute complex, nonstandardized functions that are traditionally reliant on human judgment. This includes tasks such as real-time scheduling, dynamic rerouting of transportation resources, and interpreting customer inquiries in logistics operations. Indeed, major global logistics providers already have successfully leveraged generative AI to automate repetitive cognitive tasks, resulting in notable operational efficiencies and responsiveness.43 Additionally, companies across the logistics sector have utilized generative AI to automate customs documentation, streamline inventory management, and optimize freight networks.44
While generative AI can enhance traditional logistics processes—in ways ranging from demand forecasting and supplier negotiations to network design and contract analysis—its broader implications depend on the worker tasks and economic incentives for adoption. Occupations within supply chain and logistics, particularly those involving routine yet cognitively intensive tasks such as billing, payroll, and data entry, are uniquely positioned for potential disruption.
The degree to which an occupation is potentially impacted by generative AI—a scenario referred to as AI exposure—depends on the susceptibility of tasks within occupations to automation or acceleration through generative AI technologies. Scholars have developed various metrics leveraging different methodologies and data sources, including expert assessments, evaluations of patent-related tasks, and analyses of tasks based on required capabilities, to determine the rate of AI exposure.45
Our research finds that occupations within the U.S. logistics sector differ markedly in their vulnerability to generative AI, with cognitive-intensive administrative roles exhibiting particularly high vulnerability.46 For instance, among the more than 200,000 logistics managers—encompassing operations managers, warehouse managers, transportation managers, and similar titles—more than 90 percent of their tasks are susceptible to AI-driven automation, with nearly 100 percent of these classified as core activities, underscoring a substantial displacement risk. By contrast, bus and truck mechanics—a workforce exceeding 70,000 workers—exhibit literally 0 percent task exposure, highlighting the wide gulf in AI automation risk across the logistics ecosystem.
In this essay, we explore the mechanisms that may shape generative AI’s potential to transform the U.S. logistics workforce. In particular, we discuss how the adoption of generative AI might differentially impact various worker roles and explore the potential consequences for workers, including which occupations could have the greatest difficulty transitioning to new roles if disrupted by AI. We conclude by discussing a range of policy implications, outlining how strategic interventions can ensure that the productivity benefits from generative AI adoption translate into widespread economic gains rather than exacerbating U.S. workforce inequalities.47
Labor force characteristics of the U.S. logistics sector
As of May 2023, the Transportation and Warehousing industry (or NAICS 48-49, in U.S. Bureau of Labor Statistics terms) is broadly representative of the logistics sector and employs approximately 6.6 million workers in the United States.48 Since 2010, this sector has experienced consistent employment growth, driven by rising consumer demand and the increasing complexity of supply chains. Table 1 below details the primary subsectors within the Transportation and Warehousing industry, highlighting their distinctive roles in the broader U.S. logistics landscape. (See Table 1.)
Table 1
Within these subsectors, employment is heavily concentrated in a handful of key occupations. Importantly, the potential effects from AI exposure may be concentrated within these occupations. Table 2provides an overview of the largest occupations by employment in the Transportation and Warehousing industry. (See Table 2.)
Table 2
As Table 1 and Table 2 make clear, the U.S. logistics sector comprises a variety of subsectors and occupations—some heterogenous across industries, such as pilots, and others cross-cutting, including stock and material movers. The impact of generative AI on these occupations will vary substantially based on the tasks that primarily make up each job. We turn to this AI exposure next.
AI exposure in the U.S. logistics workforce
Our analysis begins with a detailed list of tasks performed by workers in logistics occupations, captured through the Occupational Information Network, or O*NET.50 O*NET comprehensively documents these tasks, including their relative importance to job performance, how frequently each task is performed, and whether each task is “core” or “supplemental.”51 Core tasks are central to an occupation’s primary responsibilities, while supplemental tasks play a supportive, yet less fundamental, role.
The distinction between automating core versus supplemental tasks is crucial, as research underscores that automation of core tasks typically has more significant implications for occupational stability and employment outcomes.52 Similarly, as various scholars highlight, task frequency is an important differentiator of AI exposure across occupational tasks.53 Task frequency directly influences the cumulative economic returns of automation by highlighting repetitive tasks that yield substantial productivity gains.
Explicitly integrating task frequency alongside task importance and the core-supplemental classification can therefore yield a more robust, economically meaningful assessment of AI exposure. Figure 1 below illustrates the relationship between task importance and task frequency within occupations, displaying that task frequency exhibits substantial independent variation—though also showing it positively correlates with importance, too. (See Figure 1.)
Figure 1
We utilize our frequency-weighted AI exposure metric to calculate AI exposure by weighting tasks according to the estimated number of times they are performed annually, based on frequency data reported in O*NET. This approach54 provides a more economically grounded and practically relevant measure, aligning closely with real-world automation incentives in U.S. supply chain and logistics occupations. This refined exposure metric can better identify the tasks and roles most susceptible to generative AI-driven changes, thus supporting proactive policy formulation and strategic workforce planning.
Logistics sector occupational impacts of generative AI
Understanding generative AI’s occupational impacts within the logistics sector requires a detailed analysis across specific roles and transportation modes. Within the logistics sector, there are specific occupational categories, including truck and water transportation, support activities for air transportation, and warehousing and storage, among others. For each of these categories, we calculated AI exposure scores, derived from our modified AI exposure methodology described above, and weighted them by task frequency. (See Table 3.)
Table 3
What clearly emerges from Table 3 is that different transportation modes within the U.S. logistics sector—for example, freight trucking, water transportation, and pipeline transportation—vary significantly in their exposure to generative AI disruptions. Freight trucking, characterized by dynamic routing, real-time scheduling, and frequent documentation requirements, shows particularly high potential for generative AI exposure, especially in administrative roles. By contrast, water and pipeline transportation, which involve more specialized manual tasks and fewer frequently repeated cognitive activities, exhibit relatively lower immediate susceptibility—though predictive maintenance and monitoring tasks remain promising AI applications.
Notably, rail, freight, and logistics services—and particularly freight transportation arrangement services and customs brokering services—exhibit the highest exposure of any logistics industry analyzed here. With more than 75 percent of tasks potentially decreasing in duration by 50 percent or more, this industry could see a reduction in total employment over the next decade while maintaining its productivity level and increasing its profitability. Although some occupations might maintain employment levels after adopting productivity-enhancing technological innovations, widespread disruption at the sector level inevitably leads to workforce displacement.
Consequences of AI exposure for logistics-sector workers
While exposure to AI offers significant benefits to firms in terms of reduced labor costs and improved productivity, the downside for workers—particularly those in vulnerable roles—includes potential job displacement and wage suppression. Figure 2below introduces this dimension by showing the variation in average annual earnings versus LLM exposure by industry. (See Figure 2.)
Figure 2
The blue bubbles in Figure 2 reveal a striking bifurcation within the trucking and ground-freight subsector. On one hand, truck drivers—by far the largest occupation, employing more than 1 million people—earn relatively modest wages and face relatively low AI exposure, implying limited technical potential or economic incentive for automation. On the other hand, a much smaller but substantially higher-earning group of logistics managers—such as operations, warehouse, and transportation managers, totaling more than 100,000 employees in this sector alone—sits at the very top of the LLM-exposure index, with more than 90 percent of their tasks susceptible to AI. This contrast underscores how, within the same subsector, firms may eschew automating low-wage, low-exposure roles yet aggressively target the high-wage, high-exposure managerial positions for AI-driven productivity gains—along with the attendant displacement of jobs or wage-pressure risks.
Much of our analysis so far has focused on the direct automation of workplace tasks, but indirect exposure to AI also merits consideration. Take, for example, administrative assistants who manage logistics and scheduling for warehouse operations. Even if warehouse loaders have limited direct AI exposure, administrative staff increasingly use AI-driven software to optimize inventory placement and shipping sequences. Predictive models can ensure that frequently ordered items are placed near loading docks, significantly reducing retrieval time for warehouse loaders. Thus, productivity in occupations without direct task automation can improve substantially due to spillovers introduced elsewhere.
This reveals two lenses through which to evaluate AI automation within an industry: one where workers’ tasks are automated to decrease labor hours demanded of that worker type (or to free up worker capacity), and one where the quality of task execution is improved by automation, allowing for efficiency spillovers.
Occupation-specific vulnerabilities to AI adoption
Now that we have showcased the variation across logistics subsectors and occupations of AI exposure, we turn to how specific occupations may be vulnerable to automation and thus to AI adoption. Deeper dives into two occupations that are highly exposed to AI within the logistics sector help illuminate potential vulnerabilities.
Two highly exposed occupations that are heavily represented in logistics industries are customer service representatives and dispatchers (except police, fire, and ambulance). These two occupations each score the maximum value in our exposure index—100 percent—meaning that all their typical tasks are exposed to LLM-powered solutions. This makes these occupations highly vulnerable to job displacement or wage losses as a result of AI adoption.
Let’s turn first to the example of customer service representatives.
Logistics customer service representatives
The typical earnings of customer service representatives—an annual median of $39,680 in 2023—are low, compared to peer occupations requiring similar distributions of skill, knowledge, abilities, and work activities.55 If displaced, these workers may be relatively more likely to transition to jobs with wages comparable to those they are accustomed to earning. Yet, to the extent that a displacement shock from AI affects similar occupations, these transition options could simultaneously become restricted, placing significant pressure on wages and employment for disrupted customer service representatives.56 (See Figure 3.)
Figure 3
Job displacement in customer service seems likely, as core tasks such as “confer with customers by telephone or in person to provide information about products or services, take or enter orders, cancel accounts, or obtain details of complaints” and “keep records of customer interactions or transactions, recording details of inquiries, complaints, or comments, as well as actions taken”were already being automated for telephone and virtual support lines prior to the increased availability and accessibility of generative AI. Now, AI automation in customer service is simply a matter of paying for one of the many available services.57
Unfortunately for these workers, their next potential occupation may not be a safe harbor from displacement as a result of future automation. When calculating the average exposure level (weighted by historical occupational transition shares, or the expected level of exposure across the set of likely alternative positions), we find that the statistical worker in fields similar to customer service across the U.S. economy has a 95.22 percent AI exposure. Though this is less than the 100 percent score we found for customer service representatives, it is not low enough that these other workers should feel insulated from further disruption. Even if these workers deviate from traditional career pathways, similar occupations tend to be more exposed than the economywide median. (See Figure 4.)
Figure 4
The widespread adoption of automation solutions may therefore lead to disruptions across this occupational cluster. If productivity gains do not lead to compensating demand for labor (fewer workers per task, but a greater volume of tasks to be performed), then we may expect downward pressure on wages, as workers compete for a limited number of job opportunities.
Logistics dispatchers
Our second example occupation—dispatchers (except police, fire, and ambulance)—earned a median wage of $46,860 in 2023. Dispatchers are paid comparable wages to workers in peer occupations requiring similar distributions of skill, knowledge, abilities, and work activities. (See Figure 5.)
Figure 5
We might expect workers transitioning involuntarily (due, for example, to a technological shock) from employment in one occupation to enter a new occupation at or below their current percentile of earnings. In other words, we expect a worker at the 90th percentile in one occupation to be offered a position with pay below the 90th percentile in their new occupation due to their comparatively lower experience in their new role. If so, then Figure 5 suggests that displaced workers at the top of the income distribution in this particular occupation may face significant challenges in maintaining their level of earnings after an occupational transition.
Despite typically earning more than customer service representatives, dispatchers are already subject to automation. This makes their replacement by AI just as technically feasible—and even more incentivized from an employer’s standpoint, as the potential wage savings are greater.
Additionally, the quality of dispatchers’ work has greater influence on the productivity of their colleagues within firms, compared to customer service representatives. This means that quality is an important metric to consider. If generative AI technologies produce worse results than a human, those effects will be magnified, causing a ripple effect throughout organizations. Likewise, if generative AI proves superior to a human dispatcher, then the potential savings may exceed the compensation of the displaced workers, as affiliated workers gain efficiency benefits from improved coordination.
Importantly, the tolerance for AI-committed errors will vary by setting, depending on the cost of the failure in relation to the nature of the error committed, the existing rate of human error, and the feasibility of identifying and perhaps correcting errors. This variance could be across industries—for instance, a low tolerance for error in piloting aircraft versus in warehousing—as well as by the position of the task in the value chain. Errors in delivery, for example, are potentially costly both from lost productivity and because they affect the customer experience, while errors in optimal storage might affect costs through productivity alone.
Like customer service representatives, dispatchers also face challenges in moving to jobs less exposed to AI, though dispatchers are slightly better off than customer service representatives. Our research indicates that similar jobs to dispatchers also are highly exposed to AI, though not as exposed as 100 percent, which is the score we found for dispatchers. (See Figure 6.)
Figure 6
If diverse industries adopt automation at varying rates, displaced workers may be displaced multiple times over the course of a few years. Each time, competition for similar jobs would become steeper, as a growing number of workers fight to the bottom of the earnings distribution. Much worse would be a scenario where many similar industries adopt automation technologies simultaneously.
Economic and operational incentives for logistics firms to adopt generative AI
A firm’s decision to adopt generative AI in logistics, as in any other industry, is ultimately driven by economic and operational incentives. Logistics operations are typically labor-intensive, involving substantial labor costs associated with moving and managing goods. Consequently, there are considerable economic incentives to deploy AI to automate high-frequency, routine tasks—such as documentation, tracking, and inventory management—particularly in sectors where labor constitutes a significant portion of operational expenses.
Labor costs can further shape AI adoption decisions. Higher-wage roles in logistics, such as transportation managers or supply chain analysts, often involve cognitive tasks highly suited to AI tools. Automating or augmenting these tasks can deliver substantial cost savings and productivity improvements for firms. Conversely, lower-wage roles typically offer fewer immediate incentives for AI adoption, not only because these positions often entail tasks less amenable to automation but also due to limited immediate economic returns. Furthermore, retaining employees in these lower-wage roles could enhance overall efficiency through productivity spillovers, reflecting traditional capital-labor complementarities.
A relevant quantitative example demonstrates the varied impacts of AI assistance on customer service agents’ handling times, depending on task complexity.58 The researchers found that AI significantly improved efficiency for moderately uncommon problems, suggesting substantial benefits through reduced labor costs per interaction. Conversely, AI had minimal impact on very routine or extremely rare problems, implying potential scenarios where AI implementation and maintenance costs might outweigh benefits for firms.
The return on investment for AI adoption in logistics, therefore, similarly depends on specific task characteristics and the corresponding efficiency improvements that AI might realistically achieve in the near term, considering uncertainty about the long-term technical potential of AI.
An important obstacle to AI adoption is resistance from inside or outside of firms. Internally, the resistance might come from decision-makers themselves, who could be put in a position to impact the scope and amount of work available to them by choosing whether to adopt AI. Similarly, lower-wage workers are more likely to be represented by a labor union that will advocate on their behalf against any possible adverse impact of AI adoption.
Policy and regulatory considerations of generative AI adoption
Policymakers face significant challenges in managing U.S. labor market disruptions arising from generative AI. Effective regulatory frameworks must balance the promotion of innovation and productivity gains with safeguarding employment and ensuring equitable outcomes.59
One option policymakers might consider is establishing comprehensive worker-transition policies, including robust reskilling and upskilling initiatives. While the existing literature highlights the potential importance of targeted training programs to equip displaced workers with skills aligned with emerging labor market needs, recent analyses suggest caution in this area, noting mixed evidence regarding the effectiveness of traditional retraining efforts.60 Consequently, policymakers should ensure these retraining initiatives are thoughtfully designed, evidence-based, and specifically adapted to address the unique challenges posed by AI-driven displacement.
Additionally, transparency standards for reporting employment changes due to AI adoption are essential. Developing standardized frameworks can facilitate the systematic collection and dissemination of data on job losses, job creation, and shifts in occupational demand resulting from generative AI. Such transparency helps policymakers and stakeholders alike monitor the impacts of generative AI more accurately, enabling timely and informed interventions.
Relatedly, policymakers can also leverage existing U.S. Bureau of Labor Statistics data collection methods or develop new indicators to identify early warning signs of occupational disruptions from AI. Recent literature highlights the utility of analyzing job postings to detect shifts in skill demands and potential vulnerabilities related to AI exposure.61
Additionally, drawing on the experience of existing programs—such as the Trade Adjustment Assistance Program,62 a federal initiative administered by the U.S. Department of Labor that provides training, reemployment services, and income support to workers displaced by increased importing of goods—can offer valuable insights for designing AI-specific programs. This approach would be particularly useful for creating incentives that encourage businesses to transparently share employment-impact data without inadvertently motivating executives or shareholders to accelerate AI adoption for short-term gains.
Moreover, policies incentivizing firms toward labor-complementing rather than labor-replacing AI technologies could help mitigate employment losses. Worker decision rights around technology adoption could help drive such incentives. Encouraging investment in AI technologies that enhance human productivity, such as predictive analytics and workflow automation tools, rather than entirely substituting human roles, can help maintain employment levels while driving productivity improvements.
Possible policy levers in this area range from tax credits focusing on specific types of technological investments, emphasizing labor-complementing productivity gains, to reskilling programs (for example, accelerating transitions into new occupations for at-risk workers or helping workers gain skills that can help widen their scope of potential transition options to increase their robustness to technological disruption), as well as specific tax credits contingent on payroll targets, such as linking capital investment to wage enhancement.
Regulatory policies must also consider the competitive dynamics introduced by generative AI. Data are increasingly recognized as a critical complementary asset for leveraging generative AI effectively.63 Policies promoting equitable access to relevant data, such as public data assets or interoperability standards, and those that mitigate monopolistic tendencies in data ownership and processing, such as facilitating market-based purchasing of computing resources, can ensure broader economic benefits and prevent entrenched advantages among incumbent firms. Ensuring a competitive landscape by AI adopters could enable downward pressure on prices, thus exerting an upward force on output and hence labor.
Finally, strategic regional and sector-specific economic planning, informed by detailed analyses of occupation-specific AI exposure, is essential. Policymakers should proactively identify vulnerable communities and occupations, facilitating targeted support through direct interventions, economic diversification initiatives, and stimulus for job creation in sectors less exposed to AI disruption. The geographic concentration of employment in logistics-related occupations makes regional strategies more urgent. For instance, BLS data show a much higher concentration of transportation, storage, and distribution managers in some states versus others,64 which could make those local labor markets more vulnerable to disruption in occupations with correlated technology exposure.
Integrating these policy considerations can help governments and stakeholders navigate the complex labor market dynamics posed by generative AI, fostering inclusive growth and workforce resilience in the U.S. logistics sector.
Conclusion
This essay provides an assessment of generative AI’s potential impacts within the U.S. logistics and supply chain sector, highlighting key quantitative findings and clarifying implications for policy and industry stakeholders.
Our analysis demonstrates that roles within the U.S. logistics sector exhibit starkly divergent AI-automation risk profiles. Among the more than 200,000 logistics managers—including operations managers, warehouse managers, transportation managers, and similar titles—more than 90 percent of tasks are susceptible to AI-driven automation, with virtually all of those classified as core activities, signaling a substantial displacement risk. In contrast, bus and truck mechanics—a workforce exceeding 70,000—face virtually 0 percent task exposure, underscoring the wide gulf in technical potential and economic incentive for automation across the logistics ecosystem.
These findings emphasize the necessity of nuanced, role-specific workforce interventions and strategic adoption of generative AI technologies. Importantly, individual sectors within the logistics industry also exhibit marked differences in AI exposure. Freight transportation, for example, demonstrates particularly high vulnerability, whereas warehousing and storage faces relatively lower susceptibility. Mobility within occupational clusters and across salary ranges further complicates worker transitions, necessitating targeted policy responses that address potential dislocation and ensure sustainable career pathways.
Policymakers must also consider measures to address long-term earnings losses for displaced workers. Comprehensive policies, including wage insurance, transitional income support, and targeted reskilling and upskilling initiatives, are crucial to mitigate economic hardships. Future research should continue tracking employment outcomes and productivity changes post-AI adoption to refine these policy strategies and improve their effectiveness.
About the authors
Christophe Combemale is an assistant research professor at Carnegie Mellon University’s Department of Engineering and Public Policy, where his research focuses on technological impacts on workforce skills and organizational structures. His recent work explores labor implications of generative AI and industrial transitions across multiple sectors. He is also CEO and principal partner of Valdos Consulting, specializing in techno-economic modeling to support market, technology, and workforce strategy.
Laurence Ales is a professor of economics at Carnegie Mellon University’s Tepper School of Business. He received a Ph.D. in economics from the University of Minnesota in 2008 and a B.S. in physics from the University of Rome Tor Vergata. His research focuses on the design of tax policy and on the labor implications of technological change.
Dustin Ferrone is a senior engineer at Valdos Consulting, providing expertise in complex systems analysis, labor and service supply chains, and scalable analytical software solutions. With a background in systems engineering and extensive industry experience, Ferrone advises both public- and private-sector clients on managing workforce transitions and technological integration.
Andrew Barber is a senior economist at Valdos Consulting, specializing in economic modeling, labor market analysis, and the impact of emerging technologies, such as generative AI. His research evaluates public-sector initiatives, workforce preparedness, and incentive-compatible policy solutions, supporting government and industry efforts to navigate technological disruptions.
Did you find this content informative and engaging? Get updates and stay in tune with U.S. economic inequality and growth!
The Washington Center for Equitable Growth today launched the U.S. Inequality Tracker, which tracks income and wealth inequality in the United States and highlights how particular components of income and wealth shape those trends. The tracker updates automatically—quarterly for wealth and annually for income—and follows income inequality from 2000 through the end of 2023 and wealth inequality from 2000 through the fourth quarter of 2024.
Although there are other dashboards on the internet that track inequality, including WID.world and realtimeinequality.org, none of them breaks down income by type. In contrast, Equitable Growth’s Inequality Tracker displays how income is divided between wage income, income in the form of income-support and in-kind transfers from the government, income from running a business, interest and dividend income from holding equities, and income from renting out property. These income data come from the U.S. Bureau of Economic Analysis’ Distribution of Personal Income dataset, which takes Personal Income data and divides it into 10 household deciles, or slices of the population that each hold 10 percent of households.
Equitable Growth’s Inequality Tracker also breaks out developments in wealth concentration, based on the Federal Reserve’s Distributional Financial Accounts. It shows how seven streams of wealth—including real estate wealth, equity wealth, and pension or retirement account wealth—have grown in the 21st century, contributing to the widening wealth gap in the United States.
This issue brief is primarily focused on the income data, where inequality has been stable over the past two decades, as opposed to wealth inequality, which has increased over the same period. Specifically, this brief looks at the past 23 years of income growth in the United States through the lens of the five streams of income mentioned above. Understanding how these streams of income add up to total income can yield new insight about the U.S. economy. In particular, analyzing the data shows the following:
Income inequality, as measured by the Gini coefficient, has changed little and is currently almost exactly at its average level for the 2000–2023 period.
This single-number summary, however, obscures important dynamics. Income growth has been highest for households in the bottom 50 percent of the distribution and households in the top 10 percent of the distribution. Those in the 50th percentile to the 90th percentile, representing the middle and upper-middle class in the United States, have seen weaker income growth.
In the 21st century, wages have grown slower than any other income source, making these two decades an outlier in recent U.S. economic history. This slowdown in wage growth largely explains why households in the 50th percentile to the 90th percentile have lagged other groups in income growth because this group is the most dependent on wage gains.
Although the bottom 50 percent of households have kept pace, more and more of their income comes in the form of in-kind transfers, such as from Medicaid and Medicare, which means their economic welfare is advancing slower than their incomes.
There is no substitute for a strong U.S. labor market. To reduce income inequality in the United States and increase the share of income that households earn from wages, workers need greater bargaining power.
Income inequality will likely increase because of policies pursued by President Donald Trump and the Republican-controlled Congress that erode the power of workers and cut benefits in major government programs, such as nutrition assistance, health care, and housing energy assistance.
Taken together, these findings are disconcerting. Although inequality has largely stopped expanding, the current level of inequality in the United States is high, and an analysis of the components of income suggest that there is significant weakness along the entire income distribution, outside of the top decile. The primary culprit is a labor market that no longer generates strong wage growth for U.S. households.
As others have pointed out, the macroeconomic impact of rising inequality is likely to be slowing growth. Lower-income households have high propensities to consume. Even modest erosion of their incomes could lead to significant drops in consumption. The likely result is a double whammy of weak and unevenly distributed economic growth.
U.S. income inequality in the 21st century
It is generally accepted that income inequality in the United States was high during the 1920s but declined through the first half of the 20th century, reaching relatively low levels in the 1970s. Yet income inequality rose again throughout the 1980s and 1990s, reaching levels similar to the 1920s, or perhaps a bit lower. Different datasets yield different answers about how steeply inequality went up in the 1980s and ‘90s, but the pre-1970s dip and subsequent rise is not disputed.
Likewise, it is generally accepted that in the 21st century, income inequality has advanced slowly or not at all, remaining steady at a high level. To measure inequality, scholars often use the Gini coefficient, a value ranging from 0 to 1 with values closer to 1 representing more inequality. As Figure 1 below shows, the average Gini coefficient of U.S. income over the period 2000 to 2023 was 0.457; in 2023, it was barely above this, at 0.458. (See Figure 1.)
Figure 1
As Figure 1 shows, inequality actually dipped sharply in 2020, thanks to federal COVID-19 pandemic policies that funneled money to U.S. households through an expanded Unemployment Insurance program, a more generous Child Tax Credit, and pandemic-era stimulus checks. These government transfers boosted incomes for many U.S. households, alleviating some of the rise in income inequality that accumulated in the 1980s and 1990s. In 2022, most of these programs expired, however, and inequality quickly returned to trend.
While the Gini coefficient provides a helpful one-number summary of inequality, it does not provide a comprehensive picture of how inequality is changing in a country. The BEA Distributing Personal Income dataset, meanwhile, allows for a much more granular examination of how income inequality has changed between 2000 and 2023.
The BEA data show that there have been clear winners and losers in the 20th century. Aggregate Personal Income, adjusted for inflation using the Personal Consumption Expenditure Price Index, grew 66 percent between 2000 and 2023. But growth over this period varied substantially by the decile of the income distribution into which a household fell. The lowest-income households, those in the first decile, experienced 80 percent growth over this period, while the 8th decile experienced the slowest growth, at just 59 percent. (See Figure 2.)
Figure 2
Rather than use deciles, some economists break the income distribution into three groups that are coincidentally quite useful for examining changes in the income distribution between 2000 and 2023. The first group is the bottom 50 percent, representing half of all households in the United States that have income equal to or less than median income. This group is the first five deciles in the BEA data. The second group is the subsequent four deciles, representing households with income in the 50th percentile to 90th percentile. We call these households the upper 40 percent. Finally, there’s the 10th decile, or the top 10 percent of households, those with the highest income.
In terms of these three groups, Figure 2 shows that the bottom 50 percent and the top 10 percent have both exceeded average income growth in the 21st century. At the same time, the upper 40 percent has fallen behind, with each decile in that group seeing smaller income gains than the average.
Similarly, this slow income growth in the upper 40 percent is reflected in each group’s share of Personal Income as well. The bottom 50 percent increased their income share by 0.7 percentage points overall, while the upper 40 percent saw their share fall by 1.5 percentage points. The top 10 percent saw the greatest benefits of all, increasing their income share by 0.8 percentage points. (See Figure 3.)
Figure 3
In other words, the headline story of no change in U.S. inequality as told by the Gini coefficient is a little more complicated under the hood. The upper-middle class has suffered some, while households at the bottom and the very top have done well. What is driving these dynamics?
Income growth has lagged for groups dependent on wages
Looking at streams of income sheds some light on this question. This is where the BEA Distribution of Personal Income dataset really shines. It allows analysts to further break down income into five streams. (In the BEA dataset, there are six streams of income, but Equitable Growth subtracts payments to the government to fund social programs, such as Social Security, from government transfer payments to reflect the balance of government transfers that U.S. households are receiving.) How these five streams combine to produce household income varies substantially by income decile.
Households at the bottom of the income distribution, for example, receive a significant amount of their income in the form of government transfers. These include both cash assistance, such as Social Security, and transfers in-kind, such as medical insurance coverage through Medicaid and Medicare. When accounting for income, it is common to include these latter programs as transfers that raise household income by the average per-capita expenditure of the program.
Receiving Medicaid, for example, adds a few thousand dollars to a household’s income, depending on the year. Even some relatively wealthy households receive transfers because of programs such as Social Security and Medicare, which are available to all seniors, regardless of income level.
For the first two deciles of the income distribution, government transfers are the largest single component of their income. For every other decile, the largest component of income is wages, which include employers’ contributions to social insurance and retirement plans. In fact, wages make up about 61 percent of Personal Income overall. Moving up the income deciles, transfers shrink as a share of income and wages expand as a share of income. (See Figure 4.)
Figure 4
At the very top of the income distribution, other sources of income matter as well. Specifically, top income deciles make significant amounts of income from returns on assets. Importantly, these are not proceeds from the increasing value of assets but rather consist of interest and dividend income earned on asset holdings. (The increasing value of assets, generally called capital gains, are not included in this BEA dataset because capital gains generally are not a part of the National Income and Product Accounts. Pure capital gains have grown quickly over the past two decades, and adding either realized or unrealized gains to the BEA data would show increasing inequality in the 21st century.)
Two other categories of income appear in Equitable Growth’s tracker. Business income is defined as income earned by the sole proprietors of businesses. This income stream is much more important for high-income households. Finally, income from renting out property makes up a small but relatively steady proportion of income across the distribution.
Let’s now consider each of these income streams across the three income groups of households discussed above. Figure 4 shows that the bottom 50 percent of households rely on a mix of wages and transfers. The upper 40 percent rely mostly on wages, with a small role for asset income, while the top 10 percent has the most diversified income portfolio, with significant percentages coming from wages, assets, and businesses.
Figure 5 below shows the compound annual growth rate for each of these streams of income between 2000 and 2023. Wages are the slowest-growing component of income over this time, increasing just 1.74 percent per year. Income from all other categories was at least 2 percent per year, with rental income increasing by more than 5 percent per year. (See Figure 5.)
Figure 5
Low wage-growth largely explains why U.S. households in the upper 40 percent have suffered in the 21st century. The bottom 50 percent households have been supported by strong growth in government transfers, and the top 10 percent of households have benefitted from growth in business and asset income that exceeds wage increases.
This is not a result of wage growth being soft for specific deciles. Unlike in the 1980s and 1990s, when wage growth diverged for low- and high-income workers, growth in wage income has been relatively even for workers up and down the distribution in the 21st century. Since 2000, the compound annual growth rate of wages was 1.59 percent for the bottom 50 percent, 1.67 percent for the upper 40 percent, and 1.92 percent for the top 10 percent. (See Figure 6.)
Figure 6
Even though wage growth for the upper 40 percent compared favorably to wage growth along the rest of the income distribution, this group still fell behind because most of their income comes from wages and wages underperformed other categories of income.
As Figure 6 shows, other categories of income, such as assets and business income, show disproportionately high growth at the top end of the income distribution, which explains why this decile outperformed the upper 40 percent despite wages making up 54 percent of the 10th decile’s income. Indeed, growth in business income is low across the distribution, except for in the 10th decile (growth in the 2nd decile appears high, but the business income base in this decile is miniscule, making the estimate noisy). Similarly, income from assets grew much faster in the 10th decile than anywhere else.
The weak performance of wages in the 21st century is an outlier in recent U.S. economic history. Although wages also were the slowest-growing category of income in the 20 years between 1980 and 2000, they grew at nearly twice the rate that wages have grown in the 21st century: 3.26 percent per year versus 1.74 percent. In the 1960s and 1970s, when inequality in the United States reached relative lows, wages grew at nearly 4 percent per year, faster than rental and business income. (See Figure 7.)
Figure 7
As seen in Figure 7, recent growth in government transfers is not outside the norm. Transfers grew similarly from 1980 to 2000 as they did from 2000 to 2023. They grew even faster between 1960 and 1980, but this largely reflects the creation of large new transfer programs, including Medicaid and Medicare, which did not exist until 1966.
A shift to income from government transfers harms low-income households
The collapse in wage growth since 2000 has significantly harmed middle- and upper-middle-class households, which primarily depend on wages for their incomes. But they are not the only losers. While households in the bottom 50 percent have kept pace with, and even increased, their income share, their success is largely predicated on the government making up for declining wage growth with transfers. This is a bad sign for the future of this group for two reasons.
First, transfers are not guaranteed to grow indefinitely. Once benefits are extended to a population, further income gains can be produced by expanding them or if their values rise faster than inflation. The increases shown in Figure 7, for example, are largely due to a steady expansion of social programs by Congress. In the 2000s, that includes expansions of the Earned Income Tax Credit and the Child Tax Credit and the Affordable Care Act’s expansion of Medicaid, in which the federal government expanded the eligible population for Medicaid and shouldered most of the cost of enrolling these new households. In the case of the Affordable Care Act, there is still some low-hanging fruit to be plucked: Texas and Florida, among other states, have rejected Medicaid expansion, and if some of these states changed course, it would provide in-kind support for millions of Americans.
Second, the growing share of transfers in the bottom 50 percent’s income implies that overall welfare—by which economists mean the overall well-being of a person—for this group is increasing more slowly than it is for other groups. Much of the increase in transfer payments comes from the expansion of in-kind services such as Medicare and Medicaid. In fact, according to BEA data, 48 percent of all growth in transfer payments in the 21st century is thanks to growth in Medicare and Medicaid.
These are not cash transfers to households. Rather, they are in-kind transfers that provide a service to households. Though Medicare and Medicaid are real substitutes for income—if households didn’t receive it, they would have to choose between not having health insurance or buying private insurance—economic research finds that people do not value in-kind transfers at their full cash value.
In other words, if the government spends $3,000 providing health care to a person, that person’s economic welfare increases by less than $3,000. Consequently, $20,000 of income that comes purely from wages provides more welfare to the recipient than $20,000 of income in which half is from wages and half is from government transfers. As Equitable Growth’s U.S. Inequality Tracker shows, transfers have increased as a share of income for the bottom 50 percent, from 31 percent of income in 2000 to nearly 39 percent in 2023, suggesting that economic welfare for this group has increased substantially less than Personal Income has.
Conclusion
Taken together, these arguments suggest that bottom 50 percent’s income growth in the 21st century is not as strong as it appears, and that it may even fall behind in the next few years. Yet the prospects are not especially good for the upper 40 percent either, who depend much more heavily on wage growth to grow their incomes.
Wages grow fastest when the labor market is tight, meaning that demand for labor is strong, attractive employment offers are drawing people into the labor market, and worker power is high. As many economists have documented, worker bargaining power cratered in the waning decades of the 21st century as union membership declined and policy shifted in business’s favor. That led directly to the increase in inequality in the 1980s and 1990s and largely explains why wage growth has been so poor in the 21st century.
In the face of reduced bargaining power and a flagging labor market, U.S. income inequality is likely to start increasing again. The Trump administration and the Republican-controlled Congress are pursuing cuts to multiple government transfer programs for which benefits are concentrated at the bottom of the income distribution. As discussed above, the bottom 50 percent is increasingly dependent on these income supports to keep up with income growth along the rest of the distribution.
In recent years, it has become conventional wisdom that inequality has declined slightly in the 21st century. While this view is not inaccurate, Equitable Growth’s new Inequality Tracker shows where things stand in more detail in the United States: Inequality is very high, relative to other eras of U.S. economic history, but it can still go higher.
Over the past 20 years, in the absence of wage growth, the government has propped up households in the bottom 50 percent with increased transfer payments. Meanwhile, without the benefit of higher transfer payments, the upper 40 percent has fallen behind. At the same time, the top 10 percent of the income distribution has continued to grow its income share thanks to gains in business and asset income. Unless wage growth returns to trend or the federal government undertakes significant expansions of social programs, this moment of stable inequality is unlikely to last.
Did you find this content informative and engaging? Get updates and stay in tune with U.S. economic inequality and growth!
WASHINGTON – On Friday, President Donald Trump signed the 2025 federal budget bill, cementing into law the most regressive piece of tax and budget legislation to be passed in the United States in at least 40 years. The law will disproportionality hurt low- and middle-income families, leaving an estimated 12 million Americans uninsured over the next decade and stripping away vital Supplemental Nutrition Assistance Program dollars directed to feed hungry families. These damaging cuts will help fund a permanent extension of the 2017 tax cuts, which disproportionately benefit the ultrawealthy.
The budget bill includes:
$1.3 trillion in cuts to Medicaid and supplemental nutrition assistance, resulting in approximately 12 million Americans losing their health insurance benefits and 4.5 million losing their SNAP benefits
A 3.8 percent income reduction for the poorest 20 percent of Americans and a 3.7 percent income increase for the richest 20 percent
A modest increase (or possible decrease) in annual U.S. Gross Domestic Product
An added $3.4 trillion to the national debt over the next 10 years, increasing fiscal risk, raising interest rates, and reducing public investments
A permanent extension of the 2017 Tax Cuts and Jobs Act, plus expanded cuts that amount to more than $5 trillion over the next 10 years, including:
A permanent extension of the qualified business income deduction (Section 199A), which gives more than $700 billion to already wealthy business owners
A permanent increase to the estate tax exemption, which gives more than $200 billion to the ultrawealthy
Exclusive survey data from Yale University’s Jacob Hacker and Patrick Sullivan finds that when Americans saw how the bill would affect the income of less wealthy workers and families, as opposed to the top 1 percent, only 11 percent of those polled supported it.
“The president’s budget bill dramatically exacerbates inequality by sending more than 50 percent of its tax benefits to the top 10 percent of U.S. households, all while delivering negligible economic growth and ballooning the national debt,” said Elena Waskey, senior director of communications and marketing at the Washington Center for Equitable Growth. “The real winners of President Trump’s budget are the uber wealthy, who will see their take-home pay rise more than $300,000, as millions of Americans lose the health insurance and nutrition benefits they rely on to survive. The evidence overwhelmingly shows that the Trump tax cuts, which have now become permanent law, neither boost wages nor spur economic growth.”
###
The Washington Center for Equitable Growth is a nonprofit research and grantmaking organization dedicated to advancing evidence-backed ideas and policies that promote strong, stable, and broad-based economic growth. For more information, see www.equitablegrowth.org and follow us on X @equitablegrowth and Bluesky@equitablegrowth.bsky.social.


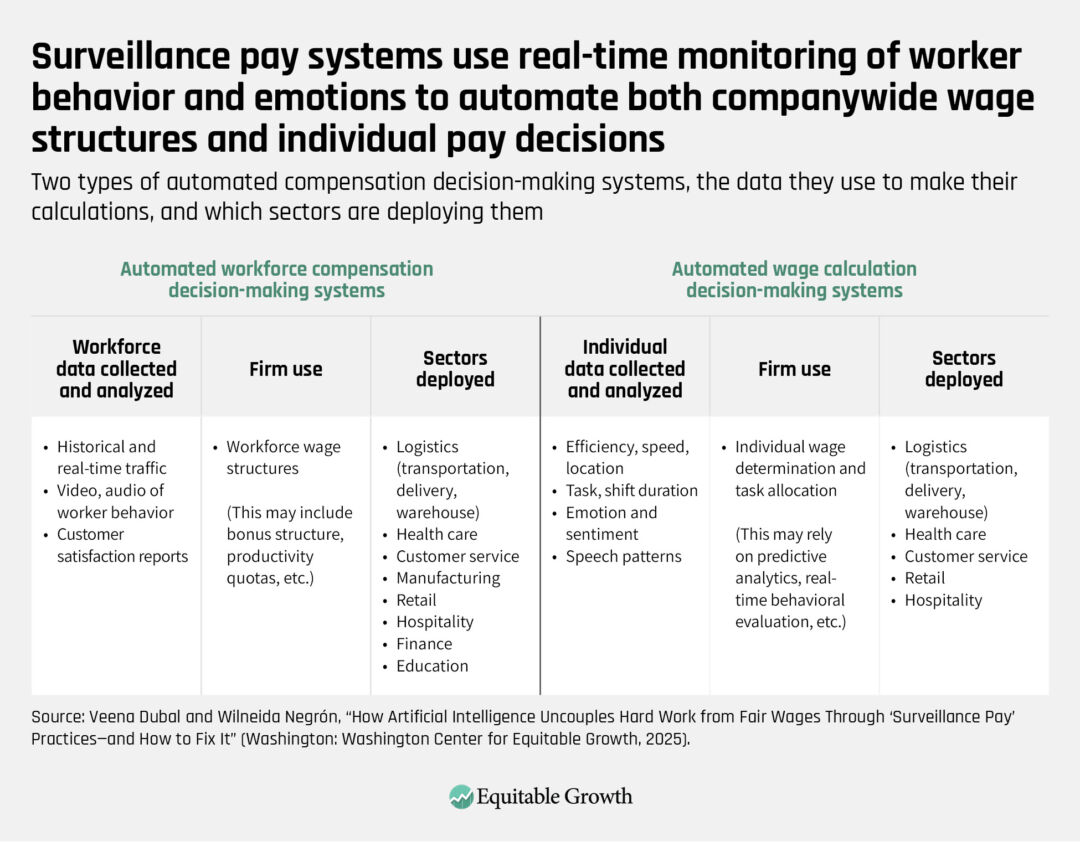


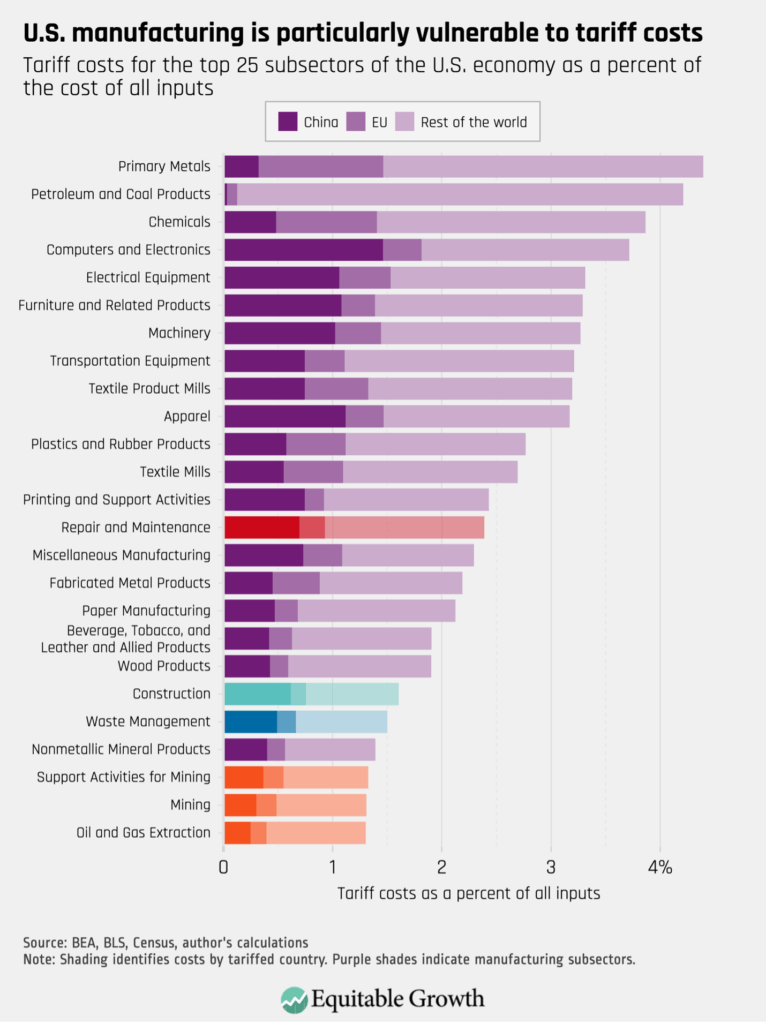
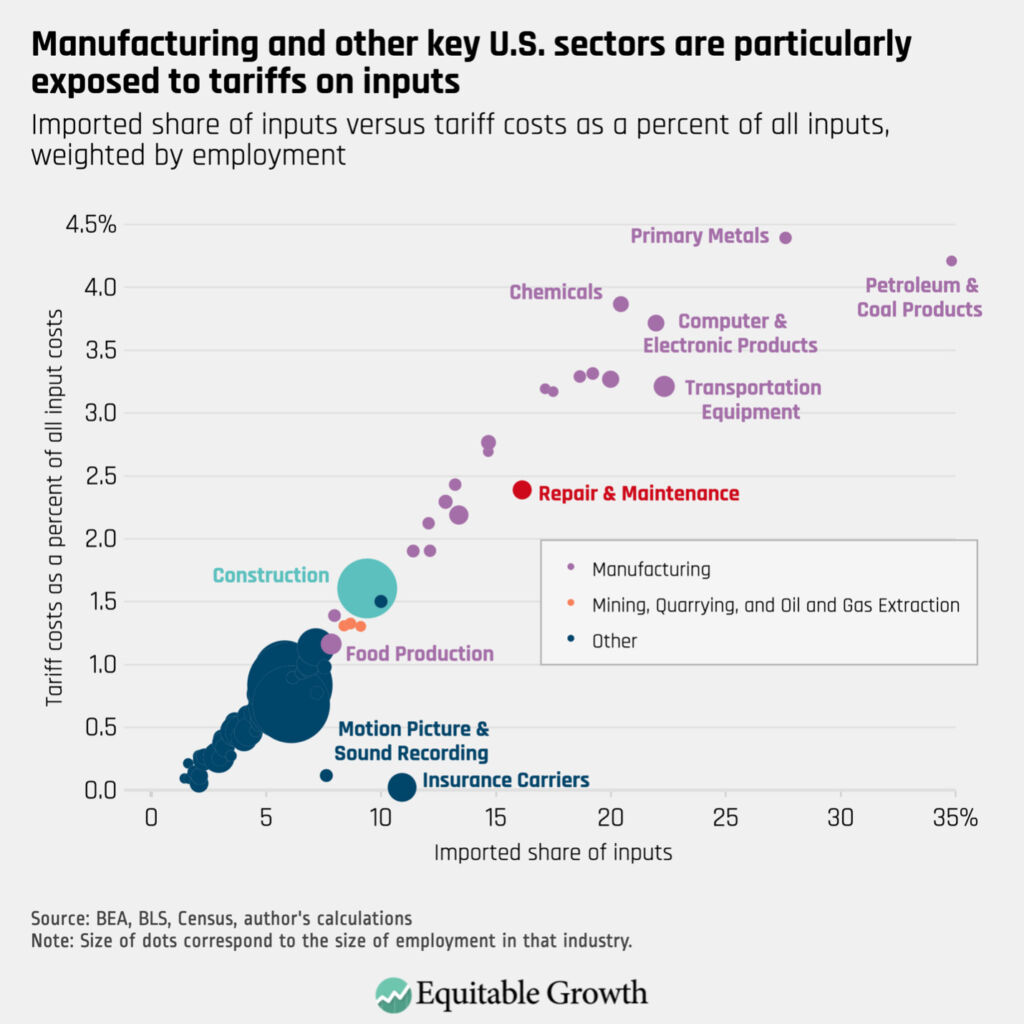
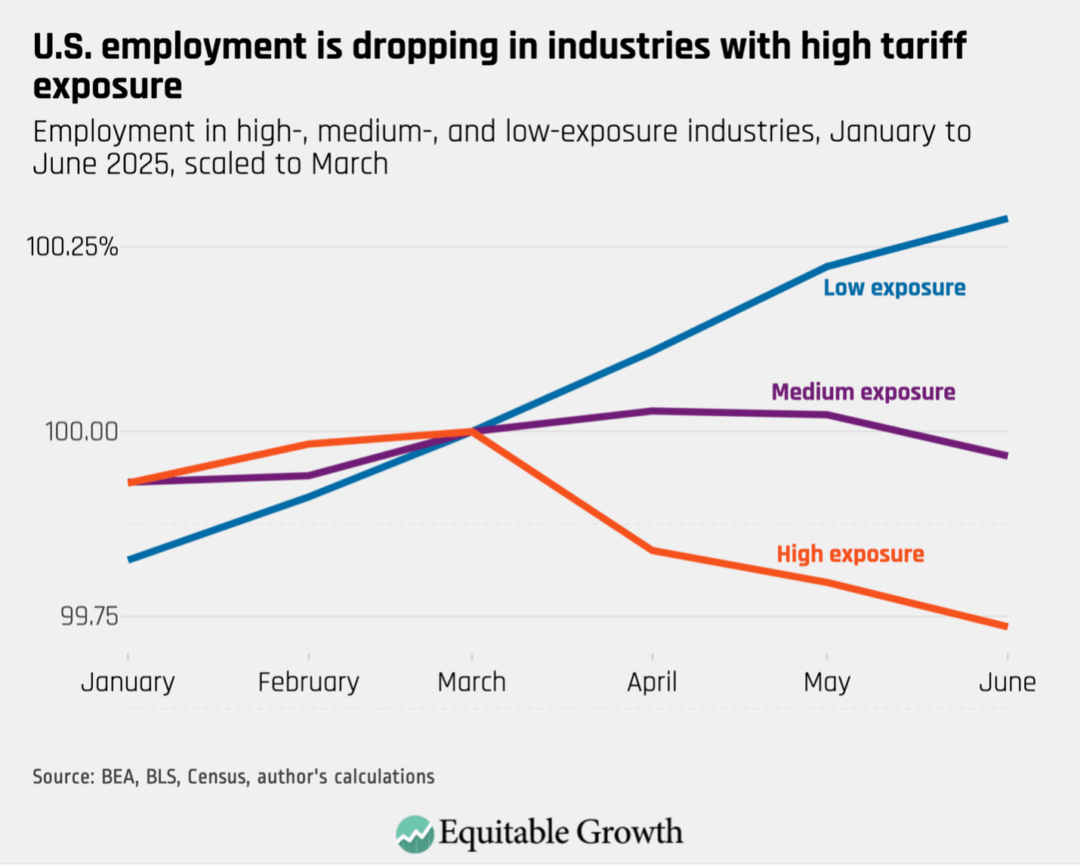
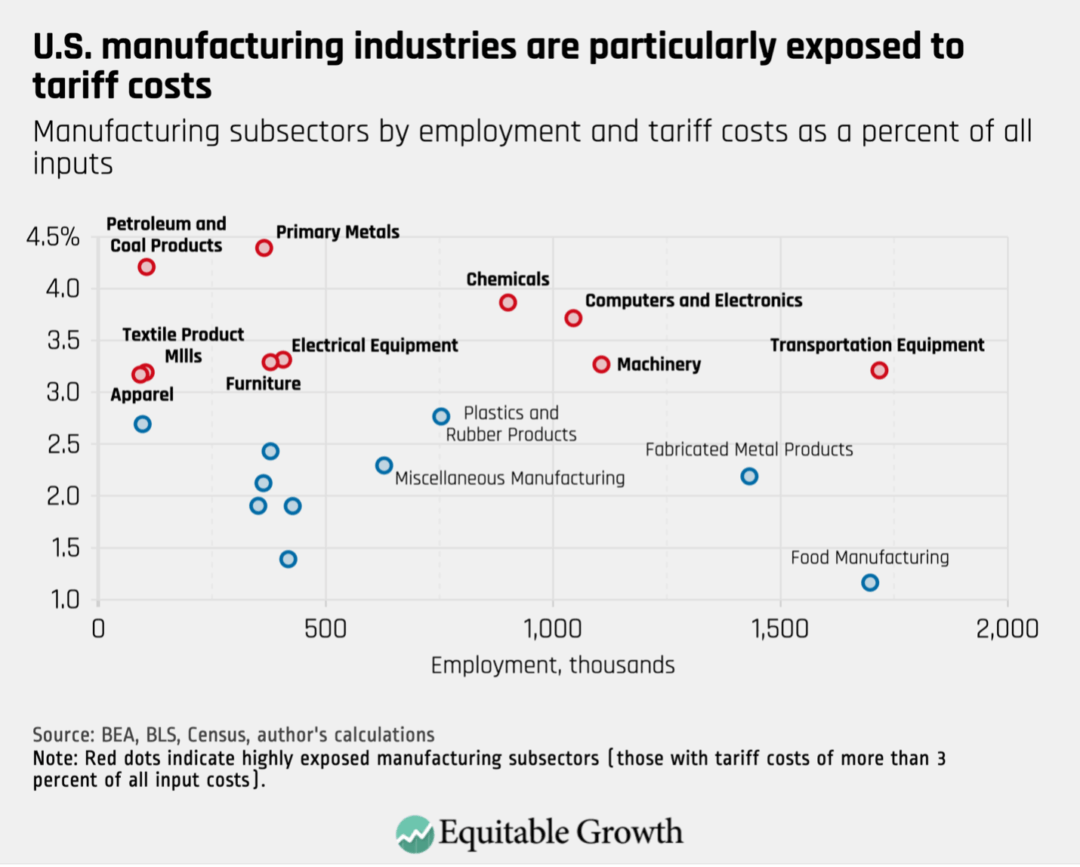
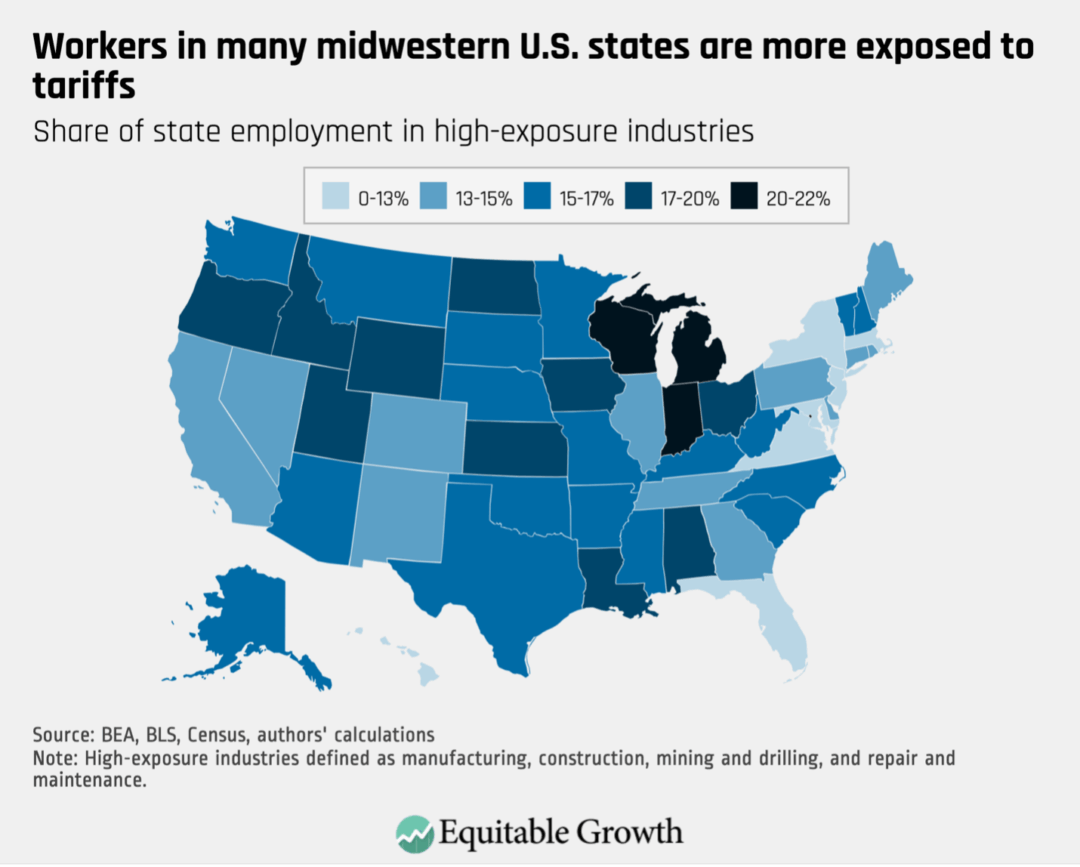

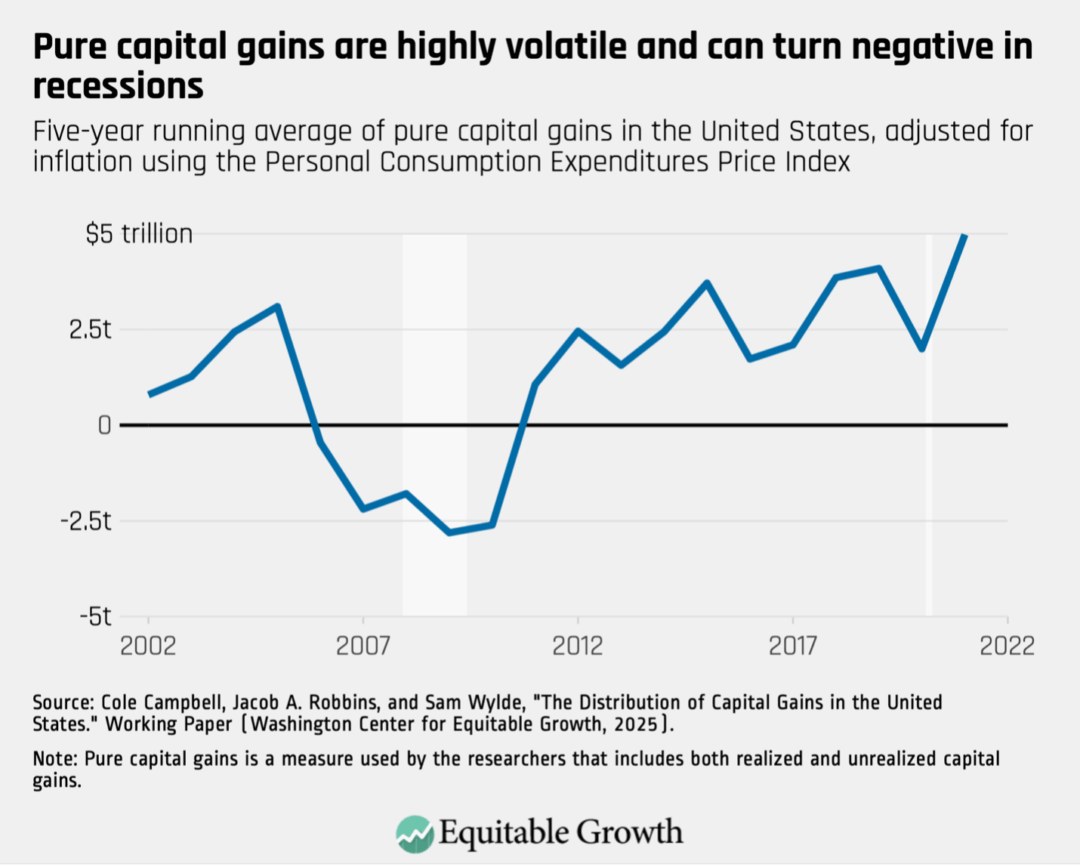
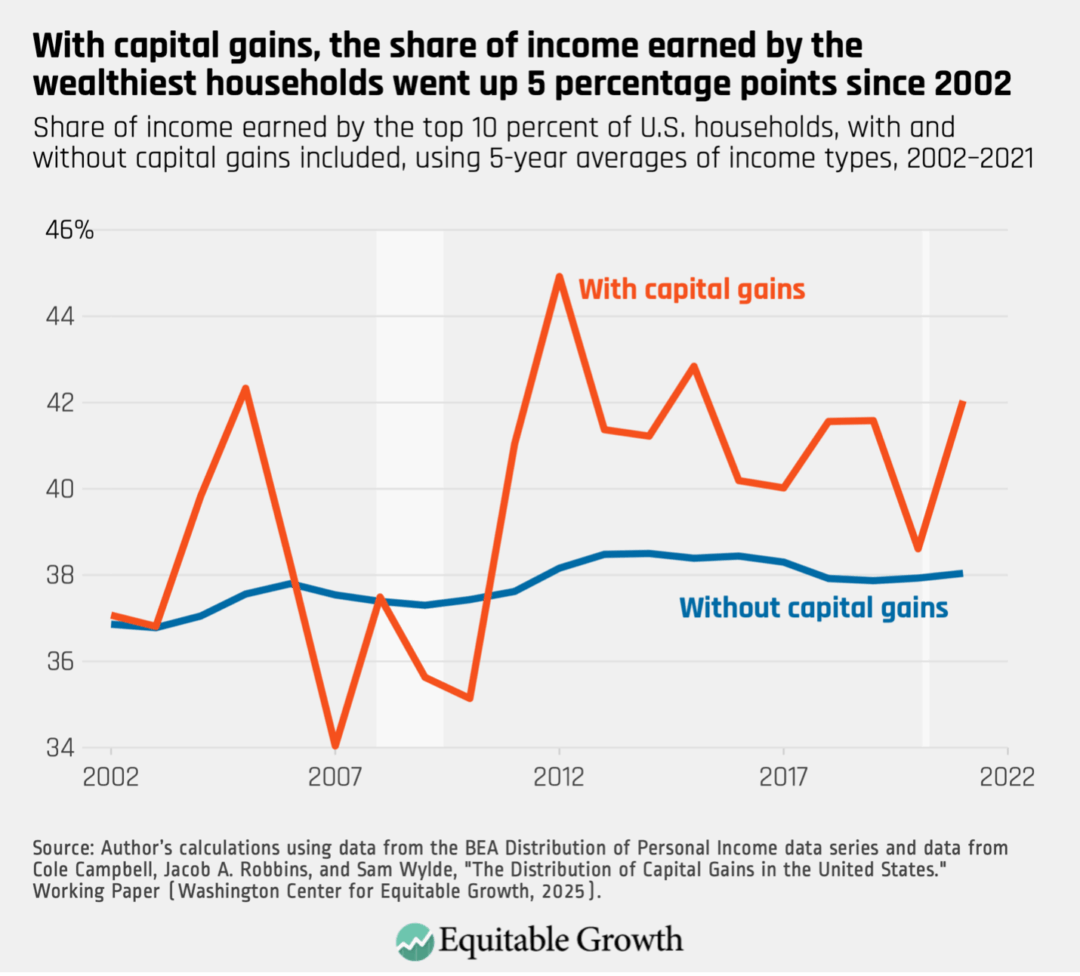

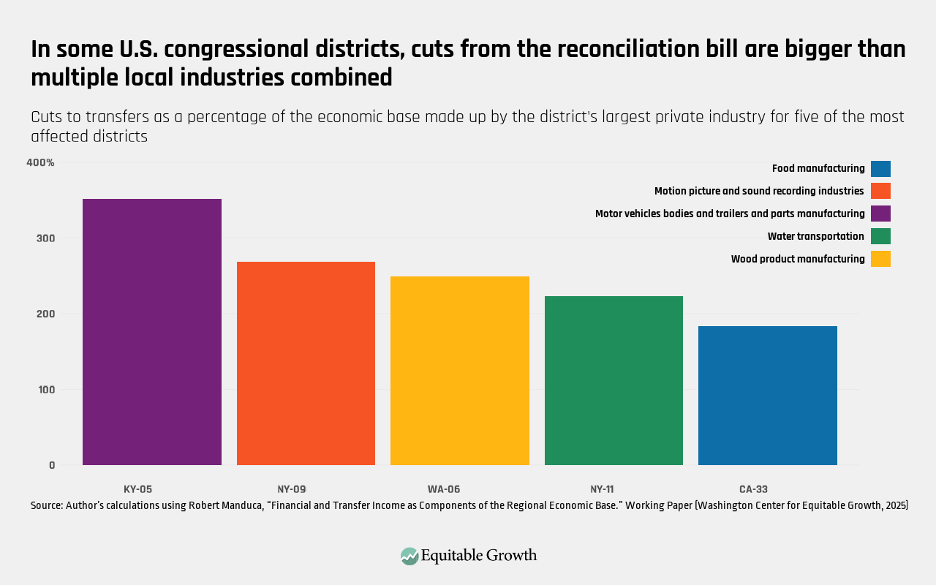


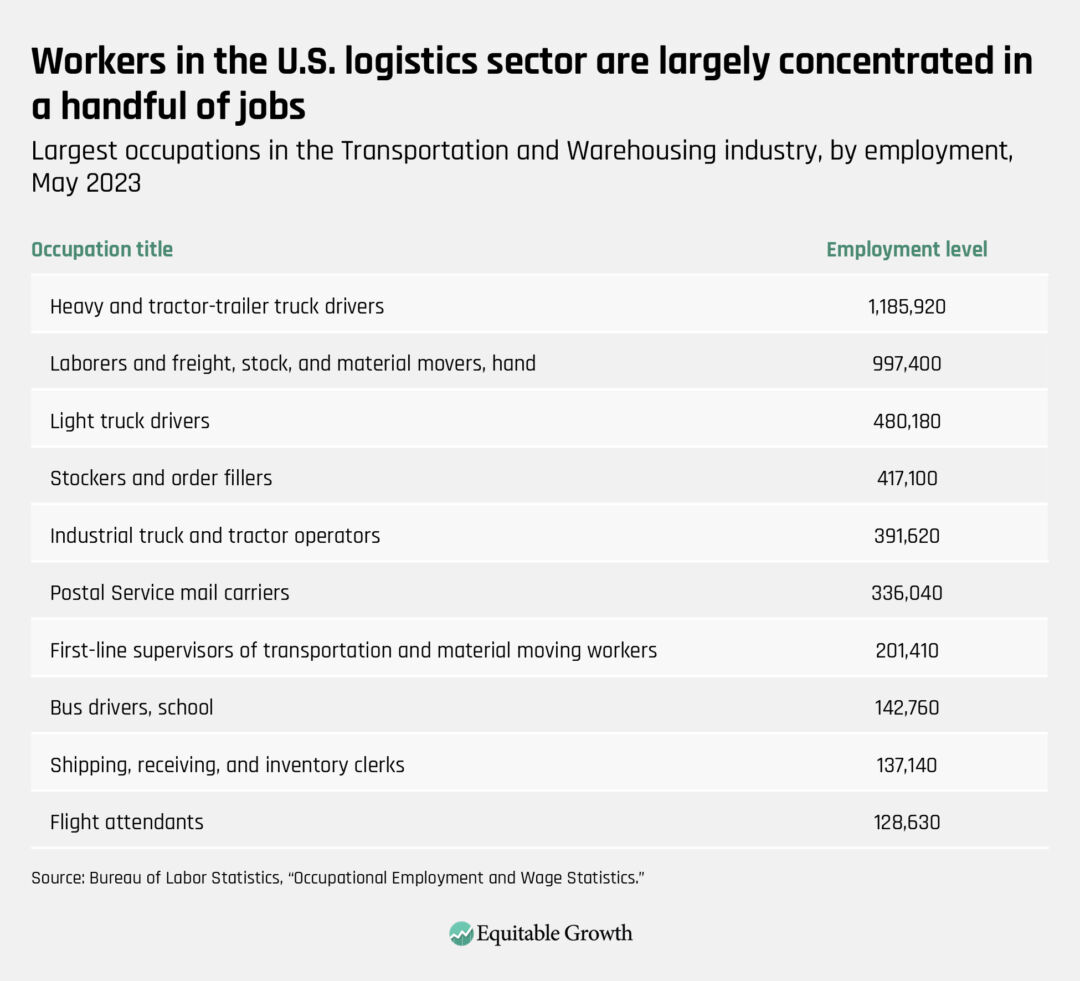
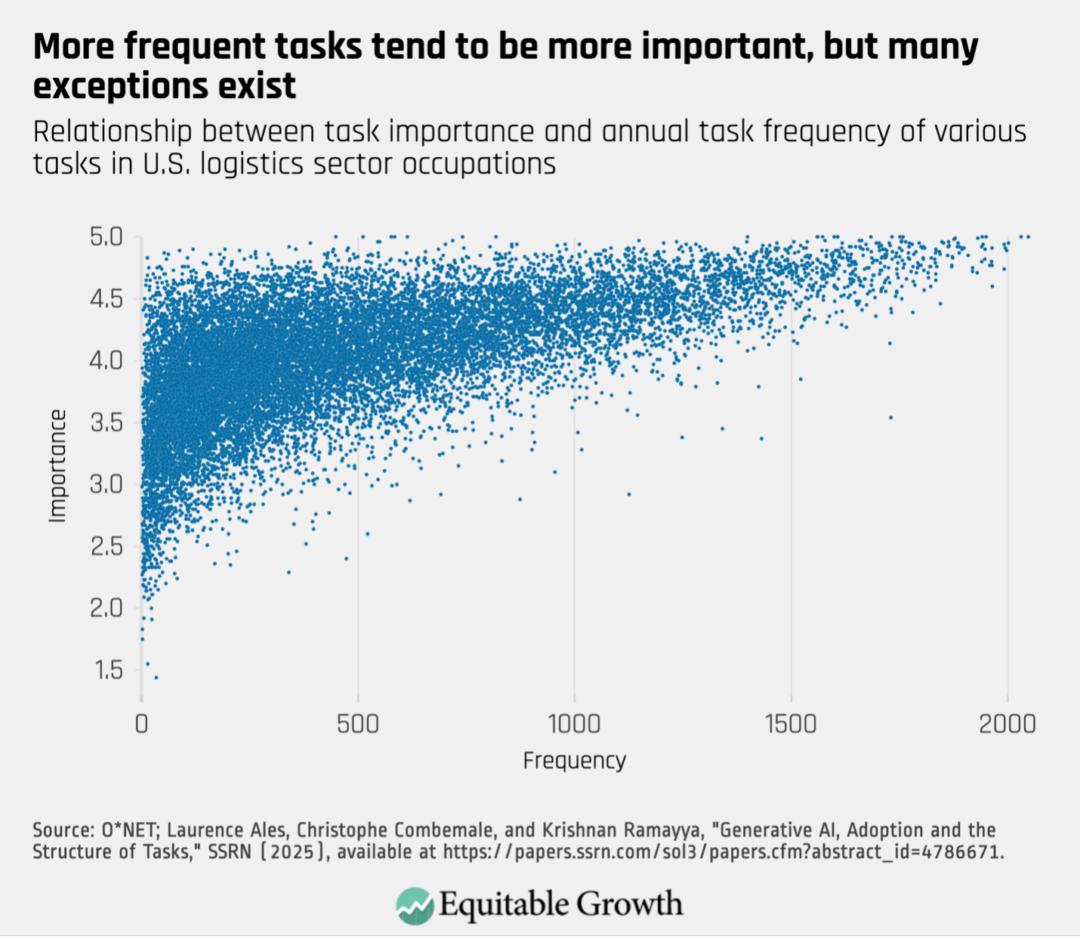
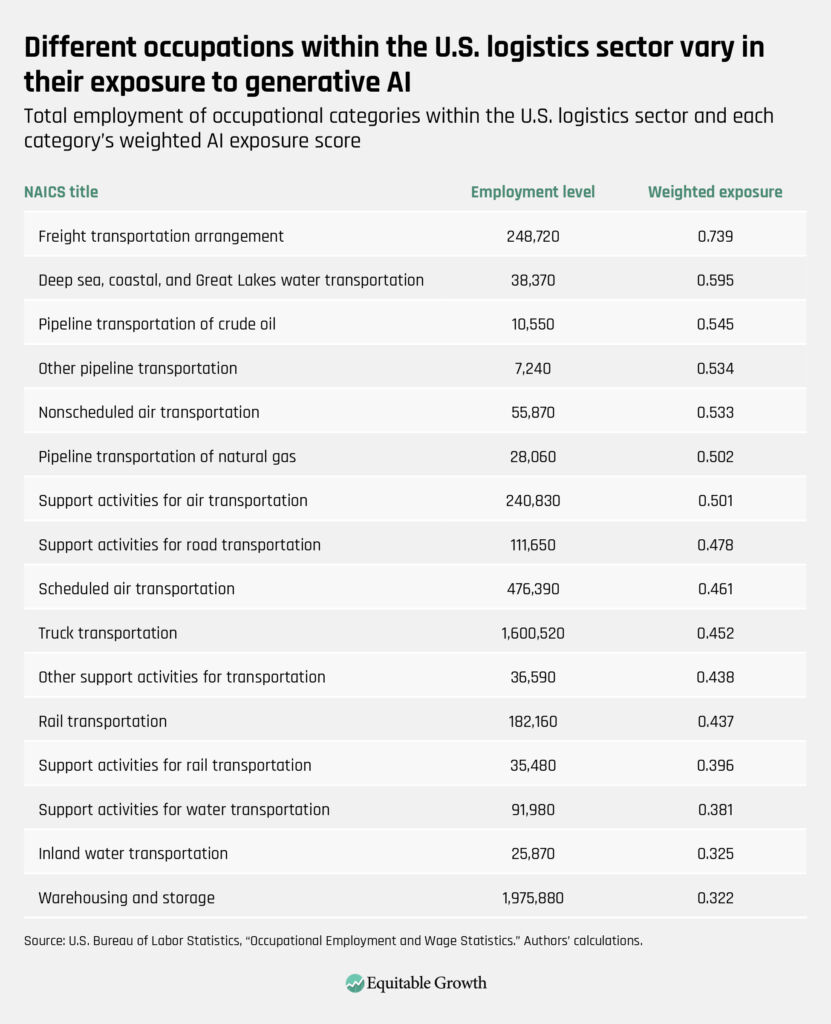
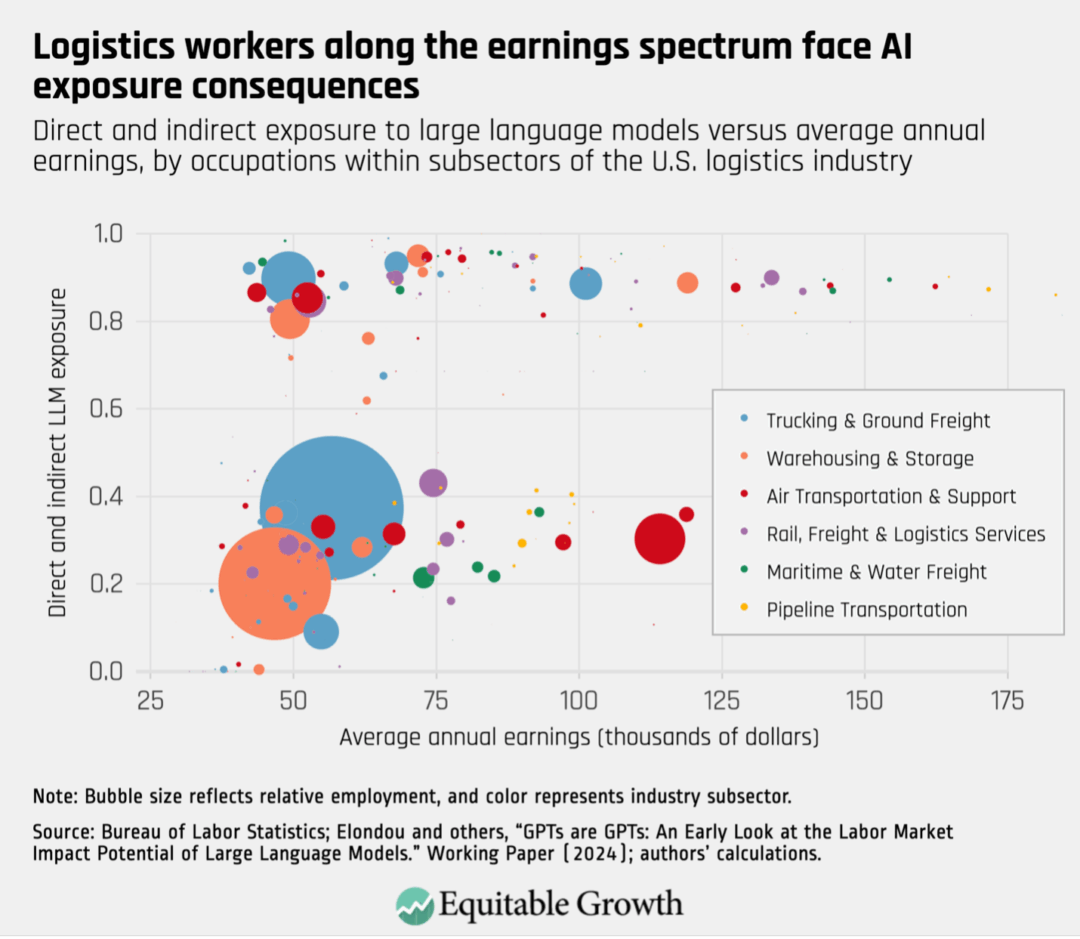
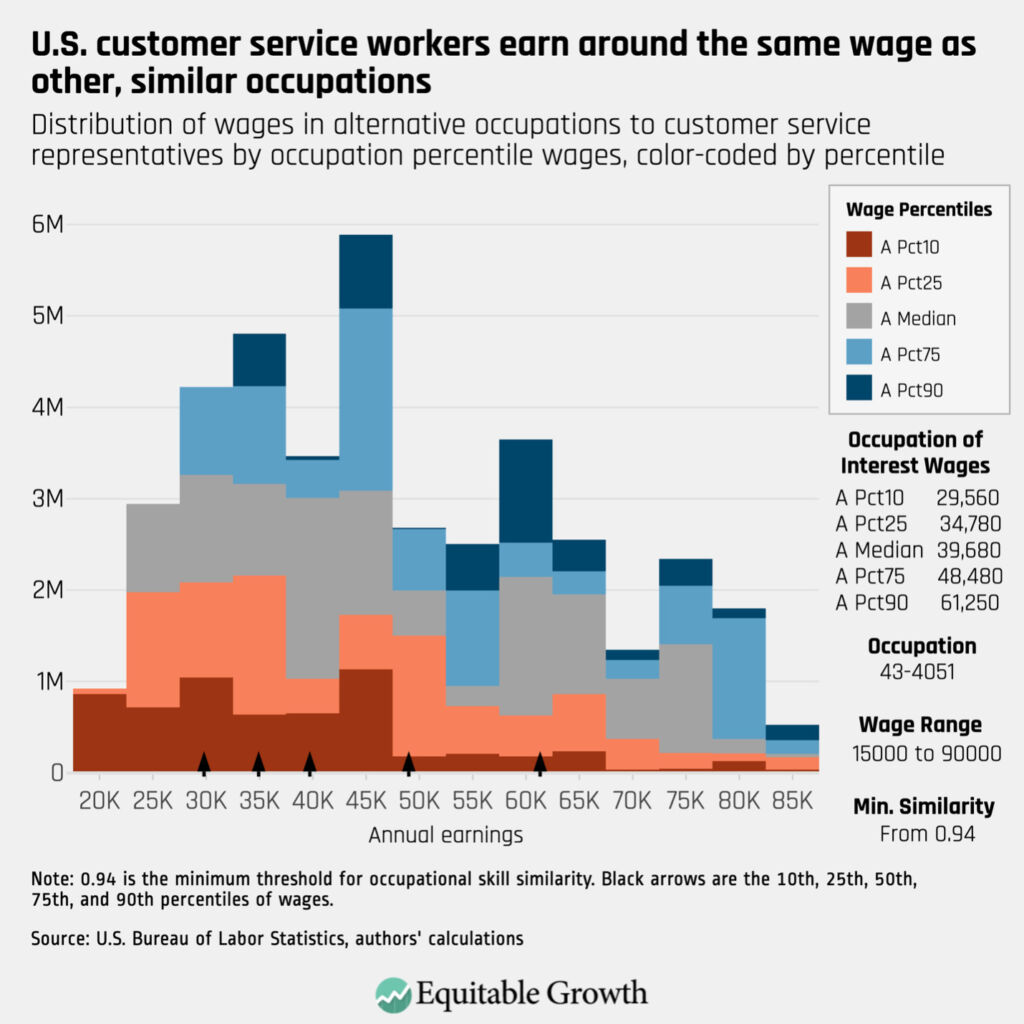
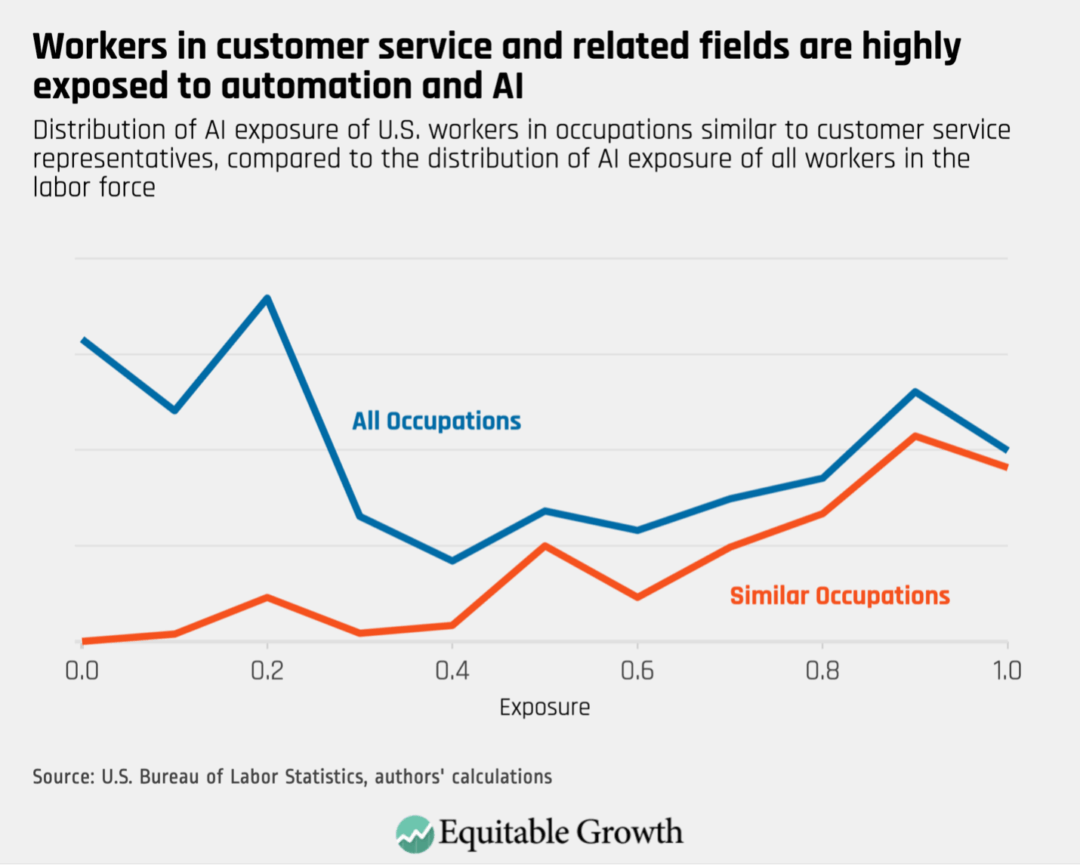
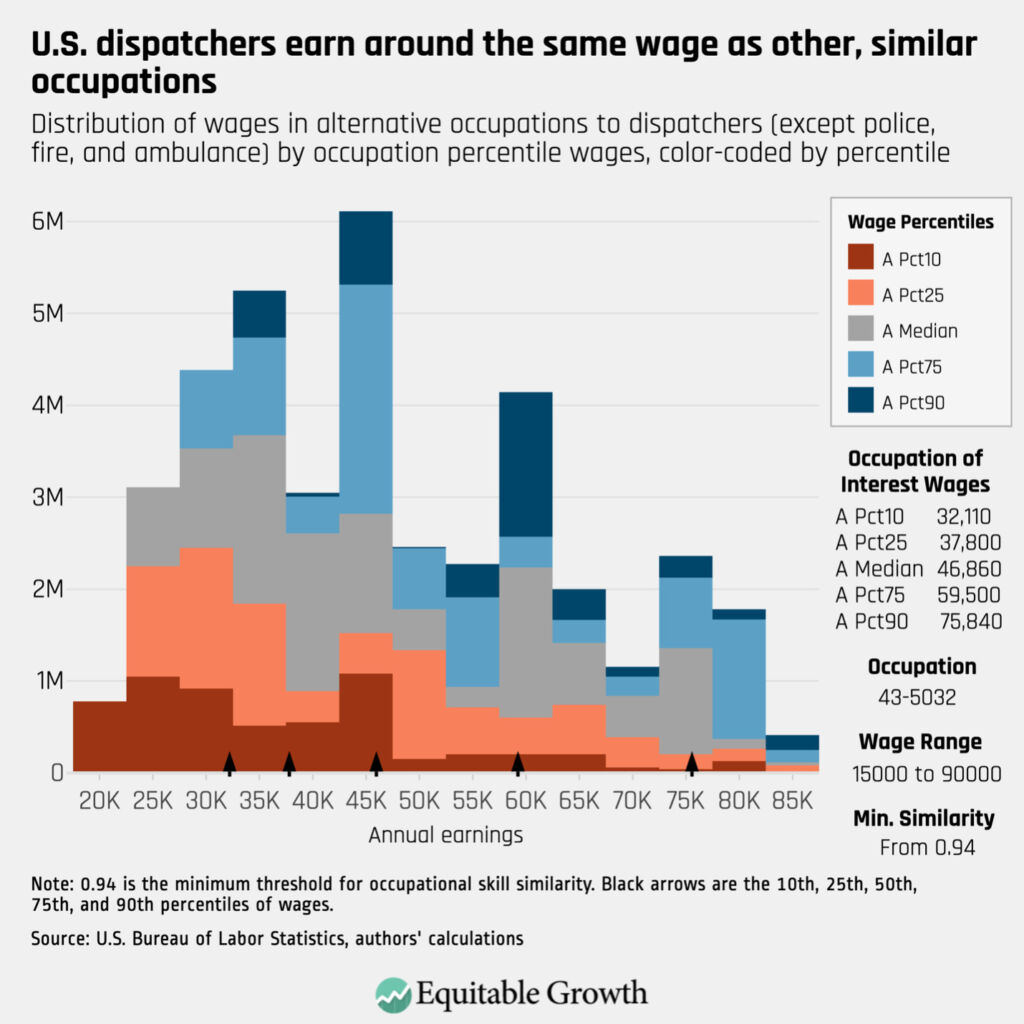
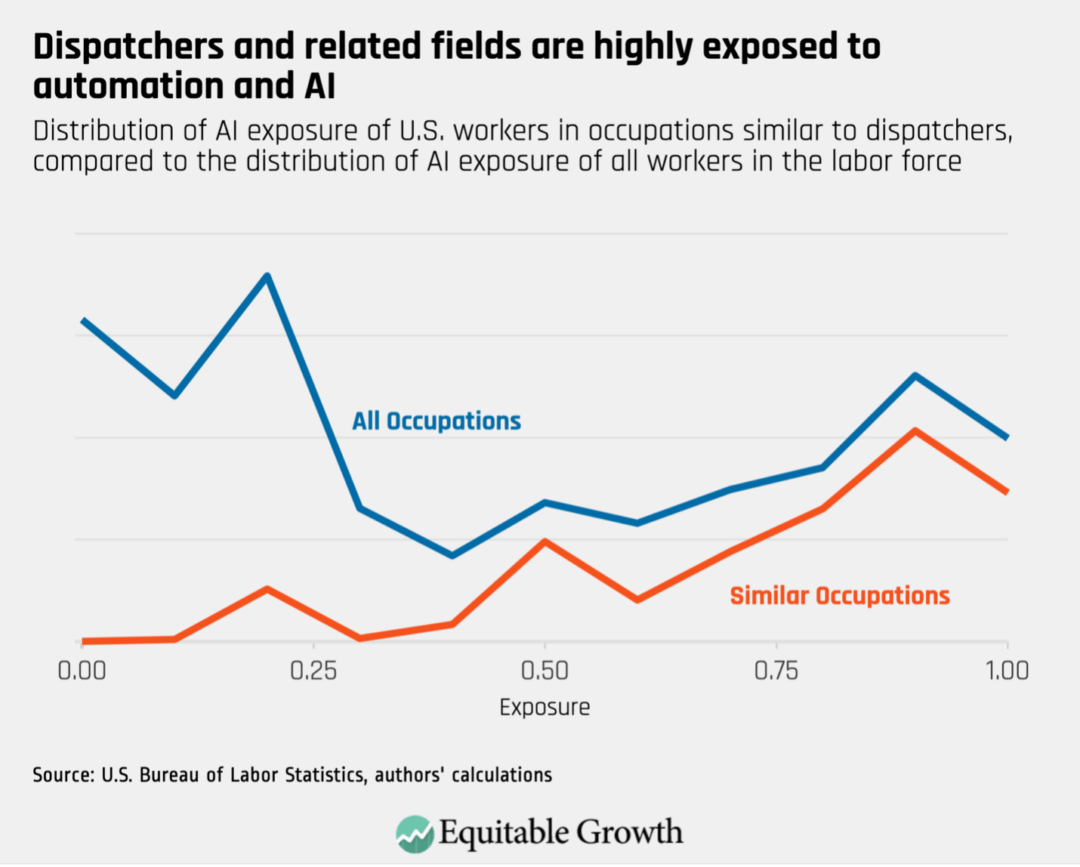

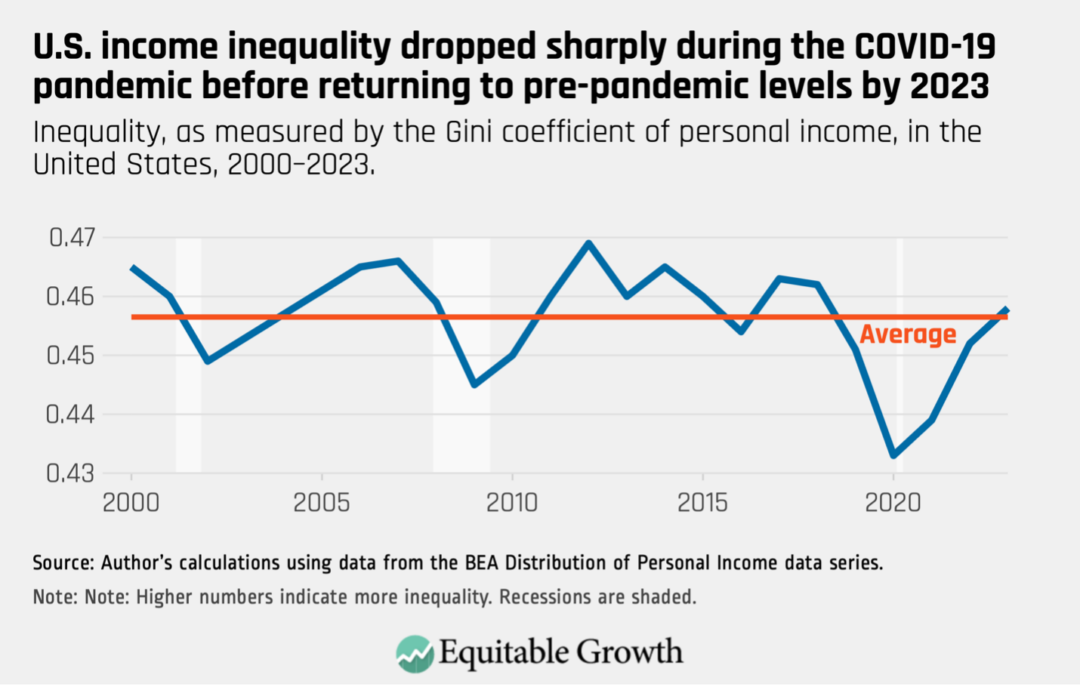
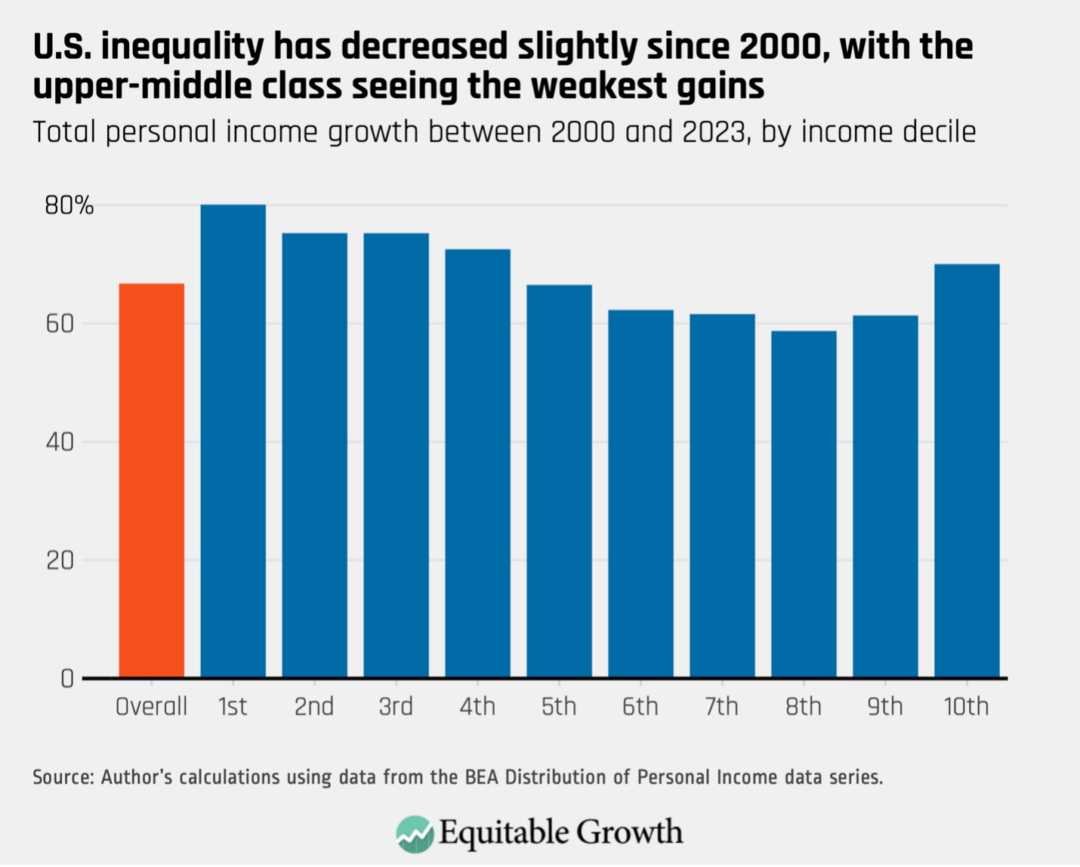
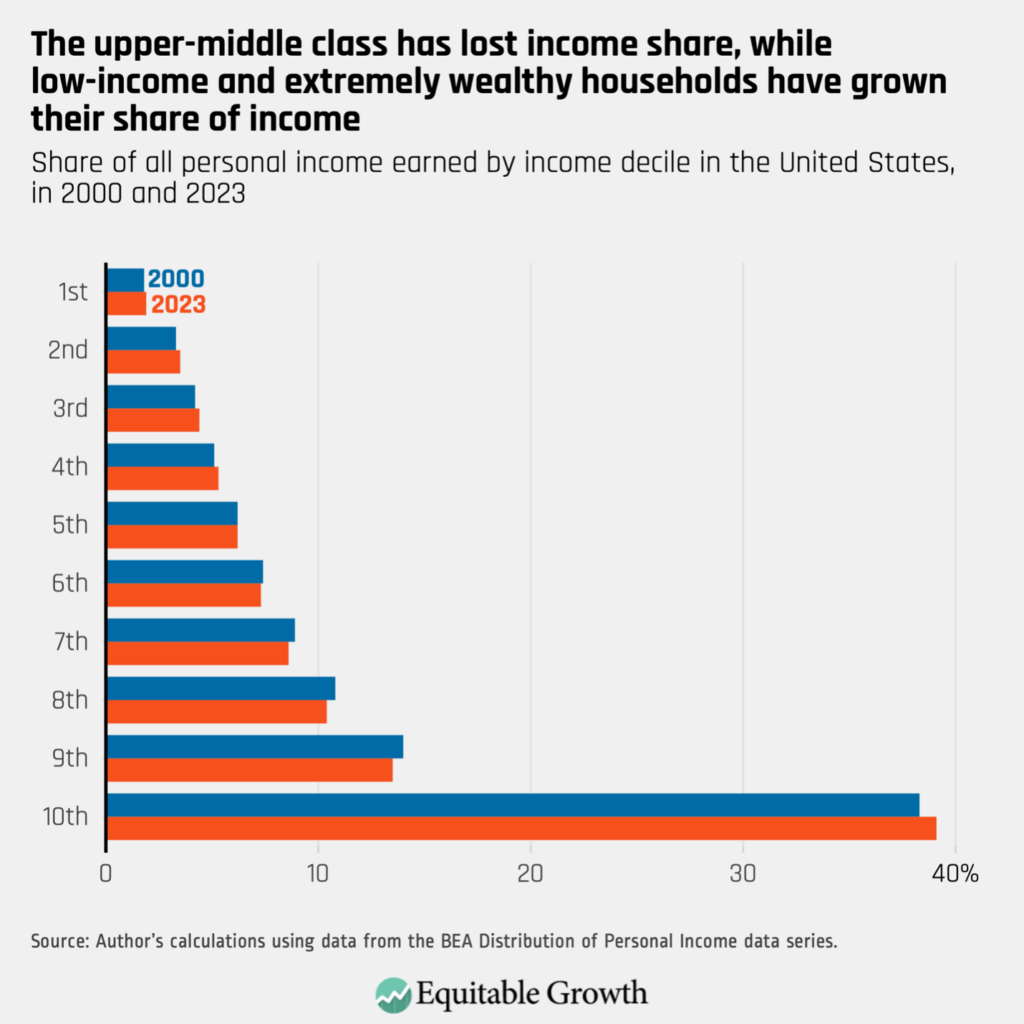
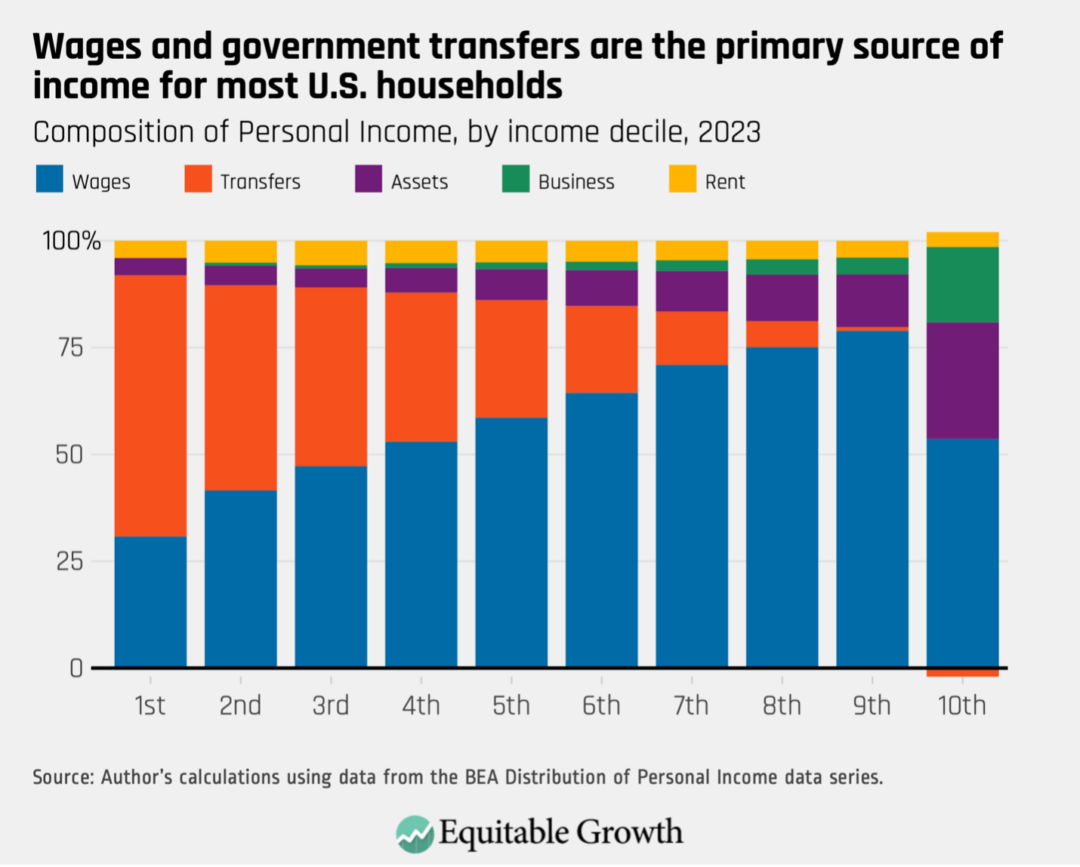
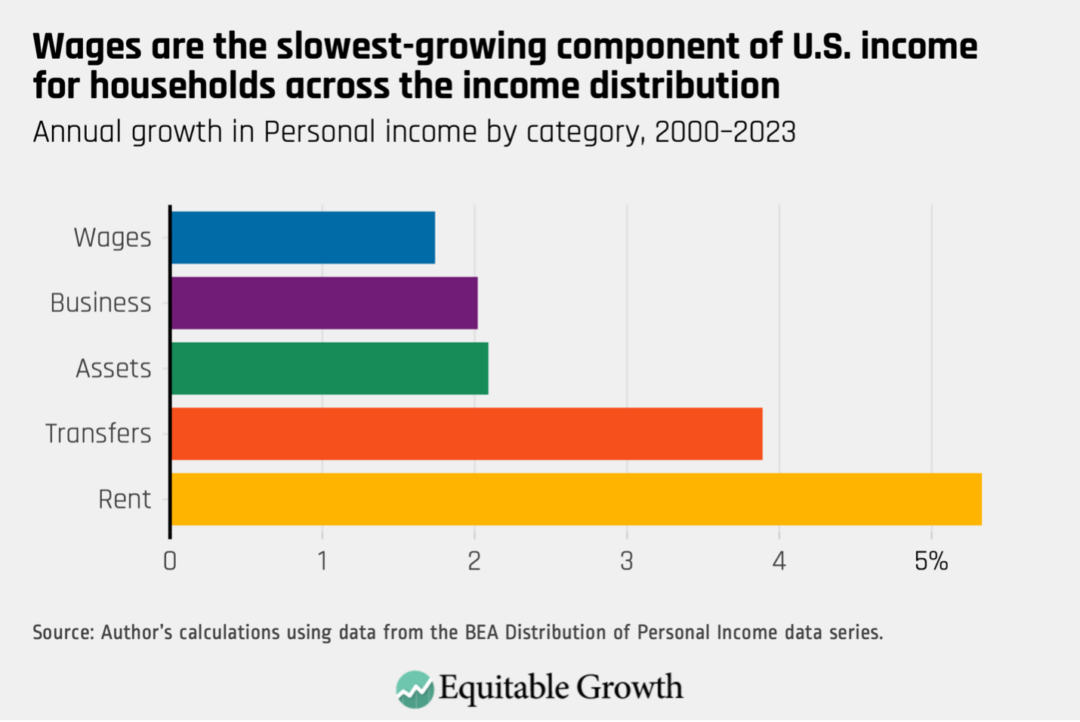
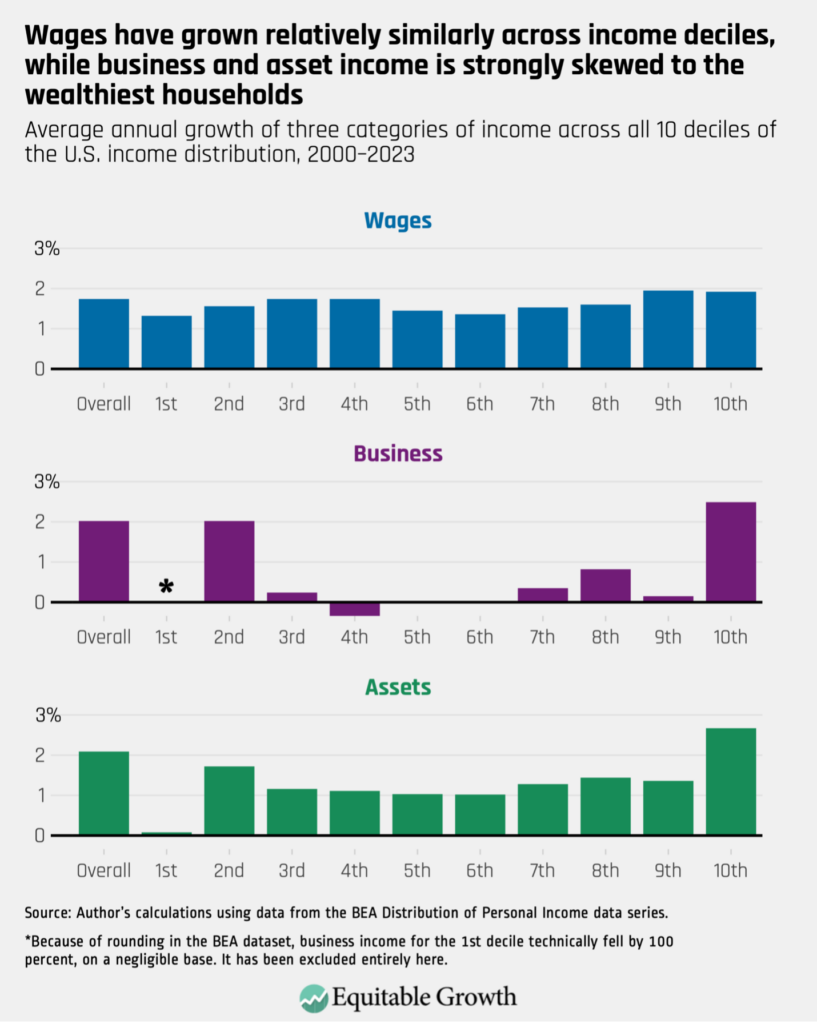
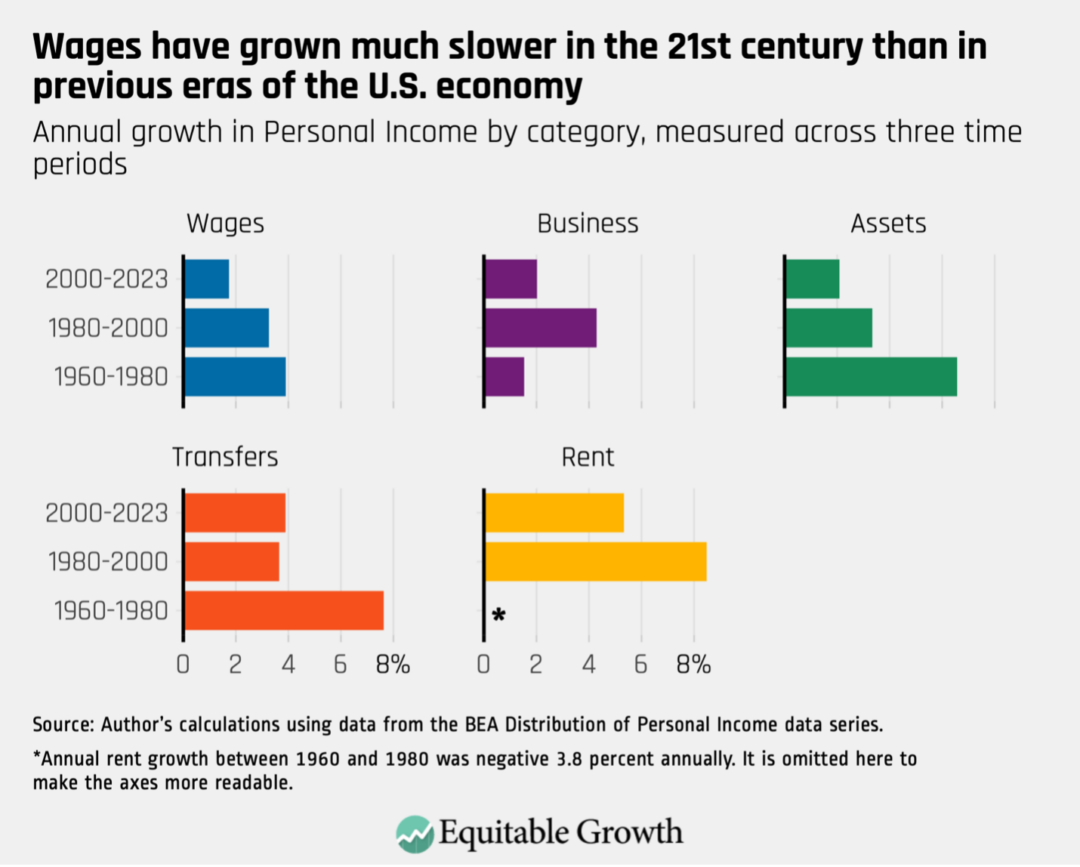
Stay updated on our latest research