Equitable Growth is committed to building a community of scholars working to understand how inequality affects broadly shared growth and stability. To that end, we have created the monthly series, “Expert Focus.” This series highlights scholars in the Equitable Growth network and beyond who are at the frontier of social science research. We encourage you to learn more about both the researchers featured below and our broader network of experts. If you are looking for support to investigate the intersection of technological change and economic inequality and growth, please see ourcurrent Request for Proposals.
The adoption of new technologies always affects how people work, but the possibilities posed by increasingly advanced artificial intelligence, automation, and robotics is spurring new questions about whether new technologies will lead to a seismic shift in the landscape of jobs and work in the United States and abroad. The choices employers make over how to implement new technologies could lead to an array of benefits for workers, such as higher wages, new occupations and industries, and safer working conditions—or various harms, such as lost jobs, weakened worker agency, and dangerous paces of work.
How employers are implementing new technologies will be shaped by the U.S. policy, regulatory, and economic landscape, which will in turn influence the effect of these technologies on workers’ lives and whether those effects will be different for different types of workers.
In this installment of “Expert Focus,” we highlight scholars across disciplines who are helping to advance our understanding of the adoption of new technologies and the future of work. This scope of work includes technological change, worker surveillance, privacy, automation, algorithmic bias, and discrimination. These scholars’ findings can help guide policymakers, business leaders, and advocates who are interested in addressing structural racial, gender, and other inequalities in the U.S. labor market and in labor markets abroad to create a more equitable future for all workers.
Daron Acemoglu
Massachusetts Institute of Technology
Daron Acemoglu is an Institute Professor in the department of Economics at the Massachusetts Institute of Technology. Acemoglu has published a vast amount of research on topics ranging from economic growth and inequality to economic development and labor economics. A subset of Acemoglu’s research includes technological innovation and change on the future of work. In particular, he has written about the implications of new technology—such as AI, automation, and robotics—and the changes they can bring on the economy and the way people work and live.
Recently, Acemoglu published a working paper about the harms of AI, discussing how it can produce various social, economic and political harms, but stating that these harms are not due to the underlying nature of the technology itself, but rather in how it’s being currently used and developed by firms and governments in workplaces. In another working paper with his MIT economist colleague and Equitable Growth Research Advisory Board member and grantee David Autor, Acemoglu and his co-authors study the impact of AI on labor markets using online job vacancies, finding that while AI is currently substituting for humans in a subset of tasks, it is not yet having detectable labor market consequences.
Ifeoma Ajunwa
University of North Carolina at Chapel Hill
Ifeoma Ajunwa is an associate professor of law at the University of North Carolina at Chapel Hill as well as the founding director of the AI Decision-Making Research (AI-DR) Program, a training program for students interested in law and technology. Ajunwa is an expert on the intersection between law and technology, with a focus on the governance, impact, and ethics of new and emerging workplace technology. Often interweaving diversity and inclusion in the labor market into her work, she has written extensively about employment discrimination, worker surveillance, and genetic data and civil rights, and has published op-eds in major outlets such as TheWashington Post, and The Atlantic. In 2019, she wrote an op-ed in TheNew York Times on how more adequate safeguards are needed to prevent unlawful employment discrimination in automated hiring platforms.
In 2020, Ajunwa testified before the U.S. Congress Committee on Education and Labor on protecting workers’ civil rights in the age of technology. Her forthcoming book, The Quantified Worker: Law and Technology in the Modern Workplace (Cambridge University Press, 2022), will examine the role of technology in the workplace and its effects on management practices.
Bo Cowgill
Columbia University
Bo Cowgill is an assistant professor in the Management Division at Columbia University’s Business School whose interests lie in microeconomics, specifically technology information and labor markets. Cowgill writes extensively about artificial intelligence and algorithms, and their intersection with decisionmaking within labor markets and the workplace. His findings have been cited in media outlets such as Forbes, The New York Times, and in scientific and economic journals.
A large part of Cowgill’s research covers bias and fairness, which is the subject of his 2020 paper in which Cowgill develops an economic perspective on algorithmic bias and fairness, stating that algorithms can be used to bring about positive change, but more guidance is needed about how to deploy and regulate algorithms to minimize the potential harmful side effects of their use and implementation. At the Allied Social Science Associations annual meeting in 2020, Cowgill also presented a field experiment of his research on why algorithmic bias occurs, which Equitable Growth featured in a roundup.
Pauline T. Kim
Washington University in St. Louis
Pauline T. Kim is the Daniel Noyes Kirby Professor of Law at the Washington University in St. Louis and the co-director of its Center For Empirical Research, which promotes, supports, and enhances research about law and legal institutions. Kim specializes in employment law and has published her research and findings in numerous Law Journals. Much of Kim’s research focuses on how the adoption and use of new technologies such as artificial intelligence, algorithms, and big data in the workplace legally intersects with employee privacy, discrimination, equality, and fairness.
In a recent Virginia Law Reviewarticle, Kim explores the concept of “manipulating opportunity,” where predictive algorithms control what information is delivered to whom, resulting in the potential of creating inequality and discriminatory effects in opportunity markets such as employment, housing, and credit. Her work “AI and Inequality” looks at the social consequences of AI-powered tools and their threat to worsen class inequality. Currently, Kim, along with her co-authors, publishes Work Law: Cases and Materials, a multi-edition textbook that takes a comprehensive view on employment law. Be on the lookout for her forthcoming article in the California Law Review that explores the extent to which designers can and should take race into account in order to mitigate or remove bias when building predictive algorithms.
Steve Viscelli
University of Pennsylvania
Steve Viscelli is a faculty fellow at the Kleinman Center for Energy Policy at the University of Pennsylvania and a lecturer in the Department of Sociology who studies work, automation, public policy, and energy and climate change. Much of Viscelli’s research and consulting expertise focuses on the freight transportation industry, which is the subject of his 2016 book, The Big Rig: Trucking and the Decline of the American Dream, in which he takes an ethnographic approach to exploring how the deregulation of trucking and the rise of independent contracting transformed the trucking industry in the United States.
In 2020, Viscelli received an Equitable Growth grant to examine how last-mile delivery workers experience new technological and outsourcing practices within the package delivery industry. Recently, Equitable Growth was excited to have Viscelli as a panelist during “A future for all workers: Technology and worker power,” a virtual event held in February 2021 where he discussed how workers can use technology to exercise their voice at work. Viscelli is set to release a book in 2022 based on his 2018 report titled “Driverless? Autonomous Trucks and the Future of the American Trucker,” which explores the potential impacts of self-driving trucks on labor, workers, and the environment, and the role public policy will play in shaping them.
Equitable Growth is building a network of experts across disciplines and at various stages in their career who can exchange ideas and ensure that research on inequality and broadly shared growth is relevant, accessible, and informative to both the policymaking process and future research agendas. Explore the ways you can connect with our network or take advantage of the support we offer here.
1. This is the best testimony that I have seen this month. In the United States today, we do not have enough within-the-household work to be done nor a sharp enough gendered division of labor for it to make any sense at all no matter what your theory of society to confine large groups of people to household production and care work. Yet today there is enough care work and household production to be done that it makes no sense to confine anybody to working full-time outside-the-home with zero flexibility. The neoclassical economist in me wants to believe that private agents seeking win-win bargains would have figured out these workforce and work-structuring questions in an optimal way long before now. But it manifestly is not true. Read Michelle Holder recent testimony before the House Select Committee on Economic Disparity and Fairness in Growth,” in which she says: “Fully investing in paid leave will spur economic growth through increased labor force participation and improved productivity today, and through enhanced human capital in the workers of tomorrow. Many people in the United States play dual roles as workers in the paid labor force and as unpaid caregivers to their loved ones. Occasionally, workers need weeks or months away from work to devote themselves fully to caregiving, such as when a new child enters a family through birth, adoption, or foster placement, or when a loved one struggles with a serious medical condition such as cancer, or even when workers themselves experience a serious medical need.”
2. This is the best conference panel I have watched this month. Discrimination continues to be an incredibly stubborn fact in the U.S. economy and society even though next to nobody will ever confess up to wishing to discriminate. As best as I can tell, most discrimination that takes place takes place either because of leisure and past-employment social-network structures, and because of a widespread albeit largely false belief that statistical discrimination is somehow wealth-maximizing. Read the papers included in Kate Bahn’s conference panel at the Southern Economic Association.
Worthy reads not from Equitable Growth:
1. We have a small but pricey grocery store two blocks away. We have a big Safeway 10 blocks away from us. Minor trips thus do not require a car. Nor do trips to the coffee shop, or the cleaners. In a different America, it would be possible for this to be true of most of at least close-in suburbia. But, regrettably, it is not. Read Addison Del Mastro, “Going Nowhere Fast: An intersection, and a Rorschach test,” in which he writes: “What is going on here? … A land-use pattern that virtually requires car trips for nearly everything. … What we’re seeing at this is really the opposite of overcrowding. It’s a little like one of those noisemaker toys with a couple of marbles inside a sphere. If you shake it, the marbles are everywhere and it feels like it’s full of them. But there are still just two. They’re going nowhere fast. … Total people and total car trips are not directly related, and it’s largely poor land use that makes them appear to be.”
2. Trying to make sense in historical perspective of the extraordinarily uneven progress of feminism across the globe in the 20th century, my big regret is that it looks like Alice Evans‘s big book on this is likely to be more than five years in the future. But who am I to talk? Read Alice Evans, “Ten Thousand Years of Patriarchy,” in which she writes: “What explains the Great Gender Divergence? … Three kinds of agricultural societies [do] … patrilineal, bilateral and matrilineal. In Eurasia, patrilineal communities transmitted land and herds to sons … [amid] tight restrictions on women’s sexuality and mobility. … Horticultural societies in Southern Africa and Southeast Asia tended to be matrilineal … [with] less concern for paternity, [so] women moved freely. … The Middle East and South Asia grew even more endogamous (through cousin marriage and caste). Since rumors of female promiscuity would dishonor the entire lineage, women were increasingly cloistered, especially in socially diverse towns. Meanwhile in medieval Europe emerged several latent advantages: nuclear families and participatory assemblies. … Patriarchal dominance was not geographically determined, but was also a product of cultural evolution. … Patriarchy was cemented in Eurasia by the emergence over 2000 years ago of religions with Big Gods meting out supernatural punishment. … Progress toward gender equality was contingent on strong growth, weak systems of kinship and democratisation. If prevailing wages are too low to compensate for the loss of honor, female seclusion persists (as in much of India, Iran and Egypt). These effects are compounded by political trajectories.”
New cross-country research by economist David Howell at The New School (also an Equitable Growth grantee and a member of Equitable Growth’s Research Advisory Board) provides strong evidence that the patterns of low pay and persistent inequality for workers in the United States are the result of weak U.S. labor institutions and decades of policy choices. This research analyzes variations in pay quality for workers across several countries with similar market forces in recent decades, including an analysis of pay quality (see sidebar) for young workers ages 18–34 who do not have a college degree since 2000.
Some economists argue that the poor earnings outcomes for non-college-educated workers in the United States are due to a so-called skills gap or market forces that reward higher education due to skill-biased technical change. In contrast, Howell’s analysis shows that not only are outcomes for these workers markedly better in some countries than others—despite facing similar technological and market forces—but also that differences in pay quality are closely connected to the relative strength of labor institutions and worker power in those countries.
Young workers without a college degree in the United States have ‘exceptionally’ poor wage outcomes
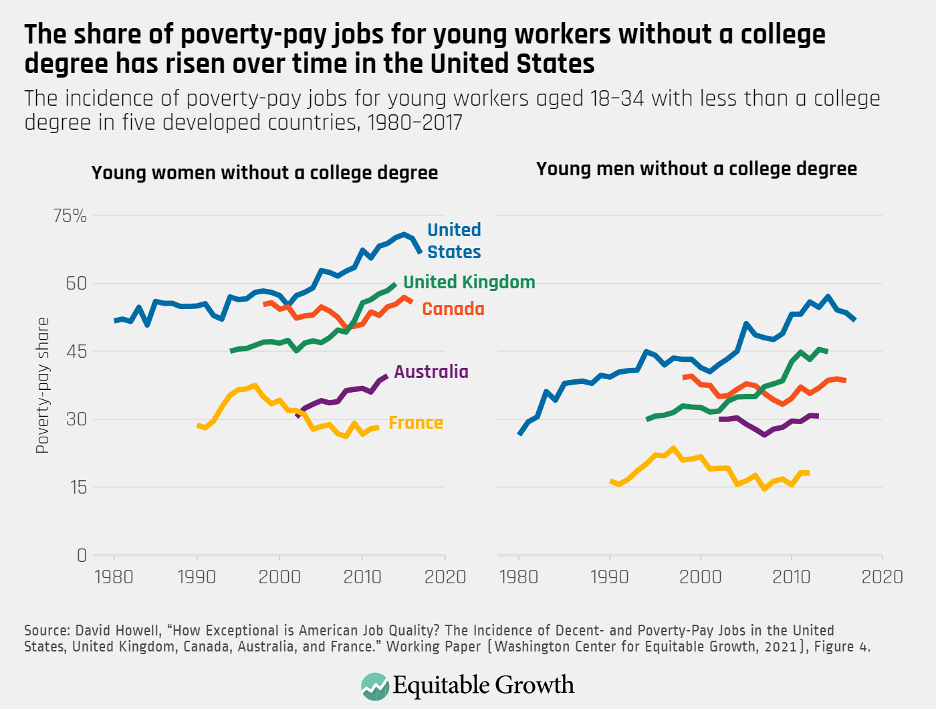
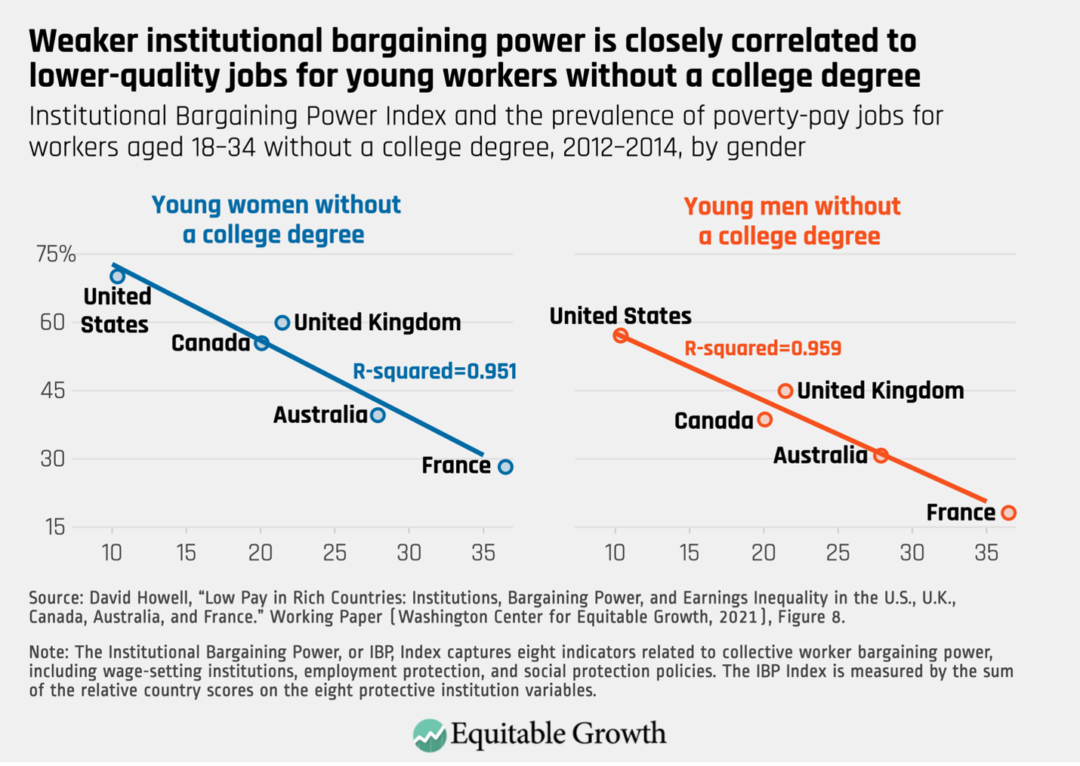
More than half of young workers ages 18 to 34 without a college degree in the United States earn poverty-level pay, with 70 percent of young women without degrees and 57 percent of young men working poverty-pay jobs. This level is markedly higher than it is in other, similar European countries and is only a fraction of that level in France—28 percent for young women without degrees and just 18 percent for young men without degrees. (See Figure 1.)
Figure 1
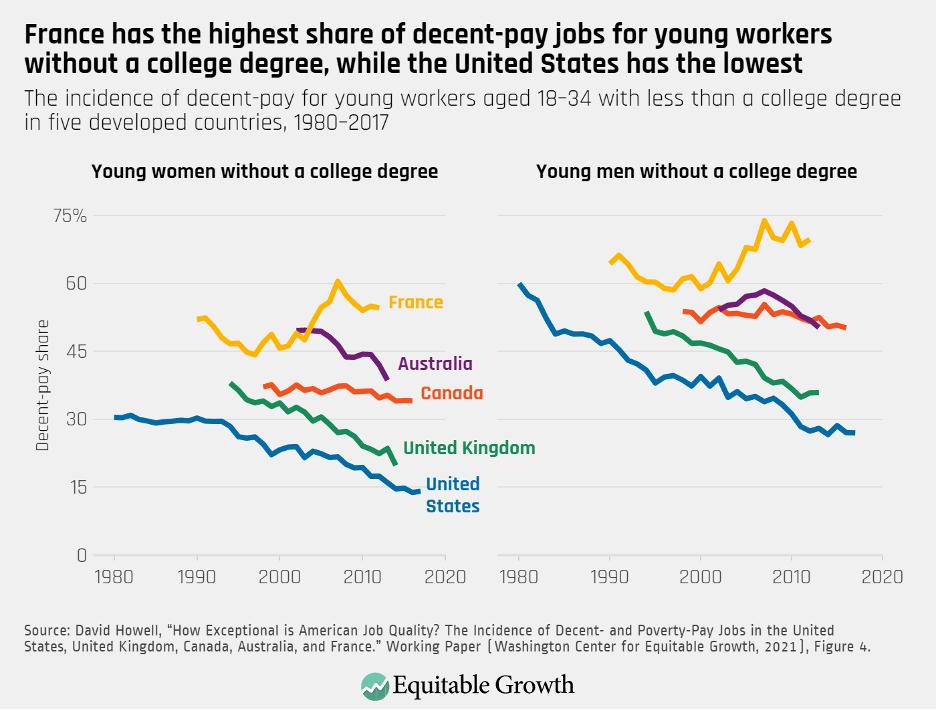
Looking at decent-pay jobs instead of poverty-pay jobs, the reverse is also clear. France consistently has a higher incidence of decent-pay jobs among young workers without college degrees, for both men and women, while the United States has the lowest incidence. The decent-pay gap between young, non-college-educated women in France and the United States rose from 22 percentage points in 1990 to more than 37 percentage points in 2012, and likewise rose for young, non-college-educated men in the same time period, from 17 percentage points to more than 42 percentage points.
Howell also shows that improving pay quality does not come at the cost of more inefficient labor markets. In other words, he demonstrates that the United States does not “make up” for its poor pay quality for non-college-educated workers with higher employment rates for that group. While specific outcomes vary for each country, the evidence does not show a clear or consistent link between countries’ employment levels and bottom-end pay distributions. (See Figure 2.)
Figure 2
Furthermore, workers in countries with higher pay quality in the bottom half of the pay distribution do not face higher tax levels overall. In fact, Howell writes, “[t]he tax burden on American low-wage workers (21.5%) was, next to France, the highest—well above Canada (18.7%) and the U.K. (19.1%).”
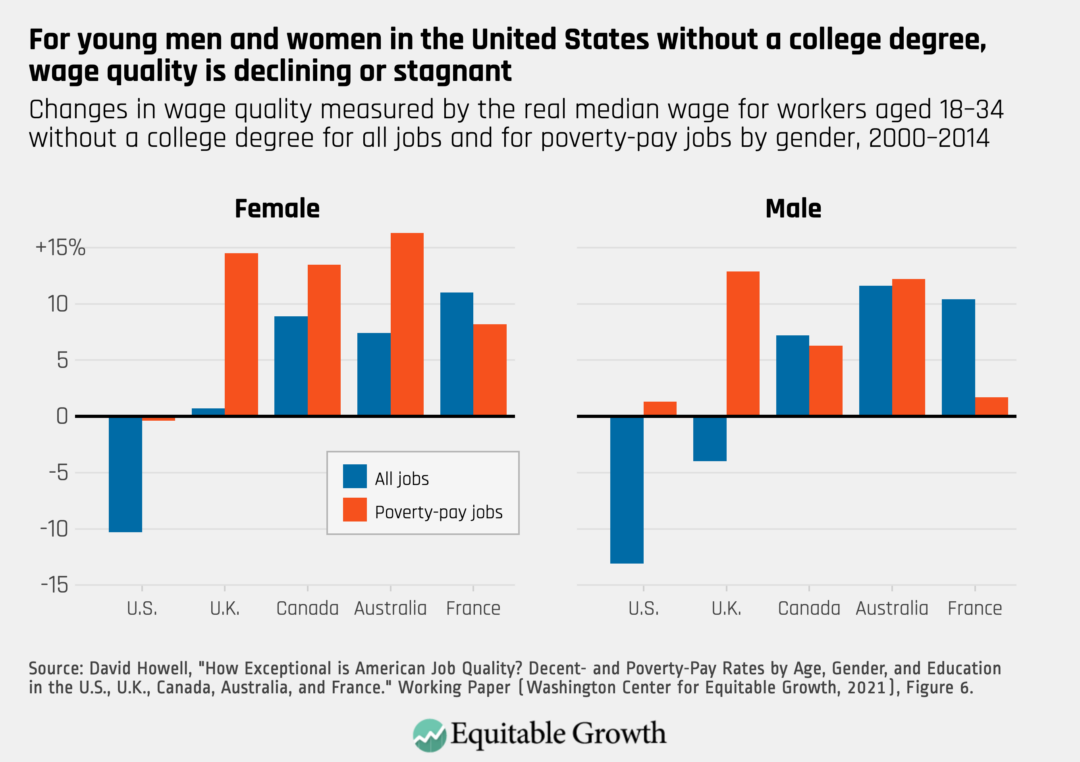
Indeed, earnings for young workers without college degrees are not only much better in other countries, but wage quality for these workers also has actually improved in many other countries in recent years. For instance, between 2000 and 2014—a time of growing use of technology and other global economic changes—real median wages for young men without a college degree in Australia grew by 11.6 percent. In the United States and the United Kingdom, by contrast, wage quality for young workers without a college degree stagnated or declined during this period. (See Figure 3.)
Figure 3
While these patterns of declining pay quality in the United States are most striking for young workers with lower levels of education, Howell has previously shown that pay quality is also declining for young workers with degrees. His 2019 working paper showed that between 1979 and 2017, the share of young workers with less than a college degree holding poverty-pay jobs (defined in this paper as “lousy-wage” jobs) rose from 35.8 percent to 56.5 percent.
Yet Howell also demonstrates that the share of young workers with a college degree in poverty-pay jobs rose as well, from 10.8 percent to 14.7 percent. This analysis further challenges narratives of skill-based job polarization because, as Howell notes, the share of young workers with a college degree in jobs at the top and middle of the job-quality distribution declined between 1979 and 2017, while increasing in the bottom of the distribution.
The close connection between worker power and pay quality
In order to measure the relative strength of labor institutions and policies related to worker power, the author develops an index of institutional bargaining power that represents the types of national institutional and policy regimes that can affect workers’ bargaining power over pay—collective bargaining coverage, national minimum wages, employment protections, and income supports. The measures that make up this index each reflect the relative strength of each institution or policy between countries.
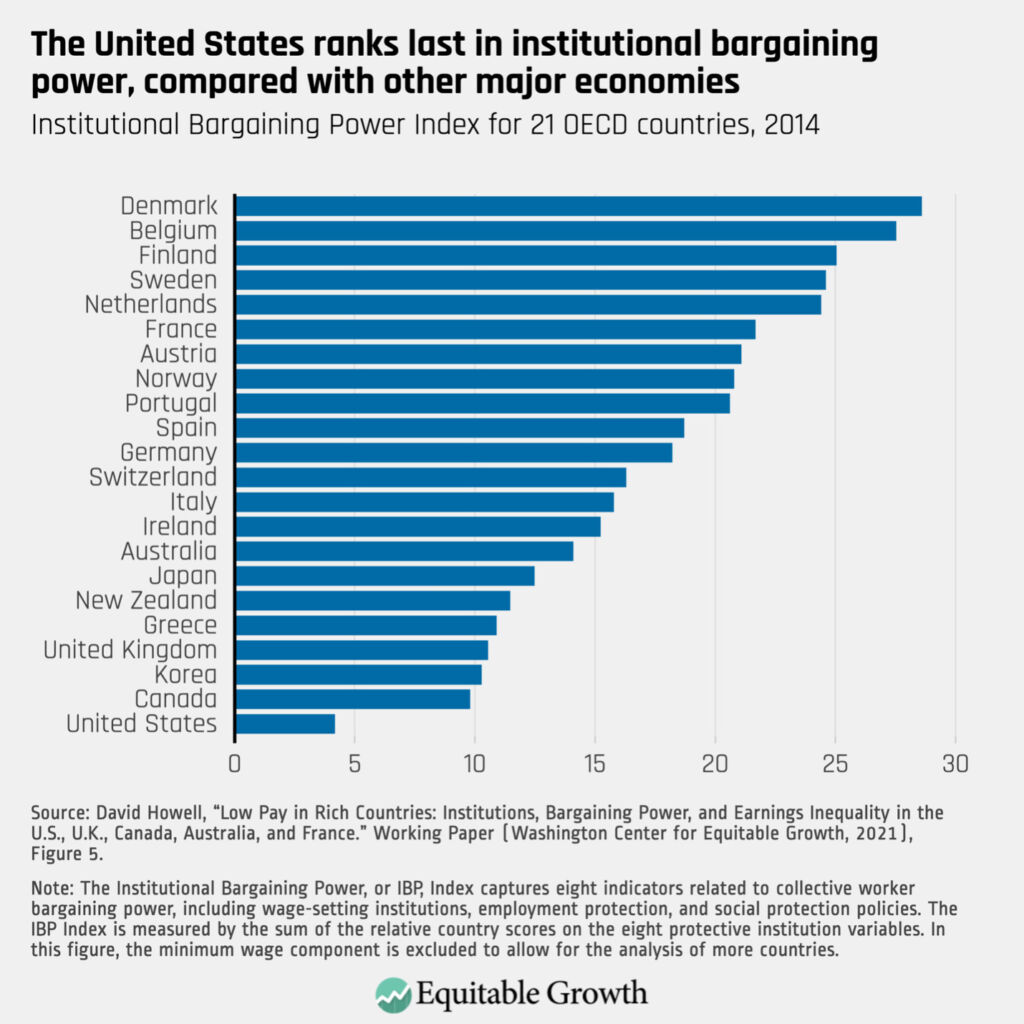
The United States ranks last in institutional bargaining power, compared to other similar economies—not only within the set of five comparable countries that are the focus of this analysis, but also in a broader set of 21 OECD countries. Within the five countries of focus for this analysis, France has the highest institutional bargaining power index score, followed by Australia, the United Kingdom, Canada, and the United States. (See Figure 4.)
Howell finds that the differences in earnings inequality between the United States and the other countries for workers in the bottom half of the pay distribution—including young workers without a college degree—are almost entirely explained by countries’ policy decisions around wage setting and labor protections. Countries with protective labor policies and institutions that strengthen worker power have less inequality and higher pay quality for young workers in the bottom half of the wage distribution who do not have college degrees. (See Figure 5.)
Figure 5
This relationship between bargaining power and pay quality holds when Howell extends the analysis to a broader set of 21 wealthier member countries of the Organisation for Economic Co-operation and Development. Howell also finds consistent correlations between bargaining power and other measures of wage levels and distribution, such as the OECD’s 50-10 earnings ratio definition of earnings inequality and low-pay rate.
Conclusion
This research provides further evidence why a college degree or greater credentials is not the solution to U.S. pay inequality. Pay quality is indeed dramatically higher for U.S. workers with college degrees, but the evidence shows that the earnings differentials from education levels are not necessarily driven by changing skill requirements.
Instead, as Howell writes, the growing pay inequality in the United States and the differences between the U.S. economy and similar economies “reflect fundamental features of national institutional and policy regimes designed to regulate labor markets and protect worker interests.”
The Southern Economic Association recently held its 91st Annual Meeting, gathering a diverse group of scholars from U.S. and international universities to discuss their research in theory and applied economics. The hybrid in-person/virtual event, which took place over 3 days in late November, featured dozens of sessions on a range of topics, from policing and public policy to the economic impact of the COVID-19 pandemic, and from market power and antitrust to a number of other topics specifically related to economic inequality and growth.
Equitable Growth staff organized, chaired, and participated in several different panel sessions at SEA’s annual meeting this year, highlighting a number of our research priorities and policy areas of interest, as well as our important role as a grantmaking institution.
On the first day of the event, Kate Bahn, our director of labor market policy and interim chief economist, organized a virtual panel on discrimination in the labor market. Among the highlights:
Multiple Equitable Growth grantees presented their research to attendees. Cornell University’s Jamein Cunningham discussed Equitable Growth-funded research on civil rights enforcement and the racial wage gap. The University of Memphis’ Jose Joaquín Lopez highlighted the effects of the Civil Rights Acts of 1991 on jury trials for employment discrimination cases. And Bobby Chung of St. Bonaventure University spoke of his joint work with Equitable Growth grantee Peter Blair of the Harvard Graduate School of Education on occupational licensing and statistical discrimination.
The panel also featured forthcoming work by Anastasia Wilson, assistant professor at Hobart and William Smith Colleges, and Luke Petach, assistant professor at Belmont University, on “guard labor” in the U.S. economy.
Equitable Growth also organized and co-hosted an in-person panel session with the Russel Sage Foundation, titled “Elements of Successful Grant Proposals for Research on Inequality.” The session focused on providing insights into what researchers should know before submitting a grant proposal, how to assess whether their research is the right fit for a funder’s priorities, elements of a winning grant application, and the resources available to support them in the grant-seeking process. Among the highlights:
Christian Edlagan, Equitable Growth’s senior manager of academic engagement, and Stephen Glauser, program officer at the Russell Sage Foundation, opened with brief remarks on their organizations’ funding priorities, including the Equitable Growth 2022 Request for Proposals.
Ann Huff Stevens, dean of the College of Liberal Arts at the University of Texas at Austin, and Andria Smythe, assistant professor of economics at Howard University, both spoke about their own experiences as grantees and external reviewers to shed light on the process of applying for research funding.
The speakers also touched upon how best to foster interdisciplinary collaboration and methodological diversity, increase the number of successful applicants from members of underrepresented groups, and the unique challenges posed by the ongoing pandemic and racial reckoning that have disproportionately impacted communities of color in the United States.
Later that day, Corey Husak, a tax and policy advisor at the U.S. Senate (and formerly of Equitable Growth), chaired a session on labor and geographic mobility. Among the highlights:
Husak and Carmen Sanchez Cumming, senior research assistant at Equitable Growth, presented their research, co-authored with Yi Geng and Daniel Muhammad at the DC Office of the Chief Financial Officer, on self-employment and the minimum wage.
In the same session, Arvind Sharma, doctoral candidate at Northwestern University, presented his research on the effect of occupational licensing on interstate migration, Protika Bhattacharjee at the University of New Hampshire discussed her research on the implications of air quality on migration decisions, and Ashley Orr at Carnegie Mellon University presented her paper, “Examining Family Mobility Considering Human Capital Investments in Children.”
In addition, several Equitable Growth grantees and other network members participated or were featured in at least 18 different sessions over the course of the conference. A few highlights included:
The conference keynote address was given by William A. “Sandy” Darity Jr., the Samuel DuBois Cook professor of public policy, African and African American studies, and economics and the director of the Samuel DuBois Cook Center on Social Equity at Duke University, and a member of Equitable Growth’s Research Advisory Board. Darity argued for a new economics anchored in understanding inequality and uncertainty of choice and discussed the economic history of the racial wealth divide and the value of stratification economics.
Lisa Cook, associate professor at Michigan State University and an Equitable Steering Committee member, organized and chaired a session on “Advances in Innovation Research,” where she also presented Equitable Growth-funded research, “Pink and Black,” on the implications of U.S. gender and racial disparities in income and wealth at each stage of the innovation process.
Darrick Hamilton, Henry Cohen professor of economics and urban policy at The New School for Social Research and an Equitable Growth grantee, organized a presidential panel on race, stratification, and economic rights that featured Naomi Zewde, assistant professor at the City University of New York, who discussed historic structural racism in housing and urban development policy design, and Dania V. Francis, assistant professor at the University of Massachusetts Boston, who presented on the need to broaden who qualifies as part of the economics profession. The panel also featured Colorado State University’s Guy Numa and the New School’s Grieve Chelwa, both of whom discussed the importance of the political and historical influence of ideological biases in economic analyses.
Robynn Cox, assistant professor at the University of Southern California, presented on the impacts of employee ownership—particularly Employee Stock Ownership Plans, or ESOPs—on labor market outcomes of the formerly incarcerated during a panel on “Labor Market Disparities.” She also presented different research, co-authored with Sarah Andrea Jacobson at Williams College, on the effects of race on perceptions of criminality and employment in a virtual panel on the economics of race, law, and crime.
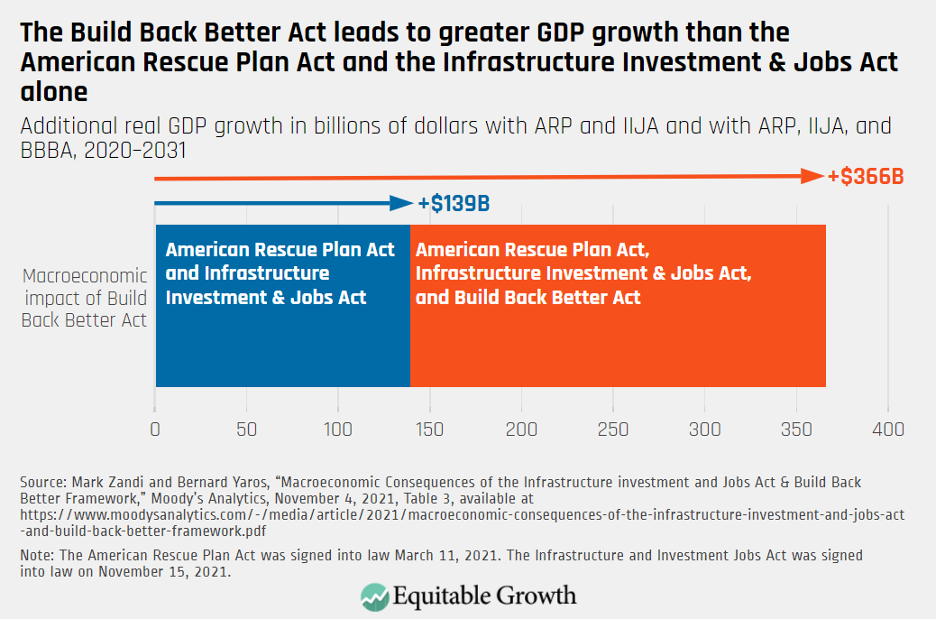
During the session titled “Economics of Gender and Economics of the Household,” Nancy Folbre, an Equitable Growth grantee and professor emerita of economics at the University of Massachusetts Amherst, highlighted features of the Build Back Better Act recently passed by the U.S. House of Representatives and now under debate in the U.S. Senate, including the Child Tax Credit, paid family leave, and subsidized child care, as contributing to the household bargaining power of women, who disproportionately take on care work.
On a panel titled “Beyond a Deficit Perspective: Economic Analysis of Racial Disparities,” Fenaba Addo, an associate professor at The University of North Carolina at Chapel Hill and an Equitable Growth grantee, presented on racial disparities in student debt and the millennial racial wealth divide. Kyle K. Moore, an economist at the Economic Policy Institute and a former Dissertation Scholar at Equitable Growth, also presented on stratification economics and racial disparities in health.
During a panel on “Poverty in the U.S.: The Safety Net, Laws, and Shocks,” Derek Wu, a Ph.D. candidate in public policy at the University of Chicago and an Equitable Growth grantee, presented Equitable Growth-funded research on the impacts of welfare cuts on well-being during the Great Recession.
Throughout the event, Equitable Growth’s commitment to supporting new research on inequality and growth, and increasing diversity in the economics profession—including by supporting scholars in various phases of their careers and from an array of backgrounds—shone through. For more information on how Equitable Growth seeds research from a range of disciplines and to learn about current funding opportunities, visit our 2022 Request for Proposals page.
Hearing on “Growing our Economy by Investing in Families: How Supporting Family Caregiving Expands Economic Opportunity and Benefits All Americans”
Testimony by Michelle Holder, President and CEO of the Washington Center for Equitable Growth
December 8, 2021
Introduction
Thank you, Chair Himes and Ranking Member Steil, for inviting me to speak today. It’s an honor to be here virtually.
My name is Michelle Holder, and I am president and CEO of the Washington Center for Equitable Growth, an organization that seeks to advance evidence-backed ideas and policies that promote strong, stable, and broad-based economic growth. I also serve as an associate professor of economics at John Jay College, which is part of the City University of New York.
In addition to the work I perform in the paid labor market as an economist, I also do work every day as a mother of two young children and as a caregiver to my elderly mother, who recently suffered a serious injury and is currently in the hospital under intensive care, which is why I can’t be in Washington with you today. My dual roles, as economist and as care provider, equip me well to speak to you today about what the care economy is and how it affects our nation’s macroeconomic outlook.
So, what is the care economy? This term was popularized by University of Massachusetts Amherst economist Nancy Folbre and usually refers to the system through which services vital to caring for the U.S. population are delivered.1 This care work is both paid and unpaid, and encompasses tasks ranging from the delivery of specialized medical care to the folding of laundry.2
One in five people in this country are in a caregiving relationship, and this number will grow as our population ages.3 As my fellow witness Ai-Jen Poo often says, this care work is the work that makes all other work possible. Workers will not report to office desks or construction sites, medical clinics or restaurant kitchens, if their loved ones are not safe and cared for.
Yet large segments of the care economy are invisible in our normal accounting frameworks because it can be difficult to accurately value care work. When we provide care for our loved ones, and no money changes hands, it is difficult to put a price tag on this essential labor. Many families also supplement the care they provide to their loved ones with services they purchase. These services are expensive. So, when we leave it to families and individuals to shoulder these costs, many forego the supports they need. But it’s not just families and individuals who lose out when this happens. Our whole society suffers when families and individuals lack the care they need. Historically, there has been a lack of government support for care provision despite broad benefits to the entire U.S. economy. Economists call this state of affairs a market failure.4
Today, I will discuss the consequences of this market failure—a failure that leads to the dampening of economic growth. We can see this market failure playing out in care-economy institutions ranging from our systems for providing home- and community-based services and supports to older adults and people with disabilities to the important, but undervalued, work of cleaning homes.
For today’s hearing, I will illustrate the relationship between investments in the care economy and economic growth by examining two case studies. First, I will discuss paid family and medical leave. When we underinvest in paid leave, we see drops in labor force participation, productivity, and levels of human capital development, which constricts economic growth. Second, I will show how a similar story plays out in the case of child care.
I will then present and solve a puzzle: Given the common-sense justification for investments in care, why do we underinvest in care? Biases toward economic inputs that are easily quantifiable, against women, and against women of color in particular, have led us to undervalue care, underinvest in this bedrock component of our economic infrastructure, and constrict growth.
I will close by offering an alternative path forward. We can take off the blinders that are created by our biases and invest in vibrant care economy institutions. We have a roadmap for these investments in the Build Back Better legislation now before Congress, and there is still more that we can do to fully invest in care and allow our economy to achieve its full growth potential.
The economic benefits of investing in paid leave
Fully investing in paid leave will spur economic growth through increased labor force participation and improved productivity today, and through enhanced human capital in the workers of tomorrow. Many people in the United States play dual roles as workers in the paid labor force and as unpaid caregivers to their loved ones. Occasionally, workers need weeks or months away from work to devote themselves fully to caregiving, such as when a new child enters a family through birth, adoption, or foster placement, or when a loved one struggles with a serious medical condition such as cancer, or even when workers themselves experience a serious medical need.
But bills don’t stop coming when our loved ones need us, and 1 in 5 unpaid family caregivers in the United States say that they have left bills unpaid or have paid them late. Moreover, about half of caregivers have experienced financial difficulties—from stopping saving to taking on debt—as a result of their caregiving obligations.5 And despite the overwhelming evidence that you and I and most every other worker in the United States will encounter these caregiving needs at some point in our lives, the United States is the only wealthy nation in the world that does not provide its workforce with any type of paid family and medical leave, forcing workers to leave well-matched jobs prematurely and forcing us all to pay the price of the harm done to our economy.
Paid family and medical leave provides wage replacement to workers who take time off from work to attend to the needs of a loved one or their own serious medical condition. But when it comes to family leave, just 1 in 5 workers has access to paid family leave through their employers, and the figure is closer to 1 in 20 for the lowest-paid workers, who are disproportionately workers of color and especially women workers of color.6
If the private market is correcting this problem, then the correction is occurring at a glacial pace. Between 2010 and 2020, the United States added an average of just 1 percentage point of paid family leave coverage across the labor force each year—and much less than that for the lowest-paid workers. As Vicki Shabo at New America has shown, if we continue at this pace, the average worker won’t have access to paid leave from their employer until the year 2100, and the lowest-paid workers will have to wait even longer.7
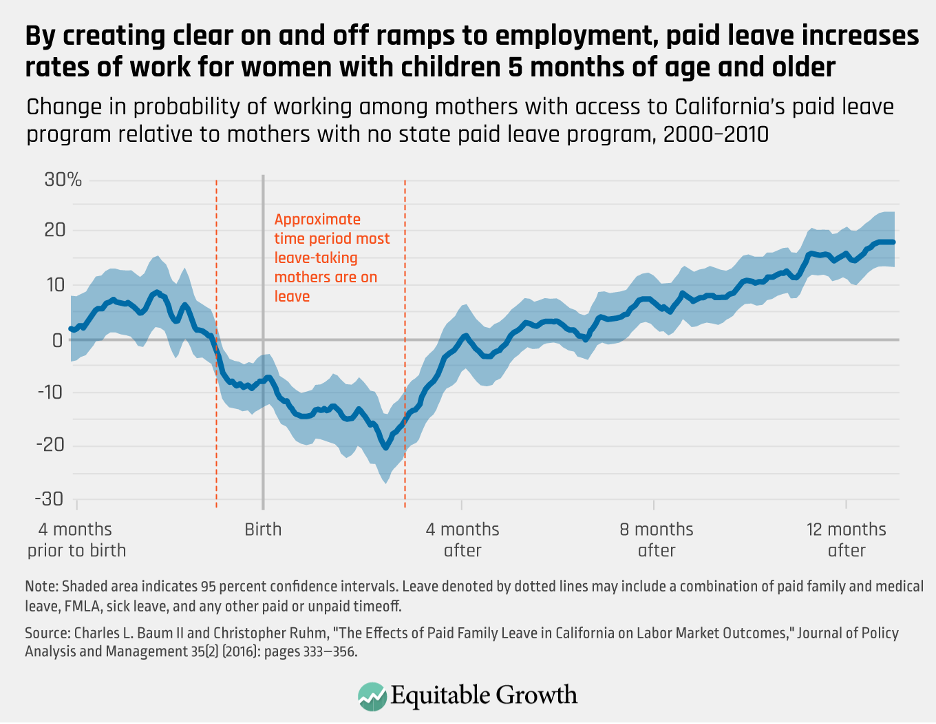
But in six states and the District of Columbia, workers aren’t waiting for their employers. Today, they can access comprehensive paid family and medical leave programs through their state governments. Research conducted on these state programs shows that paid leave fuels our major engines of economic growth. Research consistently shows that paid leave increases the likelihood of maternal labor force participation after the birth of a child, likely because it provides clear on and off ramps to work, as shown in Figure 1.8
Figure 1
Looking beyond leave to bond with a new child to broader leave for caregiving, one recent study found a similar increase in labor force participation associated with caregiving leave, while another found that when spouses of people with serious health conditions live in states with paid caregiving leave programs, they reduce their work hours less than similar spouses in states without these programs.9
Paid leave also allows workers to address their own health conditions so that they can be fully present at work. The cost of presenteeism—or working while sick, which ill workers must do when they can’t take time off—should not be minimized. A study of the Dow Chemical Company found that presenteeism resulted in diminished productivity that cost employers more than the combined cost of productivity losses from work absences and employer expenditures on medical treatment.10
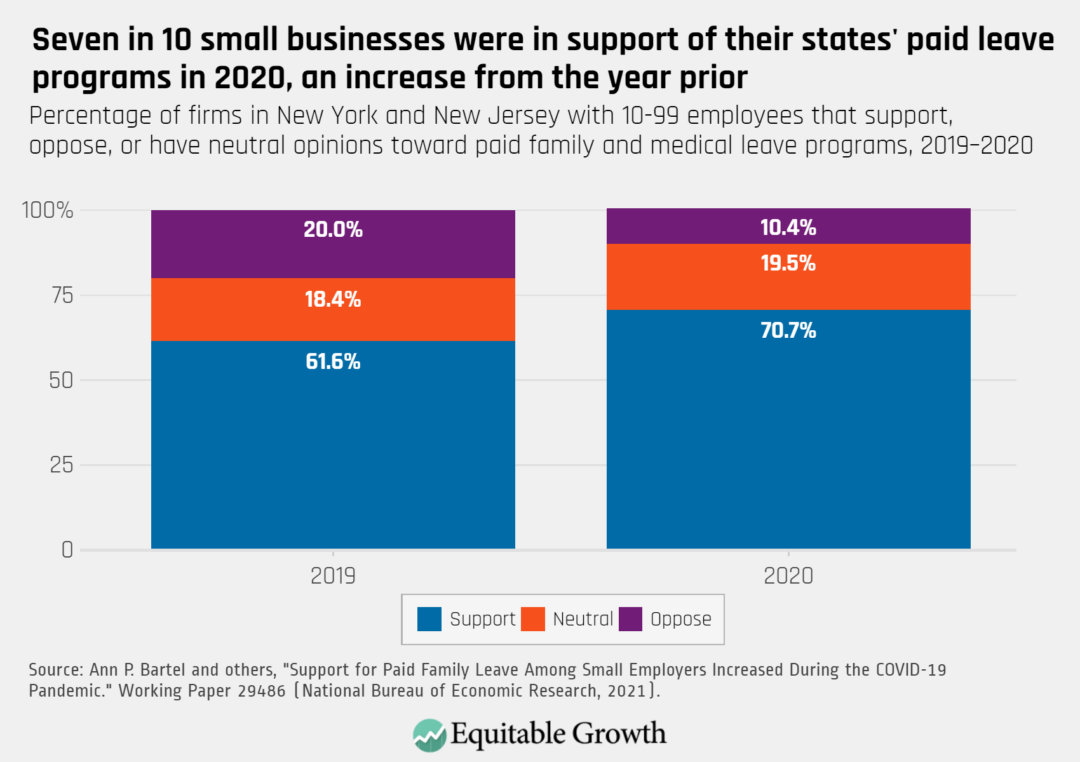
These improvements to workforce participation and productivity appeal to employers, which might be one reason that a working paper recently released on the National Bureau of Economic Research website finds that 7 out of 10 small employers in two states with paid family and medical leave programs expressed support for the policy in 2020, an increase from the prior year.11 (See Figure 2.)
Figure 2
And when employers use their state paid leave programs, they like paid leave programs more, not less. Increases in employee use of paid leave are associated with increases in employer support for the program.12 Support for paid leave programs among small employers makes sense, since a public program takes the costly and complicated task of setting up your own paid leave program off small business owners’ already very full plates. And a universal paid leave benefit allows small firms to compete for talent on an even playing field with the bigger guys, who today use their considerable resources to offer paid leave at higher rates than small businesses.13
Paid leave programs aren’t just associated with economic growth today. A large body of evidence shows that paid leave for new parents leads to improvements in child well-being. When paid leave is available, rates of attention deficit/hyperactivity disorder, obesity, ear infections, and the hearing problems they cause decrease.14 So, too, do hospital admissions for the head trauma that indicates child abuse.15 At the same time, rates of breastfeeding increase, as does the amount of time parents spend reading and working on homework with their children.16
Those improvements in well-being for today’s children translates to improved human capital and increased productivity for the workers of tomorrow. Despite these benefits, workers in 44 states do not currently have access to a public paid family and medical leave program, thus depressing labor force participation, decreasing productivity, dampening the development of human capital, and ultimately constricting the growth of our economy.
Investments in child care spur economic growth and stabilize the macroeconomy
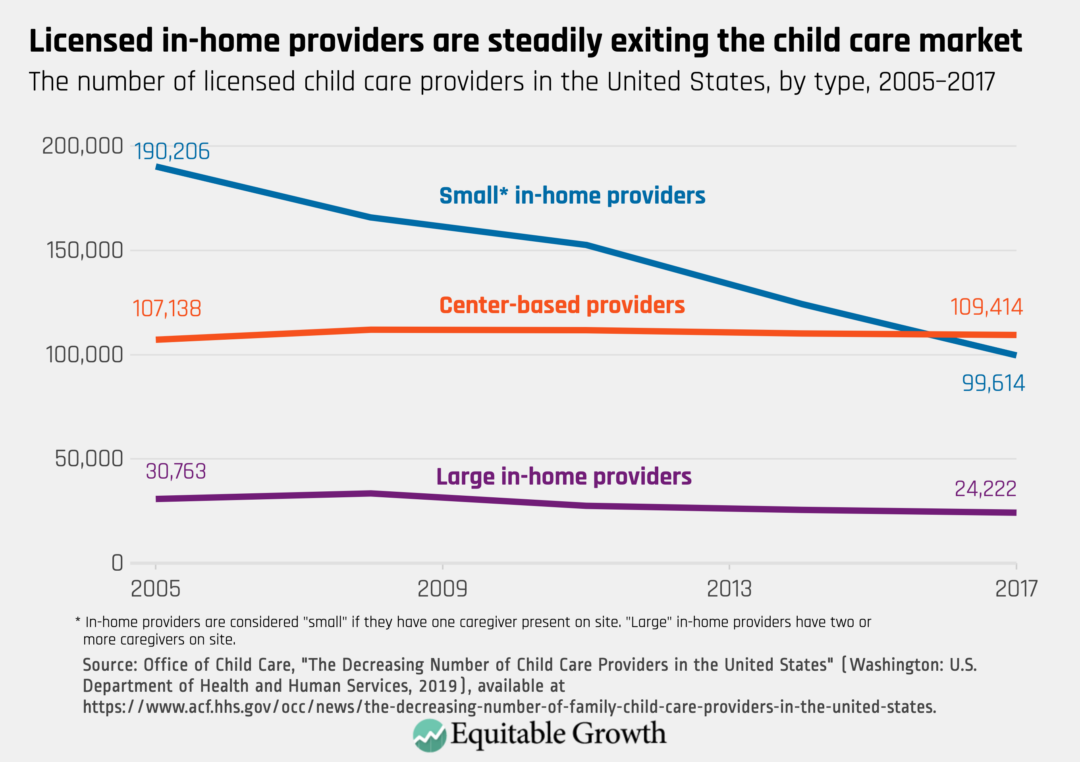
Paid leave programs typically provide time off to care for a new child in their first year of life, but the need to provide care does not end at a child’s first birthday. Most parents need help with child care, either from providers or relatives, but that help can be hard to find.17 Overall, the number of licensed child care facilities shrunk by nearly 32 percent in recent decades, primarily due to small in-home providers exiting the market.18 (See Figure 3.)
Figure 3
In 2019, even before the pandemic’s devastating effects on the child care industry, roughly half of U.S. families lived in “child care deserts,” defined as U.S. Census Bureau tracts where there are three young children for every licensed child care slot.19 The coronavirus pandemic only worsened these supply challenges. Further, at an average cost of more than $9,000 annually, the price tag of care puts child care out of reach for many U.S. families.20
Moreover, when families can access child care, the quality of care is inconsistent. The caregiver turnover rate is one important indicator of care quality. Consistent relationships with caring adults is crucial to healthy child development, and research has demonstrated that teacher turnover can have negative impacts on a child’s cognitive and social development.21 While rates vary widely, average caregiver turnover rates are high: For every four child care workers employed at the beginning of a year, one will leave before the year’s end.22Research has consistently shown that when pay is low, turnover increases, and that turnover rates for workers who care for young children—whose needs are greater—are higher than for older children.23
The inability to access affordable, high-quality child care is devastating for families. It also constricts our economy’s ability to grow. Research shows that when the supply of child care in a community increases, so too does that community’s parental labor supply.24 Likewise, when the cost of child care decreases, time and again, researchers find an associated increase in parental labor supply.
Recent studies in the U.S. context find that a 10 percent reduction in child care costs increases maternal employment by between 0.5 percent and 2.5 percent.25 To put that in more concrete terms, in a state such as West Virginia, where about 136,000 women have children at home and participate in the civilian labor force, a 10 percent reduction in child care costs would lead to around 3,400 women entering the labor force. That’s 3,400 more breadwinners for families with children, 3,400 more productive workers, and more dollars in the pockets of 3,400 consumers to support local businesses.
More research is needed to understand how the quality and continuity of available child care options affects parental labor force participation. But a 2008 study of mothers in low-wage jobs found that 19 percent stopped working entirely in the same quarter in which they experienced a disruption to their child care arrangements, compared to only 9 percent who did not experience such a disruption.26 The evidence strongly suggests that when child care is available, affordable, and high-quality, more parents get jobs and keep them.
As a result, our economy grows. Employers have access to a larger workforce from which to select talent, and workers are less likely to leave well-matched jobs prematurely, which saves firms rehiring and retraining costs. And it’s not just workers who are brought off the sidelines, but entrepreneurs as well.27 Parents with winning business ideas will be freed to launch ventures and pursue the American Dream, household incomes rise and drive consumer spending, and the tax base from which we can fund pro-growth government programs grows.
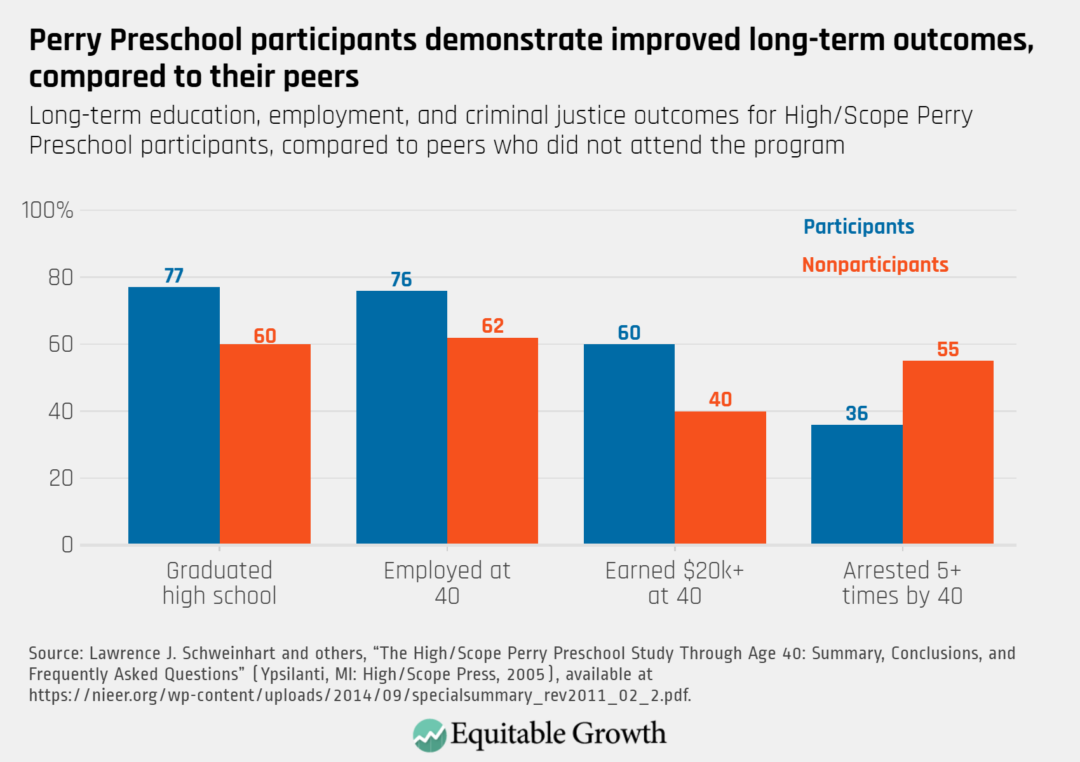
And, similarly to paid leave, the provision of child care, including pre-Kindergarten, affects the economic growth of tomorrow by increasing human capital for the next generation of workers.28Research on high-quality preschool programs consistently shows that participation in these programs lead to improved outcomes in high school, college, and in the adult workforce.29 Compared to their peers who did not participate in early childhood education, participants in one closely studied, high-quality early childhood education program were 17 percentage points more likely to graduate high school, 14 percentage points more likely to be employed at age 40, 20 percentage points more likely to have yearly earnings of more than $20,000 at age 40, and 19 percentage points less likely to have had significant contact with the criminal justice system. (See Figure 4.)
Figure 4
As we have recently seen all too clearly, child care also has an important role to play in stabilizing the macroeconomy. The child care market is fragile. A combination of reliance on out-of-pocket payments that strain parents’ budgets and slim profit margins means that even a small downturn in the economy can cause a damaging and persistent ripple through the child care sector as parents pull their children out of child care. This pushes providers into the red, which results in layoffs, reduced capacity, and permanent closures from which it can be difficult or impossible to rebound.
We’ve seen this play out during the coronavirus pandemic, as well as prior economic recessions. When unemployment rates increase in the broad labor market, they increase more quickly in the child care sector: Every 1 percent decline in a state’s overall employment is associated with a 1.04 percent decline in child care employment.30 But when the economy rebounds, the child care sector lags: every 1 percent increase in a state’s overall employment is only associated with a 0.75 percent increase in child care employment.31 This lag can be a drag on reemployment, as we are seeing today: Parents who seek to return to work after a period of unemployment must be able to secure child care, which will be out of reach without greater public investment.
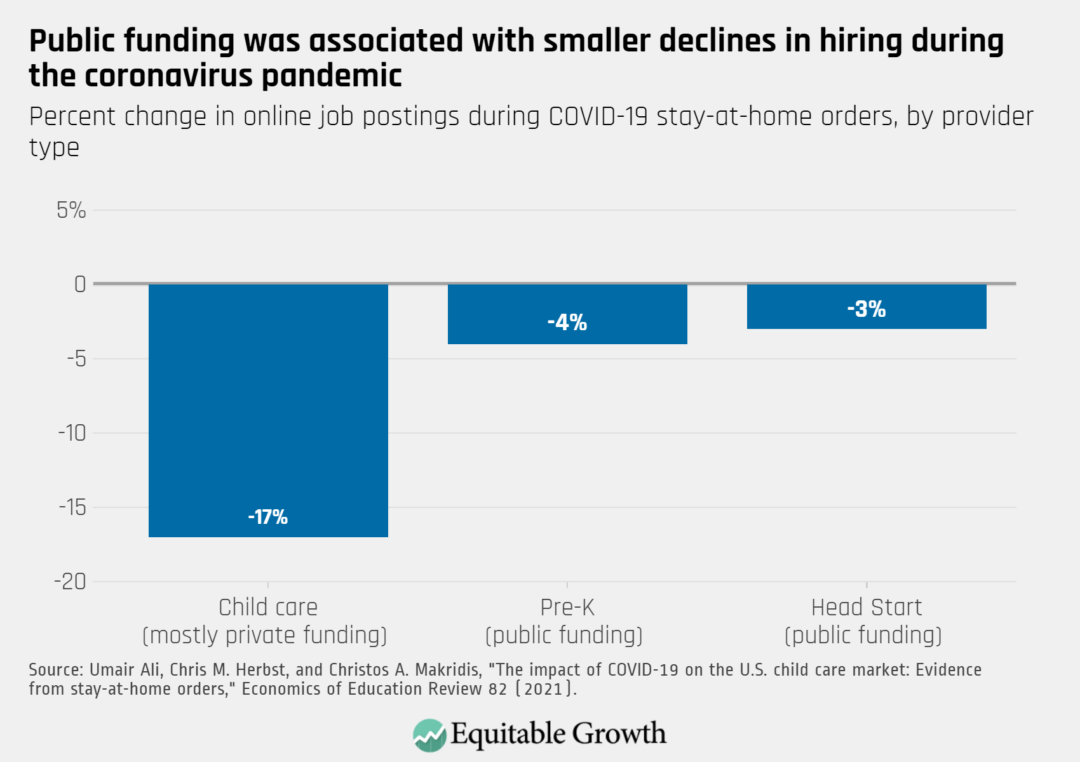
In fact, even during the coronavirus recession, child care and early education programs that had access to public investment—such as pre-K and Head Start providers and child care programs engaged with the subsidy system—were better able to weather the financial crisis of the pandemic. (See Figure 5.)
Figure 5
These providers were able to maintain enrollment, staffing, and hiring at higher rates than those providers relying solely or primarily on private dollars.32 Additional public investment in this area—especially programs that lower families’ costs while also subsidizing and expanding access to providers—will not just help this key part of our social infrastructure remain intact during downturns, but also will help fuel an equitable recovery and a competitive economy in the future.
Indeed, while the United States once held a competitive edge in the global economy due to growth in women’s labor force participation over the past century, that growth has since stagnated, and the labor force participation rate in the United States now falls below the average for OECD nations.33 During the first year of the coronavirus pandemic, when families struggled without adequate access to paid leave and child care, women’s labor force participation fell— hitting a low we haven’t seen since 1988.34
There is another, longer-run trend that also merits our attention: The birth rate in the United States has been falling for 6 years, and hit a record low in 2020.35 Our birth rate is barely outpacing that of China, and the birth rates of other nations, such as Israel, India, and France, position them to better maintain their labor forces, creating a new competitive disadvantage for the United States.36 Having a smaller family is a rational response to broken care infrastructure, and while methodological challenges make it difficult to determine the precise effect that programs such as child care have on total fertility rates, evidence from Europe suggests that investing in the care economy meaningfully increases fertility, thus helping countries to maintain their labor forces and keep their economies growing.37
Biases lead to underinvestment in care and market failure
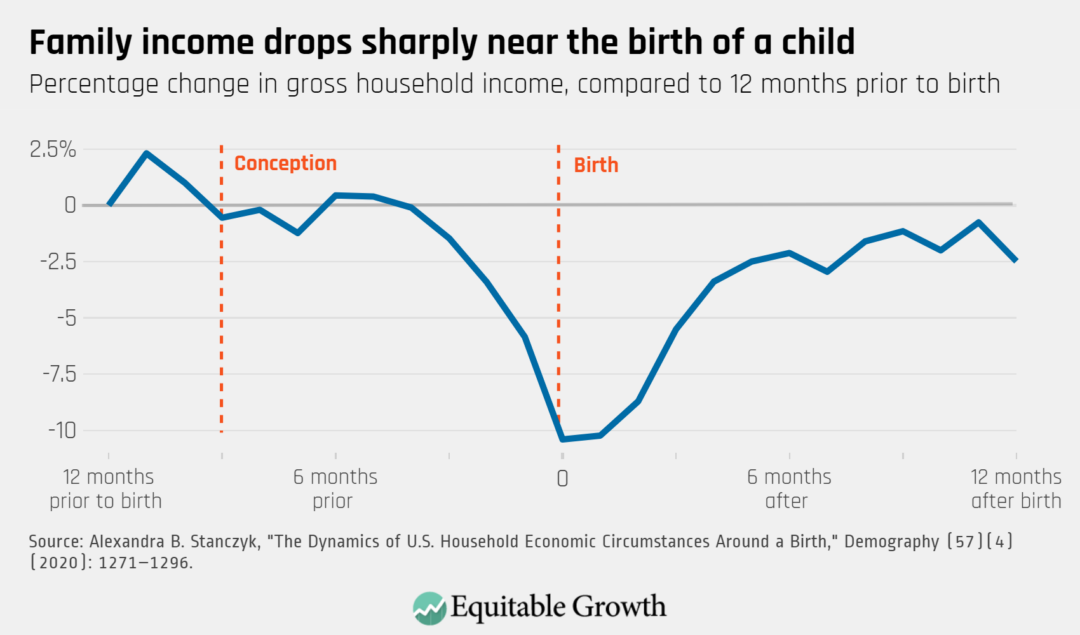
The economic case is clear: Underinvesting in care harms families and prevents our economy from reaching its full potential. But our decision-makers largely see the provision of care as a private responsibility rather than recognizing it as a public good. When a new child is born, parents are asked to take unpaid leave or pay high child care costs when they can least afford it. Research shows that across the socioeconomic spectrum, the birth of a child is accompanied by drastic decreases in family income as parents reduce their labor force participation to care for a child at the same time as families face new expenses such as diapers and formula.38 (See Figure 6.)
Figure 6
When we leave these caregiving costs to be shouldered by parents facing new financial constraints, they may exit the labor market entirely rather than place their child in a high-quality, but expensive, care setting. This creates a drag on growth for the economy today, when employers don’t have enough workers to meet demand and households have to tighten their belts in response to lost income.
Additionally, when a lack of paid leave forces parents to return to work early in order to make the rent, children miss out on care from their parents that fosters their development and human capital, reducing the productivity and potential of tomorrow’s workforce. Care infrastructure that supports parental bonding and child development in the child’s first year of life and accessible, high-quality child care that removes barriers to work for parents would mitigate these drags on our economy’s growth, as well as improving family well-being.
Analogs can be drawn to care for one’s own serious medical condition and care for older adults and people with disabilities, whose families are often financially constrained and facing new expenses at the same time as they are looking at high price tags for medical care and home- and community-based services and supports. Workers with temporary disabilities pay about one-fifth of their medical costs out of pocket, and older adults and people with disabilities who need home- and community-based services and supports pay $50,000 a year on average.39 These costs are out of reach for people who are approaching the age of retirement, one-third of whom have no retirement savings at all and almost all of whom are looking at a significant drop in household income as their earning years sunset.40
Why have decision-makers allowed these market failures that straitjacket our economy to occur? The answer is simple: They have been blinded by their biases. This includes biases toward economic inputs that are easily quantifiable, as opposed to care work, which is often “invisible” in the market because no money is changing hands. Just one case in point: Unpaid work is not counted in Gross Domestic Product calculations, despite the important services being provided.
As feminist economist Marilyn Waring noted, “Every time I see a mother with an infant, I know I am seeing a woman at work … but, again, I seem to be at odds with economics as a discipline.”41 Indeed, excluding this work from official national income and product accounts makes it more difficult for policymakers to clearly understand the trade-offs between the societal and broad economic benefits of caregiving and the costs associated with adequately supporting care needs.
These biases against women, and women of color in particular, have led decision-makers to undervalue the care work that they perform. Both paid and unpaid care work—from child care to provision of supports for adults with disabilities to domestic labor—have been disproportionately performed by women, and by women of color in particular.
A 2020 report by the AARP estimates that more than 60 percent of unpaid caregivers are women.42 Women tend to spend more time engaged in unpaid care work than men, and this is especially true for women of color.43 For instance, Latina women perform almost twice the amount of hourly unpaid care work per week as White men. Unpaid caregiving responsibilities pose a particular strain on Black mothers, two-thirds of whom are the equal, primary, or sole earners in their household.44
When it comes to paid care work, the overwhelming majority of domestic workers are women. More than half of domestic workers are Black, Latina, or Asian American/Pacific Islander women, with some studies finding that more than 90 percent of domestic workers are women of color.45
The overrepresentation of women of color in care work is rooted deeply in our history and the way people in the United States have thought about the home, the market, the state, and personhood over time. For example, in the mid-19th century, Black women’s enslavement and exclusion from White society’s definition of womanhood and personhood created a cultural context in which it was easy to push Black women into precarious and dangerous work.46 Then, when Black women were concentrated in precarious occupations, the quality of these jobs further decreased. Black women were excluded from early minimum wage laws through the Fair Labor Standards Act’s exclusion of agriculture and domestic work—industries in which Black women were overrepresented.
This interplay between decreasing job quality and occupational segregation is an ongoing vicious cycle that perpetuates the long afterlife of slavery. Today, occupational integration remains stalled, and Black women remain overrepresented among those engaged in precarious work, including care work. One in three nursing assistants, for example, is a Black woman.47
These historic racial biases reverberate forward to affect the view of caregiving work itself today. To be blunt, when decision-makers see Black women performing work, they decide that the labor itself must not be valuable. Indeed, regardless of their race or gender or education level, any worker who does a job that involves the provision of care receives wages that are 5 percent to 6 percent less than those paid for similar work that does not involve the provision of care. This phenomenon is called the care penalty.48
One place where the care penalty is obvious is in the way we compensate child care providers. Researchers at the University of California, Berkeley find that the median wage for a preschool teacher is $15 per hour.49 Child care workers make even less, with median wages of $12 per hour. This undercompensation story is similar for home care workers. In 2018, the most recent year for which we have data, home care workers earned $11.52 per hour, which translates to $16,200 per year after accounting for inconsistent scheduling.50
In addition to not paying child care workers sufficiently, we do not invest enough in child care overall. When you look at the share of expenditures that each member nation of the Organisation for Economic Co-operation and Development spends on children and families when children are very young, the United States ranks 37 out of 38.51
It is likely that this undervaluation of care in the paid labor force reinforces our attitudes about the value of unpaid care work. Though norms are shifting, and both men and women provide important care to their loved ones—today 2 in 5 unpaid family caregivers are men—we have repeatedly chosen not to invest in a federal paid leave program despite the benefits it would bring to the economy and its widespread popularity.52
We can shift our orientation to care and strengthen our economy
Today is an exciting day to be speaking with all of you because we are on the cusp of change. After decades of choosing not to invest in paid leave at the federal level, a bill that includes a national paid leave program has passed the House of Representatives and is under consideration in the Senate.
And this isn’t just about passing a paid leave program. It’s about taking our blinders off and accurately valuing care, so that our economy can reach its full growth potential. This bill also:
Recognizes that caring for children is real and valuable work through the extension of a monthly, fully refundable Child Tax Credit with no requirement that parents work in the paid labor market
Provides an infusion of resources into our child care system that begins to correct the undervaluation of this work by requiring parity of pay between child care workers and school teachers
These changes would represent a sea change and move us toward a nation and an economy that accurately value care work, corrects market failures, and allows the economy to grow unfettered.53 (See Figure 7.)
Figure 7
Of course, being on the cusp of real change doesn’t mean that we’ve made it. If we want economic growth, now is the time to invest in the care economy smartly, strategically, and without cutting corners. That means that a federal paid family and medical leave program should be comprehensive—covering leave to bond with a new child, care for a loved one with a serious medical condition, or address one’s own serious medical need. It should have a progressive wage replacement structure, so that low-income people aren’t priced out of participation. And it should recognize the full range of loving relationships through which care is provided.
We need a child care program in which no family is asked to pay more than is manageable to ensure that their child is safe and nurtured during the work day, that ensures that early care educators can focus on the children they care for without being distracted by their own financial hardship, and that the system has the resources it needs to ensure that children are receiving high-quality care. While temporary programs will substantially help families and the economy, and provide proof of concept for those skeptical of the government’s ability to deliver these benefits, the need for paid leave and child care will not disappear in 3, 5, or 10 years, so it is my hope that Congress will eventually make these programs permanent.
When the supports we deliver to families to ensure that care is adequate meet these benchmarks, when we have built a policy environment that values care for all people who need it—whether it’s people with disabilities who need professional supports to fully engage in their communities; young children who should be able to grow up in households that are economically secure, so that their parents can meet the family’s basic needs and focus on parenting; or older adults who have spent their lives providing care for others and now need support themselves—when this happens we will know that we have sufficiently shifted our orientation to care to correct our market failure and allow our economy to grow. If we miss the opportunity that is before us today, our loved ones will struggle to access the care they need and our economy will remain constrained.
Conclusion
As a mother of two young children and the daughter of a mother experiencing a health crisis, I can tell you that families are desperately in need of support when it comes to the provision of care. This is about creating vibrant and loving environments for children, for older adults, and for people who live with disabilities, and ensuring their safety and health. And as a tenured professor of economics, I can tell you that our country is desperately in need of an economic system that correctly values care. This is about increasing labor force participation, developing human capital, and increasing productivity. It is about building a more vibrant economy.
Our biases against women and people of color, and our bias toward easily measured economic quantities, have led us to underinvest in a bedrock component of our economy: care. Now is the time to take off our blinders and make the investments that will allow our economy to grow to its full potential.
Every month the U.S. Bureau of Labor Statistics releases data on hiring, firing, and other labor market flows from the Job Openings and Labor Turnover Survey, better known as JOLTS. Today, the BLS released the latest data for October 2021. This report doesn’t get as much attention as the monthly Employment Situation Report, but it contains useful information about the state of the U.S. labor market. Below are a few key graphs using data from the report.
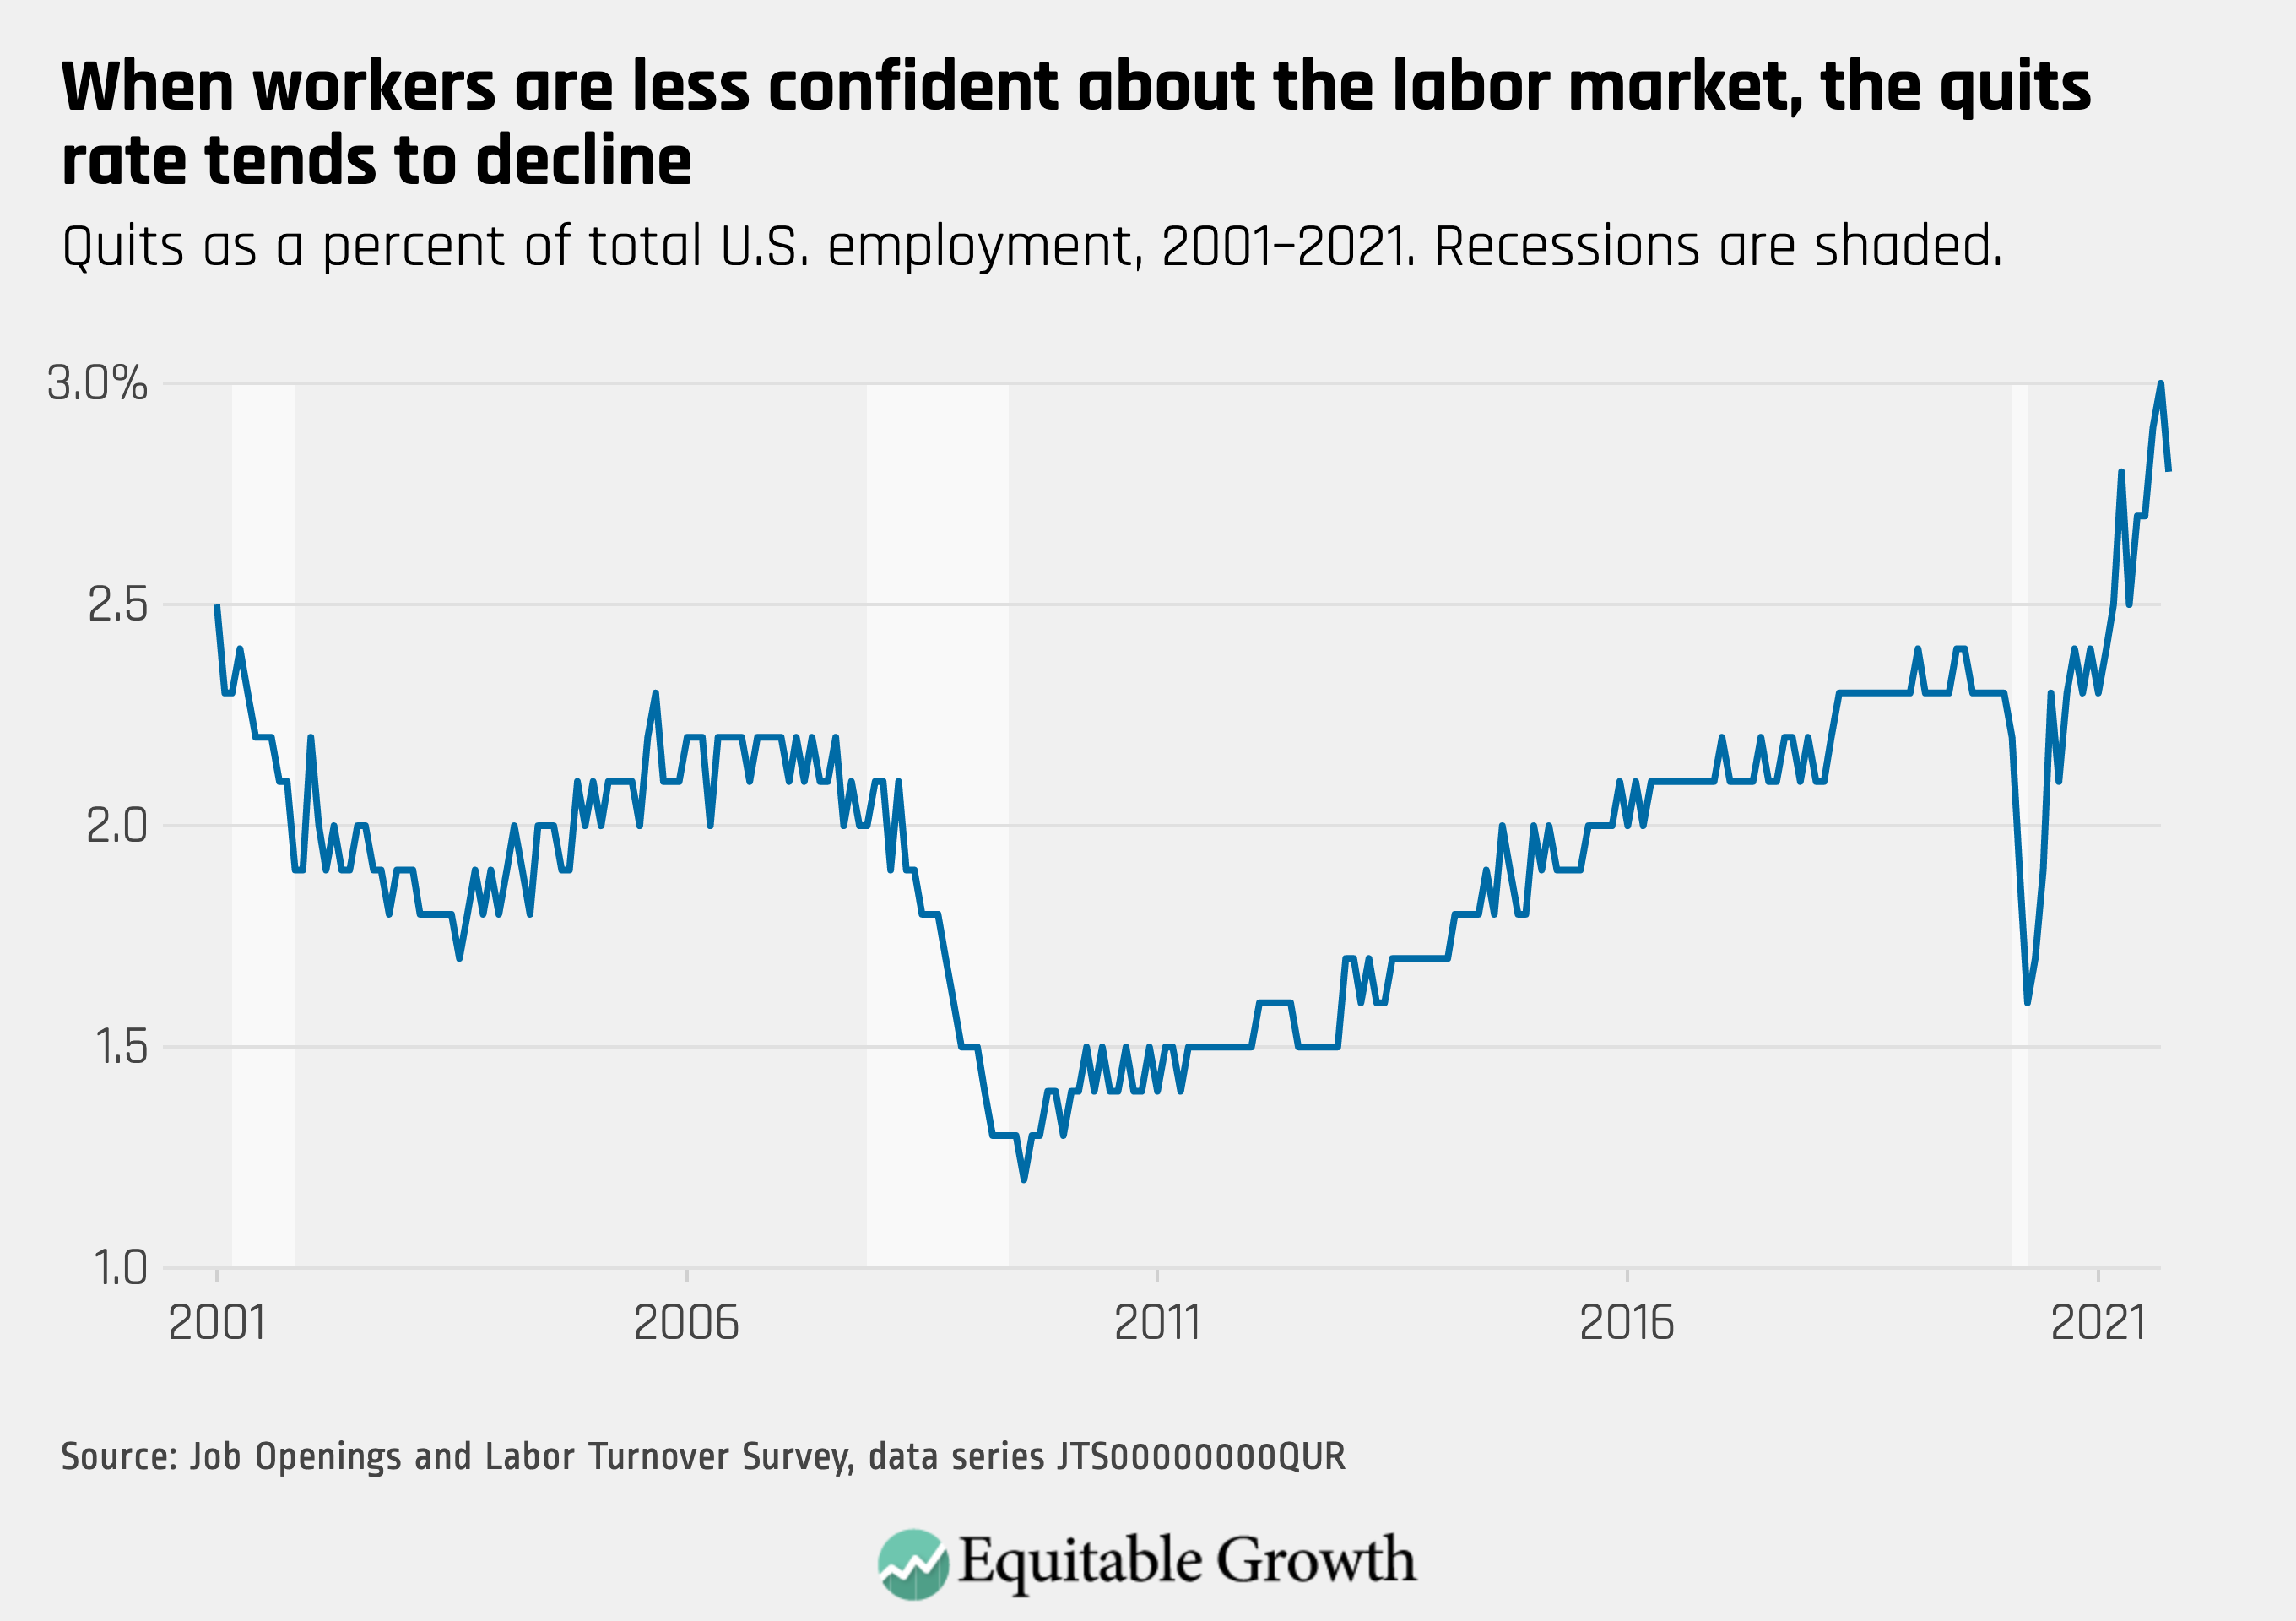
The quits rate declined to 2.8 percent as 4.2 million workers quit their jobs in October, down 205,000 from the previous month, but remains well above typical levels.
The vacancy yield fell further as job openings (11 million) rose and hires (6.5 million) stayed relatively constant in October.
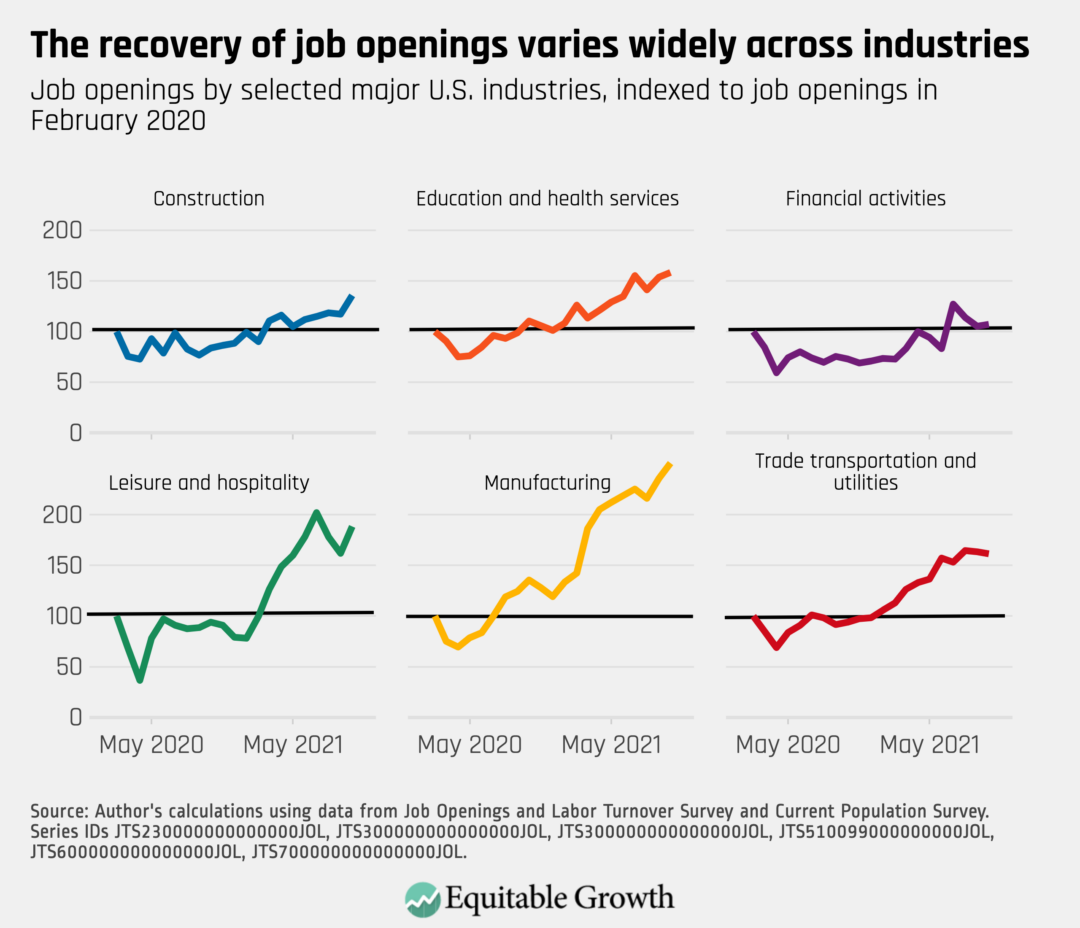
Job openings rose by 431,000 in October, with growth in several industries such as construction, manufacturing, and leisure and hospitality.
The ratio of unemployed-worker-per-job-opening remains extremely low, falling from 0.72 in September to 0.67 in October. At the same time, 255,000 workers left the labor force in October.
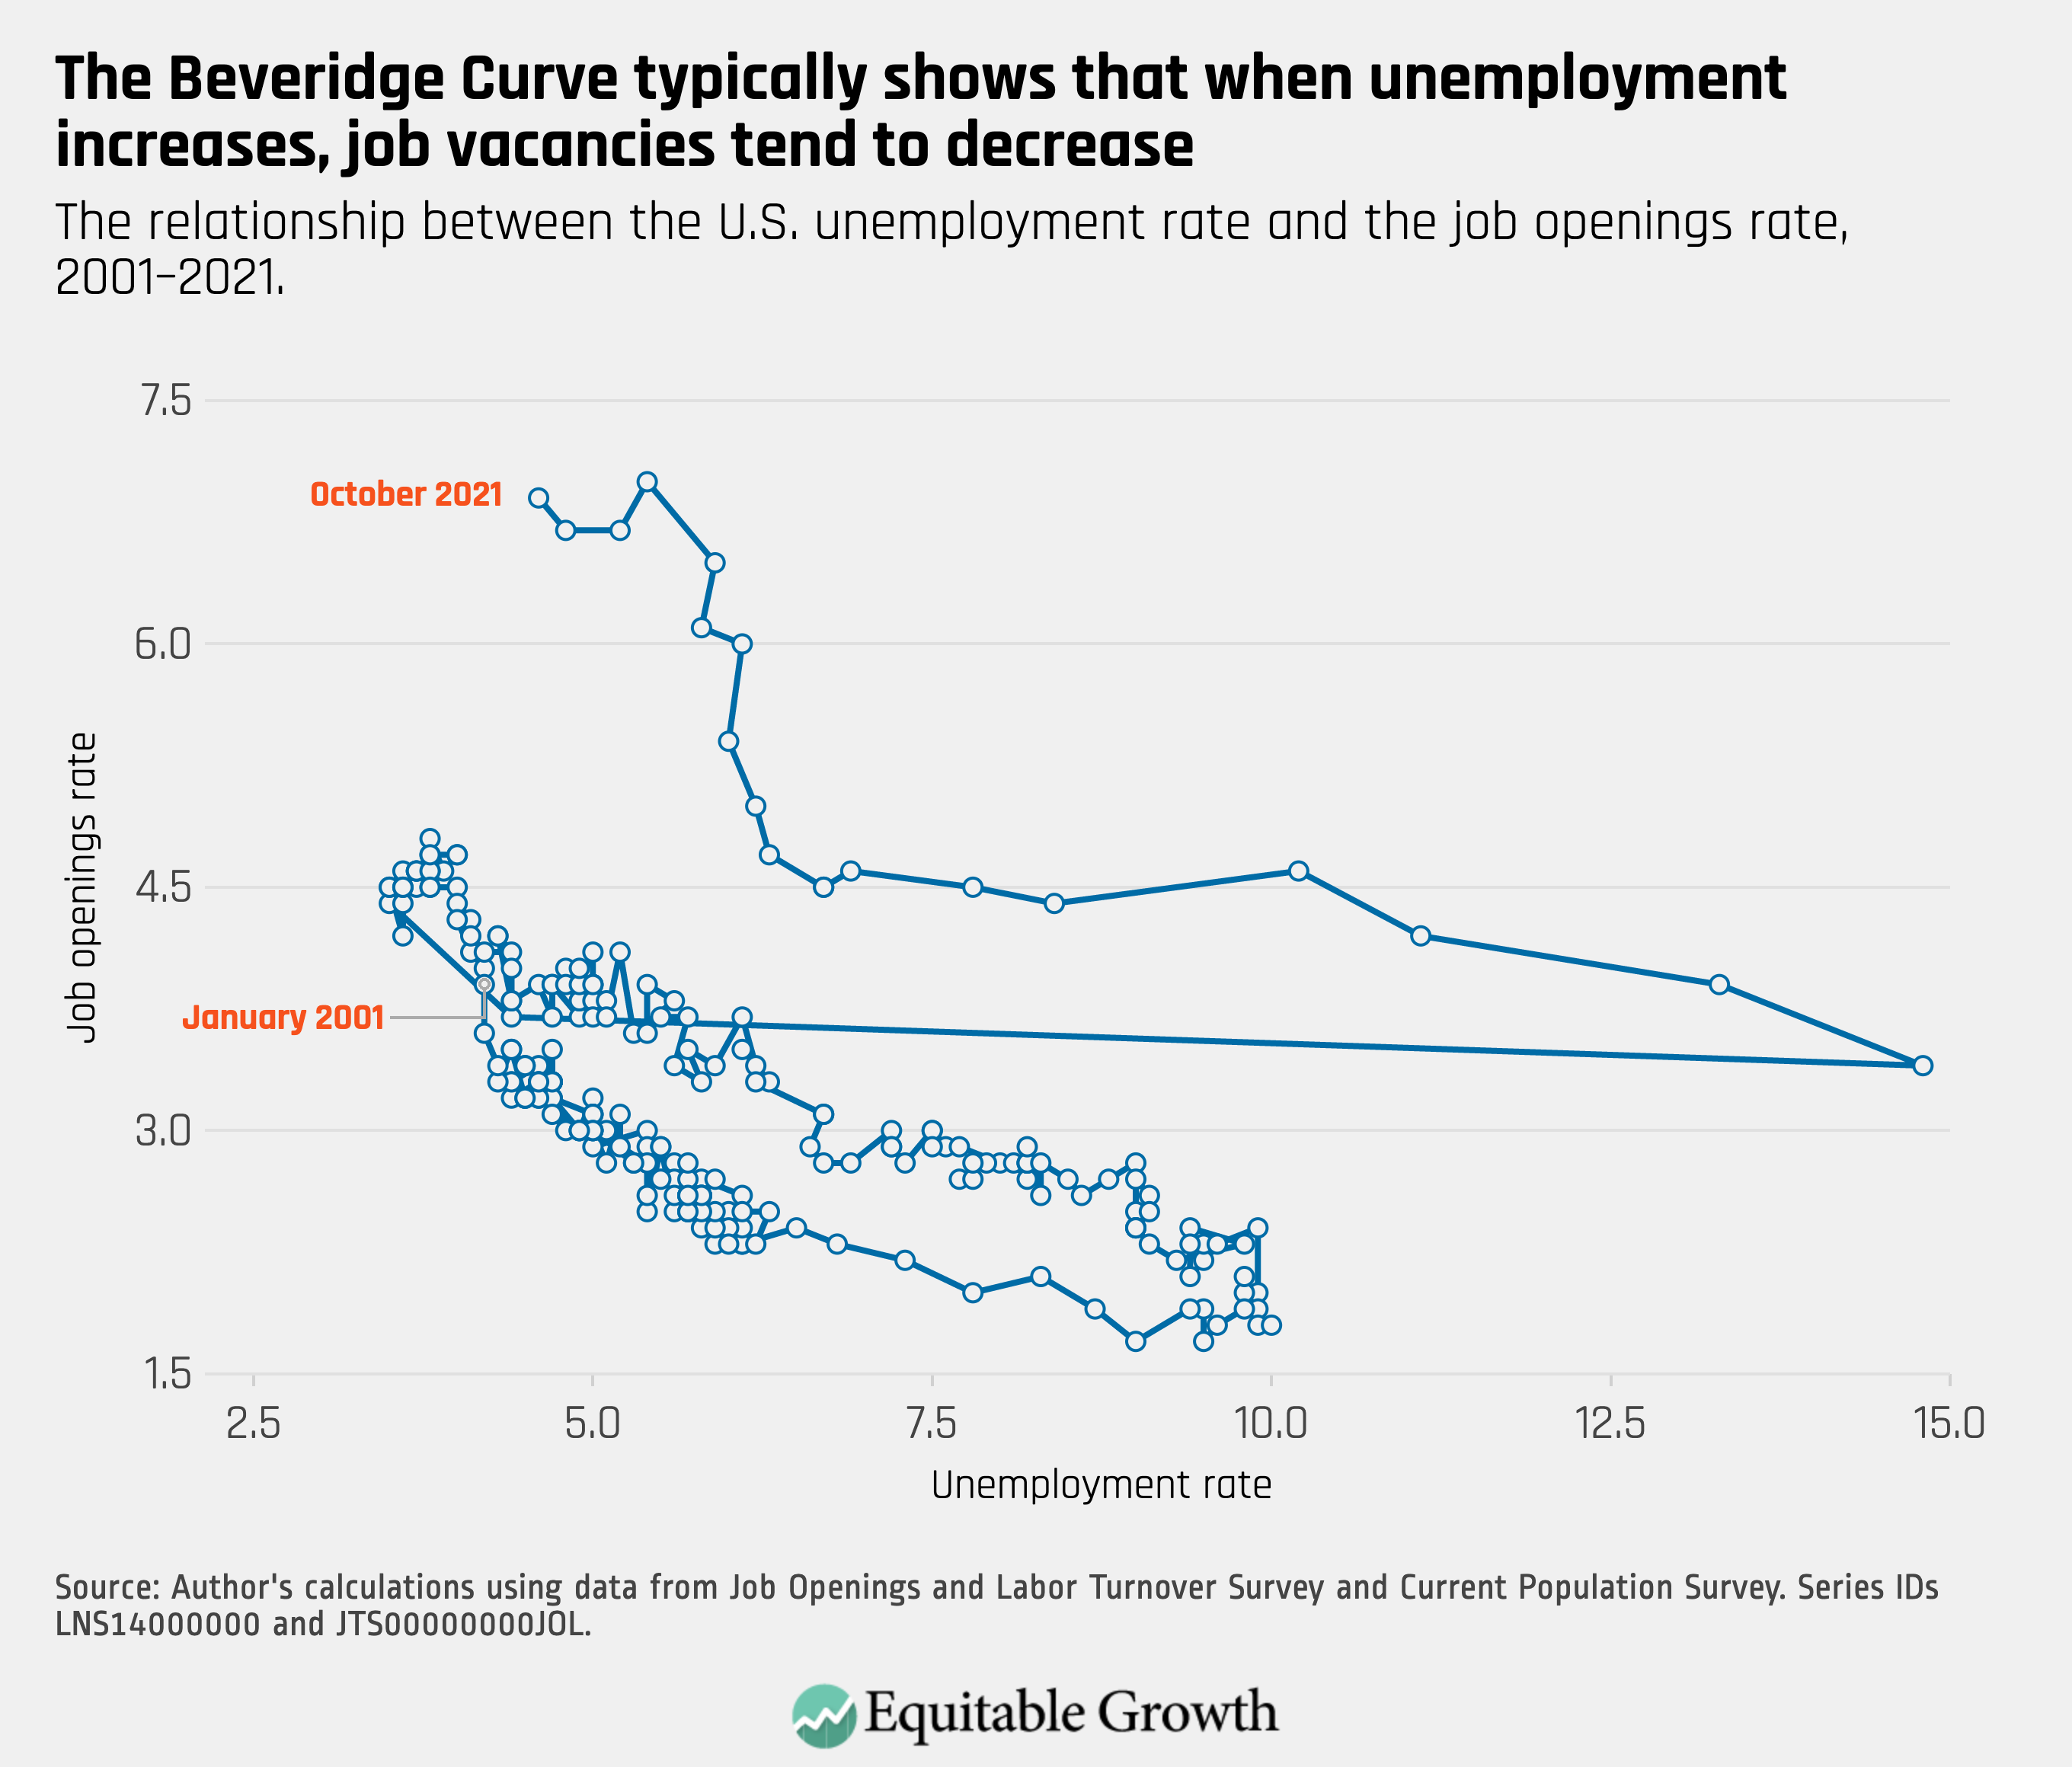
With the unemployment rate declining to 4.6 percent and the job openings rate increasing to 6.9 percent, the Beveridge Curve continues to move in atypical territory, reflecting the unique nature of the present job market.
As the U.S. Congress finalizes its negotiations around the Build Back Better Act, policymakers at the federal, state, and local levels of government continue working to rebuild their respective economies in the wake of the coronavirus recession. Against this backdrop, the NewDEAL Leaders, a network of pro-growth elected progressives from state and local jurisdictions, met for their annual conference in Washington, DC, to discuss policy solutions on a range of issues, from student debt to housing to mental healthcare and more.
Equitable Growth’s Sam Abbott joined Vermont’s Lt. Gov. Molly Gray at the conference for a conversation moderated by Zero to Three’s Amanda Szekely on child care and early education in the post-pandemic economy. During this panel, Abbott discussed the major economic ramifications of the current child care system in the United States, as outlined in Equitable Growth’s recent report “The Child Care Economy.”
Below, we share some of the highlights from the session, which took place on November 18.
Supporting children in safe, nurturing environments during early childhood is vital for healthy development
Kicking off the panel, Szekely discussed why high-quality early care and education is so important for healthy child development. During the first several years of early childhood, the brain is developing more rapidly than at any other time in life. This neurological development—the creation and fine-tuning of the networks and connections in the brain—plays a large role in a child’s cognitive development and their risk of developing future mental health disorders.
High-quality early care and education provide socialization and learning opportunities that are critically important in the early childhood years. When children are cared for in a supportive, nurturing environment—either by family members or professionals—there are physical changes in their brain development associated with positive long-term outcomes. High-quality caregiving can even mitigate harmful developmental outcomes associated with poverty and high-stress environments, suggesting an important role for early care and education in addressing inequality and promoting intergenerational economic mobility.
Public investment in child care can grow the economy and stabilize the child care market
Abbott reinforced the link between high-quality care for children during this important developmental period and sustainable, broad-based economic growth. In the short term, policies that make child care more accessible and affordable to families can help break down barriers to employment for parents who wish to work—leading to a larger and more diverse labor pool, higher household incomes, greater consumer spending, and a bigger tax base to fund pro-growth government programs.
In the long term, children who participate in high-quality early education report better school readiness and employment outcomes, higher incomes as adults, and reduced contact with the criminal and juvenile justice systems. All of these beneficial outcomes contribute to future U.S. economic growth.
Additionally, an infusion of public support has the potential to stabilize the child care market so that it is always available for families when they need it. Research on previous economic recessions highlights the fragility of the child care market in moments of economic downturns. Even small changes in enrollment, due to parents no longer needing or being able to afford care, can cause a damaging ripple through the child care industry, leading to layoffs and center closures.
This harmful dynamic creates new child care challenges for parents when they try to return to work. Sufficient and sustained public investment in child care can help avoid these supply-side challenges and ensure that child care can continue to act as a vital work support for families, regardless of changes in the overall economy.
Child care reform will support the well-being and economic security of families and workers alike
Lt. Gov. Gray shared some takeaways from her Recover Stronger tour—a series of meetings with residents, experts, and business leaders across Vermont about their priorities in the aftermath of the coronavirus recession—including child care reforms, which would benefit families and workers alike.
For parents across the country, child care is often too expensive and too hard to find. Lt. Gov. Gray shared data showing that, on average, child care costs families in Vermont more than $20,000 a year. Yet despite the high prices many families pay, the child care workforce still earns near-poverty wages, with national median pay in 2020 at just $12.24 per hour, or $25,460 per year.
Vermont recently passed child care legislation that could help on both fronts, The state caps child care payments at 10 percent of a family’s income or less, based on the family’s relation to the federal poverty line. And it provides scholarships and loan forgiveness to child care workers to help caregivers enter and remain in their chosen field.
At the national level, the Build Back Better Act is poised to deliver similar relief. The legislation, if enacted into law, would cap child care payments for most families at an even more affordable 7 percent maximum of household income and would provide more resources and incentives to raise child care worker pay and recruit new care providers in the process.
The mayors, county councilmembers, and state congressmembers who attended the NewDEAL conference last month are all tasked with both distributing funds from the American Rescue Plan, which was enacted earlier this year, and implementing the historic child care reforms contained in the Build Back Better Act, should it pass.
The implications for children’s development, the economy, and the well-being of workers and families are significant, and Equitable Growth is committed to providing policymakers with the best available evidence to support these efforts. That’s why, in 2022, Equitable Growth is interested in funding academic research projects that can inform this critical policy conversation. Child care researchers interested in applying for funding support or learning more about Equitable Growth’s other funding priorities are encouraged to review the 2022 Request for Proposals for more information.
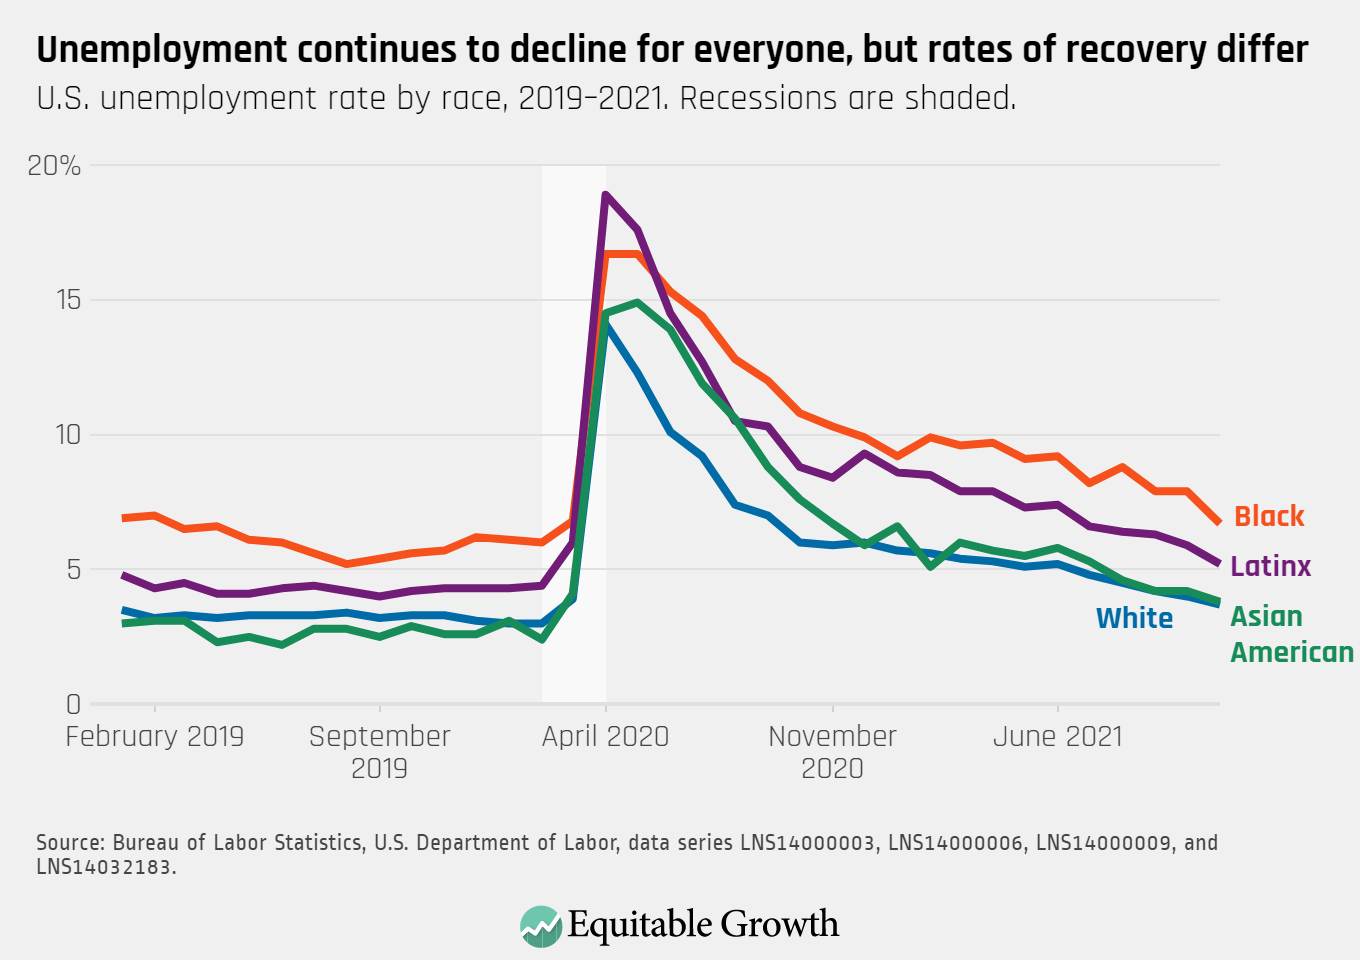
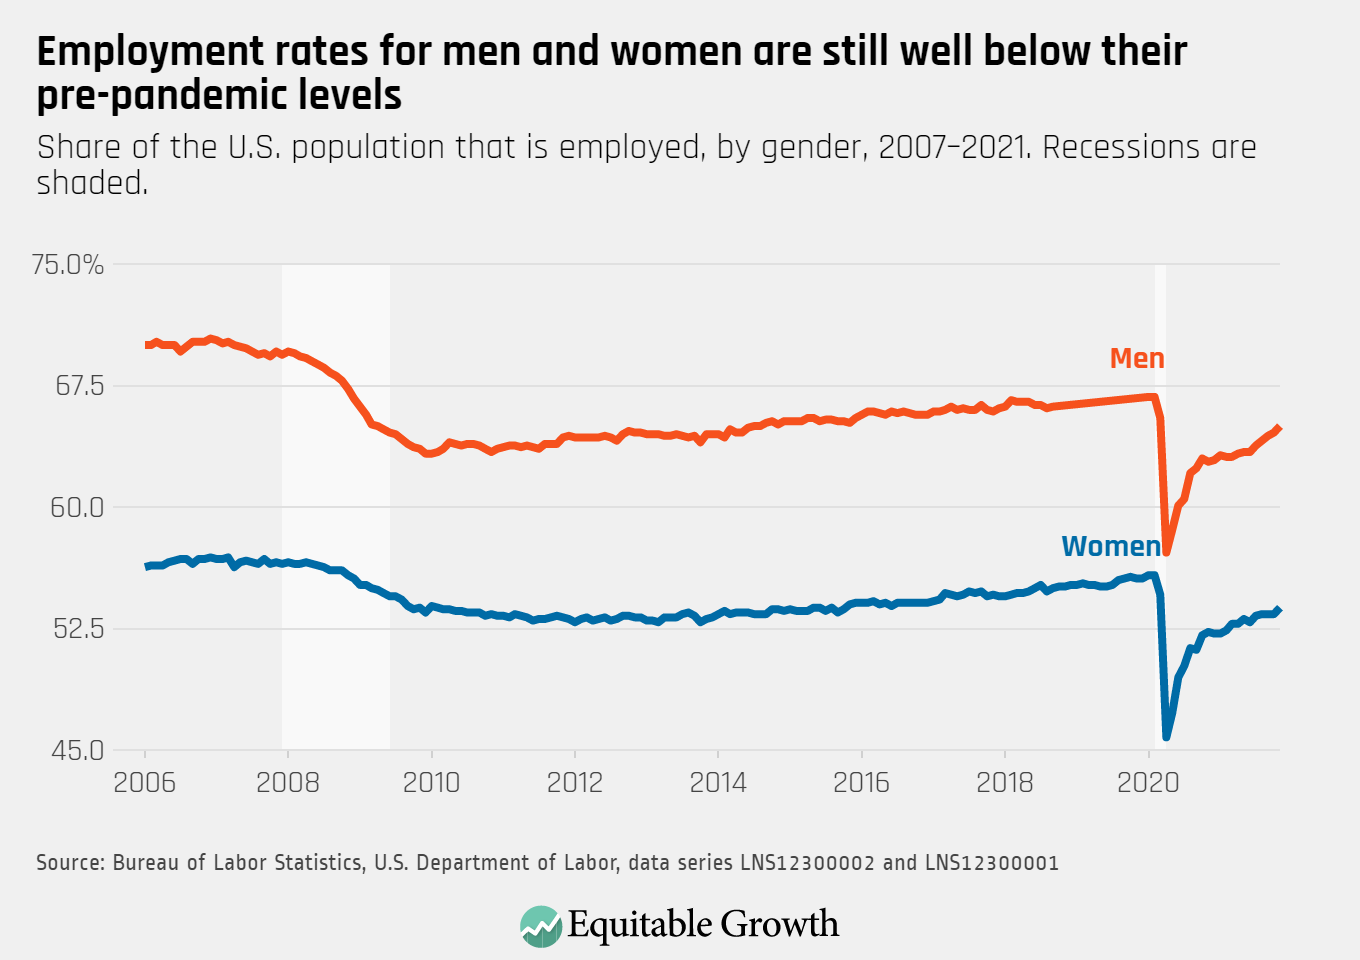
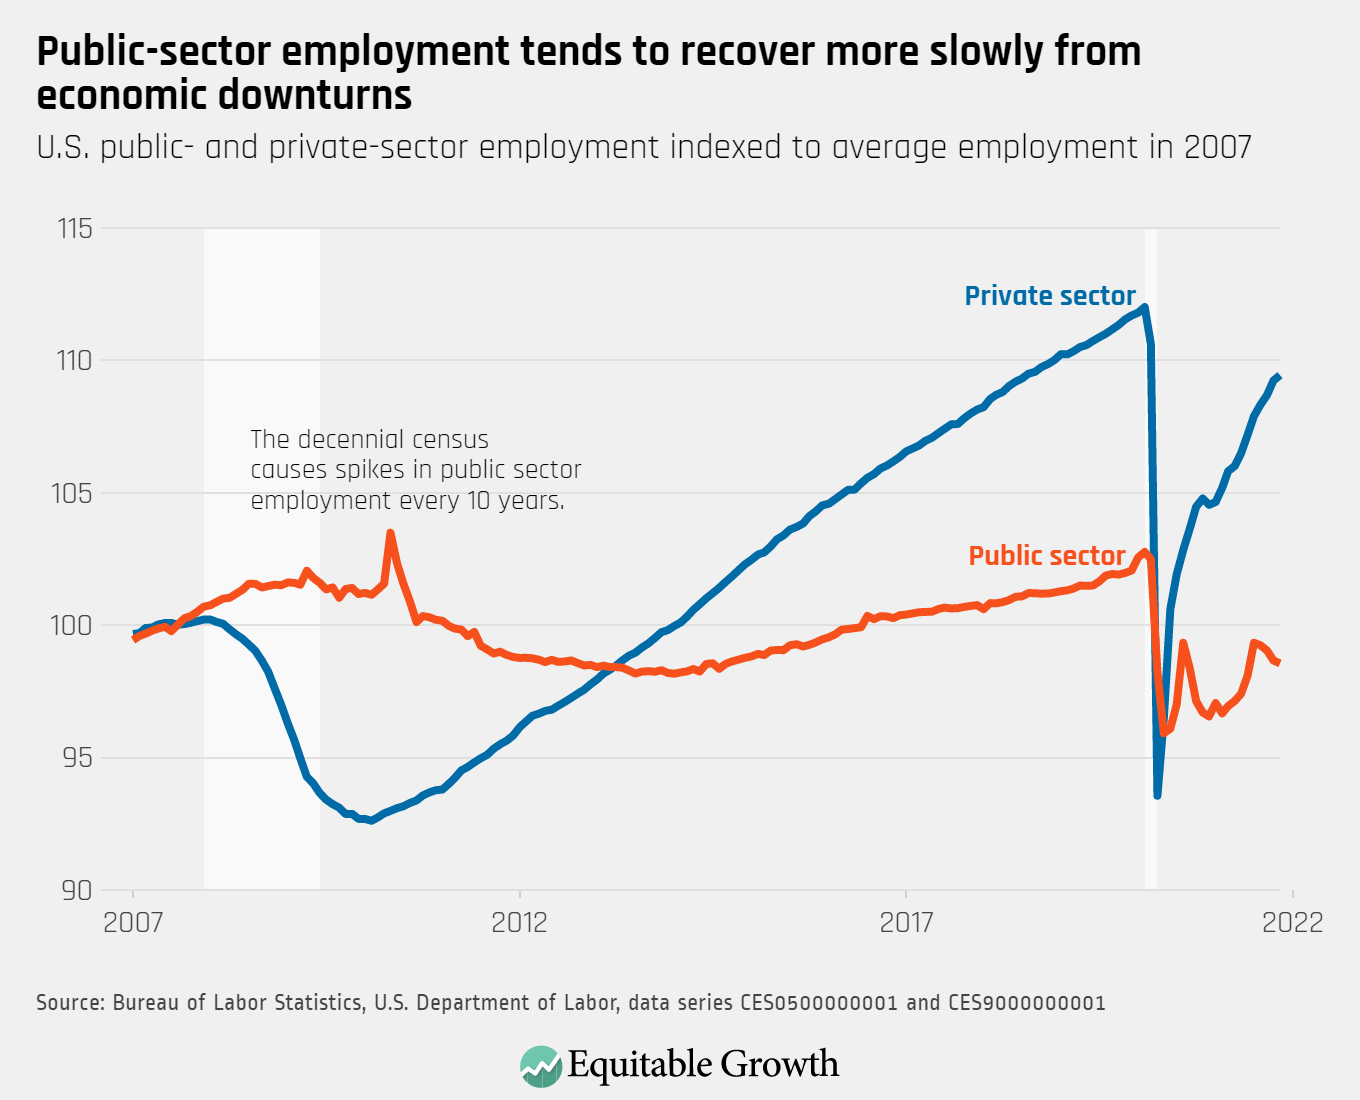
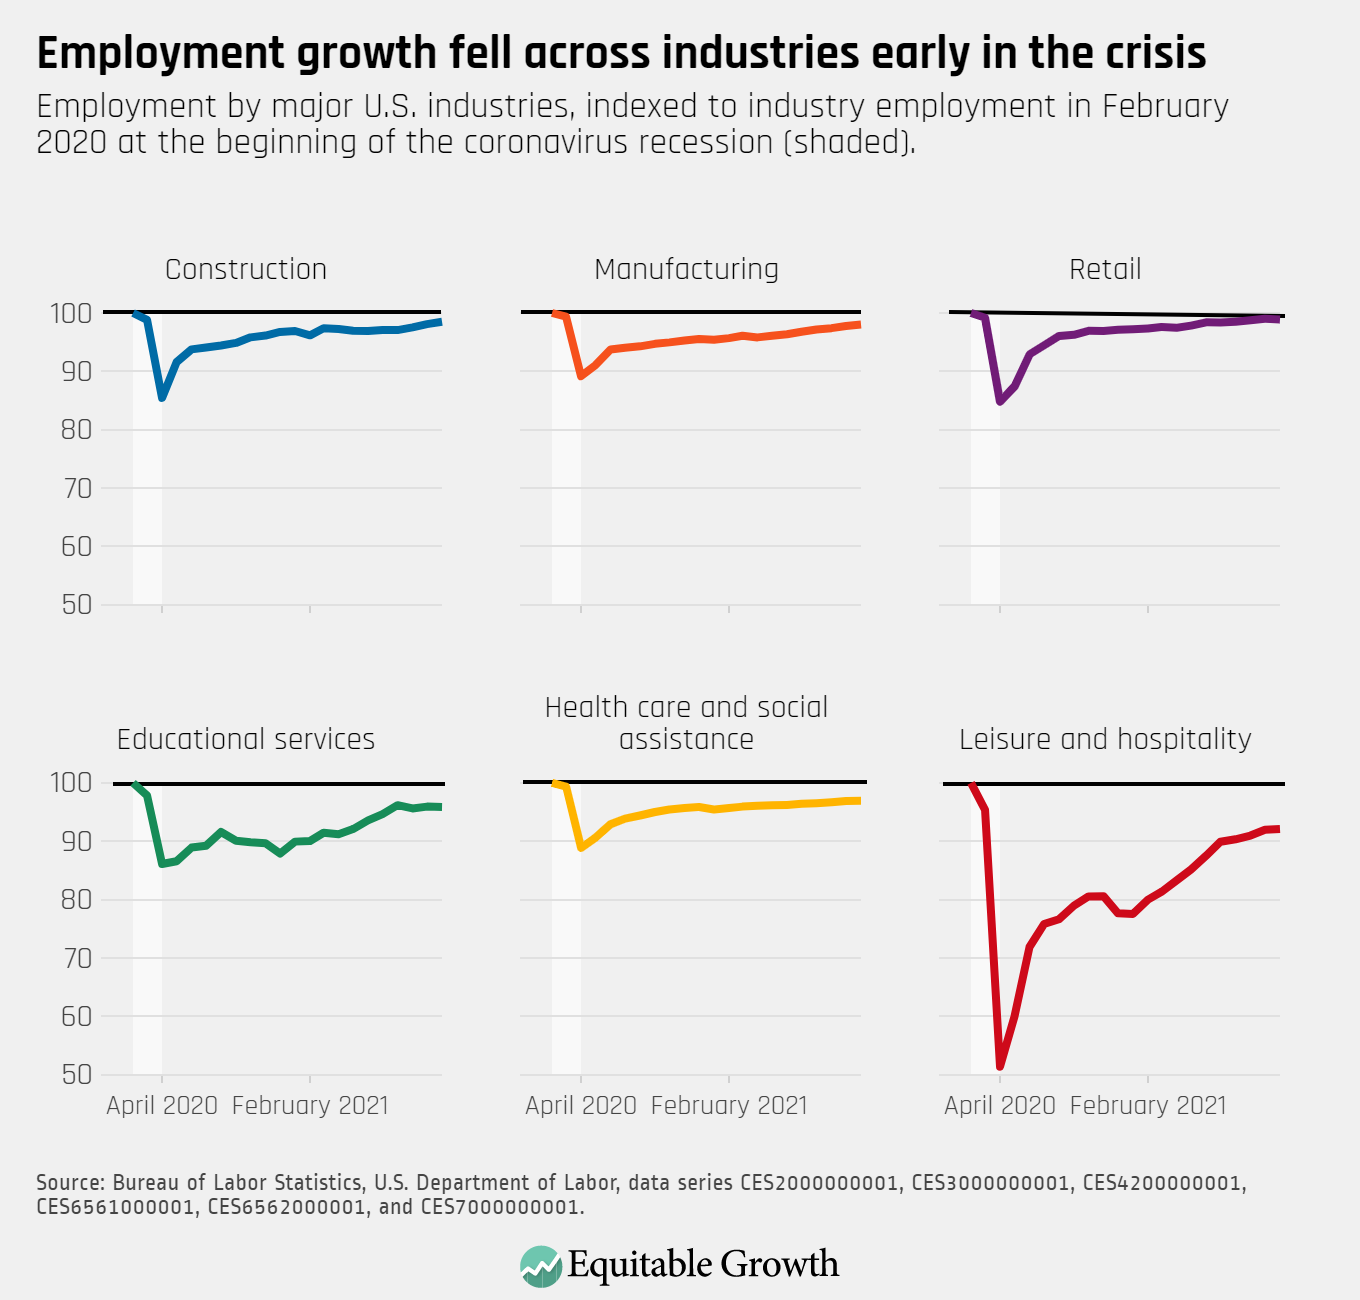
1. This monthly feature remains the best single place to go to get an immediate, timely handle on what each month’s U.S. Bureau of Labor Statistics report brings us in the way of news about the state of the U.S. labor market and the U.S. economy. The November, 2021 report, released last week, is especially puzzling. The household survey unemployment rate is down to 4.2 percent. Disappointing payroll employment growth is barely more than 200,000. Private sector employment is up. Public sector employment is down. There should not be this much divergence between a payroll survey that is close to comprehensive and a household survey that is a very good near random sample by all the standards of survey research. And yet there are these differences. They arise because even though the payroll survey is near comprehensive, it has powerful and changing biases in its failure of full comprehension. I think we badly need to spend more money figuring out exactly how these biases are evolving. Read Kathryn Zickuhr and Carmen Sanchez Cumming, “Equitable Growth’s Jobs Day Graphs: November 2021 Report Edition,” in which they write: “On December 3, the U.S. Bureau of Labor Statistics released new data on the U.S. labor market during the month of November. Below are five graphs compiled by Equitable Growth staff highlighting important trends in the data. Total nonfarm employment increased by 210,000 in November, and the employment rate for prime-age workers rose to 78.8 percent. The unemployment rate declined to 4.2 percent in November, remaining higher for Black workers (6.7 percent) and Latinx workers (5.2 percent) compared to Asian American workers (3.8 percent) and White workers (3.7 percent). The overall employment rate rose to 65.0 percent for men and 53.8 percent for women, still below pre-pandemic levels for both groups. Private-sector employment continued to make gains in November, but public-sector employment gains have faltered. Despite recent gains, the jobs recovery remains fragile. Employment in many industries has increased more slowly than in recent months, and remains below pre-pandemic levels.”
2. Many employers have decided on—and made stick—the principle that they simply do not bargain. They post a wage for the job, and then even if they get a very good match for the position, they would rather let a good worker well-matched walk than bargain over the wage with somebody who has already taken the job. This economizes on administrative effort, yes. But it has always seemed to me that it is more a matter of social power than of economic logic. One bargains with equals or neither equals. One commands those who are subordinated. Read Marta Lachowska, Alexandre Mas, Raffaele Saggio, and Stephen Woodbury, “Wage Posting or Wage Bargaining? A Tests Using Dual Jobholders,” in which they write: “This paper examines the behavior of dual jobholders to test a simple model of wage bargaining and wage posting. We estimate the sensitivity of wages and separation rates to wage shocks in a worker’s secondary job to assess the degree of bargaining versus wage posting in the labor market. We interpret the evidence within a model where workers facing hours constraints in their primary job may take a second, flexible-hours job for additional income. When a secondary job offers a sufficiently high wage, a worker either bargains with the primary employer for a wage increase or separates. The model provides a number of predictions that we test using matched employer-employee administrative data from Washington State. In the aggregate, wage bargaining appears to be a limited determinant of wage setting. The estimated wage response to improved outside options, which we interpret as bargaining, is precisely estimated, but qualitatively small. Wage posting appears to be more important than bargaining for wage determination overall, and especially in lower parts of the wage distribution.”
3. This is, I think, one of the greatest recent Equitable Growth initiatives. Take a look at “A Visual Economy. “
Worthy reads not from Equitable Growth:
1. Paul Krugman continues to remain the paragon for not just useful and applicable macroeconomic theory, not just for opening-up new literatures for research, not just for teaching students who will be future professional economists, but also for explaining what’s going on in the economy to the broad public sphere. Read his “Wonking Out: Is the Great Resignation a Great Rethink?,” in which he writes: “Unlike the “skills gap” invoked to explain persistent unemployment after the 2008 crisis, this time labor shortages seem to be real. Workers are quitting at record rates, an indication that they feel confident about finding new jobs. … So workers are clearly feeling empowered, even though many fewer Americans are employed than in the past. Why? Earlier this year many people insisted that enhanced unemployment benefits were reducing the incentive to accept jobs. But those extra benefits were eliminated. … Another story … says that the extensive aid families received during the pandemic left many … [with] the financial space to be choosier about their next job. A less upbeat story says that some employees are still afraid to go back to work, and/or that many can’t go back to work because their child care arrangements are still disrupted. But there’s at least one more possibility … the experience of the pandemic may have led many workers to explore opportunities they wouldn’t have looked at previously. … People have a strong status quo bias. … I can easily believe that there were many workers who should have quit their lousy jobs in, say, 2019, but didn’t because they weren’t really considering the alternatives. And it’s at least possible that the disruptions of the pandemic led to a great rethink …. [That] is actually a good thing—a small silver lining.”
2. This is, I think, correct. The strong balance of the evidence is still on the side of “team transitory” as far as the very moderate inflation of 2021 is concerned. If we still see moderate inflation in late 2022, come back and talk to me then about the appropriate Federal Reserve response. Read Michael Hiltzik, “There’s a right way and a wrong way to think about inflation. Here’s the right way,” in which he writes: “ There are no signs that the inflation surge showing up in the latest statistics is caused by sustained overheating of the U.S. economy. The signs point to several short-term factors coming together all at once.”
According to the most recent Employment Situation Summary by the U.S. Bureau of Labor Statistics, the U.S. economy added 210,000 jobs between mid-October and mid-November—less than half the number of jobs added the previous month and well below economists’ expectations.
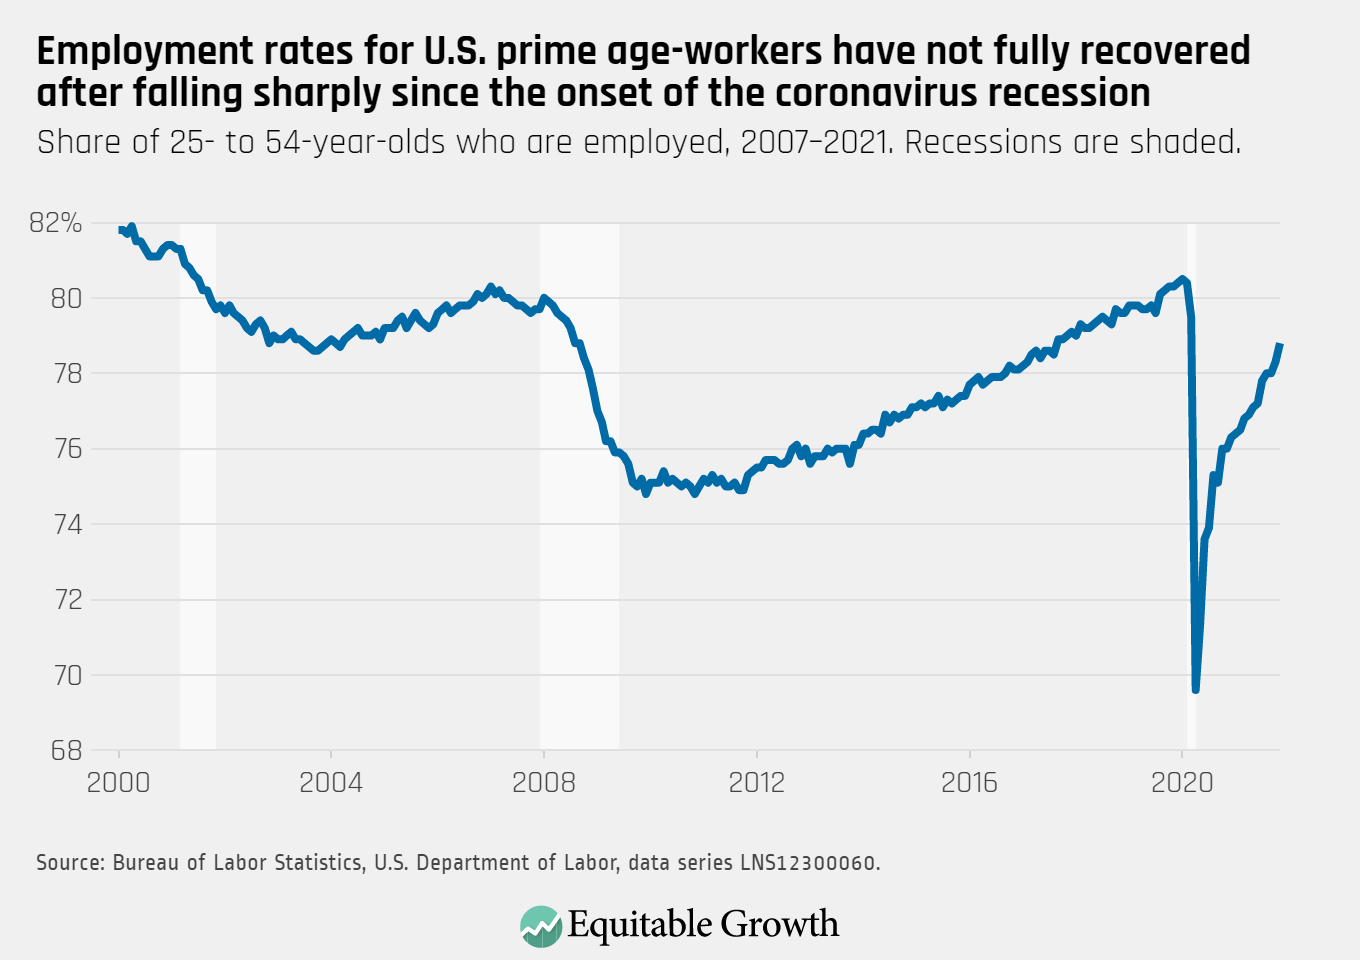
Yet, there are also some good news about the health of the U.S. labor market. The prime-age employment-to-population ratio, or the share of 25- to 54-year-olds who have a job, also rose, climbing from 78.3 percent to 78.8 percent. The unemployment rate fell from 4.6 percent to 4.5 percent—now just one percentage point above its pre-recession level.
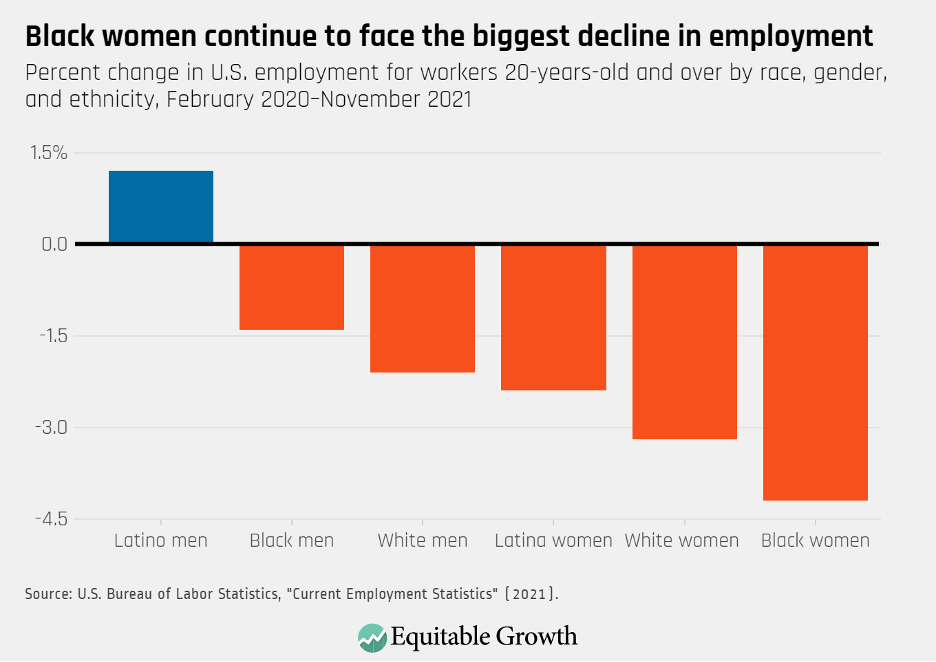
The pace of the recovery has been uneven across demographic groups. For instance, more Latino men were employed last month than in February 2020, but Black women have yet to recover almost half a million jobs to get back to their pre-coronavirus recession employment levels. White women’s employment is 3.2 percent below its pre-recession levels. For Latina women that number is 2.4 percent, for White men 2.1 percent, and for Black men 1.2 percent. (See Figure 1.)
Figure 1
That last month’s job gains were disappointing at the same time that the unemployment rate experienced a substantial decline is likely a feature of how data for the Jobs report is prepared. The Employment Situation Summary is made up of two separate surveys. The Current Employment Survey—which was developed to measure employment and earnings in nonfarm payrolls—and the Current Population Survey—which was designed to capture labor market status in aggregate and for different demographic groups and which has historically been more optimistic.
Visa backlogs could be holding back U.S. jobs growth
Another factor, however, could be that many jobs are going unfilled because of a slowdown in immigration flows and a massive visa backlog that has left many immigrant workers already in the U.S. without a work permit. Pandemic-driven bureaucratic hurdles explain a big chunk of the current shortfall in visa issuance—in 2020 the U.S. government printed 4 million visas, a 4.7 million decline with respect to 2019. Yet, the issuance of employment-based visas as well as immigration inflows more generally started declining before the onset of the coronavirus crisis.
An analysis by The Washington Post finds, for instance, that the growth in the country’s immigrant population began to slow down during president Trump’s administration. The reporting finds that if the foreign-born population in the United States had followed its pre-2019 trend, then there would have been an additional 2.4 million immigrants living in the country, many of whom would have also been looking for work.
At the same time, foreign-born workers’ labor force participation and employment are now back to their pre-pandemic levels. This is the case even amid plenty of reports of businesses losing much-needed workers due to visa-related issues.
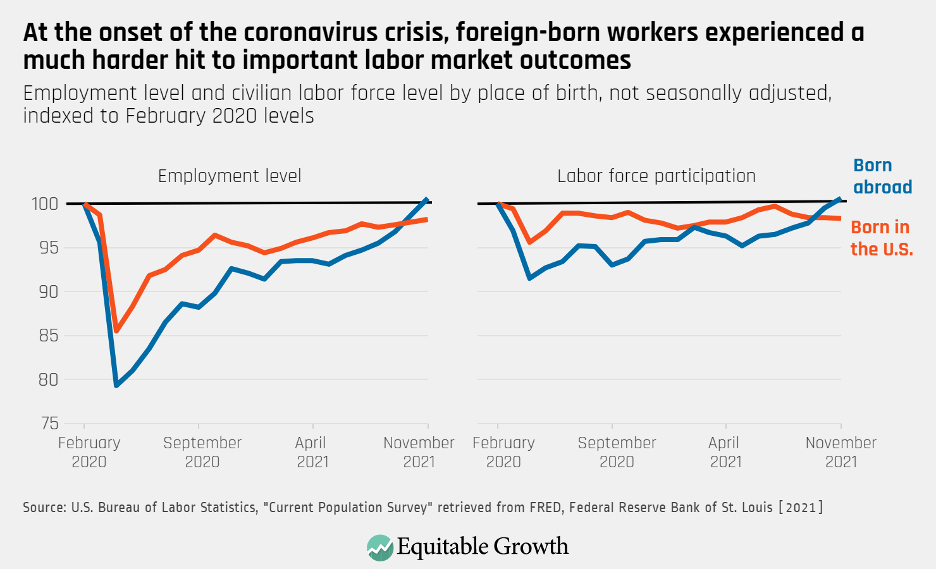
In 2020, foreign-born workers in general and foreign-born women workers in particular suffered much worse labor market outcomes than native-born workers, with official data showing that both the labor force participation and employment levels of those born outside of the country saw a sharper decline. Despite representing only 17 percent of the U.S. workforce, for instance, foreign-born workers accounted for 40 percent of all the workers who stopped participating in the U.S. labor force from 2019 to 2020.
Initially, foreign-born workers also experienced a slower bounce back. But since this past October, foreign-born workers have actually surpassed their native-born counterparts in terms of their recovery in employment and labor force participation. In November, the number of employed workers born abroad reached its pre-pandemic level, while there are still 2.3 million fewer native-born workers. (See Figure 2.)
Figure 2
This is not an unusual trend. What economist Huanan Xu at the University of Indiana calls a “first fired and first hired pattern” has been a feature of the U.S. labor market at least since the late 1990s, indicating that immigrant workers are both more likely to be fired first as the economy contracts and to be hired first as it recovers. Xu suggests that discrimination and disadvantages in terms of educational credentials might drive the “first fired” phenomenon, while disproportionately large income shortfalls and lack of access to government supports are likely behind the “first-hired” trend.
With monthly quits continuing to break past records, employers reporting struggling to hire workers, and the labor market facing a 3.9 million job shortfall with respect to February 2020, it is essential that the U.S. government addresses the administrative bottlenecks that are keeping millions of immigrants who want and are able to work from doing so.
Steps needed to break the visa logjam and boost U.S. employment and productivity
The Biden administration is taking some initial steps in the right direction. Though it does not set up a path to citizenship, the Build Back Better Act includes immigration provisions that would provide temporary work authorizations and deportation protections for many undocumented workers and their families living in the United States. The bill also includes provisions that would address the massive green card and employment-based visa backlog. In addition, the legislation would appropriate additional funds for the U.S. Citizenship and Immigration Services to increase capacity and reduce processing times.
Policymakers and labor enforcement agencies can also take action to make sure immigrant workers have access to good working conditions. Research by Janice Fine, Jenn Round, and Hana Shepherd of Rutgers University and Daniel Galvin of Northwestern University shows that immigrant workers—and women immigrant workers in particular—are especially likely to experience wage theft, and even more so during recessions. It is therefore essential to ramp up the enforcement of labor standards by targeting some of the most troublesome industries and increasing the cost of noncompliance.
Policymakers also need to ensure that income support benefits are both sufficient and available for some of the workers who need them the most. As such, another important step is to expand benefit eligibility for programs such as Unemployment Insurance to undocumented workers and temporary workers.
Immigrant workers and families make the country’s economy more dynamic, represent a disproportionately large share of the essential workforce, and boost demand for U.S. consumer goods. For this recovery to be complete and broadly shared, immigrant workers need to have access to the country’s labor protections and social insurance programs, as well as to good-quality jobs.
On December 3, the U.S. Bureau of Labor Statistics released new data on the U.S. labor market during the month of November. Below are five graphs compiled by Equitable Growth staff highlighting important trends in the data.
Total nonfarm employment increased by 210,000 in November, and the employment rate for prime-age workers rose to 78.8 percent.
The unemployment rate declined to 4.2 percent in November, remaining higher for Black workers (6.7 percent) and Latinx workers (5.2 percent) compared to Asian American workers (3.8 percent) and White workers (3.7 percent).
The overall employment rate rose to 65.0 percent for men and 53.8 percent for women, still below pre-pandemic levels for both groups.
Private-sector employment continued to make gains in November, but public-sector employment gains have faltered
Despite recent gains, the jobs recovery remains fragile. Employment in many industries has increased more slowly than in recent months, and remains below pre-pandemic levels.