JOLTS Day Graphs: September 2021 Edition

Every month the U.S. Bureau of Labor Statistics releases data on hiring, firing, and other labor market flows from the Job Openings and Labor Turnover Survey, better known as JOLTS. Today, the BLS released the latest data for September 2021. This report doesn’t get as much attention as the monthly Employment Situation Report, but it contains useful information about the state of the U.S. labor market. Below are a few key graphs using data from the report.

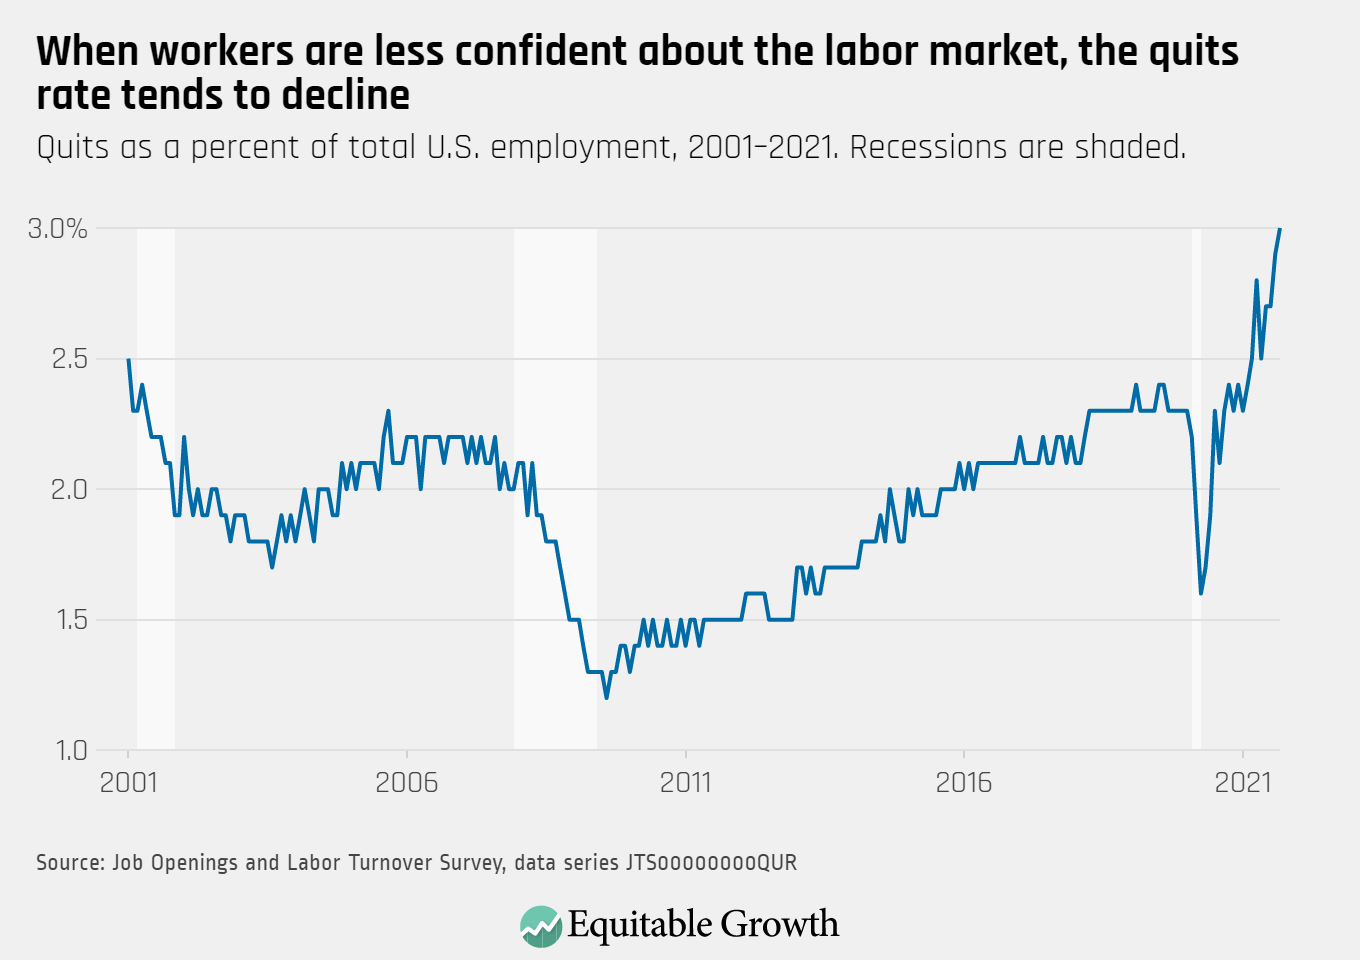
The quits rate continued to rise in September to 3.0 percent as nearly 4.4 million workers quit their jobs, an increase of 164,000 since August.

Quits as a percent of total U.S. employment, 2001–2021

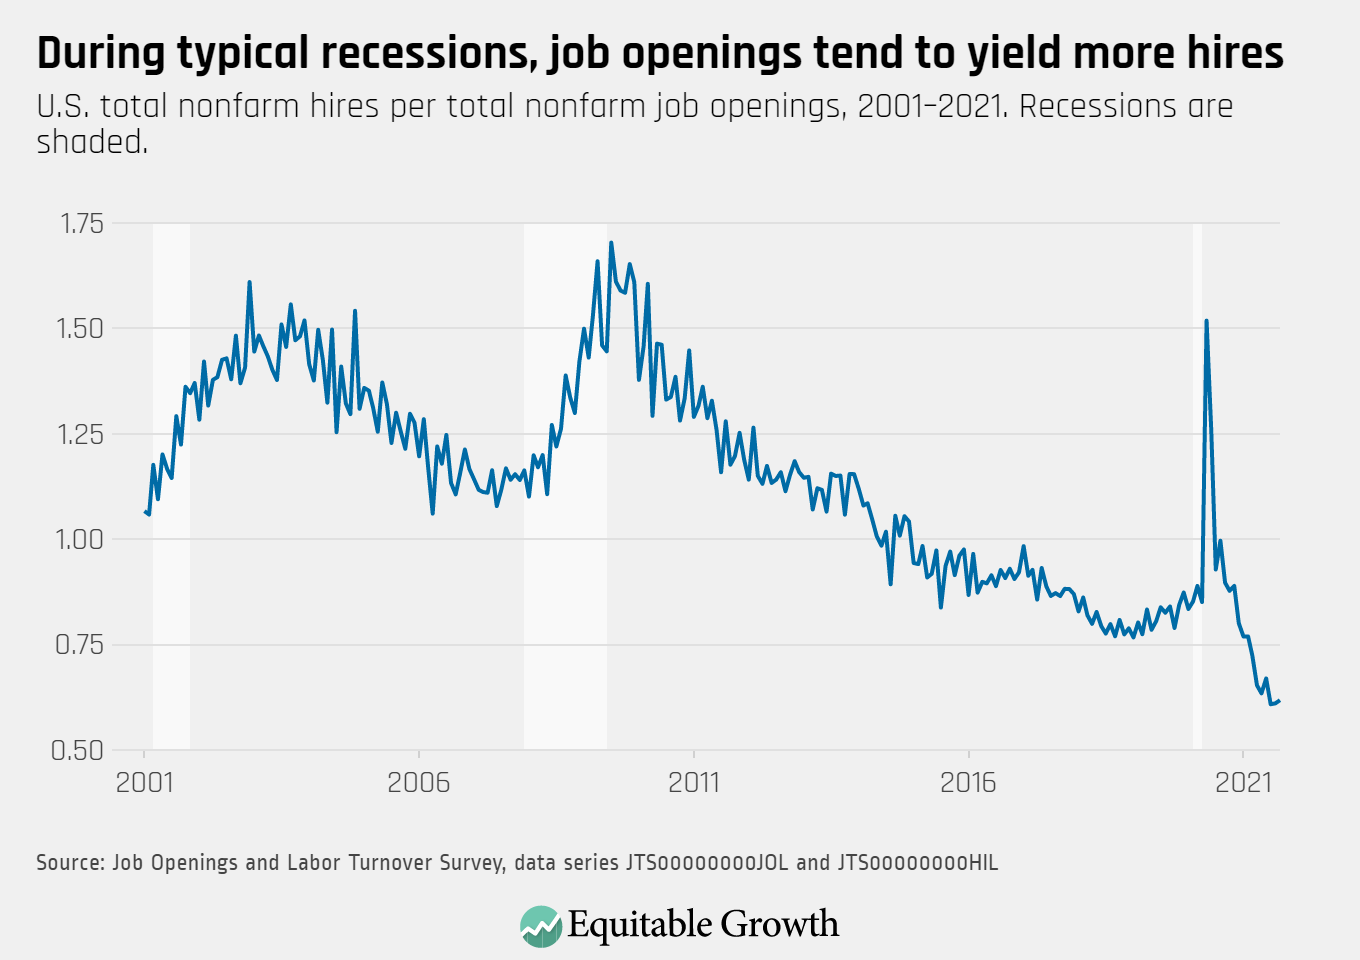
The vacancy yield remains extremely low as job openings (10.4 million) and hires (6.5 million) stayed relatively constant in September.

U.S. total nonfarm hires per total nonfarm job openings, 2001-2021. Recessions are shaded.

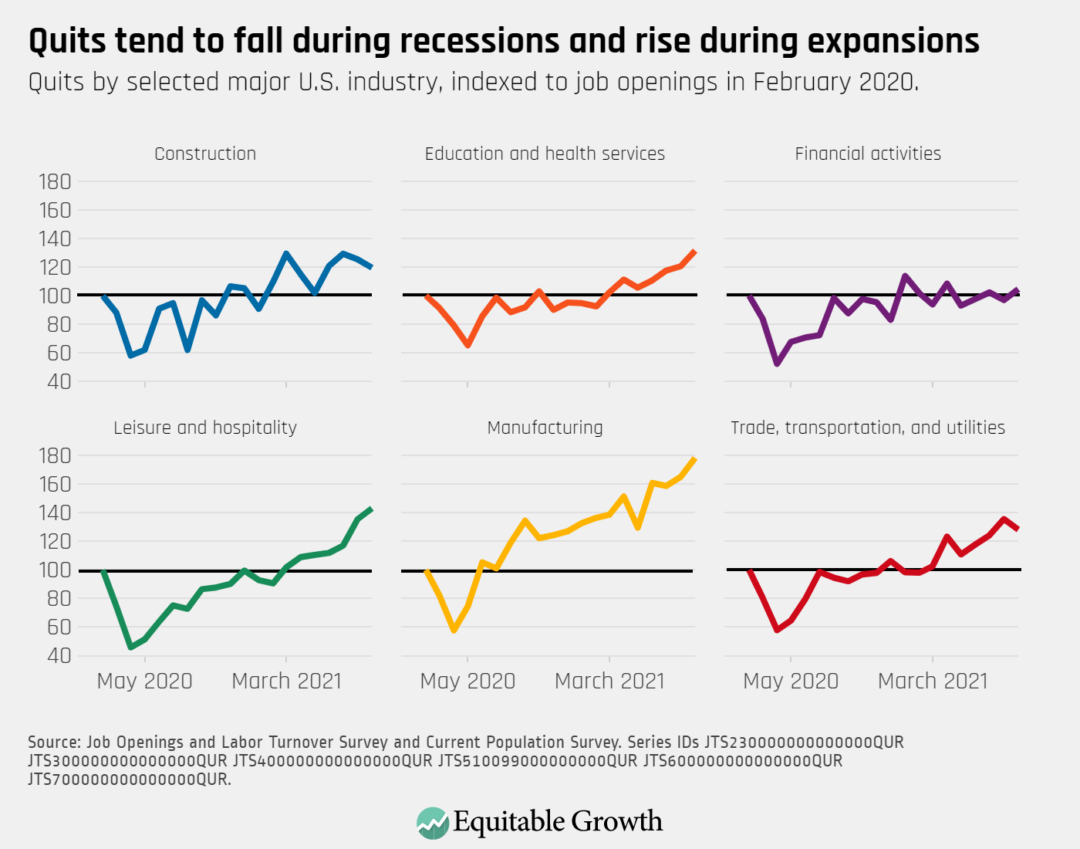
Quits are elevated and continued to rise in industries such as manufacturing, leisure and hospitality, and education and health services.

Quits by selected major U.S. industry, indexed to job openings in February 2020

The ratio of unemployed-worker-per-job-opening decreased from 0.79 in August to 0.74 in September. At the same time, 183,000 workers left the labor force in September.

U.S. unemployed workers per total nonfarm job opening, 2001-2020. Recessions are shaded.

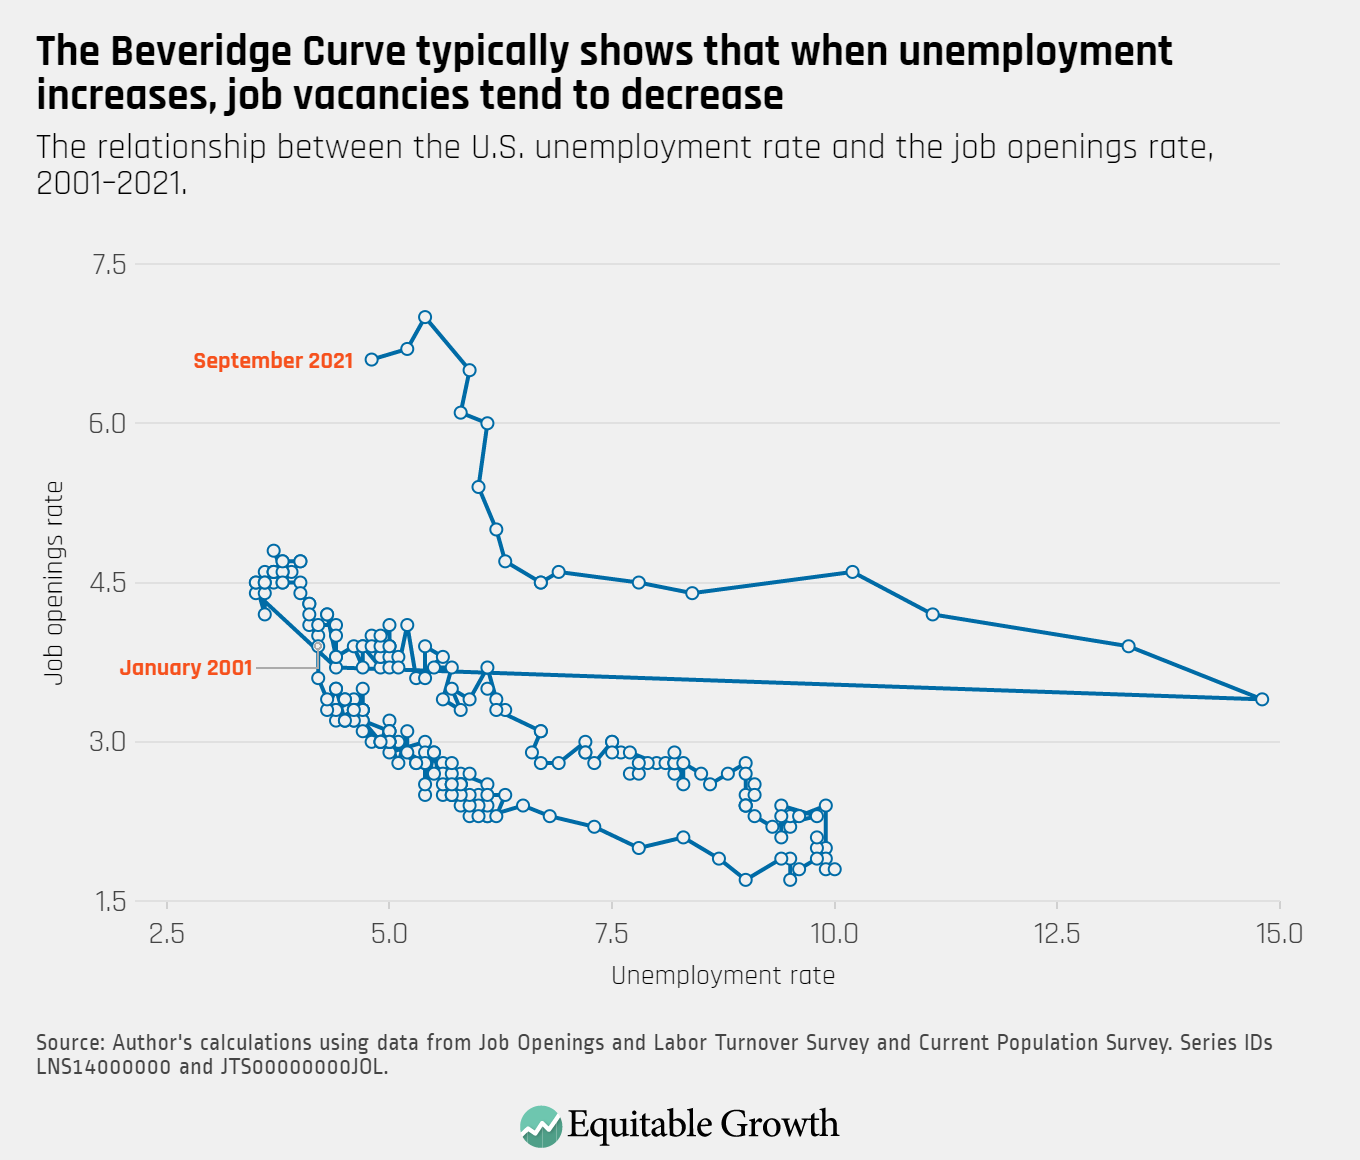
The Beveridge Curve continues to be in an atypical range compared to previous business cycles, with the unemployment rate declining to 4.8 percent and the job openings rate still elevated at 6.6 percent.

The relationship between the U.S. unemployment rate and the job openings rate, 2001-2021.
Connect with us!

Explore the Equitable Growth network of experts around the country and get answers to today's most pressing questions!

Get in Touch