Overview

The impending expiration of large portions of the 2017 Tax Cuts and Jobs Act at the end of 2025 presents federal policymakers with a significant opportunity to reform the federal tax code in the United States. Too often, political openings for pro-growth tax reform have instead been transformed into opportunities to introduce new tax cuts for those at the top of the income and wealth distribution. Proponents of these tax cuts usually defend their actions by invoking a now-widely discredited “trickle-down” theory of economic growth.
The current tax code has become far less progressive and is now littered with counterproductive loopholes and special tax advantages. As a result, it generally fails to bolster widely shared economic growth, as it could and should.
This time, policymakers should embrace strong, stable, and broad-based economic growth as a key objective of next year’s tax reform. They should do so with a deep and empirical understanding of how a progressive tax code actually impacts the nation’s economy—not just in theory, but also in reality. True pro-growth tax reform is possible and, indeed, necessary.
There are three main mechanisms by which more progressive tax policies can foster equitable economic growth:
- First, progressive taxes are a key tool for addressing and mitigating corrosive concentrations of wealth and income. Excessive inequality is itself a drag on growth. Because taxes can be used to reduce inequality, they can be designed to enhance inclusive growth.
- Second, taxes generate revenue that can be used to fund growth-enhancing public investments, such as universal child care and the mitigation of climate change, and to reduce long-term fiscal risks. A lack of revenue, conversely, can lead to underinvestment and a riskier fiscal trajectory.
- Third, taxes can directly shape markets and economic choices. They have largely been used to reinforce counterproductive behavior and reward the already-economically powerful, but they can instead incentivize pro-growth innovation and competition.
This report will synthesize the available academic research on how changes to the tax code can use these three mechanisms to boost growth and will describe a handful of policy interventions that reflect these lessons. Some of the suggested policy prescriptions can utilize two, or even all three, mechanisms to foster growth, while others may be more focused on just one approach. These are by no means the only tax policies that would enhance economic growth and are instead intended to be illustrative. Regardless of any specific proposal, if policymakers want to use tax reform to encourage strong, stable, and broad-based economic growth, then they should keep these three mechanisms in mind.
The first section of the report will dive deeper into how reducing excessive inequality can increase growth. The second section will flesh out how generating more revenue can improve economic growth. And the third section will discuss incentives and efficiency. In each section, the report will explain the underlying economics of the mechanism, describe how it is not being fully leveraged today, and offer policy recommendations that are illustrative of reforms that policymakers can pursue to better maximize each mechanism’s pro-growth potential. The fourth section offers concluding thoughts. For definitions of some technical terms used throughout the report, see our glossary of frequently used tax terms.
Mechanism #1: Reducing the drag of inequality

High levels of income, wealth, racial, and geographic inequality not only violate shared American values of fairness and equal opportunity, but also present a major threat to the U.S. economy itself. Taxes are an enormously powerful policy tool for combating these excessive and damaging inequalities.
Underlying economics
As Equitable Growth co-founder Heather Boushey (now a member of the White House Council of Economic Advisers) laid out in her book Unbound, high and rising inequality drags down economic growth in three ways: by obstructing opportunities, distorting incentives, and subverting institutions.2 We summarize each in turn.
First, inequality obstructs the supply of people and ideas into the economy, as well as limits opportunity for those not already at the top, both of which slow productivity growth over time. It is well-documented, for example, that the economic circumstances into which children are born have enormous effects on children’s development—from their health to their ability to focus at school to their educational opportunities. When inequality is high, childhood opportunities for enrichment among low- and middle-income children tend to be limited, which, in turn, affects their economic outcomes as adults, diminishing their ability to contribute to broader economic growth.3
For instance, research led by Harvard University economist Raj Chetty on patents finds that the most significant contributor to earning a patent later in life is parental income, far outweighing demonstrated intelligence and child aptitude scores. Children from families whose income is in the top 1 percent are 10 times more likely to become inventors than children from below-median income families.4 In other words, high inequality leads to fewer inventors and fewer entrepreneurs, thereby dragging down national productivity. It makes the U.S. workforce less capable than it could be and the U.S. economy less innovative.
Second, inequality distorts economic demand through its effects on both consumption and investment. Consumption has been one of the key drivers of economic growth over the past several decades. When there are more customers, there are more businesses. When customers have more to spend, there are more jobs to supply the goods they are demanding. But as more gains have accrued to the top over the past 40 years, the broad middle has had less ability to consume than it otherwise would have had.
The late economist Alan Krueger estimated that because of increasing inequality between 1979 and 2007, aggregate consumption was about $440 billion lower every year than it would have been if lower-income consumers had grown more prosperous.5
When everyday consumers do not have as much money to spend, businesses, in turn, are less incentivized to make robust investments.6 U.S. firms, for example, are sitting on record-high piles of cash, which have been steadily accumulating since the 1980s.7 And the savings glut among the wealthy pushes their capital toward rent-seeking—activity that seeks to earn more profit, not from productive value creation but from extractive practices fueled by market power—and expanding the supply of credit, rather than toward productivity-enhancing investments that can strengthen economic growth.
Third, inequality subverts the institutions that manage the market, making the political system less effective and labor markets dysfunctional. With an increased concentration of economic power accruing to fewer and fewer firms, businesses today are able to wield outsized influence on the political process and potentially promote interests with the aim of larger profits, even at the expense of public interests.8
Excessive concentrations of economic power also allow those with the means to distort markets in their favor. Research demonstrates, for example, that inequality has resulted in lower wages for those working in monopsonistic labor markets, where there is only one or a handful of employers in a given market, giving these firms outsized wage-setting power.9
Simply put, excessive inequality is, itself, an impediment to stable and healthy growth. Tax policy can either contribute to or mitigate excessive inequality. Unfortunately, for the past several decades, tax policy changes have exacerbated, rather than reduced, this barrier to economic strength.
Current state of play
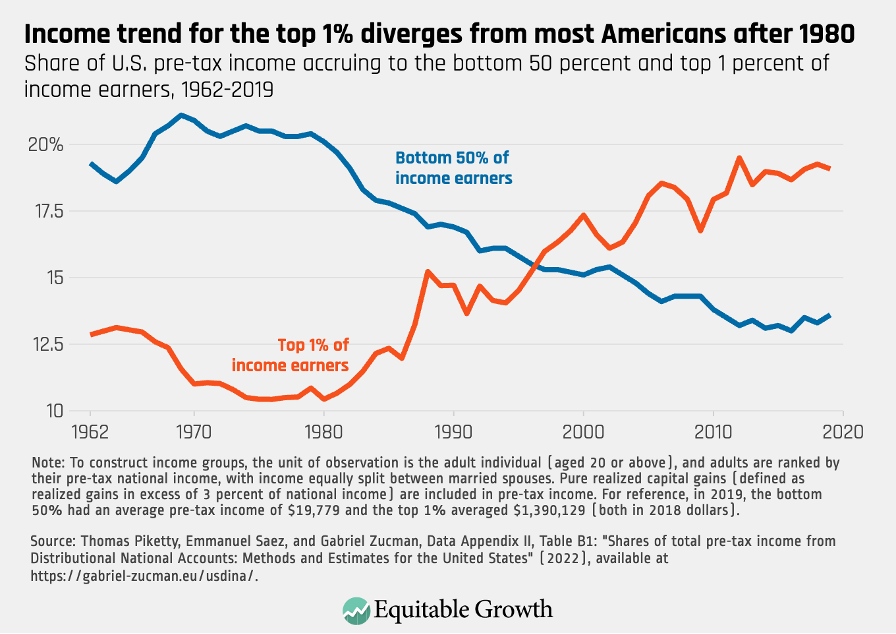
As is well-documented, inequality in the United States has been stubbornly high across several dimensions for decades now.10 According to one estimate, 70 percent of national income in 1979 was earned by the bottom 90 percent of individuals. But by 2019, the share of income earned by that group had fallen by 9 percentage points, to just 61 percent of national income.11 Nine percentage points of all national income represents an enormous transfer of income from working- and middle-class families to those at the top. (See Figure 1.)
Figure 1
Economic outcomes in the country today are largely a function of where, when, and to whom you are born. Economists studying generational mobility find that a child born in 1940 had a 90 percent chance to earn more income than their parents by the time they were 30 years old. But a child born in 1980, whose adult earnings are observed in 2010, had just a 50 percent chance to do the same.12
Although there is some evidence that inequality may have plateaued somewhat since 2007, it is still higher in the United States than most other high-income nations.13 Some of the divides are so wide—and some of the fortunes at the top so big—that, without major shifts in trajectory, these large gaps will persist in perpetuity, and the nation will permanently become a society of haves and have-nots.14
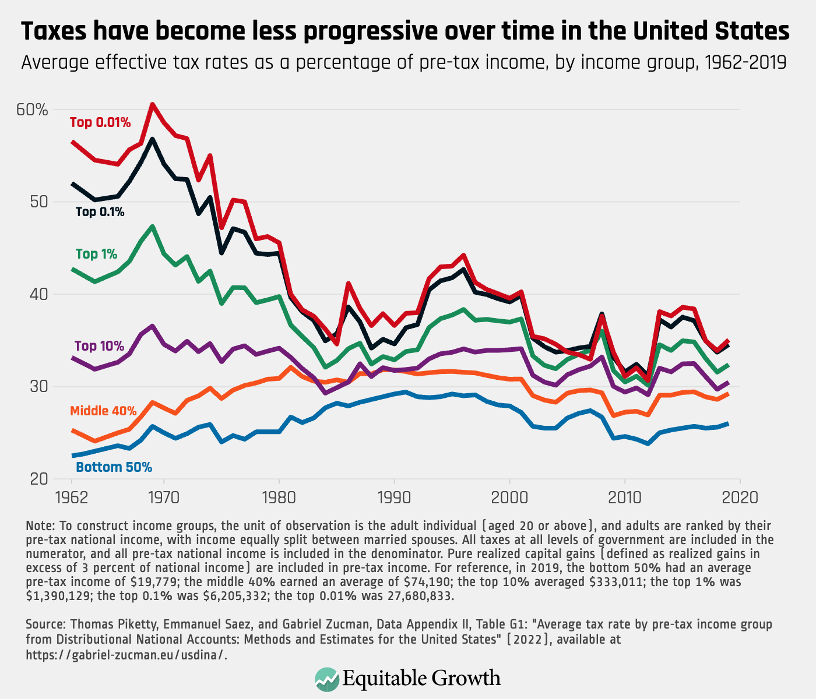
But instead of using the U.S. tax code to change the trajectory and combat this economically harmful rise of inequality, our nation’s tax policies have gotten less progressive over time, with multimillionaires now often paying a lower tax rate than middle-class workers.15 There are legitimate methodological questions about how to measure the progressivity of the tax code.16 But it is undeniable that the rich have seen a huge windfall in recent decades from large, sustained cuts in taxes. By one calculation, the effective tax rate of the top 1 percent, including all federal, state, and local taxes, has declined from about 50 percent in the early 1950s to 32 percent in 2021.17 Indeed, since 1962, effective tax rates on the bottom 90 percent have risen, while taxes on the top 1 percent, and especially the top 0.1 percent, have fallen precipitously. (See Figure 2.)
Figure 2
This sharp decline is the result of several successive changes in the tax code over many decades. To start with, top marginal tax rates on both labor and individual capital income have been dramatically reduced, as has the tax rate on corporate profits. Additionally, over the past several decades, new carveouts and special preferences have been added to the tax code, many of which disproportionately benefit people with high incomes.
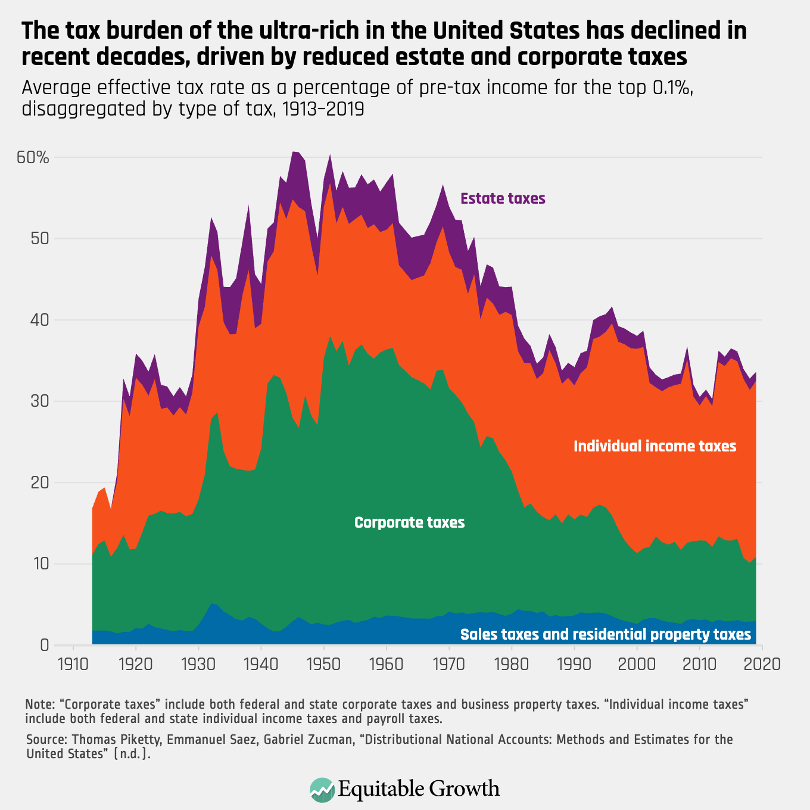
In 2017, for example, the U.S. Congress doubled the estate tax exemption and added a new tax deduction for business income claimed on personal tax returns. The latter type of income is heavily concentrated among richer households, and the design of the deduction itself benefits richer people, who claim the benefit more than poorer people do. (See Figure 3.)
Figure 3
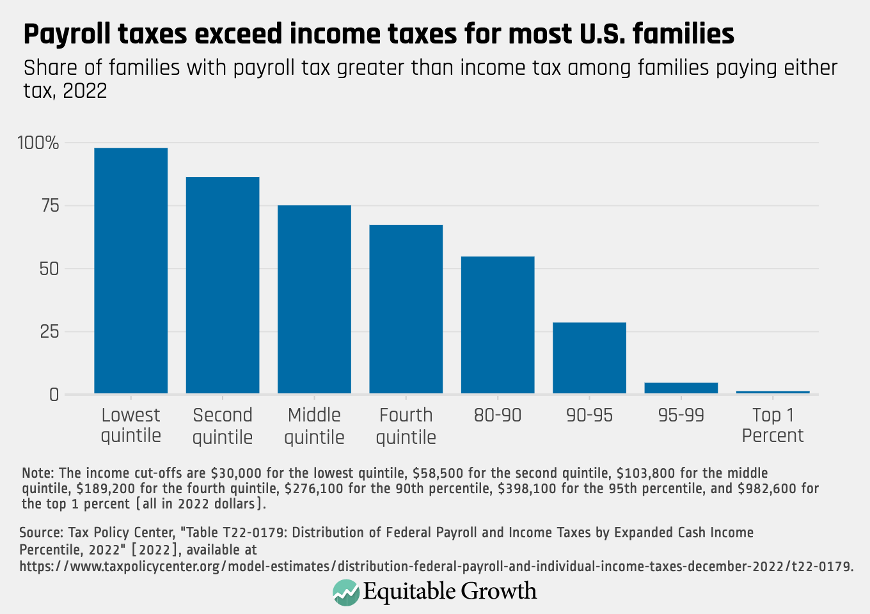
By contrast, payroll taxes, which are regressive, have increased over time and today represent the primary federal tax burden on low- and middle-income households. Though most workers pay the same percentage of their wage income in payroll tax (6.2 percent for Social Security, 1.45 percent for Medicare, and identical amounts from their employer, which economists have found to effectively be paid by workers in the form of reduced pay), high-income workers are shielded from the Social Security tax on pay above a cap ($168,600 in 2024, adjusted for inflation each year). (See Figure 4.)
Figure 4
The combined effect of these changes is that the tax code does far less to reduce income inequality than it once did—and certainly far less than it could. As a result, the U.S. economy struggles under the burden of overly concentrated income and wealth.
Illustrative policy interventions
The tax code could be reformed so that it more robustly reduces income and wealth inequality across several dimensions, including racial and gender disparities, and thereby reduces the drag of inequality on growth. In general, policies that increase the effective tax rate for those at the top of the income distribution while reducing it for those toward the bottom, are going to have this salutary effect.
In fact, the effective tax rate for the richest 1 percent of households is closely associated with the degree of inequality-reducing power in the tax code.18 So, as policymakers seek to improve the tax system’s ability to reduce inequality, they should start by focusing on ways to increase the effective tax rate for the rich.
Better taxation of capital income
Capital income—distinct from labor income—derives from the ownership of capital assets, such as stocks, businesses, or property. This type of income is highly concentrated at the top of the income distribution. In fact, capital income accounts for nearly 70 percent of all the income generated by households in the top 0.1 percent but less than 5 percent of all income for the bottom 80 percent of U.S. households.19 Capital income is also highly concentrated by race, with nearly all capital income flowing to White households.20
In addition to being highly concentrated, capital income tends to enjoy special tax advantages that labor income does not. Capital gains income is taxed at lower rates than ordinary income. The tax on most capital income is only due upon “realization” of the gain—when the asset is sold—a feature of the tax code that allows the holder of the asset to defer paying taxes on their income until the time of his or her choosing. What’s more, capital assets can be transferred tax-free to heirs—and then escape taxation entirely, thanks to what’s called the stepped-up basis rule. (See the term “basis” in the glossary.)
These preferences were originally justified on the basis of economic efficiency, and it is true that academic work from the past century theorized that capital taxation reduced growth. But those models were based on unrealistic assumptions and have been largely discredited by more recent empirical findings.21 (For more on these efficiency arguments, see the section below on “Mechanism #3: Align tax incentives toward productive economic behavior.”)
Policymakers can improve the progressivity of the tax code by removing some or all of these tax preferences for individual capital income. That could include higher capital gains and dividends tax rates, ending the stepped-up basis tax loophole, or curtailing the ability to defer tax liability on capital gains indefinitely. All these reforms would raise the effective tax rate for the richest U.S. families and thereby reduce post-tax inequality.
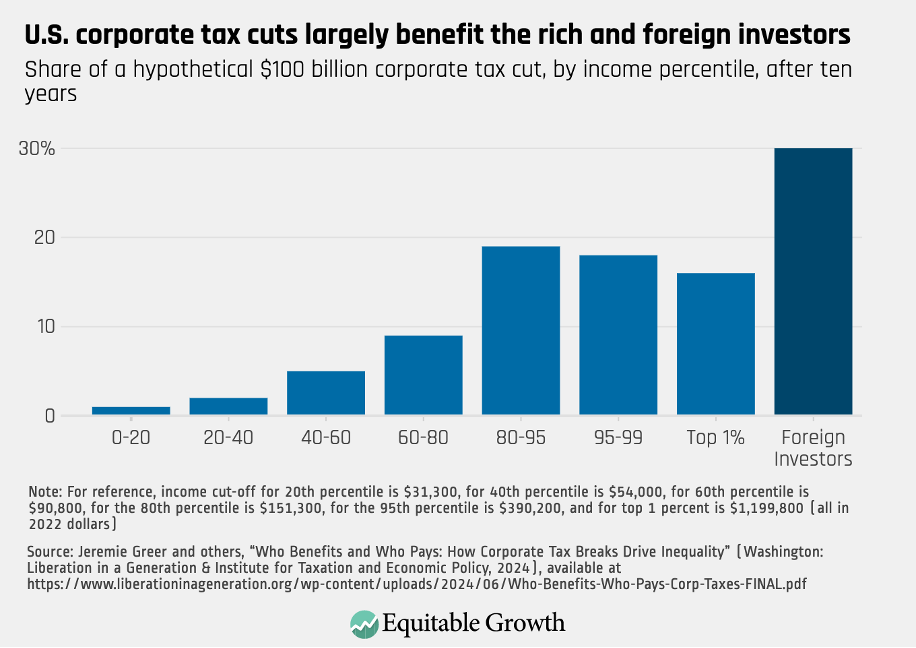
Corporate profits are another form of capital income. There are those who argue that the corporate tax is not a tax on capital income and instead is borne by workers in the form of lower wages, making it a tax on labor income instead.22 Yet the economic evidence—including across nations, across U.S. states, and general equilibrium modeling—points strongly away from this view and toward the more straightforward conclusion that shareholders, including foreign shareholders, pay the bulk of corporate tax. (To the degree that workers do pay some of the tax, it tends to be higher-wage workers, particularly executives.23) (See Figure 5.)
Figure 5
Corporations also have enjoyed significant tax cuts in recent years. The 2017 tax law cut the marginal rate for corporate profits by 40 percent. On top of that, corporations employ a variety of mechanisms and techniques to shield their shareholders from taxation.24 The simplest way to rectify this regressivity built into the tax code is to raise the corporate income tax rate and strengthen the taxation of multinational corporations to deter profit-shifting and tax avoidance.
In addition, policymakers could allow the 2017 deduction for business income to expire, as it—like all tax breaks on capital income—disproportionately benefits the top of the income distribution. Roughly half of the benefit from the business income deduction flowed to households with more than $1 million in annual income.25
Again, all these policies would reduce inequality, and therefore contribute to stable, strong, and broad-based economic growth, by raising taxes disproportionally on the wealthiest U.S. individuals.
Increase the progressivity of labor income taxes
Reforming capital income taxation is not the only way that policymakers could use tax policy to reduce inequality. There are several ways to improve progressivity in the taxation of labor income as well. Most directly, the U.S. Congress could increase the top marginal income tax rate. One of the important reasons why the federal tax system does so much less to reduce inequality than it once did is because the top marginal income tax rate has fallen precipitously, from more than 90 percent 60 years ago to just 37 percent today.26
Beyond the top rate, the current tax code includes numerous “upside-down” tax breaks that benefit richer households more than poorer ones. In a progressive rate structure, any deduction, exemption, or exclusion from taxable income will necessarily bestow higher tax savings on people in higher tax brackets (because a dollar not taxed in the top bracket yields 37 cents in savings, while that same dollar not taxed in the bottom bracket yields only 10 cents in savings).
Policymakers could seek out ways to reduce the tax benefits for higher-income households either by placing a limit on the benefits or by transforming some deductions, exclusions, or exemptions into credits instead. Notably, the most effective tax expenditures in the tax code, which are proven to reduce child poverty, are also the most progressive: the Child Tax Credit and the Earned Income Tax Credit. These tax credits should be expanded to reduce inequality and thus spur equitable growth.
Taxes are one of the best tools policymakers have in the federal policy arsenal for reducing inequality—which, as this section shows, can spur equitable growth. Across both capital and labor income taxation, there are many ways to make the federal tax code more progressive and thus more pro-growth.
Mechanism #2: Financing high-return investments and reducing fiscal risk

The tax system’s most fundamental role in the U.S. economy is raising sufficient revenue to finance public programs, services, benefits, and investments. But recent rounds of tax cuts have dramatically reduced revenue and increased deficits, hamstringing the federal government’s ability to make critical investments in the future while also increasing the risk that the federal fiscal trajectory will, at some point, negatively impact the economy.
Underlying economics
Public investments are indispensable for generating strong and sustainable economic growth. In particular, federal investments in research and development, as well as in physical and social infrastructure, tend to yield a high rate of return, meaning they result in significant increases in economic output and productivity far beyond their initial costs, with large positive spillovers across society.
It is well-established that public spending on R&D leads to technological breakthroughs, “crowds in” private investment, and improves economywide productivity.27 Indeed, federal R&D investments have historically helped build technologically advanced industries, such as computer hardware and software,28 aerospace,29 and pharmaceuticals.30
Physical infrastructure—such as highways, bridges, tunnels, and water and sewage systems—is another area where public investment is quite economically valuable.31 Recent projections made by the nonpartisan Congressional Budget Office and other forecasters, for example, suggest that the Infrastructure Investment and Jobs Act of 2021 will increase real Gross Domestic Product, employment, and productivity over the next decade.32
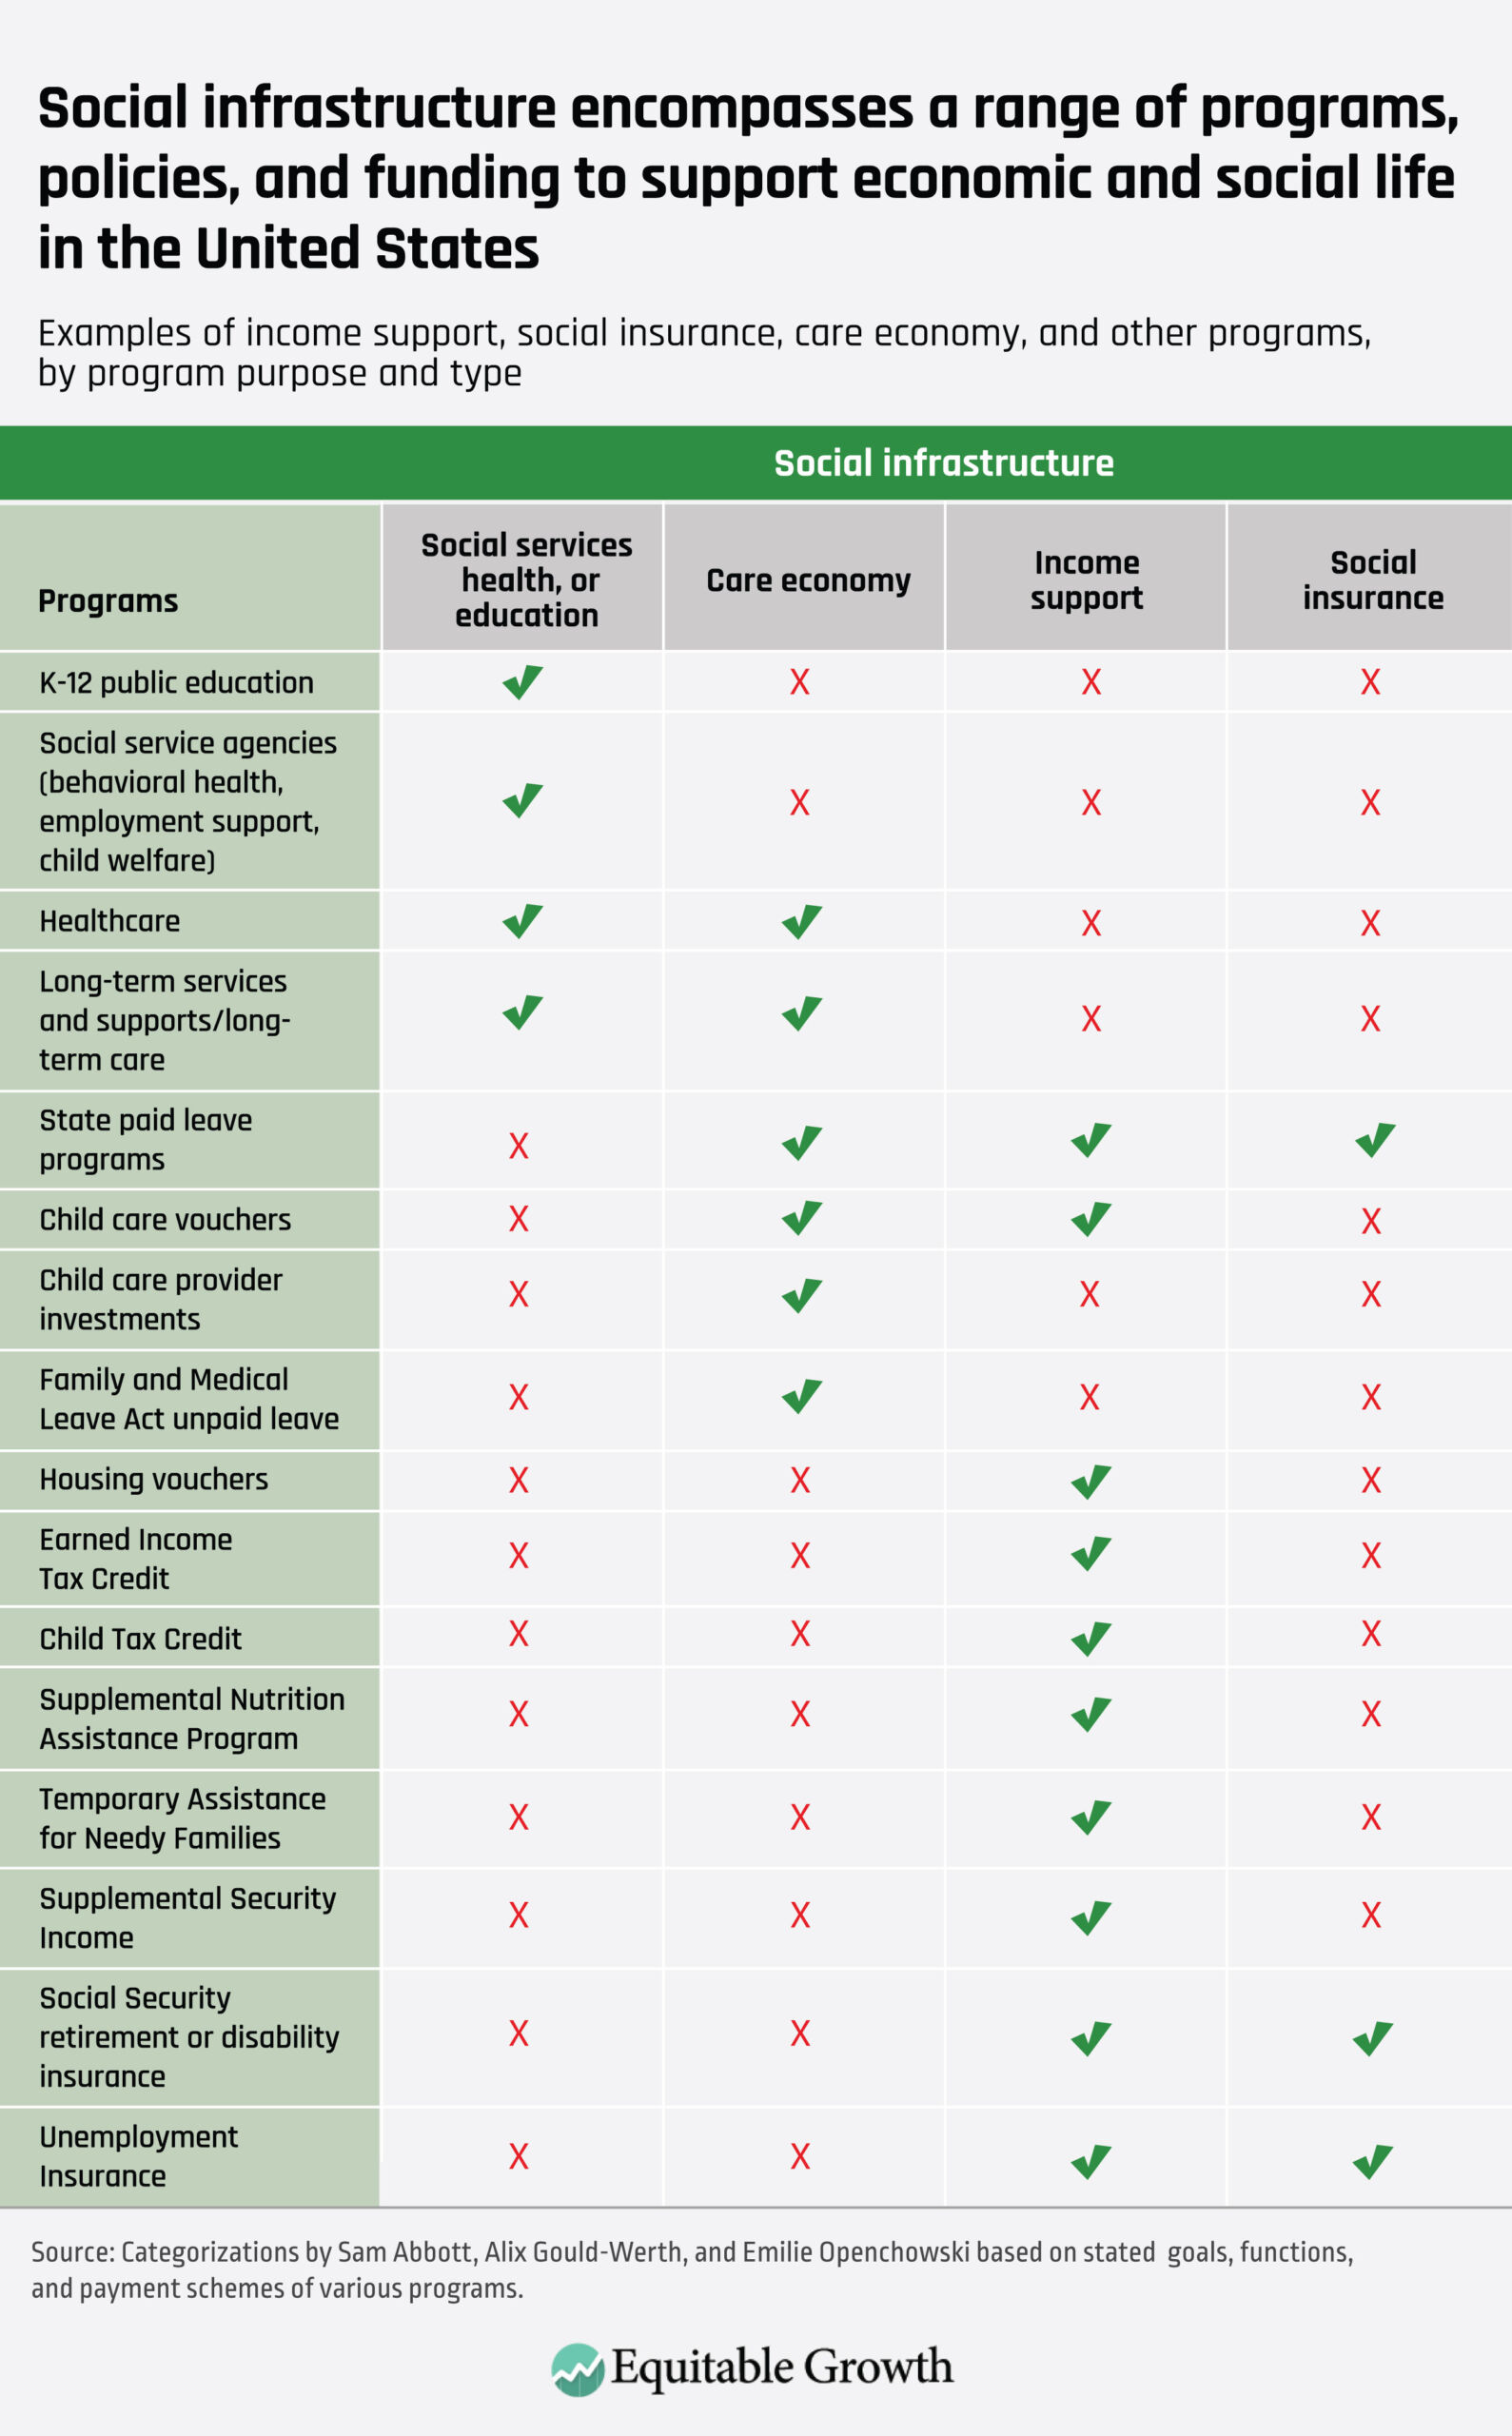
Social infrastructure—the set of policies, resources, and services that ensure people can participate in productive social and economic activities—also fosters economic growth. Investing in social infrastructure facilitates more labor force participation,33 develops the human capital of the next generation of workers,34 allows the current generation of workers to deploy the social capital they have already developed,35 and stabilizes the macroeconomy.36 Indeed, returns to the greater economy from public investment in children alone are significant, with some programs returning $10 to society for every dollar invested in children.37 (See Figure 6 for specific examples of social infrastructure.)
Figure 6
In addition to being used to finance productive public investments, federal revenue is obviously one-half of the total balance sheet, alongside federal spending. When taxes are too low, that can not only depress investment but also increase debt.
Sometimes, an increase in debt is the right economic policy. This is especially the case during economic downturns or when there is a substantial amount of “slack” in the economy. But other times, it can have negative consequences. Certainly, a persistent lack of revenue, especially coupled with rising costs from the population aging, can result in a fiscal posture and trajectory that carries significant economic risks. Raising taxes, therefore, can be useful economically to ensure that fiscal policy is on a responsible course and to minimize those potential risks.
Rising debt can lead to slower economic growth under certain circumstances, mainly by putting upward pressure on interest rates. It is true that the observed relationship between debt and interest rates actually has been negative over the past 40 years, and we therefore should be skeptical that every increase in debt is necessarily going to result in higher rates.38 But all else being equal, empirical research suggests that higher debt means higher interest rates.39 In other words, there is a real risk that a rising debt trajectory will cause rates to be higher than they otherwise would be, creating an obstacle to faster economic growth.
In addition to higher interest rates, a rising debt trajectory can lead to a situation in which rising interest payments on the debt also begin to limit the willingness and ability of the federal government to productively invest in physical and social infrastructure, as well as in research and development. And there is some unquantifiable risk that a rising debt trajectory could, at some point, create an acute fiscal crisis. These are all risks that higher federal revenues would mitigate.
Current state of play
The U.S. government invests a relatively small portion of our national income in public investments in children, human capital, research and development, and infrastructure.40 The average member nation of the Organisation for Economic Co-operation and Development makes public investments in family benefits of approximately 2.29 percent of GDP, whereas the United States only invests 1.04 percent of GDP.41 Similarly, the OECD average for public expenditure on early childhood education and care is 0.8 percent of GDP, whereas the figure for the United States is just 0.3 percent.42
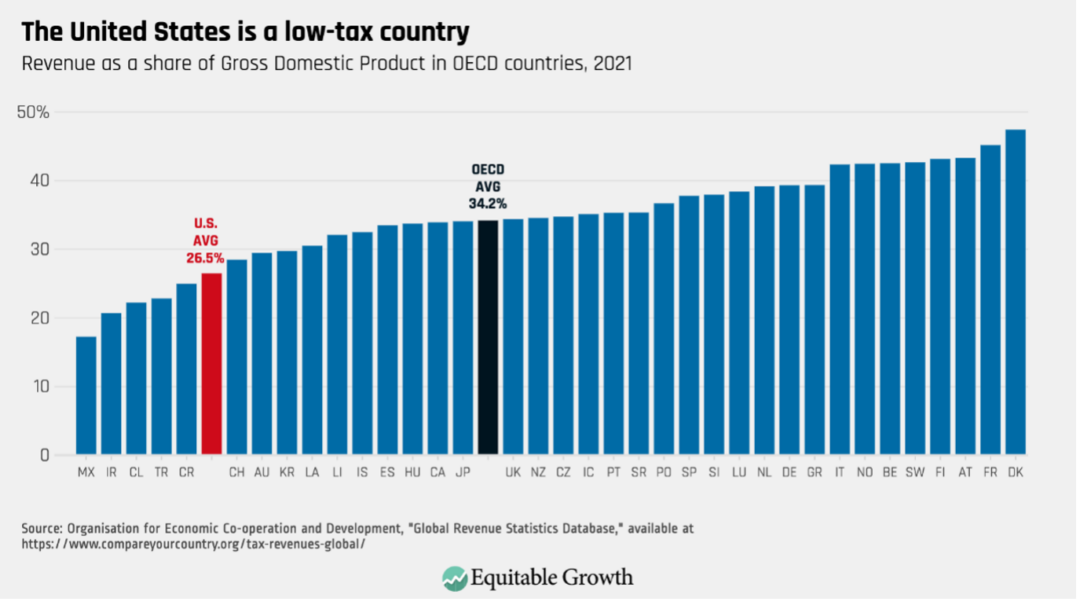
One major reason why the United States underinvests in areas that we know are good for economic growth is that we are fundamentally a low-tax country. The United States has a lower revenue-to-GDP ratio than any other country in the Group of Seven peer leading industrial nations,43 and taxes well below the OECD average. (See Figure 7.)
Figure 7
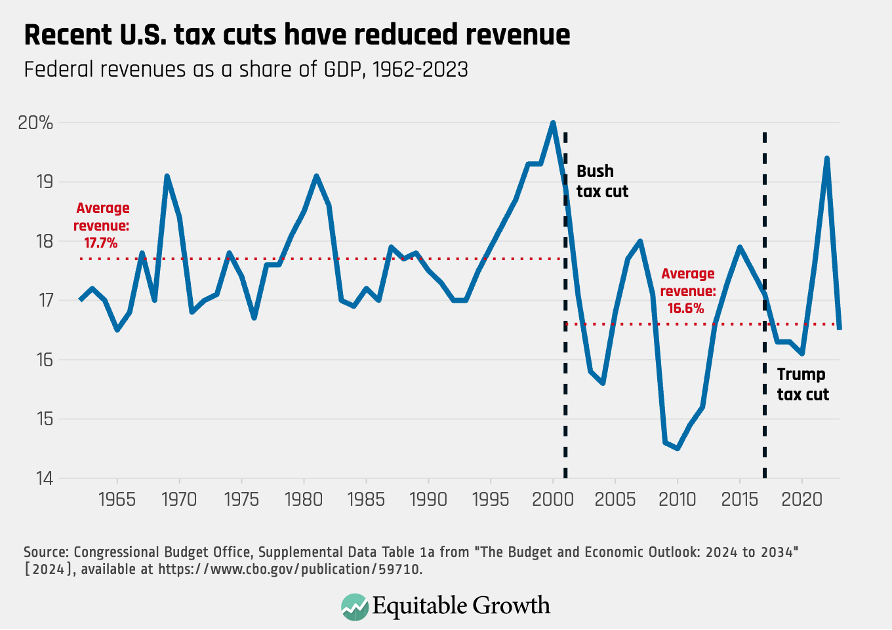
Furthermore, federal revenue has declined significantly over the past two decades due to repeated tax cuts. In fiscal year 2000, the federal tax code generated revenue equivalent to 20 percent of GDP, placing the nation on solid fiscal footing to manage the retirement of the baby boom generation in first half of the 21st century, which policymakers back then recognized would increase Medicare and Social Security spending. That sound fiscal footing was secured by enacting tax increases during the 1990s while making smart strategic investments in children’s health insurance and basic health research.
Today, though, after a series of tax cuts, the tax code generates roughly 17 percent of GDP in revenue.44 In 2023, 3 percentage points of GDP is equivalent to $821 billion—a considerable amount of foregone revenue.45 (See Figure 8.)
Figure 8
Another contributor to the problem of low U.S. tax revenue is a large tax gap between what taxpayers legally owe the IRS under current law and what is actually paid. This gap represents 2.6 percent of GDP, leaving a huge hole in the nation’s budget while also undermining faith in the federal tax system.46
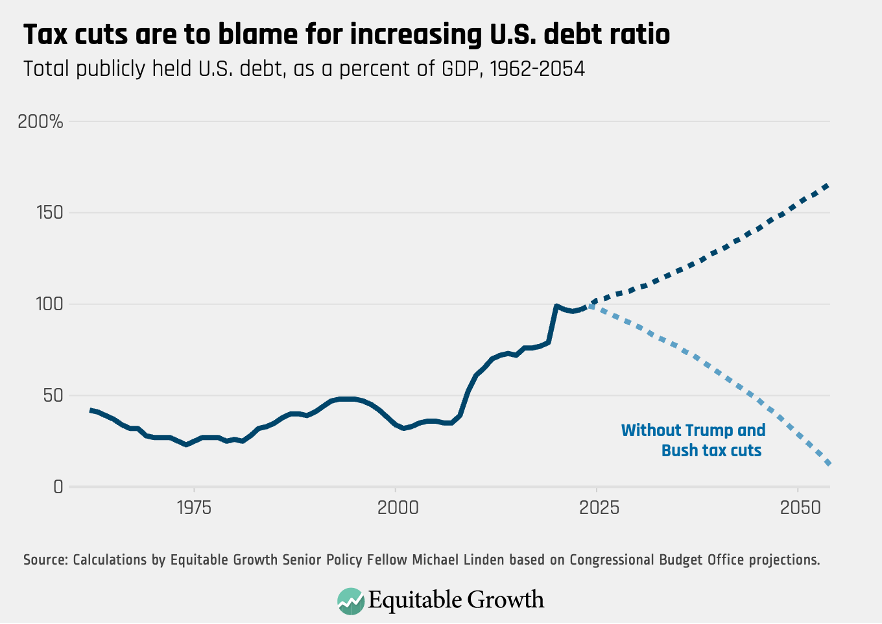
Of course, it is theoretically possible to increase productive investments without increasing revenue, with those investments instead financed by borrowing. And, indeed, persistently low tax revenue has forced the United States to underinvest while simultaneously taking on more debt than necessary. (See Figure 9.)
Figure 9
This, however, has led to a fiscal trajectory that carries real economic risks, as discussed above. While the current fiscal position of the United States is stable, interest payments are increasing, and the projected long-term debt trajectory is likely unsustainable. Over the past 85 years, federal net interest payments as a percent of GDP peaked at 3.2 percent in 1991.47 But that record is poised to be eclipsed in fiscal year 2025, when the Congressional Budget Office projects interest payments will sum to 3.4 percent of GDP and then keep rising to 4.1 percent by 2034.48
Fundamentally, the current tax code is failing at one of its most important responsibilities: generating sufficient federal revenue. And the consequences are both that the public sector is unable to invest appropriately and that fiscal risks are higher than necessary. Pro-growth tax reform must, therefore, raise more revenue than the current tax code does.
Illustrative policy interventions
If policymakers want to enhance robust, equitable growth, the federal tax code needs to generate more revenue. Efficiently and progressively increasing tax revenue is the best way to ensure that we can finance productive public investments while responsibly managing fiscal risks.
There are numerous ways to raise revenue. Notably, all the policy interventions described in the section above, on reducing inequality, would raise significant revenue. Raising the corporate tax rate from 21 percent to 28 percent, for example, would generate roughly $1.3 trillion in new revenue over the following decade.49 And recent scholarship has found that raising the capital gains tax rate, even to upwards of 47 percent, would raise substantially more revenue than previously projected.50
But there are many additional examples of tax policies that would raise valuable revenue, including closing the tax gap by investing in stronger enforcement and adopting a global minimum tax to prevent profit-shifting by multinational corporations. We will now outline these two policies in more detail.
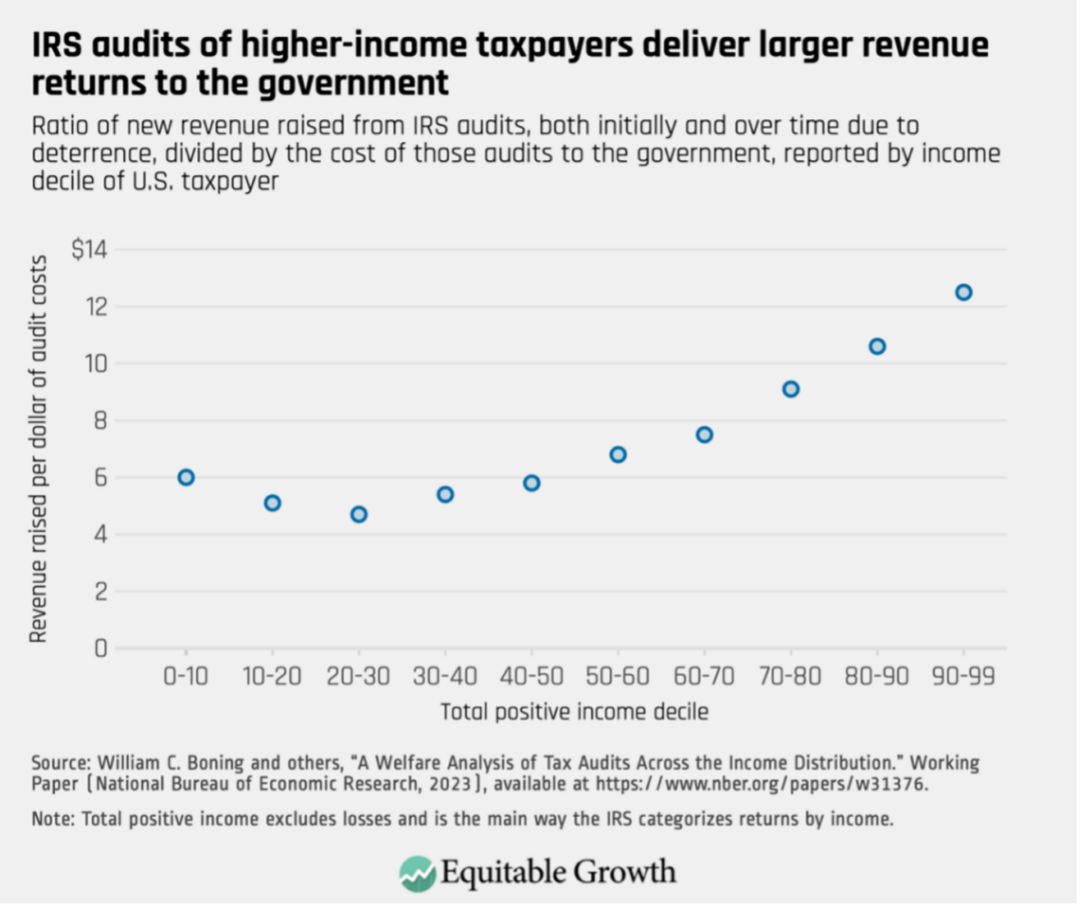
Closing the tax gap by investing in stronger enforcement
Closing the tax gap will require an upfront investment in the tax administration and enforcement activities of the IRS. Rarely does one find an investment opportunity this good. According to one estimate, the return to the government of spending money on audits is at least 6 to 1 and even much higher when those audits are targeted at high-income taxpayers.51 (See Figure 10.)
Figure 10
The Inflation Reduction Act of 2022 included a historic influx of funding for the IRS, putting the agency’s budget more in line with how other tax administrators are funded across the developed world.52 While Congressional Budget Office scorekeepers estimated that the additional $80 billion in IRS funding would pay for itself, plus bring in an additional $115 billion in otherwise-uncollected taxes over 10 years, independent estimates put that figure at $480 billion, with the possibility of many hundreds of billions more should taxpayers increase voluntary compliance in the ways some academics predict.53
Already, there are reports from the IRS that enhanced enforcement is working.54 Unfortunately, some in Congress have made defunding the IRS a major economic policy plank, which already led to a claw-back of $20 billion in tax enforcement outlays, or one-quarter of what had previously been appropriated.55 This is counterproductive and anti-growth—one of the most efficient ways to generate more revenue is to simply collect the taxes that wealthy people and corporations already owe.
Adopt a global minimum tax to prevent profit-shifting by multinational corporations
Until recently, there were limits on how much money the United States could raise from its largest corporations because of the risk that these multinational firms would be able to use sophisticated profit-shifting techniques to avoid domestic tax. But the recent advent of a global minimum tax rate, spearheaded by the OECD and currently agreed to by 140 countries, changes those dynamics.56
Agreeing to this global minimum tax would make the risk of international jurisdiction-shopping and profit-shifting by multinational corporations trying to avoid corporate income taxes lower than ever.57 The United States should wholeheartedly endorse this effort and ensure their own minimum tax regime is in compliance with the international agreement.
These are just two ways that policymakers could prioritize generating additional revenue as part of a pro-growth tax reform agenda. The list of potential revenue raisers is long and varied, and policymakers should prioritize the options that not only generate revenue, but also foster stronger growth through the other two mechanisms that we describe. Raising revenue while also increasing inequality—by, for example, raising taxes on low-income people instead of on high-income people—could dampen or fully offset the pro-growth aspects of higher revenue.
Mechanism #3: Align tax incentives toward productive economic behavior

In addition to reducing the drag of inequality, financing growth-enhancing investments, and reducing fiscal risks, tax policy can and should be designed to directly influence economic behavior in ways that enhance inclusive growth.
Underlying economics
It is well-understood that taxes can affect the choices that economic actors—employers, workers, consumers, corporations—make in their daily lives.58 Taxes are far from the only factor that affects behavior, but, all else being equal, a truly pro-growth tax code would nudge these private parties to take economically beneficial actions and discourage decisions that tend to reduce broad prosperity.
In general, many economists see taxes as distortive of unfettered markets and worry therefore that the costs of imposing a tax will outweigh any benefits. But increasingly, there is a recognition that today’s marketplace is suffering from many other significant distortions that taxes can actually help to rectify. At a very basic level, taxes can be a useful tool to ensure that prices in a market reflect the true societal costs of a given good or service. There is little dispute in the economic literature, for example, that taxes can be used to “internalize” the true price of a good or service that produces a costly negative “externality.”
A tax on cigarettes, for example, isn’t distortive because, without the tax, the price of cigarettes would be too low to reflect the actual costs faced by the consumer and society at large. In the context of damaging climate pollution, an efficiency-enhancing policy could take the form of a tax on carbon emissions. There is broad agreement that when taxes are designed this way, it results in an improvement in market efficiency.
The flip side of this coin is when a market is failing to produce enough of a good or service because of a positive externality. In the context of climate change again, tax subsidies for clean energy production would be an improvement in market efficiency because they would help the market better reflect the true “value” of producing energy in a way that does not contribute to climate change. Without these types of tax interventions, the market for energy is distorted and inefficient, creating a drag on overall growth.
In today’s economy, there is increasing evidence and agreement that excessive concentrations of economic power in the hands of fewer and fewer corporations and wealthy individuals is distorting markets across a range of products and services. There is widespread evidence that many corporations are able to exploit their market positions to set prices above the equilibrium rate in a competitive market.59 In fact, one recent study finds that up to 70 percent of all profits taken by the largest multinational companies reflected not normal market earnings above costs but, in fact, super-normal returns to their excessive market power.60
Similarly, in the labor market, there is evidence that many firms enjoy monopsony power, meaning they can set their purchasing price of labor (wages) below the efficient level.61
There also is evidence that capital markets may not be operating efficiently, with the stock market in particular being defined by volatile speculation rather than acting as a stable source of capital for growing firms. This is why there is some emerging evidence that increasing taxes on capital gains and dividends could actually increase investments—as well as output, wages, and employment—because reducing expected returns on equity can make it cheaper for firms to access financing.62
Relatedly, there is strong economic evidence that corporate executives benefit from bargaining power beyond that which they would have in an efficient marketplace for their services. This results in compensation packages that are far in excess of what the “marginal product” of their labor and contributions would normally reflect.63
These are all examples of broad market failures that could at least partially be addressed by efficiency-enhancing taxes (in addition to antitrust enforcement where appropriate). If, indeed, certain corporate profits are super-normal returns, then a higher corporate income tax on those profits is likely to be efficiency-enhancing rather than distortive. If the salaries and compensation of highly paid executives is not, in fact, a reflection of their fair market value, then higher marginal tax rates on those at the very top of the income and wealth ladders is also less likely to be distortive.
Current state of play
The current U.S. tax code attempts to shape all sorts of behavior, across all manner of markets and economic actors. There are tax incentives for saving for retirement, for building homes, for producing energy. There are tax disincentives for drinking alcohol or smoking cigarettes. The ways that the tax code is used to influence day-to-day economic behavior are too numerous to list here.
We are going to focus on three broad ways that the tax code’s impact on economic behavior could be vastly improved. First, the tax code currently rewards monopolies (and their executives), instead of disincentivizing monopolistic behaviors. Second, the tax code is littered with incentives for specific behaviors that introduce unneeded complexity, tend to be regressive, and fail to deliver on their promised behavioral impacts. And third, this complexity in the tax code, as well as artificial distinctions between capital and labor income, produce expensive and wasteful tax planning opportunities.
Over the past several decades, changes to federal tax policy have increased the rewards for corporations and wealthy individuals when they exert distortive power in marketplaces, instead of disincentivizing monopolistic behaviors. Quite often, advocates of tax changes—such as lower corporate tax rates, new tax deductions specifically for business income, lower capital tax rates, and lower top rates on ordinary incomes—argue that these changes will incentivize better economic behavior and improve economic outcomes. But upon enactment, research frequently finds no evidence for these promised benefits, an indication that these firms are not operating in truly competitive environments.64
Consider, for example, the 2003 dividend rate cut for C-corporations. Proponents of this policy claimed that it would increase the capital stock and boost productivity, wages, and employment since shareholders would effectively get a higher return on their investments. But a rigorous analysis of that rate cut finds that C-corporations did not increase employee compensation or investments.65
Similarly, a recent analysis of the aforementioned pass-through business income deduction, which reduced certain taxable business income by 20 percent, had no effect on output, employment, or wages.66 There also was no discernable change in debt-financed investment after a tax break for borrowing was reduced in 2017.67
Other economists have looked more broadly at the corporate income tax, finding that rate reductions have mostly led to stock buybacks, a way of enriching shareholders, rather than new investments.68 In some cases, tax incentives for private spending on tangible and intangible capital—through policies such as accelerated depreciation and deductions for research and development—have been found to increase firms’ investments,69 but they tend to be costly70 and poorly targeted,71 undermining the other two pro-growth mechanisms highlighted in this report.
The bottom line is that, far from delivering economic benefits from productive behavior, most of these types of tax breaks instead had the effect of increasing the incentive for those with outsize market power to protect and expand that power at the expense of more efficient and productive markets. As we mention later in this section, policymakers today have an opportunity to change the way capital and labor income are taxed so as to better combat these pervasive market power problems, thus enhancing competition and efficiency.
Today’s federal tax code is also rife with other—similarly ineffective—tax breaks that could be reformed to improve efficiency. Many are both complicated and regressive, in addition to being ineffective. Take, for example, the mortgage interest deduction, which today is justified by how it incentivizes homeownership (though the actual legislative history is more complicated).72 Academic evidence suggests that the deduction’s poor design means it increases the size and price of the home being purchased, as well as the size of the mortgage (the so-called intensive margin, in economic parlance) but does not actually increase homeownership (the extensive margin). The deduction also delivers a larger benefit for higher-income households.73 This deduction could be reformed to reduce regressivity and improve targeting.
Similarly, economists have found that the open-ended tax exclusion for employer-provided health insurance does little to increase the number of insured Americans but does inefficiently increase the cost of health plans.74 On the savings front, the widely used tax subsidy for retirement savings accounts, such as 401(k)s and IRAs, has been found to not actually induce much additional saving but simply causes taxpayers to shift savings from taxable to tax-preferred accounts.75 Our point is not that it is necessarily problematic to save for retirement in tax-preferred accounts, but that it is relevant what the government’s goal is in creating this incentive in the first place. Total savings, which is thought to ultimately spur investment and growth, includes both private and public savings, so increasing government debt to spur private savings—via, say, a deficit-financed tax cut—is self-defeating.
Looking at labor supply, reducing marginal and effective tax rates on labor income for those at the top has not resulted in increased employment.76 In fact, economists have found that the top marginal rate could get as high as 83 percent before having detrimental effects.77 In addition, empirical research on cross-state migration has shown that high-income households are quite insensitive to tax rates. Tax flight, or migration from high-tax jurisdictions to low-tax ones, is largely a myth.78 On the other hand, the Earned Income Tax Credit, a federal subsidy for low-wage workers, does seem to increase employment and work hours.79
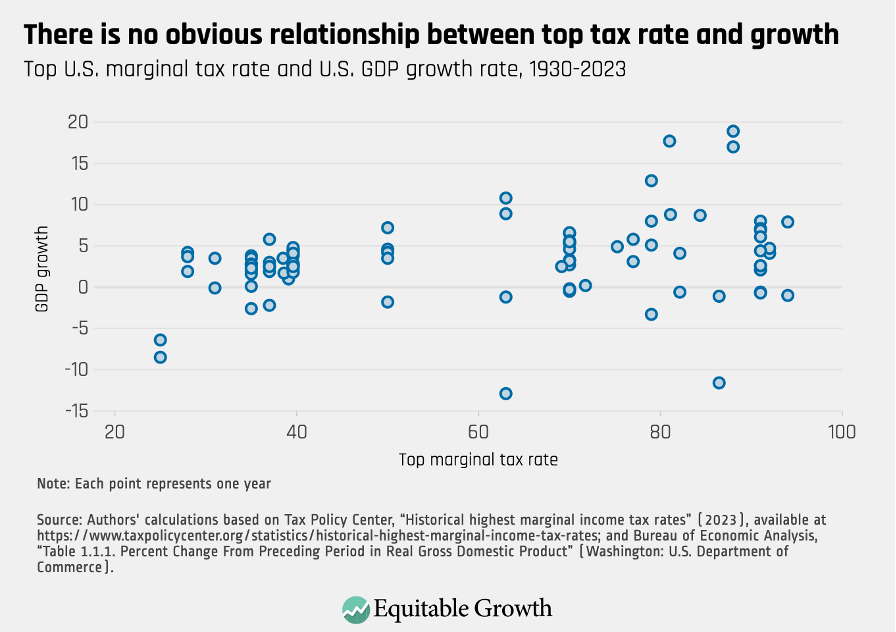
These three findings—that taxes are not as effective as originally thought for encouraging investment, savings, and work—help explain why regressive tax cuts have not led to the economic growth that trickle-down proponents claim.80 (See Figures 11 and 12.)
Figure 11
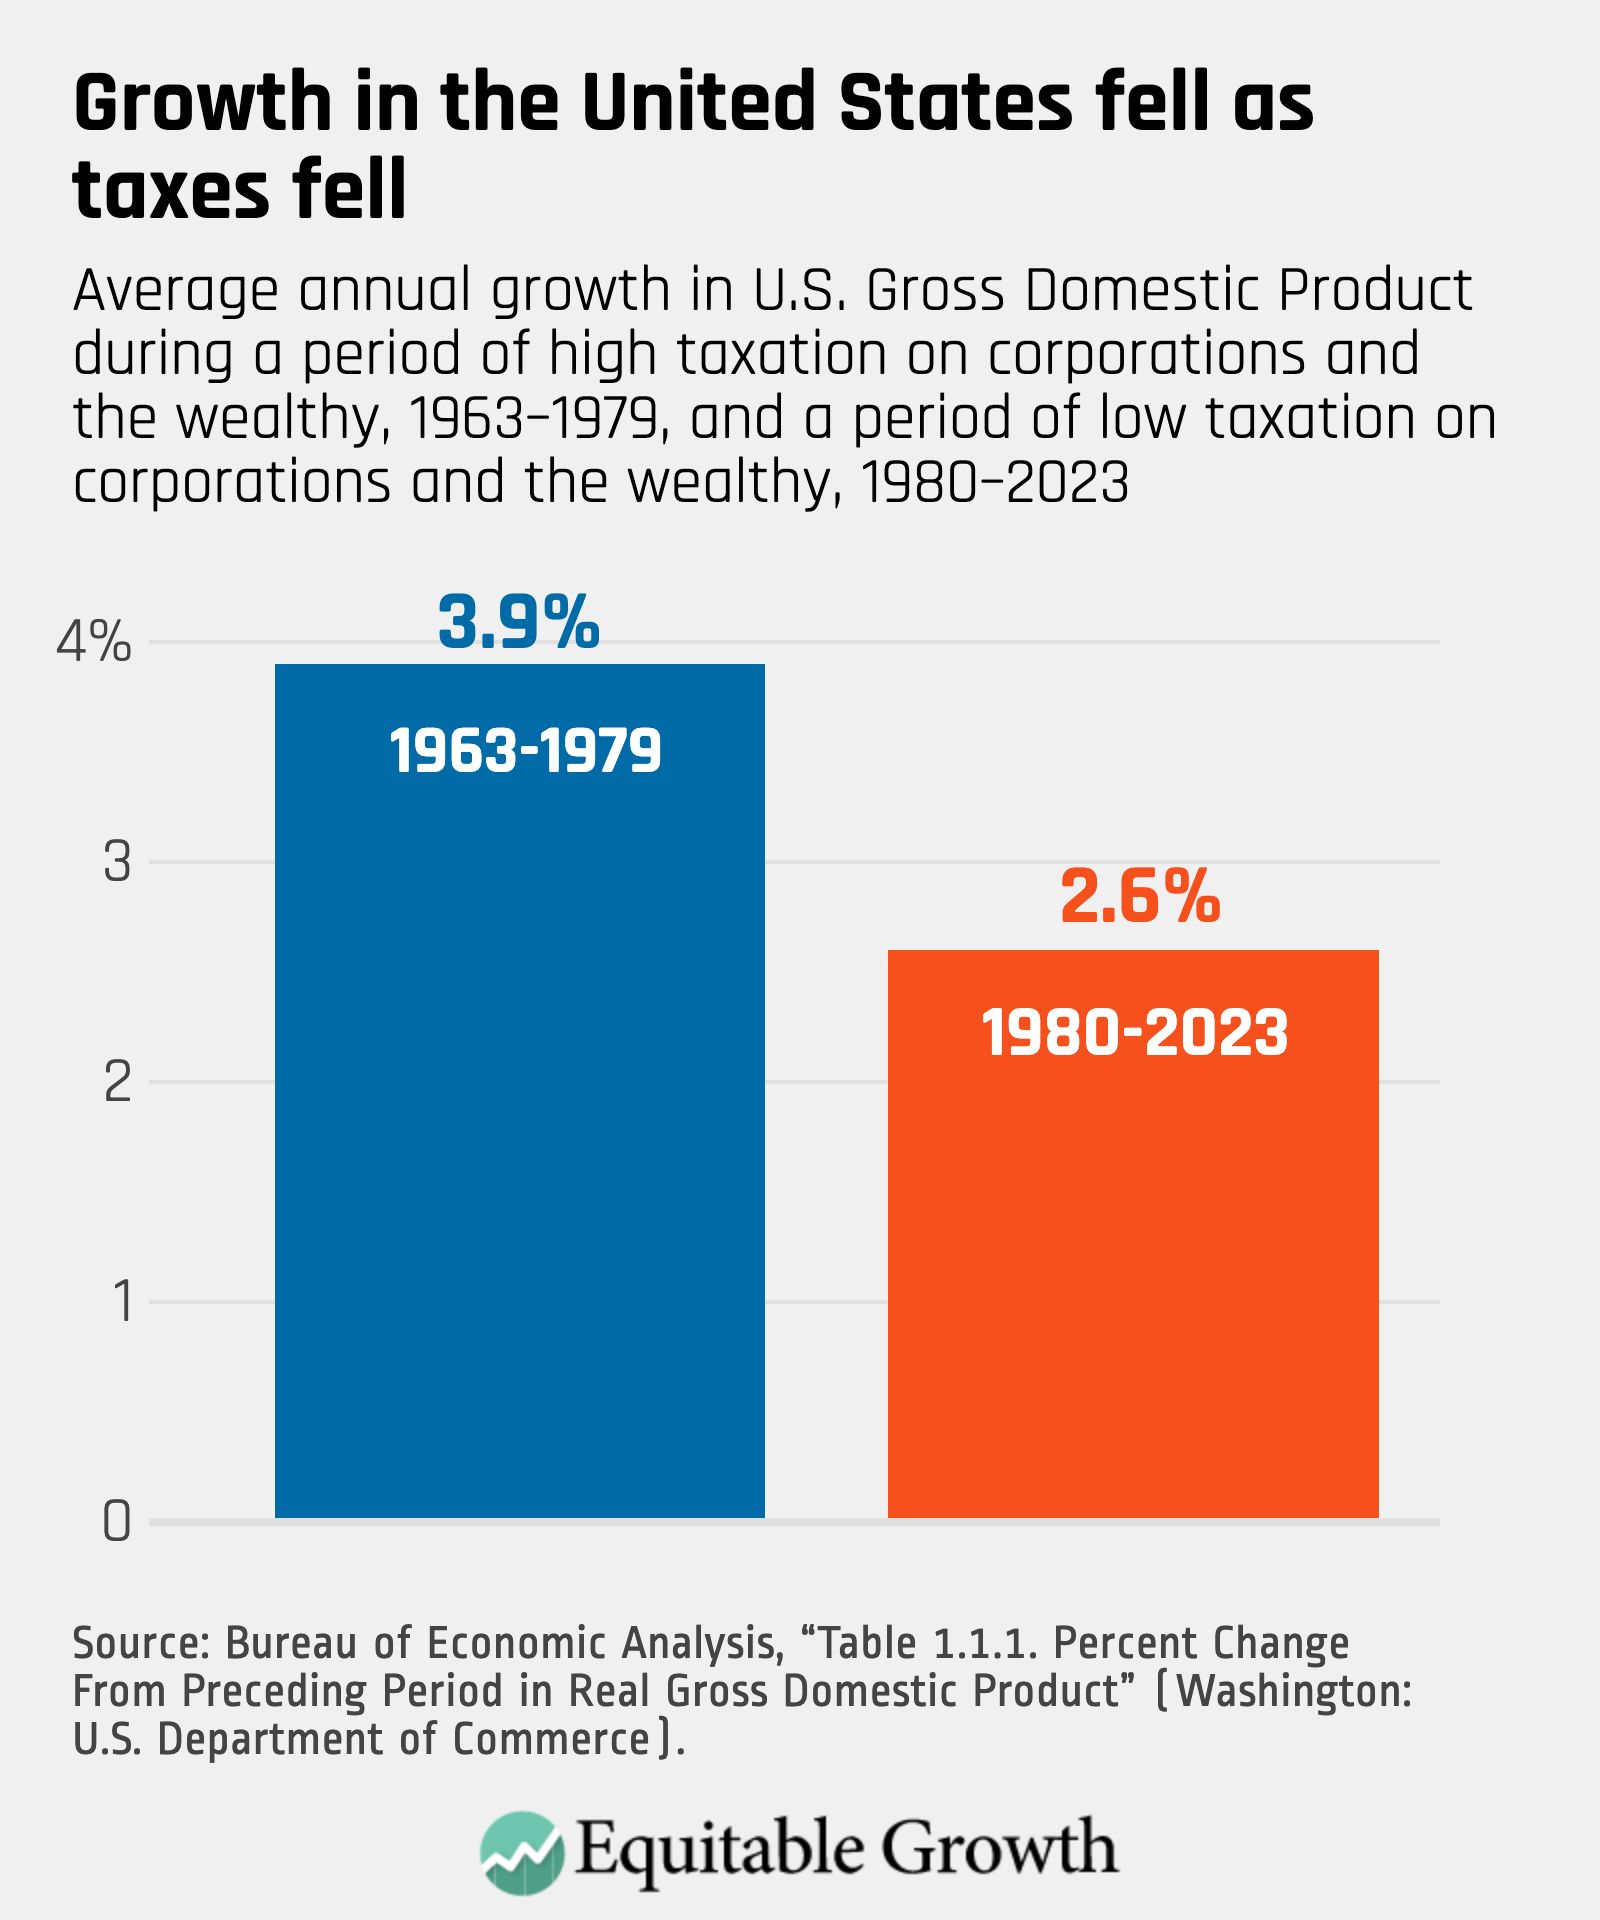
Figure 12
The tax code also could induce more efficient behavior by simply being easier to navigate and harder to game, reducing wasteful tax planning and ensuring a level competitive playing field. Unfortunately, the tax code has been moving in the opposite direction by, for example, increasing the tax preferences for capital income over labor income, leading many business owners to attempt to mischaracterize labor income as capital income.
Providing taxpayers with avoidance opportunities not only reduces revenue but also has negative real-world consequences in the economy. For instance, scholars find that giving multinational corporations more flexibility to determine their forms of organization at home and abroad, alongside the ability to repatriate profits tax-free in the late 1990s and early 2000s, cost millions of U.S. jobs and billions of dollars in lost wages.81
Illustrative policy prescriptions
Eliminating or reforming the incentives that don’t work, replacing them with those that do, and simplifying the tax code in the process can help make U.S. tax policy—and the U.S. economy overall—more efficient. Let’s look at three ways policymakers could achieve this objective.
Increase tax rates on “super-normal” returns
Right now, the tax code rewards excessive market power with low tax rates on unearned profits. Instead, the code could disincentivize corporate concentration and the wielding of market power by raising those taxes. On the corporate side, one way to do this is by simply raising the corporate tax rate or via a graduated corporate income tax that applies higher tax rates on larger companies.82 On the individual side, a similar policy would increase taxes on excessive CEO pay, perhaps simply by creating a new top personal income tax bracket, or reduce corporate deductibility for CEO pay above a certain level.
Reduce tax subsidies for dirty energy and retain them for green technology
Reducing the many incentives in the tax code for investment in gas and oil exploration would help better account for the high social cost of fossil fuels. These could be replaced with enhanced incentives for clean energy production. It is too early to say whether the green energy tax credits in the Inflation Reduction Act will prove decisive in the U.S. battle against climate change, but early economic modeling shows that IRA-type tax policies can be effective, efficient, and pro-growth.83
Reduce incentives for tax avoidance
Harmonizing the tax treatment of all types of capital and labor income and disallowing infinite deferral of “unrealized” income can redirect billions of dollars of wasteful tax planning efforts toward more economically productive ends. This will also ensure that the best ideas and firms, whether they are capital-intensive or labor-intensive, rise to the top—rather than allowing the tax code to create inefficient distortions.
These three sets of tax policy reforms would align tax incentives toward productive economic behavior. Thanks to economic research, policymakers now know that a slight reduction in the cost of private capital due to an investment tax break or a slight increase in a CEO’s take-home pay due to a reduced top marginal tax rate on personal income, is far from sufficient to create the technological breakthroughs that improve productivity, drive wage growth, and increase living standards. Instead, policymakers should replace these poorly designed tax benefits with ones that target well-defined economic problems, such as outsized corporate power, and economic opportunities, such as mitigating climate change.
Conclusion

The next president and the incoming 119th Congress will have a rare opportunity in 2025 to enact true pro-growth tax reform. But to do so, policymakers will have to turn the page on discredited trickle-down theory and instead follow more recent empirical evidence. That evidence identifies three main mechanisms through which the tax code can deliver strong, stable, and broad-based economic growth:
- Reducing inequality, which acts as a drag on growth
- Raising substantial revenue that can be used to both invest in high-return public projects and reduce fiscal risk
- Incentivizing procompetitive and pro-social economic behavior that achieves true efficiency
These three channels are largely complementary. Reducing inequality by raising taxes on corporations, for example, also has the potential to raise large amounts of revenue and diminish firms’ incentive to engage in monopolistic and unproductive rent-seeking. Indeed, many of the policies listed above can be especially effective at spurring growth because they work through multiple channels simultaneously. Rarely do policymakers have the chance to achieve this type of win-win. Congress would be wise not to waste the opportunity.
About the authors
Michael Linden is a senior policy fellow at the Washington Center for Equitable Growth. David S. Mitchell is a senior fellow for tax and regulatory policy at Equitable Growth. Shayna Strom is president and CEO of Equitable Growth.
Acknowledgements
We would like to thank Equitable Growth’s former writer and researcher, Shaun Harrison, for research assistance on this report. We are also grateful to Chiara Chanoi for helping build the figures in this report; Janelle Jones for invaluable comments on an earlier draft; and Ed Paisley and Emilie Openchowski for editing this report. Of course, any and all remaining errors are entirely the authors’ own.
End Notes
1. For more on the methodological challenges and controversies, see Austin Clemens, “New research doesn’t overturn consensus on rising U.S. income inequality” (Washington: Washington Center for Equitable Growth, 2024), available at https://equitablegrowth.org/new-research-doesnt-overturn-consensus-on-rising-u-s-income-inequality/.
2. Heather Boushey, Unbound: How inequality constricts our economy and what we can do about it (Cambridge, MA: Harvard University Press, 2019).
3. Hiba Haroon and Shaun Harrison, “U.S. economic mobility trends and outcomes” (Washington: Washington Center for Equitable Growth, 2024), available at https://equitablegrowth.org/research-paper/u-s-economic-mobility-trends-and-outcomes-a-research-update/.
4. Raj Chetty and others, “The Fading American Dream: Trends in Absolute Income Mobility Since 1940,” Science 356 (2017): 398–406.
5. Alan B. Krueger, “The Rise and Consequences of Inequality in the United States,” prepared remarks at the Center for American Progress, Washington, DC, January 12, 2012, available at https://obamawhitehouse.archives.gov/sites/default/files/krueger_cap_speech_final_remarks.pdf.
6. Shayna Strom, Testimony before the Senate Budget Committee, hearing on “Reducing Inequality, Fueling Growth: How Public Investment Promotes Prosperity for All,” September 20, 2023, available at https://equitablegrowth.org/testimony-by-shayna-strom-before-the-senate-budget-committee/.
7. Vijay Govindarajan, Anup Srivastava, and Chandrani Chatterjee, “Why are companies sitting on cash right now?,” Harvard Business Review, February 5, 2024, available at https://hbr.org/2024/02/why-are-companies-sitting-on-cash-right-now.
8. Laura Alexander, “New research suggests connections between market concentration and the exercise of political power in the United States” (Washington: Washington Center for Equitable Growth, 2023), available at https://equitablegrowth.org/new-research-suggests-connections-between-market-concentration-and-the-exercise-of-political-power-in-the-united-states/.
9. Anna Sokolova and Todd Sorenson, “Monopsony in Labor Markets: A Meta-Analysis” (Washington: Washington Center for Equitable Growth, 2020), available https://equitablegrowth.org/working-papers/monopsony-in-labor-markets-a-meta-analysis/.
10. Strom, Testimony before the Senate Budget Committee.
11. Ibid.
12. Chetty and others, “The Fading American Dream: Trends in Absolute Income Mobility Since 1940.”
13. Austin Clemens, “U.S. income and wealth inequality are no longer increasing, but a return to the equitable levels of the mid-20th century isn’t likely anytime soon” (Washington: Washington Center for Equitable Growth, 2023), available at https://equitablegrowth.org/u-s-income-and-wealth-inequality-are-no-longer-increasing-but-a-return-to-the-equitable-levels-of-the-mid-20th-century-isnt-likely-anytime-soon/.
14. See, for example, Kreg Steven Brown, “Examining the history of the U.S. racial wealth divide shows stagnating progress on closing these disparities” (Washington: Washington Center for Equitable Growth, 2023), available at https://equitablegrowth.org/examining-the-history-of-the-u-s-racial-wealth-divide-shows-stagnating-progress-on-closing-these-disparities/.
15. David Leonhardt, “The Rich Really Do Pay Lower Taxes Than You,” New York Times, October 6, 2019, available at https://www.nytimes.com/interactive/2019/10/06/opinion/income-tax-rate-wealthy.html.
16. Thomas Piketty and Emmanuel Saez, “How Progressive is the U.S. Federal Tax System? A Historical and International Perspective,” Journal of Economic Perspectives 21 (1) (2007): 3–24, available at https://www.aeaweb.org/articles?id=10.1257/jep.21.1.3; but see David Splinter, “U.S. Tax Progressivity and Redistribution,” National Tax Journal 73 (4) (2020): 1005–1024, available at https://www.davidsplinter.com/Splinter-TaxProgressivity-NTJ.pdf.
17. Emmanuel Saez and Gabriel Zucman, “Distributional tax analysis in theory and practice: Harberger meets Diamond-Mirrlees.” Working Paper No. w31912 (National Bureau of Economic Research, 2023), available at https://www.nber.org/papers/w31912.
18. Michael Linden, “The Federal Tax Code and Income Inequality” (Washington: Center for American Progress, 2012), available at https://www.americanprogress.org/article/the-federal-tax-code-and-income-inequality/.
19. Congressional Budget Office, “The Distribution of Household Income, 2019” (2022), available at https://www.cbo.gov/system/files/2022-11/58353-HouseholdIncome.pdf.
20. Janet Holtzblatt and others, “Taxation of Capital Income Is Not Race Neutral” (Washington: Tax Policy Center, 2023), available at https://taxpolicycenter.org/taxvox/taxation-capital-income-not-race-neutral.
21. Kitty Richards, “Taxes and Rents: The Power of Tax Policy to Shape the Distribution of Pre-Tax Income” (2019), available at https://papers.ssrn.com/sol3/papers.cfm?abstract_id=3330239.
22. William Gale and Samuel Thorpe, “Rethinking the corporate income tax: The role of rent sharing” (Washington: Tax Policy Center, 2022), available at https://taxpolicycenter.org/publications/rethinking-corporate-income-tax-role-rent-sharing.
23. Patrick Kennedy and others, “The Efficiency-Equity Tradeoff of the Corporate Income Tax: Evidence from the Tax Cuts and Jobs Act.” Working Paper (2024), available at https://patrick-kennedy.github.io/files/TCJA_KDLM_2024.pdf; Congressional Research Service, “Corporate tax reform: issues for Congress” (2021), available at https://crsreports.congress.gov/product/pdf/RL/RL34229/33; Juan Carlos Suarez Serrato, “Targeting business tax incentives to realize U.S. wage growth” (Washington: Washington Center for Equitable Growth, 2021), available at https://equitablegrowth.org/targeting-business-tax-incentives-to-realize-u-s-wage-growth/; Juan Carlos Suarez Serrato and Owen Zidar, “Who Benefits from State Corporate Tax Cuts? A Local Labor Market Approach with Heterogeneous Firms: Further Results” American Economic Association Papers and Proceedings (2024), available at https://zidar.princeton.edu/publications/who-benefits-state-corporate-tax-cuts-local-labor-market-approach-heterogeneous-firms; Jeremie Greer and others, “Who Benefits and Who Pays: How Corporate Tax Breaks Drive Inequality” (Washington: Liberation in a Generation & Institute for Taxation and Economic Policy, 2024), available at https://www.liberationinageneration.org/wp-content/uploads/2024/06/Who-Benefits-Who-Pays-Corp-Taxes-FINAL.pdf.
24. Rosanne Altshuler, Lysle Boller, and Juan Carlos Suárez Serrato, “Tax Planning and Multinational Behavior” (2023), available at https://www.irs.gov/pub/irs-soi/24rptaxplanningmultinationalbehavior.pdf; Thomas Torslov and others, “The Missing Profits of Nations,” Review of Economic Studies 0 (2022): 1–36, available at https://gabriel-zucman.eu/files/TWZ2022Restud.pdf; Navodhya Samarakoon, “The Effect of the Closure of the Double Irish Arrangement on the Location of U.S. Multinational Companies’ Profits” (2023), available at https://papers.ssrn.com/sol3/papers.cfm?abstract_id=4285001.
25. David Mitchell, “2017 tax cut for pass-through business owners exacerbated inequality and failed to deliver economic benefits” (Washington: Washington Center for Equitable Growth, 2024), available at https://equitablegrowth.org/2017-tax-cut-for-pass-through-business-owners-exacerbated-inequality-and-failed-to-deliver-economic-benefits/.
26. Tax Policy Center, “Historical highest marginal income tax rates” (2023), available at https://www.taxpolicycenter.org/statistics/historical-highest-marginal-income-tax-rates.
27. Congressional Budget Office, “The macroeconomic and budgetary effects of federal investment” (2016), available at https://www.cbo.gov/publication/51628.
28. David C. Mowery, “Federal policy and the development of semiconductors, computer hardware, and computer software: a policy model for climate change R&D?” In Rebecca M. Henderson and Richard G. Newell, eds., Accelerating Energy Innovation: Insights from Multiple Sectors (Chicago: University of Chicago Press, 2011), pp. 159–188, available at https://www.nber.org/system/files/chapters/c11753/c11753.pdf.
29. Shawn Kantor and Alexander T. Whalley, “Moonshot: Public R&D and growth.” Working Paper No. w31471 (National Bureau of Economic Research, 2023), available at https://www.nber.org/papers/w31471.
30. Aaron Kesselheim, “Improving competition to lower U.S. prescription drug costs” (Washington: Washington Center for Equitable Growth, 2020), available at https://equitablegrowth.org/improving-competition-to-lower-u-s-prescription-drug-costs/.
31. Congressional Budget Office, “Effects of Physical Infrastructure Spending on the Economy and the Budget Under Two Illustrative Scenarios” (2021), available at https://www.cbo.gov/publication/57327; Michelle Holder and Shaun Harrison, ”Why the Infrastructure Investment and Jobs Act is good economics” (Washington: Washington Center for Equitable Growth, 2022), available at https://equitablegrowth.org/why-the-infrastructure-investment-and-jobs-act-is-good-economics/.
32. Congressional Budget Office, “The Budget and Economic Outlook: 2022 to 2032” (2022), Box 2.2 Economic Effects of the Infrastructure Investment and Jobs Act, available at https://www.cbo.gov/publication/58147#_idTextAnchor059; Mark Zandi and Bernard Yaros, “Macroeconomic consequences of the Infrastructure Investment and Jobs Act & Build Back Better framework” (New York: Moody’s Analytics, 2021), available at https://www.moodys.com/web/en/us/insights/resources/macroeconomic-consequences-of-the-infrastructure-investment-and-jobs-act-and-build-back-better-framework.pdf.
33. Anna Aizer, Hilary Hoynes, and Adriana Lleras-Muney, “Budget analyses of U.S. income support programs must incorporate long-term benefits for children” (Washington: Washington Center for Equitable Growth, 2022), available https://equitablegrowth.org/budget-analyses-of-u-s-income-support-programs-must-incorporate-long-term-benefits-for-children/.
34. Elizabeth Jacobs and Liz Hipple, “Are today’s inequalities limiting tomorrow’s opportunities?” (Washington: Washington Center for Equitable Growth, 2018), available at https://equitablegrowth.org/research-paper/are-todays-inequalities-limiting-tomorrows-opportunities/.
35. Ibid.
36. Alix Gould-Werth, “How to stop a recession by strengthening income supports in the United States” (Washington: Washington Center for Equitable Growth, 2022), available https://equitablegrowth.org/how-to-stop-a-recession-by-strengthening-income-supports-in-the-united-states/.
37. Elaine Maag and others, “The return on investing in children: Helping children thrive” (Washington: Urban Institute, 2023), available at https://www.urban.org/sites/default/files/2023-09/The%20Return%20on%20Investing%20in%20Children.pdf.
38. Michael Linden, Testimony before the Joint Economic Committee, hearing on “The Fiscal Situation of the United States,” March 12, 2024, available at https://equitablegrowth.org/testimony-by-michael-linden-before-the-joint-economic-committee/.
39. Peter G. Peterson Foundation, “The rising national debt drives up long-term interest rates” (2022), available at https://www.pgpf.org/blog/2022/12/the-rising-national-debt-drives-up-interest-rates.
40. Economic Policy Institute, “International comparisons” (n.d.), available at https://www.epi.org/explorer/international.
41. Organisation for Economic Co-operation and Development, “OECD Family Database: Chart PF1.1.A. Public spending on family benefits” (n.d.), available at https://www.oecd.org/en/data/datasets/oecd-family-database.html.
42. Organisation for Economic Co-operation and Development, “OECD Family Database: Chart PF3.1 Public spending on childcare and early education” (n.d.), available at https://www.oecd.org/en/data/datasets/oecd-family-database.html.
43. Statista, “Government revenue of G7 countries as share of GDP from 2010 to 2023, by country” (2023), available https://www.statista.com/statistics/1370940/g7-government-revenue-share-gdp/.
44. Congressional Budget Office, “An Update to the Budget and Economic Outlook: 2024 to 2034” (2024), Figure 1, available at https://www.cbo.gov/publication/60039.
45. Authors’ calculations based on Gross Domestic Product in 2023 of $27.36 trillion. See Bureau of Economic Analysis, “Gross Domestic Product (Third Estimate), Corporate Profits, and GDP by Industry, Fourth Quarter and Year 2023” (2024), Table 3. Gross Domestic Product: Level and Change from Preceding Period, available at https://www.bea.gov/sites/default/files/2024-03/gdp4q23-3rd.pdf.
46. Internal Revenue Service, “Tax gap projections for tax years” (2023), available at https://www.irs.gov/pub/irs-pdf/p5869.pdf.
47. U.S. Office of Management and Budget and Federal Reserve Bank of St. Louis, “Federal Outlays: Interest as Percent of Gross Domestic Product [FYOIGDA188S]” (retrieved September 18, 2024), available at https://fred.stlouisfed.org/series/FYOIGDA188S.
48. Peter G. Peterson Foundation, “What is the national debt costing us?” (2024), available at https://www.pgpf.org/blog/2024/08/what-is-the-national-debt-costing-us.
49. U.S. Department of the Treasury, “Revenue Proposals” (2024), available at https://home.treasury.gov/policy-issues/tax-policy/revenue-proposals.
50. Ole Agersnap and Owen Zidar, “The Tax Elasticity of Capital Gains and Revenue-Maximizing Rates,” American Economic Review: Insights (2021), available at https://zidar.princeton.edu/publications/tax-elasticity-capital-gains-and-revenue-maximizing-rates.
51. William C. Boning and others, “A Welfare Analysis of Tax Audits Across the Income Distribution.” Working Paper w31376 (National Bureau of Economic Research, 2023), available at https://www.nber.org/papers/w31376.
52. Organisation for Economic Co-operation and Development, “Comparative Information on OECD and Other Advanced and Emerging Economies” (2023), available https://www.oecd-ilibrary.org/taxation/tax-administration-2023_900b6382-en.
53. Natasha Sarin and Mark J. Mazur, “The Inflation Reduction Act’s Impact on Tax Compliance—and Fiscal Sustainability” (2023), available at https://papers.ssrn.com/sol3/papers.cfm?abstract_id=4449161.
54. Internal Revenue Service, “IRS tops $1 billion in past-due taxes collected from millionaires; compliance efforts continue involving high-wealth groups, corporations, partnerships,” Press release, July 11, 2024, available at https://www.irs.gov/newsroom/irs-tops-1-billion-in-past-due-taxes-collected-from-millionaires-compliance-efforts-continue-involving-high-wealth-groups-corporations-partnerships.
55. Martha Waggoner, “Latest federal budget includes $20 billion rescission for IRS,” Journal of Accountancy, March 26, 2024, available at https://www.journalofaccountancy.com/news/2024/mar/latest-federal-budget-includes-20-billion-rescission-for-irs.html.
56. Organisation for Economic Co-operation and Development, “Global Minimum Tax” (n.d.), available at https://www.oecd.org/en/topics/sub-issues/global-minimum-tax.html.
57. Organisation for Economic Co-operation and Development, “New OECD data highlight stabilisation in statutory corporate tax rates worldwide,” Press release, July 11, 2024, available at https://www.oecd.org/en/about/news/press-releases/2024/07/new-oecd-data-highlight-stabilisation-in-statutory-corporate-tax-rates-worldwide.html.
58. Jialu Streeter, “How do tax polices affect individuals and businesses?” (Stanford, CA: Stanford Institute for Economic Policy Research, 2022), available at https://siepr.stanford.edu/publications/policy-brief/how-do-tax-policies-affect-individuals-and-businesses.
59. Jonathan Baker, “Market power in the U.S. economy today” (Washington: Washington Center for Equitable Growth, 2017), available at https://equitablegrowth.org/market-power-in-the-u-s-economy-today/.
60. Sebastian Beer and others, “Exploring Residual Profit Allocation,” American Economic Journal 15 (1) (2023): 70–109, available at https://www.aeaweb.org/articles?id=10.1257/pol.20200212.
61. Carmen Sanchez-Cumming, “A primer on monopsony power: Its causes, consequences, and implications for U.S. workers and economic growth” (Washington: Washington Center for Equitable Growth, 2022), available at https://equitablegrowth.org/a-primer-on-monopsony-power-its-causes-consequences-and-implications-for-u-s-workers-and-economic-growth/.
62. Ignacio González, Juan Montecino, and Vasudeva Ramaswamy, “Assessing the effects of a dividend and capital gains tax increase” (Washington: American University Institute for Macroeconomic & Policy Analysis, 2024), available at https://impa.american.edu/assessing-the-effects-of-a-dividend-and-capital-gains-tax-increase/; Lidia Brun and others, “Corporate Taxation and Market Power Wealth” (2023), available at https://papers.ssrn.com/sol3/papers.cfm?abstract_id=4410717; Pau Belda, “Capital Gains Taxation, Learning and Bubbles” (n.d.), available at https://pau-belda.eu/wp-content/uploads/JMP.pdf.
63. Thomas Piketty, Emmanuel Saez and Stefanie Stantcheva, “Optimal taxation of top labor incomes: A tale of three elasticities,” American Economic Journal: Economic Policy 6 (1) (2014): 230–271, available at https://www.aeaweb.org/articles?id=10.1257/pol.6.1.230.
64. William G. Gale and Claire Haldeman, “The Tax Cuts and Jobs Act: Searching for supply-side effects” (Washington: Brookings Institution, 2021), available at https://www.brookings.edu/wp-content/uploads/2021/07/20210628_TPC_GaleHaldeman_TCJASupplySideEffectsReport_FINAL.pdf.
65. Danny Yagan, “Capital tax reform and the real economy: The effects of the 2003 dividend tax cut,” American Economic Review 105 (12) (2015): 3531–3563, available at https://eml.berkeley.edu/~yagan/DividendTax.pdf.
66. Lucas Goodman and others, “How Do Business Owners Respond to a Tax Cut? Examining the 199A Deduction for Pass-through Firms.” Working Paper (National Bureau of Economic Research, 2024), available at https://www.nber.org/papers/w28680.
67. David Mitchell, “New evidence shows that limiting a tax break for highly leveraged firms doesn’t hurt the U.S. economy” (Washington: Washington Center for Equitable Growth, 2023), available at https://equitablegrowth.org/new-evidence-shows-that-limiting-a-tax-break-for-highly-leveraged-firms-doesnt-hurt-the-u-s-economy/.
68. Juin-Jen Chang and others, “Share buybacks and corporate tax cuts,” Journal of Economic Dynamics and Control 151 (2023), available at https://www.sciencedirect.com/science/article/abs/pii/S0165188923000283; Kimberly A. Clausing, “Who Pays the Corporate Tax in a Global Economy,” National Tax Journal 66 (2013): 151–184.
69. Gabriel Chodorow-Reich and others, “Tax Policy and Investment in a Global Economy.” Working Paper (National Bureau of Economic Research, 2024), available at https://www.nber.org/papers/w32180. But see Rakeen Mabud and others, “New economic analyses of the 2017 Trump tax cuts find mixed effects that policymakers should consider when those tax cuts expire in 2025” (Washington: Washington Center for Equitable Growth), available at https://equitablegrowth.org/new-economic-analyses-of-the-2017-trump-tax-cuts-find-mixed-effects-that-policymakers-should-consider-when-those-tax-cuts-expire-in-2025/.
70. Gene Steuerle, “Some Ignored Costs of Bonus Depreciation,” Tax Notes, March 3, 2008, available at https://www.urban.org/sites/default/files/publication/31136/1001150-Some-Ignored-Costs-of-Bonus-Depreciation.PDF.
71. Lily Batchelder, “Accounting for Behavioral Considerations in Business Tax Reform: The Case of Expensing” (2017), available at https://papers.ssrn.com/sol3/papers.cfm?abstract_id=2904885; Steve Wamhoff and Richard Phillips, “The Failure of Expensing and Other Depreciation Tax Breaks” (Washington: Institute on Taxation and Economic Policy, 2018), available at https://itep.org/the-failure-of-expensing-and-other-depreciation-tax-breaks/.
72. Roger Lowenstein, “Who needs the mortgage-interest deduction?,” The New York Times, March 5, 2006, available at https://www.nytimes.com/2006/03/05/magazine/who-needs-the-mortgageinterest-deduction.html.
73. Jonathan Gruber, Amalie Jensen, and Henrik Kleven, “Do people respond to the mortgage interest deduction? Quasi-experimental evidence from Denmark.” Working Paper No. w23600 (National Bureau of Economic Research, 2017), available at https://www.nber.org/papers/w23600.
74. Center on Budget and Policy Priorities, “Health policy experts’ statement about excise tax on high-cost plans” (2015), available at https://www.cbpp.org/cadillac-tax-letter.
75. Raj Chetty and others, “Active vs. Passive Decisions and Crowdout in Retirement Savings Accounts: Evidence from Denmark.” Working Paper 18565 (National Bureau of Economic Research, 2012), available at https://www.nber.org/system/files/working_papers/w18565/w18565.pdf. These accounts also are often abused by the wealthy; see, for example, David S. Mitchell, “Retirement tax incentives supercharge the fortunes of wealthy Americans” (Washington: Washington Center for Equitable Growth, 2022), available at https://equitablegrowth.org/retirement-tax-incentives-supercharge-the-fortunes-of-wealthy-americans/.
76. Emmanuel Saez, Joel Slemrod, and Seth Giertz, ”The elasticity of taxable income with respect to marginal tax rates: A critical review,” Journal of Economic Literature 50 (1) (2012): 3–50, available at https://eml.berkeley.edu/~saez/saez-slemrod-giertzJEL12.pdf.
77. Piketty, Saez, and Stantcheva, “Optimal taxation of top labor incomes: A tale of three elasticities.”
78. Cristobal Young and Ithai Lurie, “Taxing the rich: The effect of tax reform and the COVID-19 pandemic on tax flight among U.S. millionaires” (Washington: Washington Center for Equitable Growth, 2022), available at https://equitablegrowth.org/taxing-the-rich-the-effect-of-tax-reform-and-the-covid-19-pandemic-on-tax-flight-among-u-s-millionaires/.
79. Nada Eissa and Jeffery Liebman, “Labor supply response to the earned income tax credit,” The Quarterly Journal of Economics 111 (2) (1996): 605–637, available at https://www.jstor.org/stable/2946689.
80. Corey Husak, “The relationship between taxation and U.S. economic growth” (Washington: Washington Center for Equitable Growth, 2021), available at https://equitablegrowth.org/the-relationship-between-taxation-and-u-s-economic-growth/; Emmanuel Saez, Joel Slemrod, and Seth Giertz, “The elasticity of taxable income with respect to marginal tax rates: A critical review,” Journal of Economic Literature 50 (1) (2012): 3–50, available at https://eml.berkeley.edu/~saez/saez-slemrod-giertzJEL12.pdf; Jane Gravelle and Donald Marples, “Tax Rates and Economic Growth” (Washington: Congressional Research Service, 2014), available at https://sgp.fas.org/crs/misc/R42111.pdf; Chye-Ching Huang and Nathaniel Frentz, “What really is the evidence on taxes and growth?” (Washington: Center on Budget and Policy Priorities, 2014), available at https://www.cbpp.org/research/what-really-is-the-evidence-on-taxes-and-growth.
81. Daniel Garrett and others, “Effects of international tax provisions on domestic labor markets” (Washington: Brookings Institution, 2024), available at https://www.brookings.edu/articles/effects-of-international-tax-provisions-on-domestic-labor-markets/.
82. Kimberly Causing, “Combating market power through a graduated U.S. corporate income tax” (Washington: Washington Center for Equitable Growth, 2024), available at https://equitablegrowth.org/combating-market-power-through-a-graduated-u-s-corporate-income-tax/.
83. John Bistline, Neil Mehrotra, and Catherine Wolfram, “Economic implications of the climate provisions of the inflation reduction act.” Working Paper No. w31267 (National Bureau of Economic Research, 2023), available at https://www.nber.org/papers/w31267.
Related


Explore the Equitable Growth network of experts around the country and get answers to today's most pressing questions!