The intersectional wage divides faced by Asian American, Native Hawaiian, and Pacific Islander women in the United States

Overview
Like other women of color, Asian American, Native Hawaiian, and Pacific Islander women run up against structural barriers that hurt their U.S. labor market outcomes, including disadvantages that are the result of racial discrimination, gender discrimination, and the interaction between the two. Yet there is little research on how the experiences of AANHPI women in the U.S. labor market are filtered through the interplay of race and gender. Indeed, current economic narratives tend to overlook the obstacles this group of workers face in terms of employment, opportunities for career advancement, and earnings.1
In this issue brief, we build on methodology developed when examining the racial-gender differences in the earnings of Black workers by Marlene Kim at the University of Massachusetts Boston, research on the intersectional wage divide faced by Black women by Mark Paul of the New College of Florida, Darrick Hamilton of the New School, and Khaing Zaw and William Darity Jr. of Duke University,2 and on work on the intersectional wage divide faced by Latina women by Kate Bahn and Will McGrew. Using Current Population Survey data by the U.S. Census Bureau over a 7-year period, we estimate the magnitude of, and factors that go into, the wage disparities experienced by AANHPI women by performing a so-called Blinder-Oaxaca wage decomposition—an econometric strategy that allows us to estimate which portion of the wage divide is “explained” and which portion is “unexplained.”
The explained portion in this brief refers to wage disparities that can be attributed to differences between two groups’ mean demographic and so-called human capital characteristics, which provide an approximation of a worker’s predicted productivity. These characteristics include metrics, such as level of educational attainment and occupation, as well as other factors that can explain wage levels, such as geographic location and age.
The unexplained portion in this brief captures the share of the wage divide that cannot be accounted for by differences between two groups’ observed characteristics, which is often interpreted as the closest estimate of outright discrimination and which cannot be otherwise measured with economic data. The unexplained portion of the wage divides presented here, then, may capture the effect of outright discrimination in addition to other unobserved characteristics. For instance, there is evidence that factors such as access to social networks, precise measures of years of work experience, the gendered division of unpaid care work, and English language proficiency—factors not accounted for in our model—also play a role in explaining racial and gender wage divides.
In her 2009 paper “Race and gender differences in the earnings of Black workers,” Kim finds that Black women experience earnings penalties that stem from the interaction of race and gender. Similarly, in their 2018 working paper “Returns in the labor market: A nuanced view of penalties at the intersection of race and gender,” Paul, Zaw, Hamilton, and Darity use an intersectional framework to analyze discriminatory pay disadvantages. They find that Black women do not face a single racial or gender wage penalty. Rather, this team of researchers finds that the unexplained portion of the wage divide between Black women and White men is larger than the sum of the individual racial and gender wage disadvantages.
Referencing the terminology of intersectionality coined by critical race theory scholar Kimberlé Crenshaw, these findings reflect that the interaction of multiple socially salient identities—such as gender and race and ethnicity—construct unique experiences worthy of individual examination. Consistent with the findings by Kim, as well as Paul and his co-authors, we find that AANHPI women’s intersectional wage penalty is greater than the aggregation of the unexplained gender and racial effects.
In addition, per our estimates, more than 160 percent of the wage divide between AANHPI women and White men—a gap of approximately 13 cents on the dollar—is unexplained by the characteristics included in our analysis. As such, if the two groups had the same rates of return on their demographic and productivity-linked characteristics, per our model, then AANHPI women would earn $1.08 for every dollar White men make—in large part due to their relatively higher levels of human capital.
There are also important differences in the magnitude and composition of the wage divides faced by AANHPI women along the lines of national origin or ethnicity and immigration status. In contrast with White men, for example, the higher-than-average hourly wages of Asian American women of Indian and Chinese descent can be fully explained by the observed characteristics included in our analysis. Importantly, some groups of AANHPI women face unexplained wage penalties, and these disadvantages are especially large for Vietnamese and Native Hawaiian and Pacific Islander women. AANHPI women born outside of the United States are also found to experience a substantial wage penalty.
The economic opportunities available to specific demographic groups represent the overall structural barriers of the U.S. labor market. For AANHPI women, as well as for all women workers by demographic characteristics, differences in causes of the gender wage divide between subgroups and over time are relevant to designing policies that will allow for women and their families’ economic security—which, in turn, fosters broadly shared growth across the U.S. economy when workers are not held back from their full potential and can engage fully in economic activity as vibrant consumers.
AANHPI women in the U.S. labor market
The AANHPI community is the fastest-growing racial group in the United States, and the Asian American population is projected to double in size by 2060. These demographic dynamics are often overlooked in U.S. labor market analyses due, in part, to data limitations.3
Drilling down further into the available data, Asian American workers tend to have unemployment rates near those of White workers but experienced a greater increase in joblessness at the onset of the coronavirus recession. Like in the Great Recession of 2007–2009, unemployed Asian American workers are currently more likely to be without a job for long periods of time than unemployed workers of other racial or ethnic groups. Asian American women also exemplify the troubling trend of declining labor force participation among prime-age U.S. workers since the late 1990s, with an especially pronounced drop in participation, alongside a similarly stark decline for Black men.
This drop may have been influenced by occupational segregation—the over- or underrepresentation of a group of workers in certain types of jobs—as well as by family structures. AANHPI women are disproportionately represented in high-risk occupations such as registered nurses while also being more likely to live in multigenerational households. The share of the AANHPI population living in multigenerational households is higher than for other racial or ethnic groups and is also rising. Between 2009 and 2016, the share of the AANHPI population living in multigenerational households climbed from 26 percent to 29 percent.
This unique intersection of circumstances demonstrates the need for an intersectional lens for economics research on AANHPI women, families, and communities that takes into account the interplay of race and gender. (See Table 1.)
Table 1
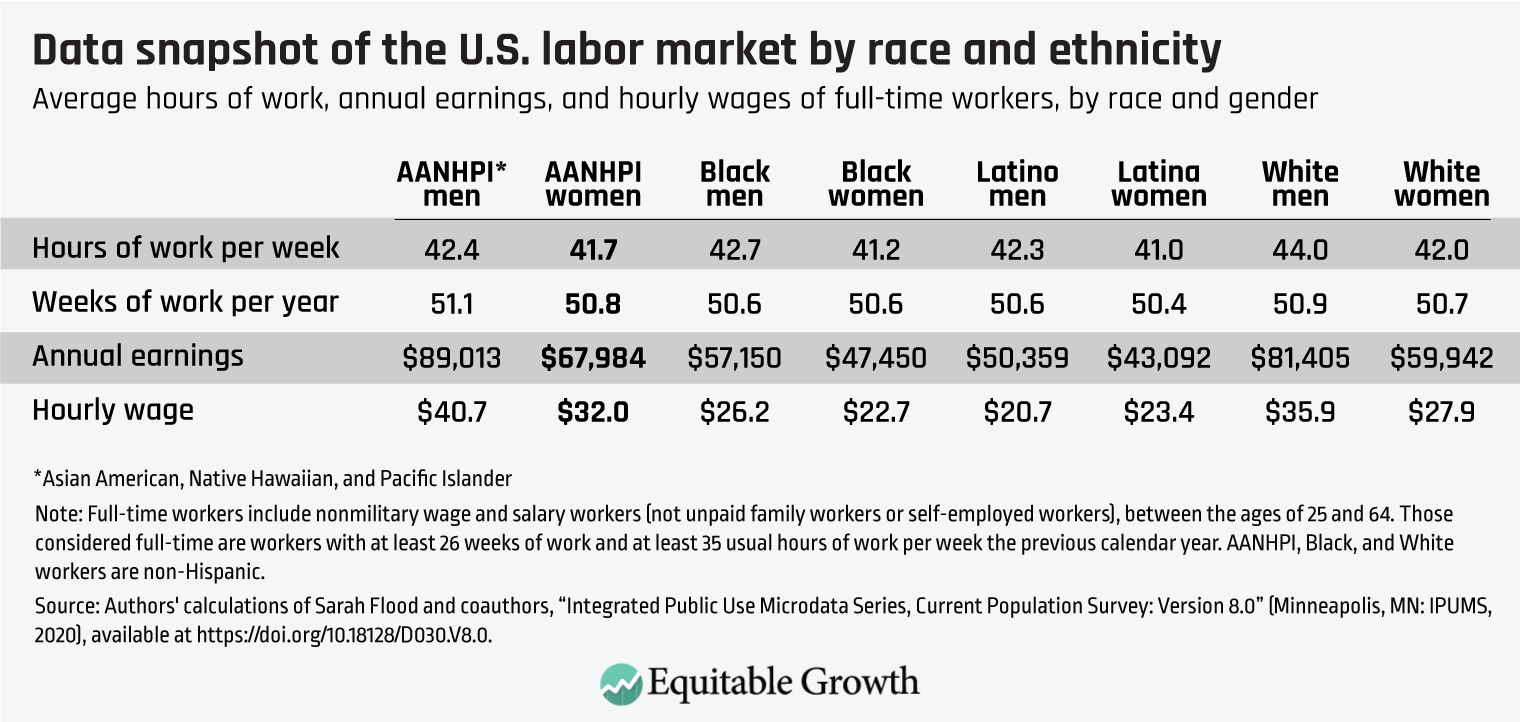
While AANHPI men and women have higher average earnings than men and women of the other major racial and ethnic groups, these aggregate statistics mask important inequities within the AANHPI community. Research by Rakesh Kochhar and Anthony Cilluffo of the Pew Research Center, for example, shows that income is more unequally distributed among the Asian American and Pacific Islander population than among any other major racial or ethnic group, with Asian American and Pacific Islander families in the top 10 percent of the income distribution, earning 10.7 times as much as those in the bottom 10 percent. This disparity is particularly striking given that in 1970, the income divide between these AAPI families near the bottom of the income distribution and those near the top was narrower than for their White, Black, and Latinx peers.
There are also substantial differences in economic outcomes along the lines of national origin and ethnicity. For instance, Asian Indian, Taiwanese, and Filipino households in the United States have annual incomes that are well above the U.S. median, while Bhutanese and Burmese households in the United States have annual incomes that are well below it. In addition, there is substantial occupational sorting across national origin and ethnicity. U.S. workers of Filipino and Thai decent, for example, have a significantly higher representation among front-line workers during the COVID-19 pandemic, compared to other AANHPI groups, as well as White workers. Even among the AANHPI community, more data and research are needed on differences in barriers, opportunities, and outcomes of workers by their national origin and ethnicity.
In the case of AANHPI women specifically, disparities in U.S. labor market outcomes are evident in their overrepresentation in both high- and low-wage occupations. An analysis by the National Women’s Law Center shows, for example, that Asian American and Pacific Islander women make up about 3 percent of the U.S. workforce, yet they represent 4.2 percent of all workers in the highest-paying jobs and 4.3 percent of all workers in the lowest-paying jobs in the U.S. economy. In 2019, more than 1.4 million AAPI women—about 30 percent of all AAPI women workers—held jobs that typically pay less than $15 dollars an hour.
Wage divides faced by AANHPI women
While race and gender represent two distinct social identities, they are not experienced as independent from one another. Rather, as proposed by intersectionality theory, race and gender—along with other socially salient identities such as class, national origin, and sexual orientation—overlap and interact to shape individuals’ social outcomes. In the context of the U.S. labor market, holding multiple socially salient identities affects workers’ earnings, employment opportunities, and overall experiences in a way that is specific and qualitatively different from the sum of the effects of the individual identities.
Applying this framework to our analysis and using a modified version of the model by Kim at University of Massachusetts-Boston and also used by Paul, Zaw, Hamilton, and Darity, in the following sections, we break down the wage divides between AANHPI women and AANHPI men, White women, and White men to understand the racial wage divide facing AANHPI women, the gender wage divide facing AANHPI women, and the intersectional wage divide faced by AANHPI women.
The wage divide between AANHPI women and White women
Some groups of AANHPI women reached or surpassed the earnings of White women in the second half of the 20th century. Research finds, for instance, that Japanese, Chinese, Filipina, Asian Indian, and Korean American women have equal or higher average earnings than White women in the United States at least since the late 1970s.4 The fact that many AANHPI women’s earnings rose relative to both the earnings of White women and the earnings of White men during this time was probably in part the result of their gains in terms of educational attainment, as well as the enactment of legislation that outlawed employment discrimination and removed formal barriers to well-paying technical and professional jobs following the Civil Rights movement.
Yet there are mixed findings on the question of whether AANHPI women currently experience a pay penalty vis-à-vis White women. One set of studies finds that that U.S.-born AANHPI women have higher earnings than similar White women even after accounting for demographic factors and characteristics associated with worker productivity.5 A possible reason behind the advantage, research by Emily Greenman at Penn State University proposes, is that Asian American women are less likely to take time out of the labor force and tend to make smaller reductions in their hours of work after having a child, resulting in fewer breaks in their employment histories and higher earnings over time.
But other studies do not find an earnings advantage. ChangHwan Kim and Yang Zhao of the University of Kansas, for example, find that after accounting for field of study and geographic concentration—characteristics that are usually not accounted for in studies finding a pay premium—Asian American women with a college degree are no longer found to have an earnings advantage over comparable White women. In addition, the authors show that first-generation Asian American women and Asian American women who did not earn their high school degree in the United States continue to have substantially lower earnings than comparable White women.
Importantly, Kim and Zhao also find that while U.S.-born Asian American women with a college degree do not seem to have a disadvantage with similar White women in terms of earnings, they are more likely to be unemployed and less likely to supervise big teams. This last finding is consistent with evidence that AANHPI workers are held back by a specific kind of glass ceiling—a structural barrier in which stereotypes and discriminatory boundaries limit access to upper-management jobs and positions with institutional power.
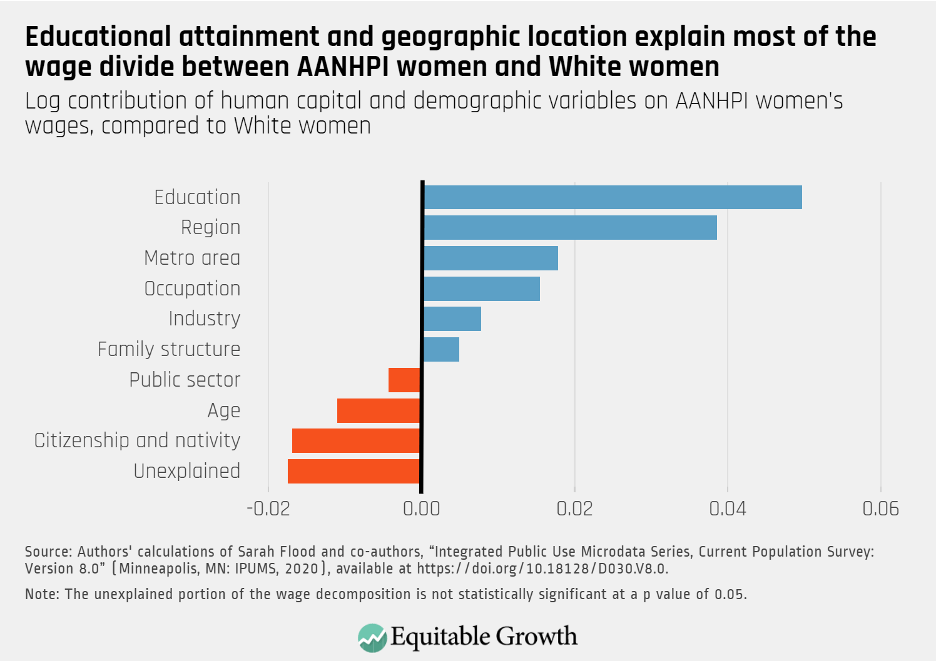
Per our estimates, geographic location—that AANHPI women are more likely to live in cities and regions where wages, as well as the cost of living, tend to be higher—explains 67 percent of the divide, and greater levels of educational attainment explain 59 percent of the wage divide between AANHPI women and White women. For example, while 63.7 percent of AANHPI women have at least a bachelor’s degree, 49.4 percent of White women have a bachelor’s degree or more. An unexplained portion represents 21 percent of the AANHPI women-to-White women wage divide, but it is not statistically significant. (See Figure 1.)
Figure 1
The wage divide between AANHPI women and AANHPI men
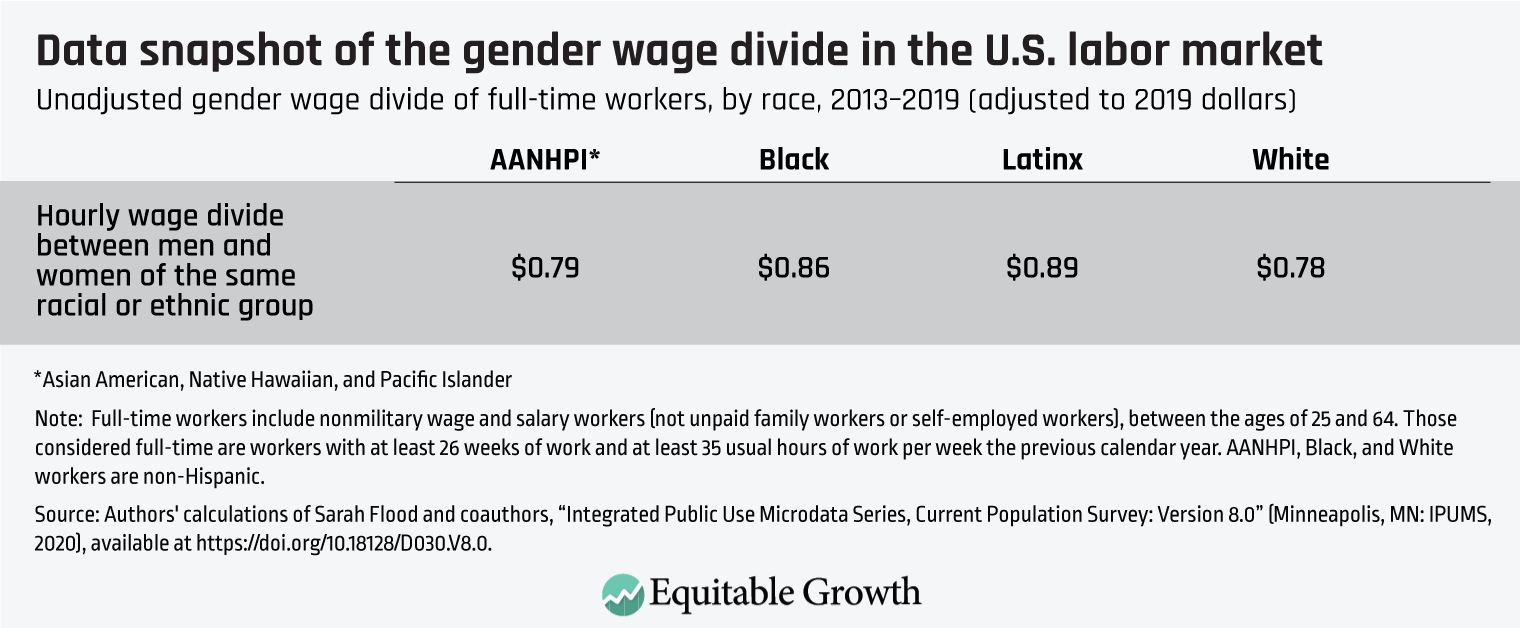
The unadjusted gender wage divide between AANHPI women and AANHPI men is large.6 Across our study period, 2013 to 2019, AANHPI women made only 79 cents for every dollar AANHPI men made—a 21-cent gap. Across the major U.S. racial and ethnic groups, the gender wage divide is only larger for White workers, with White women making 78 cents for every dollar White men make. (See Table 2.)
Table 2
The magnitude of the disparity is puzzling given that AANHPI men and women are more likely to hold the same type of job than men and women of other racial and ethnic groups, and that occupational segregation is one of the largest contributors to the overall gender wage divide in the United States. Indeed, research by Ariane Hegewisch and Heidi Hartman of the Institute for Women’s Policy Research shows that AANHPI workers do not only experience less job segregation on the basis of gender than White, Black, and Latinx workers, but they are the only group that made consistent progress toward job integration between the late 1980s and the late 2010s.7
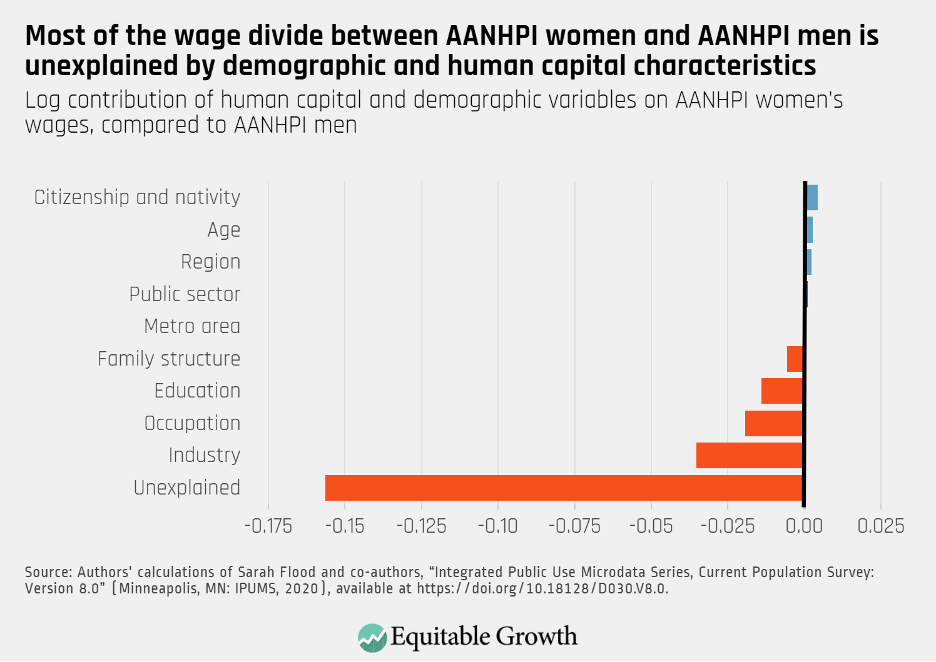
We find that 71 percent of the gender wage divide between AANHPI men and women is unexplained by the characteristics included in our analysis. Importantly, industrial segregation—more so than occupational segregation—is the largest explained cause behind the wage divides between AANHPI women and AANHPI men. As such, the sorting of AANHPI women into relatively lower-paying industries accounts for 16 percent of the wage divide, occupational sorting explains 9 percent, and mean differences in educational attainment account for 6 percent. (See Figure 2.)
Figure 2
The wage divide between AANHPI women and White men
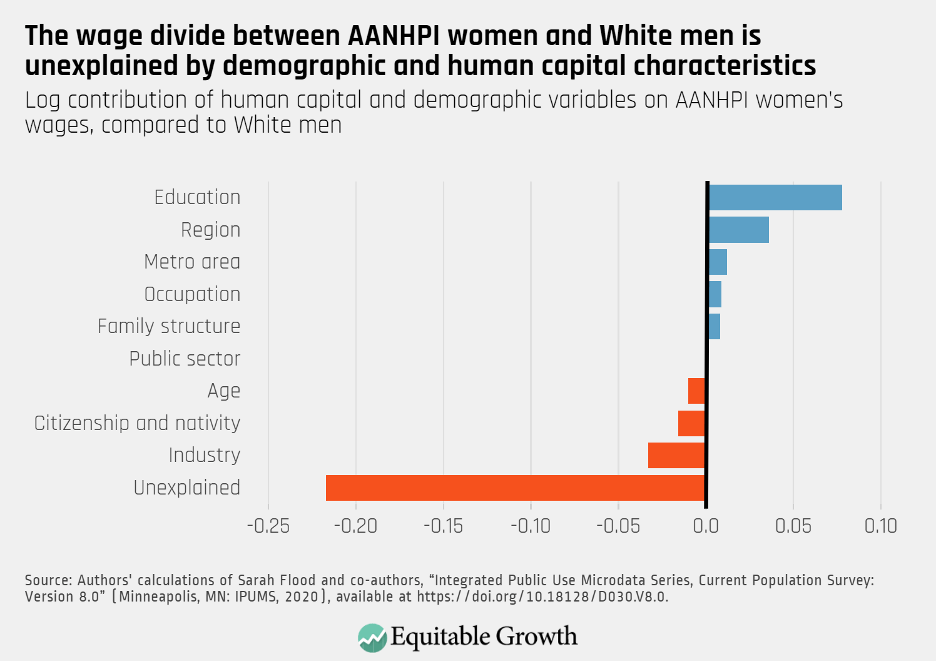
Turning to the intersectional wage divide faced by AANHPI women, we find that more than the entire AANHPI women-to-White men wage divide—163 percent—is unexplained. This means that AANHPI women’s wage boost—through observed characteristics such as high levels of educational attainment, occupational distribution in relatively well-paying occupations, and concentration in geographic regions where wages (and the cost of living) tend to be higher—is more than offset by factors that are unexplained by this model, or can be interpreted as likely the result of discrimination.
In addition, if the effects of being both Asian American, Native Hawaiian, or Pacific Islander and of being a woman were merely additive, researchers would expect an unexplained wage divide between AANHPI women and White men of 0.174 log points, given the 0.156 log point unexplained advantage AANHPI men have over AANHPI women and the 0.018 unexplained advantage White women have over AANHPI women. Instead, we find that the unexplained portion of the wage advantage White men have over AANHPI women, 0.218 log points, is greater than the sum of the separate unexplained effects.8 As proposed by U-Mass’s Kim and also by Paul, Zaw, Hamilton, and Darity in their studies of the intersectional wage penalties faced by Black women, this is why economists, as well as policymakers, should take intersectionality theory seriously in their analyses of labor market disparities. (See Figure 3.)
Figure 3
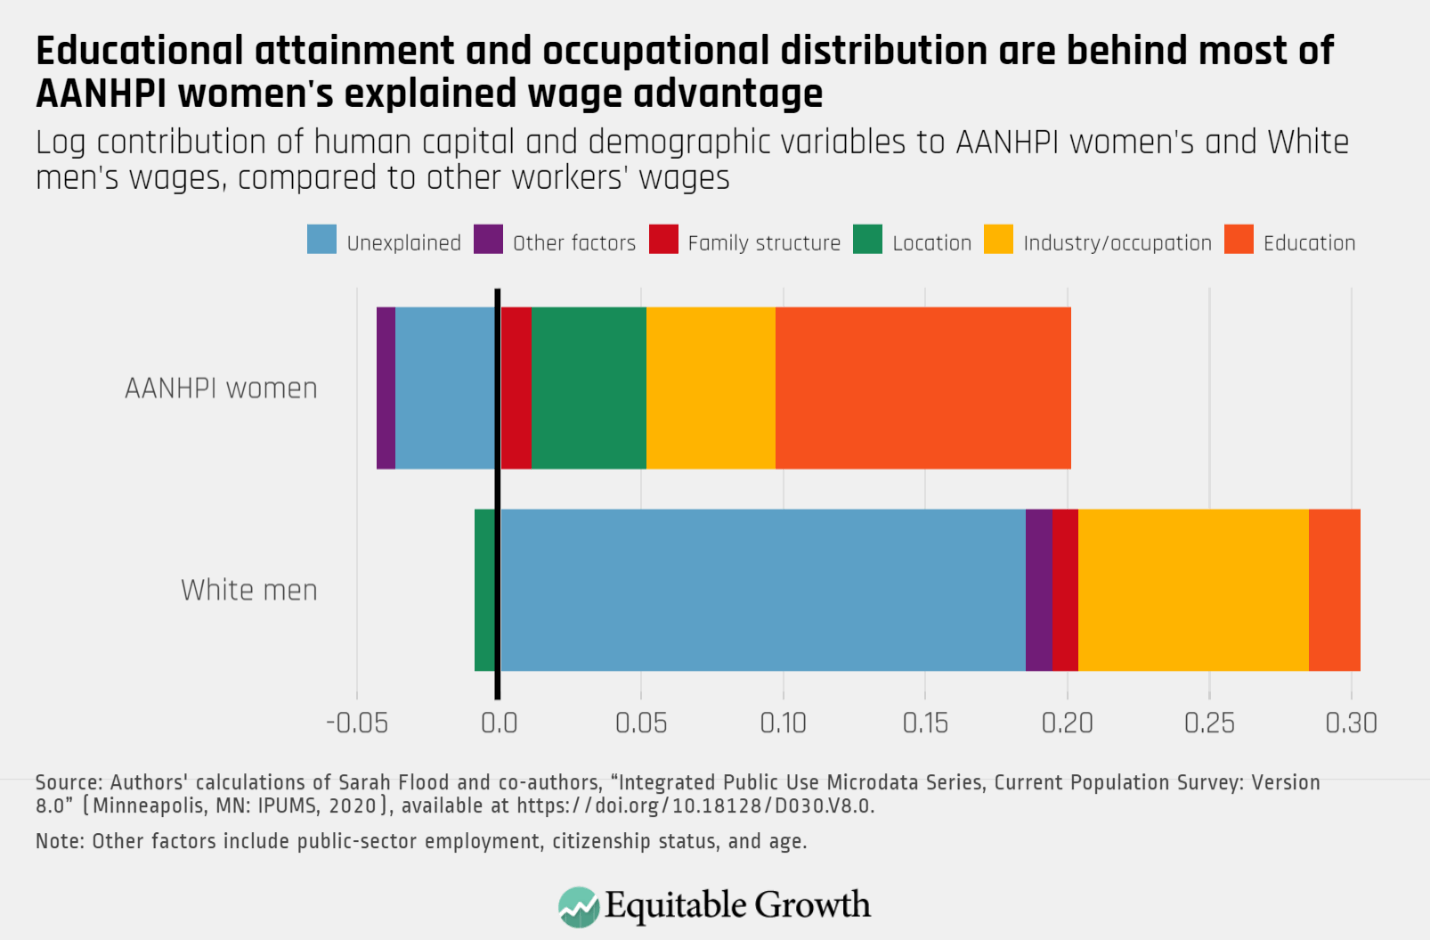
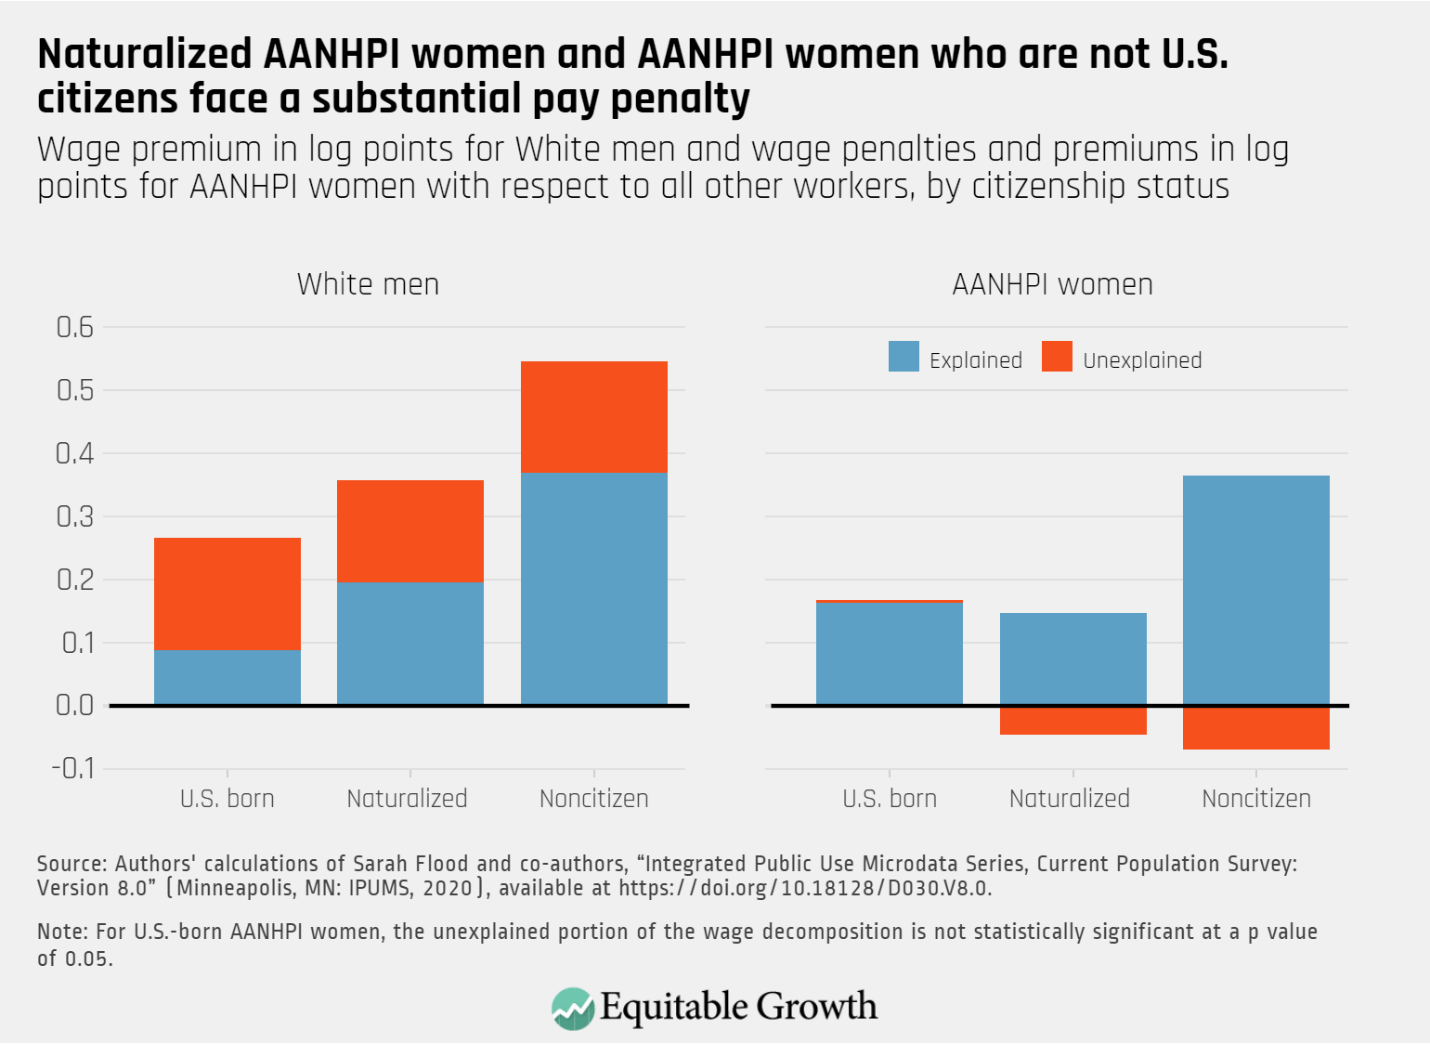
We also decompose the wages earned by White men and AANHPI women to examine the advantage or penalty the two groups experience relative to all other workers in the U.S. economy. As with the previous model, we find that most of the wage advantage that White men have over other workers (here, we exclude AANHPI women from the estimation) is unexplained by demographic or human capital characteristics. This means workers from historically marginalized demographic groups appear to face discriminatory wage penalties that cannot be accounted for by differences in characteristics associated with productivity alone, yet the most historically privileged group—White men—appears to receive a premium that is beyond what can be explained by their average human capital characteristics.
In contrast, AANHPI women’s wage advantage over all workers except for White men is driven by observed characteristics, with educational attainment explaining 65 percent, occupational and industrial distribution 28 percent, and geographic location 25 percent.9 (See Figure 4.)
Figure 4
The intersectional wage divides faced by AANHPI women of different national origin or ethnicity and citizenship subgroups
Due to the wide range of U.S. labor market outcomes experienced by workers within the AANHPI community, in this section, we decompose the wage divides by disaggregating data according to national origin or ethnicity, as well as by citizenship status. First, we again modify the models put forth by U-Mass’s Kim and by Paul, Zaw, Hamilton, and Darity, and examine the wage divides between various subgroups of AANHPI women and all other workers in the U.S. economy, but exclude White men. We repeat the same strategy for White men and exclude AANHPI women.
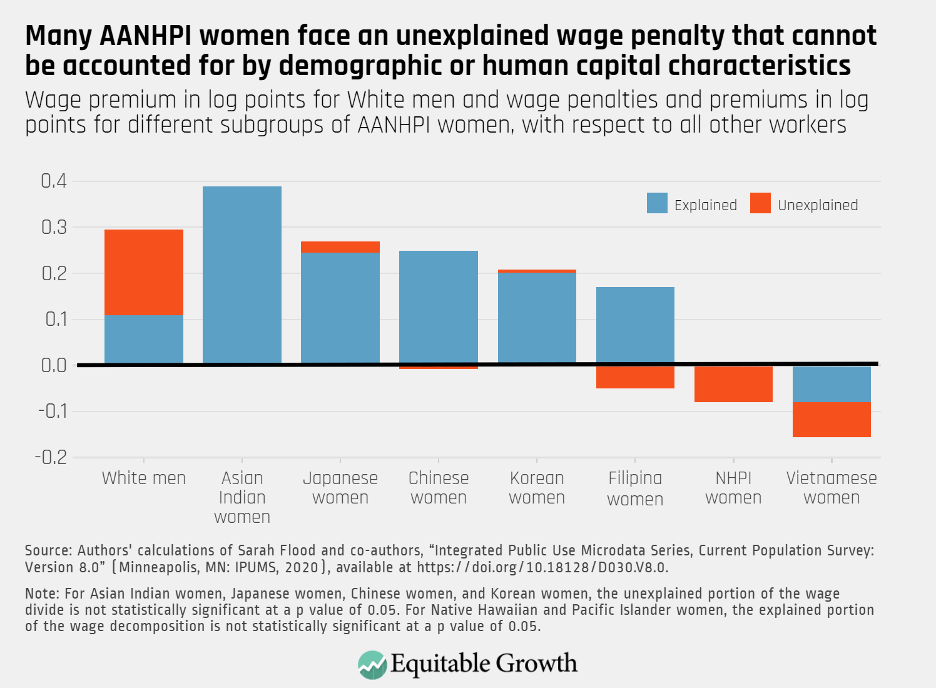
There are big disparities in the magnitude and composition of the wage divide between other workers in the U.S. economy and different groups of AANHPI women. For instance, virtually all the wage advantages that Asian Indian, Japanese, Chinese, Korean, and Filipina women have over other workers in the U.S. economy are accounted for by the demographic and human capital characteristics included in the model. Strikingly, however, Filipina, Vietnamese, and Native Hawaiian and Pacific Islander women experience large unexplained pay penalties.10 For Native Hawaiian and Pacific Islander women, the unexplained portion of the wage divide represents nearly all their pay disadvantage vis-à-vis other U.S. workers. (See Figure 5.)
Figure 5
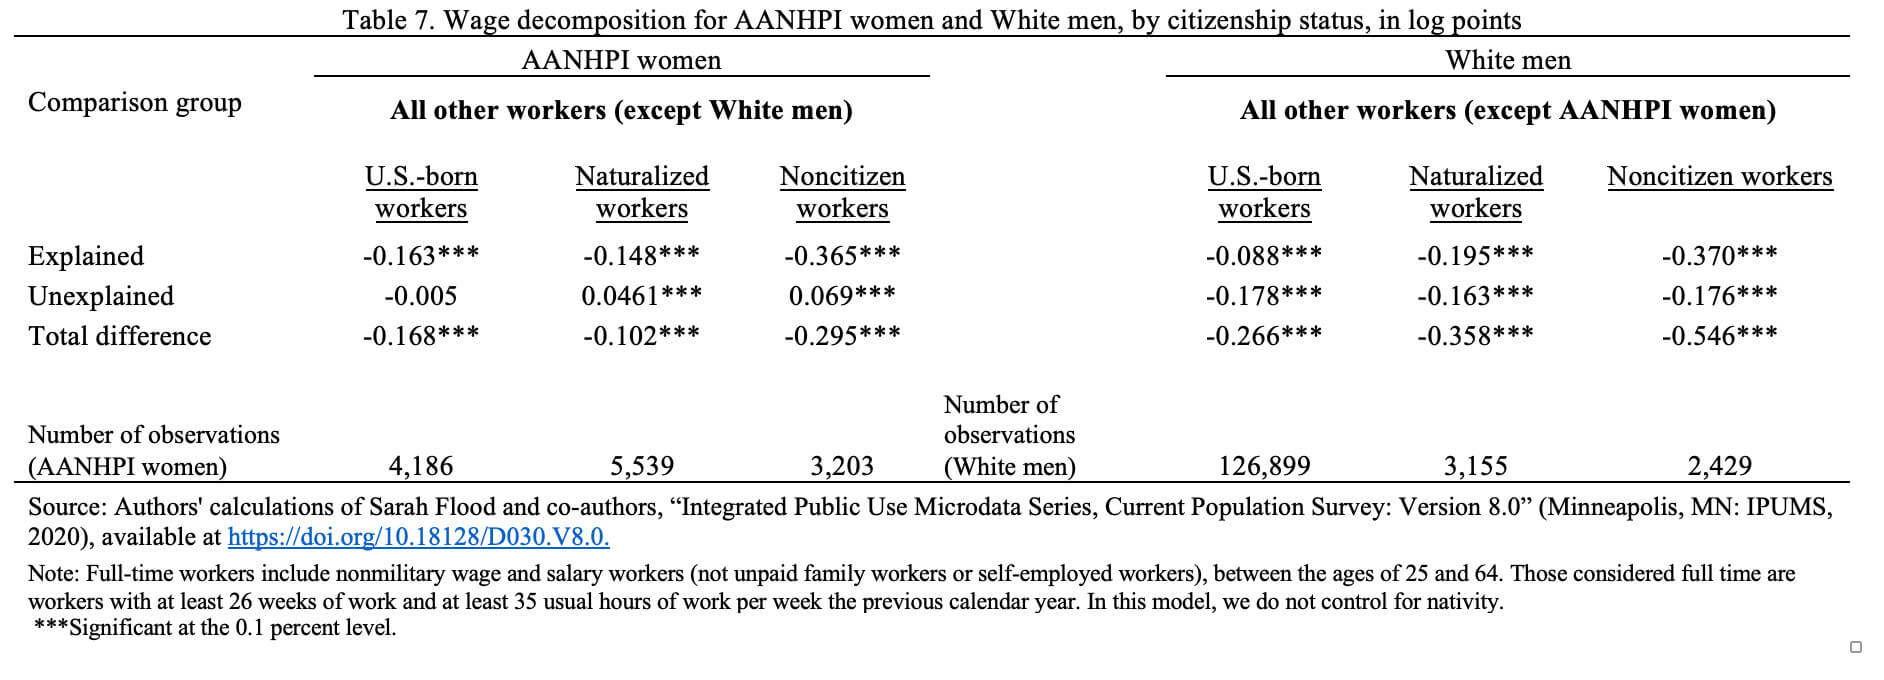
Finally, we perform the wage decomposition by citizenship status and find that AANHPI women who were not born in the United States experience a substantial unexplained wage penalty. On average, naturalized and noncitizen AANHPI women earn higher wages than other naturalized and noncitizen workers (these estimates exclude White men) but face a pay penalty that cannot be accounted for with the characteristics included in our model. In contrast, U.S.-born, naturalized, and noncitizen White men are found to experience a substantial unexplained wage advantage vis-à-vis other workers (excluding AANHPI women) with the same citizenship status. (See Figure 6.)
Figure 6
About three-fourths of AANHPI workers in our sample were not born in the United States. When studying the U.S. labor market barriers faced by Asian and Asian American immigrants, researchers have proposed that English proficiency and place of education—factors we do not account for in our estimations—as well as racial bias, appear to play a role in explaining some poorer economic outcomes.
When studying why Asian immigrant men earned less than similar U.S-born White men, for example, Zhen Zeng and Yu Xie at the University of Michigan found that educational credentials obtained abroad are undervalued in the U.S. labor market and thus play an important role in explaining the pay penalties faced by some Asian immigrants more so than their immigration histories. In addition, Marlene Kim at U-Mass Boston finds that when incorporating the number of years worked in an occupation and the number of years worked for a current employer, U.S.-born Asian American men are also found to face a pay discrimination. Studies that use proxies for experience in the labor market, such as this one, can therefore fail to capture this penalty by underestimating the years of work experience AANHPI workers have vis-à-vis White workers.
Conclusion
The wide range of labor market outcomes that AANHPI women experience is often obscured by insufficient data and by economic narratives that fail to capture important inequities among this group of workers. Moreover, overlooking how the interaction of socially salient identities such as gender, race, and ethnicity affect AANHPI women’s earnings and employment opportunities does not only mask their lived experiences but also holds back policy efforts that could start to work against these inequities and discriminatory disadvantages.
For instance, while a large share of AANHPI women hold high-wage jobs, an even larger share work in positions that are among the worst-paid in the U.S. economy. An effective way to promote economic security for AANHPI women workers and all workers in the lower end of the wage distribution—as well as to promote broad-based economic growth—is to raise the federal minimum wage floor. Stuck at $7.25 per hour for more than a decade, research shows that lifting the minimum wage would benefit all workers, and especially women workers and workers of color.
Policymakers also should ensure that there are substantial investments to the care infrastructure of the United States. A large and growing share of AANHPI adults and of U.S. adults in general live in multigenerational households. As more people live with both their young children, adult children, and aging parents, access to affordable and high-quality care is becoming increasingly important. As such, investments in home- and community-based services and greater access to paid family and medical leave, research finds, would boost labor force participation, support the well-being of care recipients and their families, and support the overall U.S. economy.
These investments also could boost the wages and job quality of the millions of women who work in the care economy. Women not only tend to do the lion’s share of the unpaid work of caring for their families and communities but also tend to do the (generally poorly paid) professional care work, representing the vast majority of workers in jobs such as nursing assistants and home health aides. While they make up about 4 percent of the U.S. workforce, AANHPI women represent about 8 percent of registered nurses and 6 percent of personal care aides.
The high average levels of education of AANHPI women demonstrate that education alone is not sufficient to offset wage divides based on demographic characteristics. Boosting worker power through fostering pro-worker institutions such as labor unions or increasing worker information with pay transparency can offset discriminatory pay practices such as those that lead to unexplained pay penalties faced by AANHPI women. The insufficiency of the human capital model in explaining wage divides demonstrates that other structural forces, among them racism and xenophobia, influence pay practices, but worker power and solidarity can help workers to claim earnings equivalent to the value they create.
In addition, given that AANHPI women face large unexplained intersectional penalties, it is important for policymakers to strengthen the enforcement of labor standards. In the case of wage violations, for instance, research by Janice Fine of Rutgers University, Daniel J. Galvin of Northwestern University, Jenn Round of Rutgers University, and Hana Shepherd of Rutgers University finds that immigrant workers and women workers would particularly benefit from a more efficient enforcement of labor law since they are especially vulnerable to wage theft by employers.
Finally, the diversity of economic outcomes within the AANHPI community highlights the need for disaggregated data in order to design equitable and efficient policies. The analysis here demonstrates the extent of within-group variation in economic outcomes, yet understanding contributing factors can be limited when there is not sufficient sample sizes of groups within the U.S. economy. Identifying which communities face disadvantages in terms of, for example, access to healthcare, income support programs, housing, and educational opportunities is essential to design, fund, and evaluate interventions. Together, these policies would represent a step forward toward both greater equity and a more dynamic U.S. economy.
 post
post
 Coronavirus Recession
Appendix
Methodology
This issue brief uses data from the Annual Social and Economic Supplement of the Current Population Survey collected between 2014 and 2020. Our sample is represented by full-time workers (workers who worked at least 26 weeks the previous calendar year and at least 35 hours per week) between the ages of 25 and 64 and who earned at least one dollar of wage and salary income the previous calendar year. Our sample does not include unpaid family workers and those in the armed forces. Hourly wages are calculated by dividing total wage and salary income by the number of weeks and usual hours worked the previous calendar year.
Table 3 shows the sample sizes and means of the variables included in our analysis for the four main groups we identify by race and gender: AANHPI women, AANHPI men, White women, and White men. The reported AANHPI women-to-White men gap is calculated using the ratio of their (geometric mean) wages.
Table 3
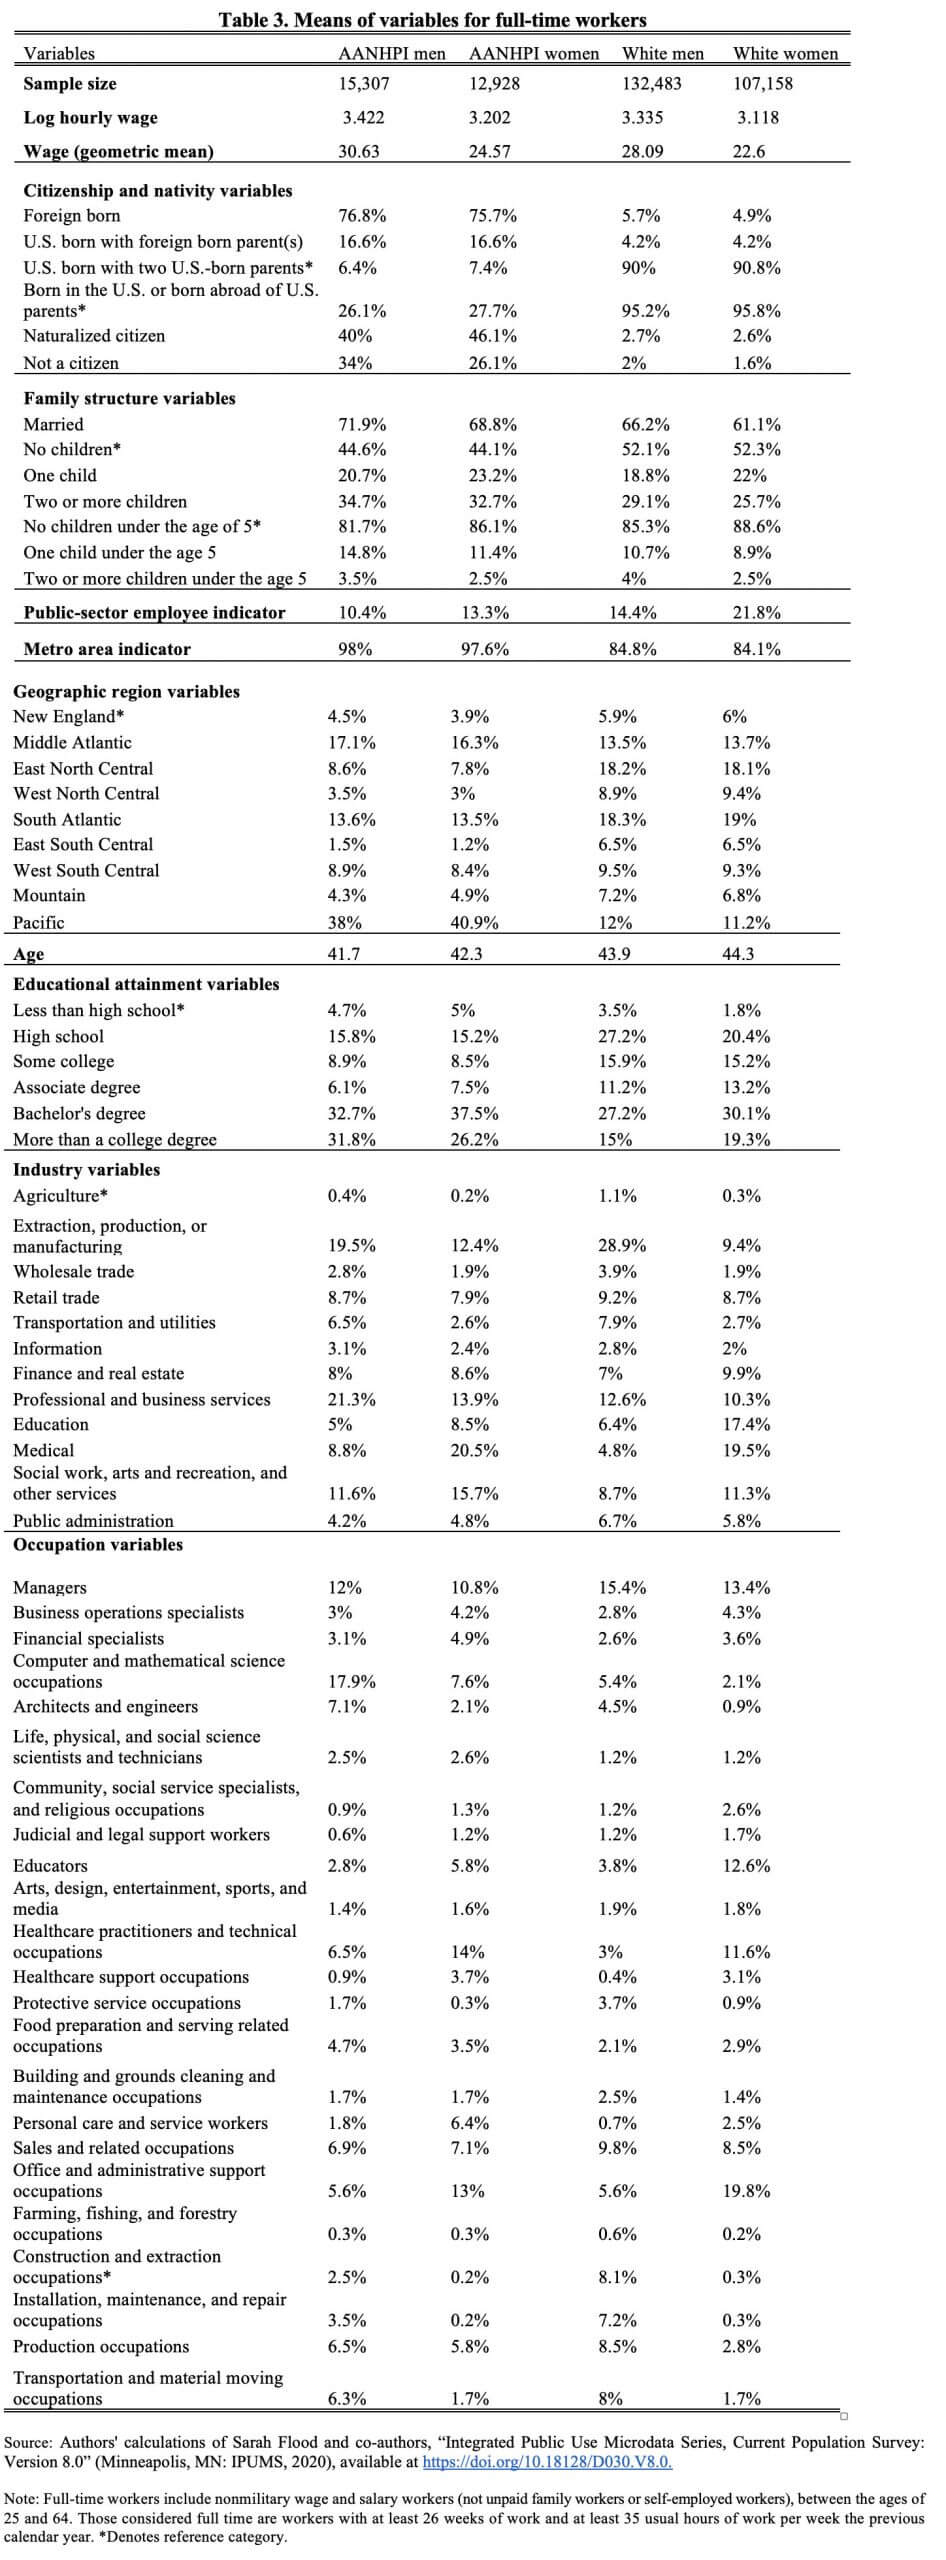
Table 4

Table 5

Table 6
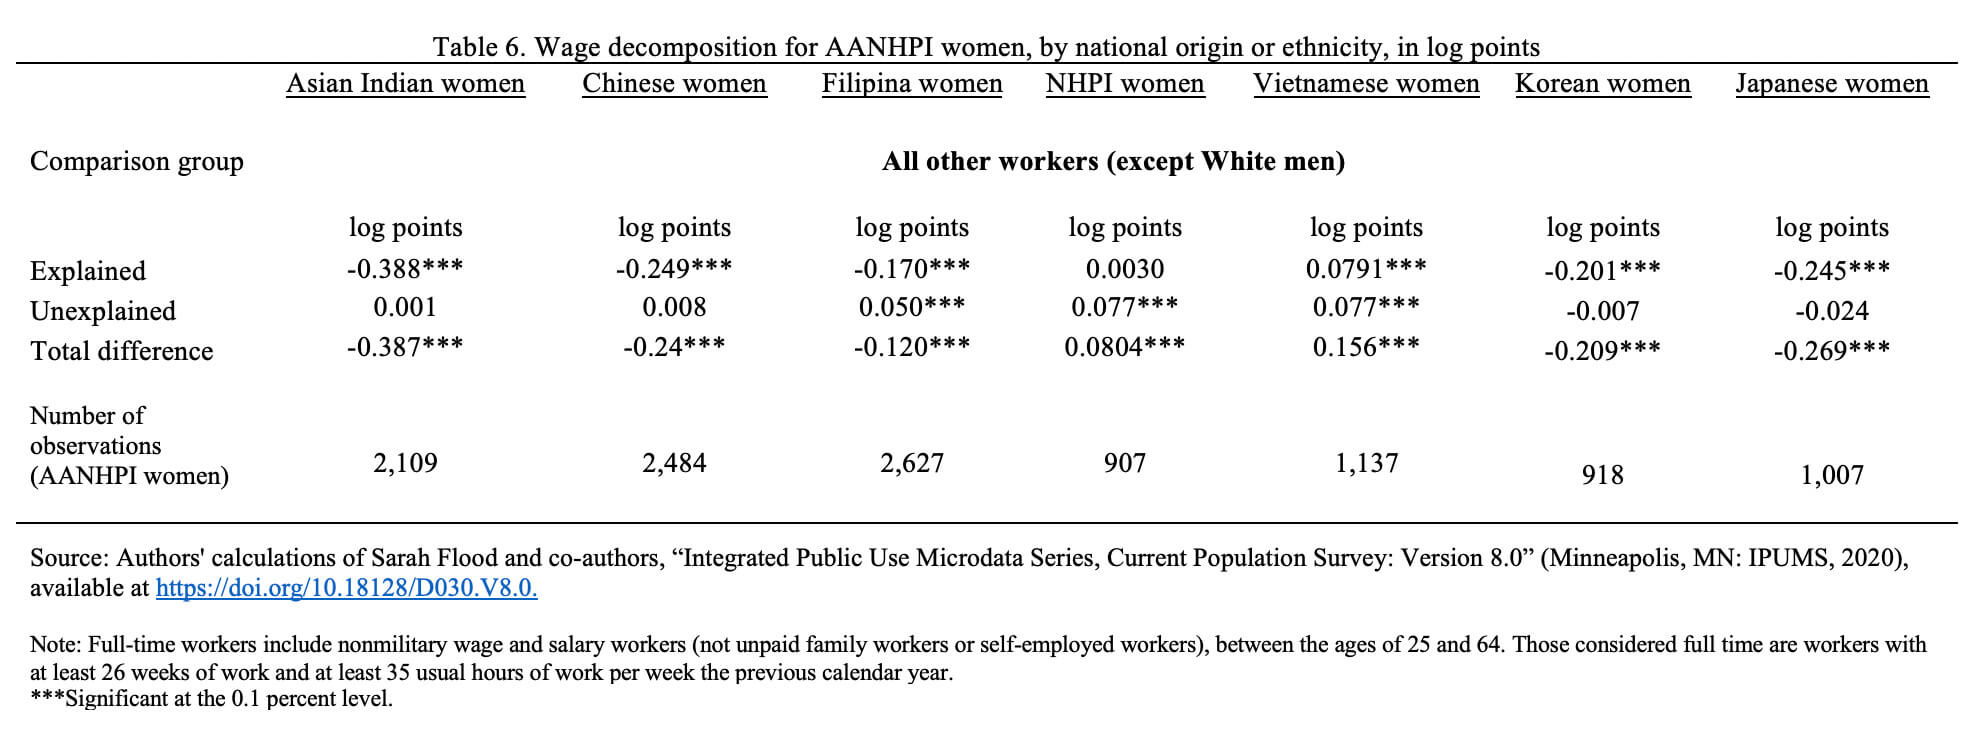
Table 7
End Notes
1. Some research and sources of data cited in this issue brief refer to Asian American women, but not to Pacific Islander or Native Hawaiian women. In those instances, the term “Asian American” is used. When referring to our own analysis of Current Population Survey data from the U.S. Census Bureau, the term “Asian Americans, Native Hawaiians, and Pacific Islanders” is used in order to highlight the experiences of the workers featured in our estimates. But there are also instances in which research and sources cited in this brief use the term “Asian American and Pacific Islander.” In those cases, we use the term as it is used in the source material.
2. Mark Paul and others, Journal of Feminist Economics (forthcoming, 2021).
3. For example, in this issue brief, we rely on data from the Annual Social and Economic Supplement of the Current Population Survey because it contains a detailed set of questions on hours of work and asks respondents where their parents were born. However, unlike the American Community Survey, this source of data does not allow for detailed disaggregation along the lines of national origin and ethnicity.
4. The earnings of Vietnamese women—the other AANHPI subgroup included in the study referred to here—was and continues to be well below those of White women.
5. These studies include Emily Greenman and Xie Yu, “Double Jeopardy? The Interaction of Race and Gender on Earnings in the U.S,” Social Forces, 86 (3) (2008) :1217–1244; John Iceland, “Earnings Returns to Occupational Status: Are Asian Americans Disadvantaged?” Social Science Research 28 (1999): 45–65.
6. It is important to note here, too, that research has found important differences between AANHPI subgroups. For instance, research by Matthew Snipp of Stanford University and Sin Yi Cheung of Cardiff University finds that in 2009, the gender wage divide between Japanese workers was larger than for any of the groups they studied (White, Black, Latinx, Chinese, Filipino, and American Indian workers), while the gender wage divide between Filipino workers was the narrowest.
7. While occupational segregation along the lines of gender is not as severe for AANHPI workers, for this group, ethnicity is a major basis for job sorting.
8. See Table 4 in the methodological appendix.
9. See Table 5 in methodological appendix.
10. While Filipina women face a substantial unexplained wage penalty, their wages are still above those of the reference group (all other workers except White men) due to the explained portion of the wage divide.