New research shows the franchise business model harms workers and franchisees, with the problem rooted in current antitrust law

Seven national fast-food chains have agreed to end policies that block workers from changing branches, limiting their wages and job opportunities, under the threat of legal action from the state of Washington.

After negative publicity, investigations by several state attorneys general and pressure from Sens. Cory Booker (D-NJ) and Elizabeth Warren (D-MA), several franchise chains recently announced an end to so-called no-poaching agreements. These agreements—which are part of the uniform franchise contracts that companies such as McDonald’s Corp. offered on a take-it-or-leave-it basis to the franchisees who operate their stores—prevent workers within a chain from moving from one outlet to another. Research from economists Alan Krueger and Orley Ashenfelter at Princeton University suggests that such agreements are mechanisms to enhance the monopsony power of franchise employers over workers by restricting workers’ ability to find alternative employment, reducing worker bargaining power and wages.

Eliminating these agreements removes a particularly egregious mechanism to restrain wages in franchise contracts, but my two new working papers suggest that franchisors’ influence over labor costs and working conditions at franchised establishments goes far beyond no-poaching agreements. This column examines my research findings: That franchise contracts still enable franchisors to increase their bargaining power over franchisees and workers; that, in some instances, so-called vertical restraints further harm franchisees and their workers; and that the legal creation of franchising beginning in the 1960s was, in large part, the story of the loosening of antitrust restrictions on franchisors, often to the detriment of franchisees and their workers.

How franchisors increase their bargaining power over franchisees and workers

Through a simple economic model and descriptive analysis of common contractual provisions in franchise agreements, my paper, “Franchising as Power-Biased Organizational Change,” shows that franchisors are, in a sense, co-employers who intimately shape employee working conditions—despite not being the payroll employer of those workers. I argue that franchise contracts function in part to reduce the bargaining position of both franchisees and workers, allowing franchisors to extract more labor effort from a low-wage workforce, reducing unit labor costs, and raising profits for the franchisors.

Franchising is a business form in which a firm owning a valuable brand outsources the delivery of goods or services to a separate firm or individual in exchange for the remittance of a royalty, usually calculated as a percentage of gross sales. In 2012, the most recent year for which data are available, franchising firms accounted for 7.9 million jobs in the United States, compared to 13.4 million jobs in manufacturing. Franchisors accounted for more than 450,000 business establishments, or 10.45 percent of all establishments. Sales of franchised chains were about $1.3 trillion in 2007, or 9.2 percent of total U.S. Gross Domestic Product.

Franchising is the dominant mode of industrial organization in the fast-food industry, with 73 percent of the 3.58 million fast food workers in the United States employed in franchised chains. Franchising is also common in the hotel, auto repair, and janitorial industries.

At first glance, franchising appears to be an efficiency-enhancing business model because it aligns franchisee incentives with franchisors. The franchisee of a typical fast food chain—let’s call him Joe Independent, operating a Fresh Fries franchise—is incentivized to work hard because Joe Independent keeps the profits, minus the royalties paid to Fresh Fries. Since Joe Independent shares in the profits, he also gets the benefit of his own hard work alongside the work of his employees. Franchising appears at this stage to be both fair and efficient.

But a close look at franchise contracts reveals that franchisors go beyond merely aligning incentives. They also make investments in bargaining power to reduce the bargaining fallback position of franchisees who, similar to Joe Independent, raise their effort levels beyond what aligning incentives through profit sharing achieves on its own.

Here’s how it works: Think of Joe Independent’s effort as a function of the value he gets out of being a franchisee, relative to his fallback position should the franchisor terminate or fail to renew his contract. This means that Joe will work harder the more money he can make as a franchisee, but less hard the stronger his fallback position is.

Indeed, the fallback position of franchisees is a function of the value of their assets outside the franchise relationship, their expected income outside that same relationship, and their probability of finding alternative employment or other income-generating activity outside the franchise relationship. By reducing what franchisees such as Joe Independent can earn outside the franchise relationship relative to within it, franchisors can induce franchisees like Joe to work even harder than they would have agreed to—based on the value of the franchise alone prior to entering the contract.

An analysis of franchise contracts reveals the prevalence of such power-reducing contract terms. From a public records request to the state of Wisconsin, which requires franchisors to file copies of their contracts, I collected franchise contracts from all 530 franchisors operating in Wisconsin with more than 85 outlets nationwide. An analysis of these contracts revealed a number of contract terms that tilt power toward franchisors. These include the following:

  • Most franchisors impose noncompete agreements on franchisees, which prevent them from using the human and physical capital they have accumulated in the franchised business in alternative employment once the contract ends. The average duration of noncompete agreements in my sample is 19 months.
  • Ninety-three percent of contracts require franchisees to sign a personal guarantee, giving the franchisor recourse to their personal assets in the event of bankruptcy or litigation.
  • Fifty-eight percent of franchise contracts in the sample impose mandatory arbitration on franchisees, which forces them to give up their right to class action litigation and jury trials.
  • Ninety-one percent contain a forum clause, which forces franchisees to travel to the home jurisdiction of the franchisor in any litigation, dramatically raising the cost of challenging the franchisor in court.
  • Eighty-five percent give the franchisor a right of first refusal to any sale of the franchisee’s business, lowering the potential resale value of the franchise assets.

In short, a franchisor can induce very high levels of franchisee effort by leveraging such one-sided contract terms to reduce the franchisee’s bargaining position. In this sense, franchisors extract not just high effort from franchisees, but also more effort than the franchisees bargained for. Rather than enhance efficiency by achieving more output per unit input, franchise contracts coerce extra output from the franchisee input.

Channeling franchisee effort through vertical restraints

Franchise contracts do more than extract extra effort from franchisees. The contracts also channel that extra effort in certain directions favored by the franchisor. Importantly for the efficiency implications of franchise contracts, franchisees typically do not directly produce output. Rather, they manage the workers who do. These workers are paid in wages, not profit shares, and do not share in the proceeds of any additional effort they put into their jobs.

Contract terms known as vertical restraints—controls on franchisee decision-making such as on prices, suppliers, and customers—remove franchisee discretion over their “independent” businesses and focus their efforts on just a handful of areas. I collected data on six common vertical restraints:

  • Fifty-five percent of franchise contracts contain the no-poaching agreements referenced above. (My sample of contracts is from 2016. As mentioned above, some of the chains have since ceased including these terms in new contracts offered to franchisees.)
  • Forty-five percent of franchise contracts give franchisors the right to fix the maximum or minimum prices the franchisees may charge.
  • Ninety-one percent prohibit franchisees from offering for sale any products not approved by the franchisor.
  • Sixty-four percent (ninety-two percent in the fast food industry) give franchisors the right to set mandatory hours of operation.
  • Eighty-two percent restrict the site where the franchisee can choose to locate.

Franchise contracts also place restrictions on the suppliers franchisees may choose. On average, 47 percent of ongoing franchisee purchases must be made from suppliers restricted by the franchisor. The average percentage in fast food is 78 percent.

As Krueger and Ashenfelter have shown, no-poaching agreements represent direct efforts by franchisors to disempower workers by reducing their fallback position, despite franchisors not directly employing those workers. But other vertical restraints also play a role in disempowering workers.

For one thing, vertical restraints create what David Weil, dean of the Heller School for Social Policy and Management at Brandeis University, has called “fissured workplaces,” where “lead” firms such as franchisors replace direct employment of workers with outside contractors such as temp agencies and franchisees. Workplace fissuring reduces wages by putting workers outside the boundaries of the lead firm, blocking them from access to career ladders, firm-specific wage premia, and workplace protections such as union rights. Without the ability to control franchisees through vertical restraints, franchisors such as McDonald’s and Yum! Brands Inc. (the franchisor of the Taco Bell fast food chain) would be forced to take direct ownership of their retail outlets to maintain the uniform chain-store appearance that is essential to their brand, eliminating fissuring.

In the franchising context, vertical restraints also constrain worker wages in more direct ways by focusing the attention and effort of franchisees on the control of labor costs. The more variables that are taken out of the franchisee’s decision set, the more they must focus on labor cost as the variable they can control. Many franchisees operate under contracts where their prices and most of their nonlabor input costs are determined by the franchisor. The wage bill and extraction of worker effort become one of the few variables under their control to maximize their profits.

Thus, franchise contracts loaded with vertical restraints squeeze effort from franchisees at the task of squeezing effort from production workers. While franchise contracts increase franchisor profits in efficiency-enhancing ways through aligning franchisee incentives with franchisors by achieving more output per unit input, these contracts also increase profits in nonefficient ways by squeezing additional (uncompensated) effort from the labor input.

Franchising in this context functions as a type of organizational surveillance and as a vehicle for labor discipline by franchisors, in which franchise contracts induce franchisees to surveil production workers and extract high levels of effort from them, reducing the investments in monitoring and/or wage premia that franchisors would otherwise have to make to attract and motivate production workers. Yet because franchisors are not the legal employers of production workers, franchisors escape legal responsibility for their terms and conditions of employment.

The legal creation of franchising

In a second paper, “Control Without Responsibility: The Legal Creation of Franchising 1960–1980,” I trace the creation of franchising as a business model from 1960 to 1980. I show that franchising was far from a natural evolution of business organization, growing over time due to efficiency reasons alone. In fact, the growth of franchising required a struggle through lobbying and litigation to achieve the policy changes necessary to allow it to take root.

The history of the creation of franchising is all about these contractual controls on independent franchisees such as on prices, suppliers, and customer restrictions. These controls were and remain the mechanisms franchisors rely on to create the uniform chain-store appearance of their far-flung operations in the absence of formal vertical integration.

Vertical restraints were frowned upon by antitrust authorities during the early years of franchising in the 1950s and 1960s, who interpreted their antitrust role more broadly as including the protection of small businesses such as franchisees from domination by large corporations such as franchisors. Limitations on the freedom of franchisees to choose their own customers or set their own prices through vertical restraints were therefore frowned upon in the early years of franchising.

Not so today. Under current antitrust interpretations, antitrust authorities focus narrowly on low consumer prices as their objective. This shift in focus came about in part because franchisors litigated and lobbied to overturn antitrust restrictions on vertical restraints, prevailing in legalizing nonprice vertical restraints in the 1977 court case Continental T.V., Inc. v. GTE Sylvania, Inc., and eventually in legalizing even price vertical restraints in the State Oil Co. v. Khan court case in 1997.

Whatever the efficiency implications of franchising, the increasing legalization of vertical restraints also had the benefit for franchising firms of allowing them to fissure workplaces and pull in the legal boundaries of the firm, leaving workers and other stakeholders outside. And at the same time that franchisors pursued franchising as a kind of vertical integration by other means, they also lobbied to preserve the legal benefits of franchisees being separate firms under a variety of laws such as access to Small Business Administration loans and exclusion of workers at franchised establishments from access to collective bargaining and other rights against the franchisors who really control their working conditions.

Franchising is thus very much a legal and policy creation. Among its consequences are workplace fissuring and enhancing the ability of powerful corporations to control working conditions and reduce labor costs without the legal responsibilities that have traditionally accompanied such control. As a creation of law and policy, however, changes in law and policy also hold the key to mitigating its negative effects. The end of no-poaching agreements is an important step in remedying the ill-effects of the franchising model on small businesses and workers, but it is only a first step.

—Brian Callaci is a graduate student of economics at the University of Massachusetts Amherst and a 2017 Equitable Growth grantee.

Posted in Uncategorized

What to consider during the planned congressional hearing on a $15 minimum wage

The U.S. House Committee on Education and the Workforce will hold a hearing on the $15 minimum wage.

The U.S. House of Representatives Committee on Education and the Workforce is planning a hearing on the $15 minimum wage, focusing on the “consequences for workers and small businesses.” The hearing is being held in anticipation of early legislation in the next Congress on the $15 minimum wage. The current chair of the committee, Rep. Virginia Foxx (R-NC), and other members of the current majority in Congress are opposed to substantially increasing the minimum wage.

This hearing is an attempt to focus the policymaking narrative about minimum wage increases solely on business outcomes. Yet there is sparse evidence that increases in the minimum wage will reduce employment across businesses. Recent empirical research from Equitable Growth’s network of academics and grantees demonstrates that state and local increases in the minimum wage have increased worker well-being without the predicted deleterious effects to the economy. Specifically:

  • A new report by the Center on Wage and Employment Dynamics at the University of California, Berkeley’s Institute for Research on Labor and Employment examines the effect of increases to the minimum wage on food service workers who would likely be impacted at the city-level in Chicago; Washington, D.C.; Oakland, California; San Francisco; Seattle; and San Jose, California. Equitable Growth grantees and economists Sylvia Allegretto, Anna Godoey, Carl Nadler, and Michael Reich of UC Berkeley find that cities that increased the minimum wage above $10 per hour had stronger private-sector job growth than the average comparison county.
  • Analysis from the Economic Policy Institute led by economist Ben Zipperer examines the research of a team of economists at University of Washington on Seattle’s $15 an hour minimum wage, and concludes that their findings on negative or ambiguous effects of the increased wage on employment levels are premised on faulty methodology. Zipperer’s analysis verifies the research by Allegretto, Godoey, Nadler, and Reich.
  • Minimum wage increases also reduce income inequality. An Equitable Growth working paper by grantees and U.S. Census Bureau economists Kevin Rinz and John Voorheis links data from the Current Population Survey to earnings records from the Social Security Administration to examine accurate earnings for workers across the income distribution over a 5-year time period. They find that state-level increases to the minimum wage had the strongest effects for those at the lower end of the income distribution, with gains accumulating over time up to 5 years.
  • Equitable Growth Research Advisory Board Member and grantee Arindrajit Dube of the University of Massachusetts Amherst also finds evidence of increased earnings at the bottom of the income distribution in an Equitable Growth working paper. Furthermore, Dube finds that a higher minimum wage reduced eligibility for public assistance but also that it reduced some of the gains of the increased wage among workers likely to be affected by changes to the minimum wage—with the overall impact remaining positive for workers.
  • Further work by Zipperer looks at how the declining real value of the federal minimum wage has effected black and Hispanic workers, finding that it has increased poverty rates for these families.
  • In an Equitable Growth working paper, Research Advisory Board Member David Howell of the New School, along with Kea Fiedler of the New School and Stephanie Luce of the City University of New York, argue that the test of zero job loss for the success of a minimum wage increase is too narrow. While direct impacts on business are one consideration, the overall goal of a minimum wage increase should be a “minimum living wage.”

Indeed, the congressional hearing detracts from the purpose of increasing the minimum wage in the first place: improving the well-being of low-wage workers and ensuring our economic growth is shared along the income distribution. As was discussed in the recent column, “Refocusing the minimum wage debate on the well-being of U.S. workers,” the “no job loss standard” for increases to the minimum wage is misdirected. Disemployment is an aspect of raising the minimum wage for which there is ambiguous or no evidence, while the body of evidence demonstrates that increasing minimum wages in a tight labor market can ensure economic growth is broadly shared with workers at the bottom of the earnings distribution. The result: increased earnings and consumption, reduced job turnover and increased job tenure, and higher family income.

Posted in Uncategorized

JOLTS Day Graphs: October 2018 Report Edition

Every month the U.S. Bureau of Labor Statistics releases data on hiring, firing, and other labor market flows from the Job Openings and Labor Turnover Survey, better known as JOLTS. Today, the BLS released the latest data for October 2018. This report doesn’t get as much attention as the monthly Employment Situation Report, but it contains useful information about the state of the U.S. labor market. Below are a few key graphs using data from the report.

1.

The quit rate remained high at 2.3%, above levels in the previous expansion, demonstrating continued worker confidence in the labor market.

2.

The vacancy yield is at historic lows, below the levels of the full employment economy in the year 2000.

3.

The unemployment-per-job openings ratio continues its downward trend, with fewer unemployed workers actively seeking a job than the number job openings.

4.

The Beveridge Curve is little changed for October, representing a tight labor market.

Posted in Uncategorized

Weekend reading: “The economy should work for all Americans” edition

This is a weekly post we publish on Fridays with links to articles that touch on economic inequality and growth. The first section is a round-up of what Equitable Growth published this week and the second is the work we’re highlighting from elsewhere. We won’t be the first to share these articles, but we hope by taking a look back at the whole week, we can put them in context.

Equitable Growth round-up

This week, Equitable Growth added a new working paper from Equitable Growth grantee and University of Leuven economist Mariana Zerpa to our working paper series. Using a new dataset including a variety of universal and targeted early childhood education programs at the state level, Zerpa analyzes the durability over time of the academic and behavioral improvements caused by these programs. As I summarized in a blog post, Zerpa finds substantial reductions in grade repetition and in the occurrence of developmental and behavioral problems that persist for at least 8 years after children participate in early childhood programs.

Raksha Kopparam summarized some of the key data points in the “U.S. Financial Health Pulse: 2018 Baseline Survey” from the Center for Financial Services Innovation. In addition to pointing out that large numbers of U.S. households are financially “coping” or “vulnerable,” Kopparam documents persistent disparities across racial and ethnic lines. These findings provide further support for the need for disaggregated economic data to get a better sense of the economic well-being of the economy as a whole.

Senior Policy Advisor Liz Hipple highlighted a recent paper from the Federal Reserve Board on the economic circumstances of millennial Americans. Notably, the paper finds that earnings were 27 percent higher for Generation Xers and baby boomers compared to millennials of the same age. The authors argue, however, that the challenges facing millennials likely reflect the exacerbating labor and credit market conditions in the aftermath of the Great Recession. Hipple concludes by citing Equitable Growth grantee and University of California, Berkeley economist Jesse Rothstein’s work on the centrality of labor markets to intergenerational mobility.

Yesterday, Brad Delong shared his thoughts on recent research and writing in economics with a focus on macroeconomic analysis. In addition to highlighting the significant potential role of peer effects and externalities in Zerpa’s working paper, Brad quotes from our Executive Director and Chief Economist Heather Boushey’s column for The Hill on the disastrous employment and growth effects of the failed tax-cut experiment in Kansas.

Links from around the web

Equitable Growth steering committee member and Princeton University economist Alan Blinder discusses how the United States has become the most unequal rich country in the world despite once being a land of opportunity characterized by social mobility and the American dream. Blinder cites research by former Equitable Growth steering committee member and Harvard University economist Raj Chetty, which documents how rising economic inequality has been accompanied by declining social mobility. Blinder concludes by arguing that strengthened unions, pensions, entitlements, and estate taxes must be core features of any plan to return the United States to the levels of mobility and opportunity experienced by many workers in the 1950s. [wsj]

In addition to deregulation, lower taxes for the wealthy, and declining unions, New York Times columnist David Leonhardt points out that changes in corporate structure have been an important cause of rising inequality and persistent wage stagnation for most Americans. Indeed, since the 1970s, corporations began focusing less on serving the public as a whole and more on delivering value exclusively for their shareholders. The route to restoring the American dream and creating a fairer economy must therefore include increasing the power of workers, consumers, and communities in corporate decision making. [nyt]

Benjamin Wallace-Wells at The New Yorker discusses the implications for the racial wealth gap of the recent “baby bond” proposal from U.S. Senator Cory Booker. The proposed policy would entail creating trust accounts worth $1,000 for every child born in the United States to grow over time and provide them with a solid financial foundation to transition to adulthood and progress in their careers. Discussing work by Equitable Growth grantees and economists William Darity, Jr., and Darrick Hamilton, Wallace-Wells notes that one key effect of such a policy would be to reduce the massive average wealth disparity between black and white families—$17,000 vs. $170,000 per household. [new yorker]

Pat Ferrier at the Coloradoan takes a deep dive into the market for childcare in Fort Collins, Colorado. Ferrier argues that both low availability and high costs are substantial burdens for middle class families—and even larger obstacles for poor families working to join the middle class. Through statistics and anecdotes, Ferrier illustrates how childcare provision is characterized by a market failure in which those who need it most are the least financially able to pay for it. This structural flaw in the childcare market underlies the indispensable role of public policy in securing childcare access for all children in the United States. [coloradoan]

Friday figure

Figure is from Equitable Growth’s, “Are today’s inequalities limiting tomorrow’s opportunities?

Posted in Uncategorized

Equitable Growth’s Jobs Day Graphs: November 2018 Report Edition

Earlier this morning, the U.S. Bureau of Labor Statistics released new data on the U.S. labor market during the month of November. Below are five graphs compiled by Equitable Growth staff highlighting important trends in the data.

1.

The employment rate of prime-age workers continues its upward trend and still has room to grow before reaching pre-Recession levels

2.

The U-6 measure of under-employment is below pre-Recession levels, but could potentially still expand further to reach the full employment level of 2000.

3.

Wage growth continues across the wage distribution, but can still improve further to remain on track with expected levels of growth in a tight labor market.

4.

Employment in construction and manufacturing continues upward, but these historically volatile sectors should be watched closely in the coming year for the impacts of trade negotiations.

5.

An increasing share of newly employed workers are coming from out of the labor force, demonstrating that these workers were not lost but rather waiting for a tight enough market.

Posted in Uncategorized

Brad DeLong: Worthy reads on equitable growth, November 30–December 6, 2018

Worthy reads from Equitable Growth:
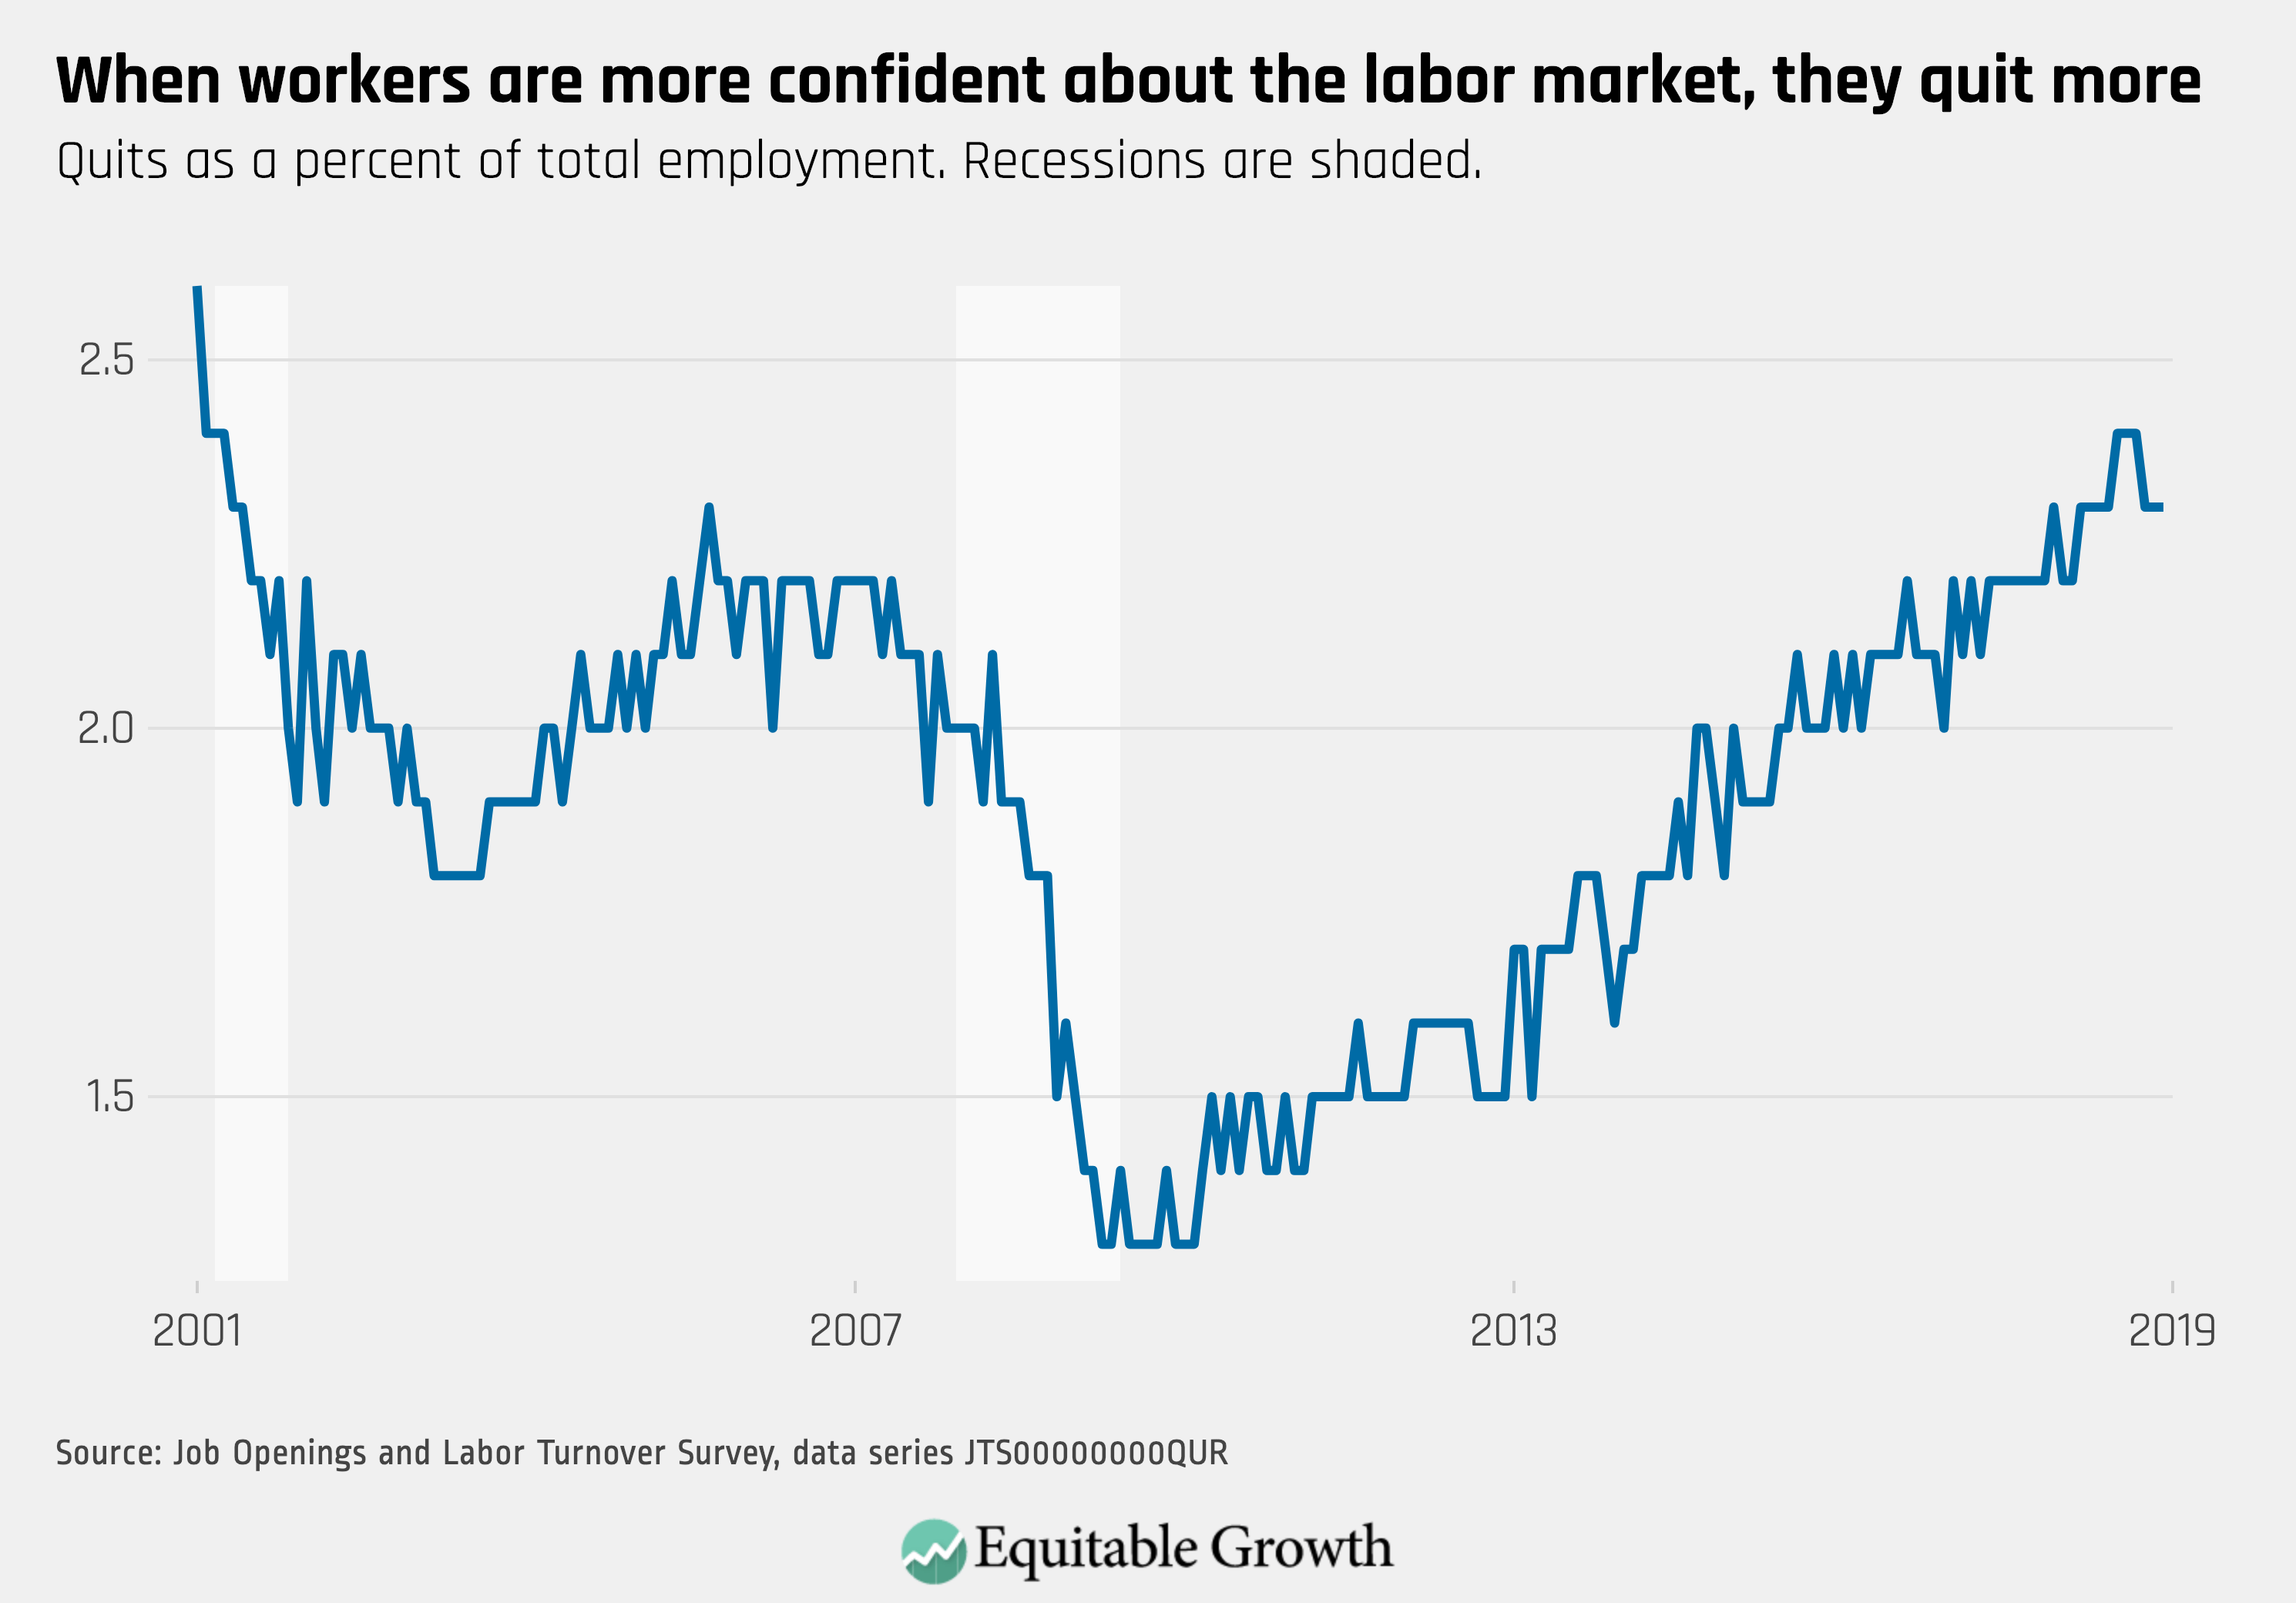
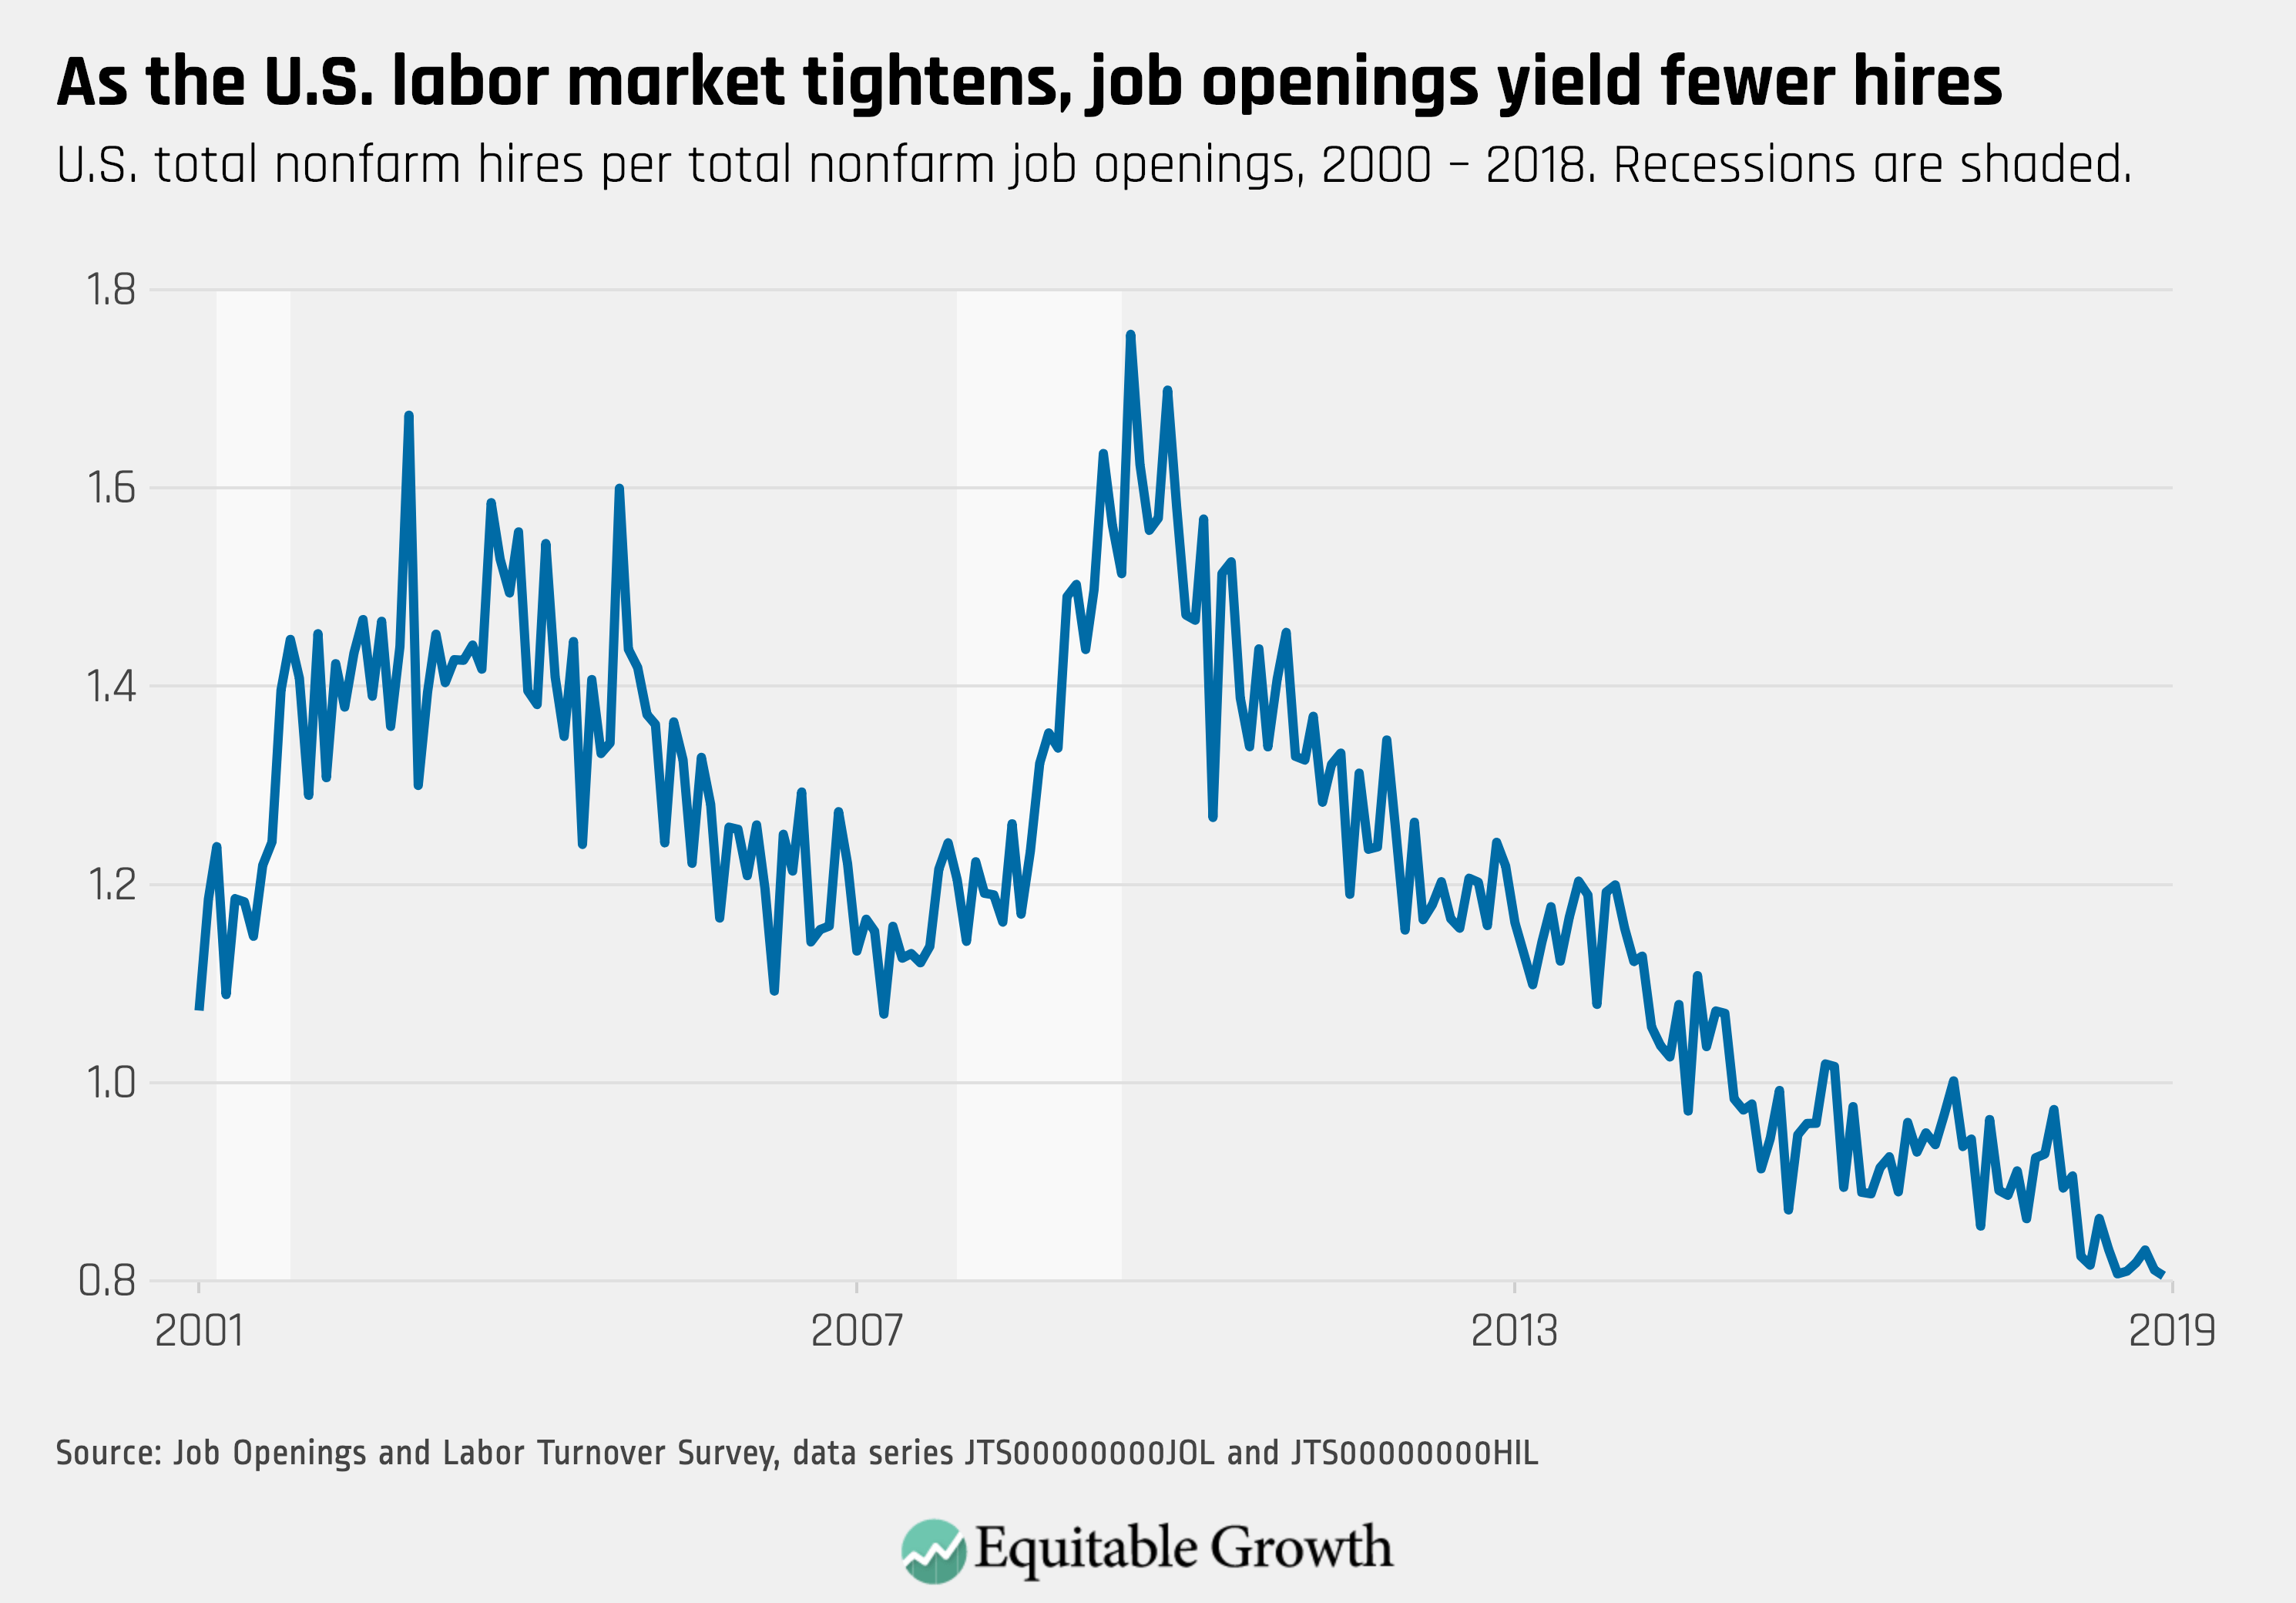
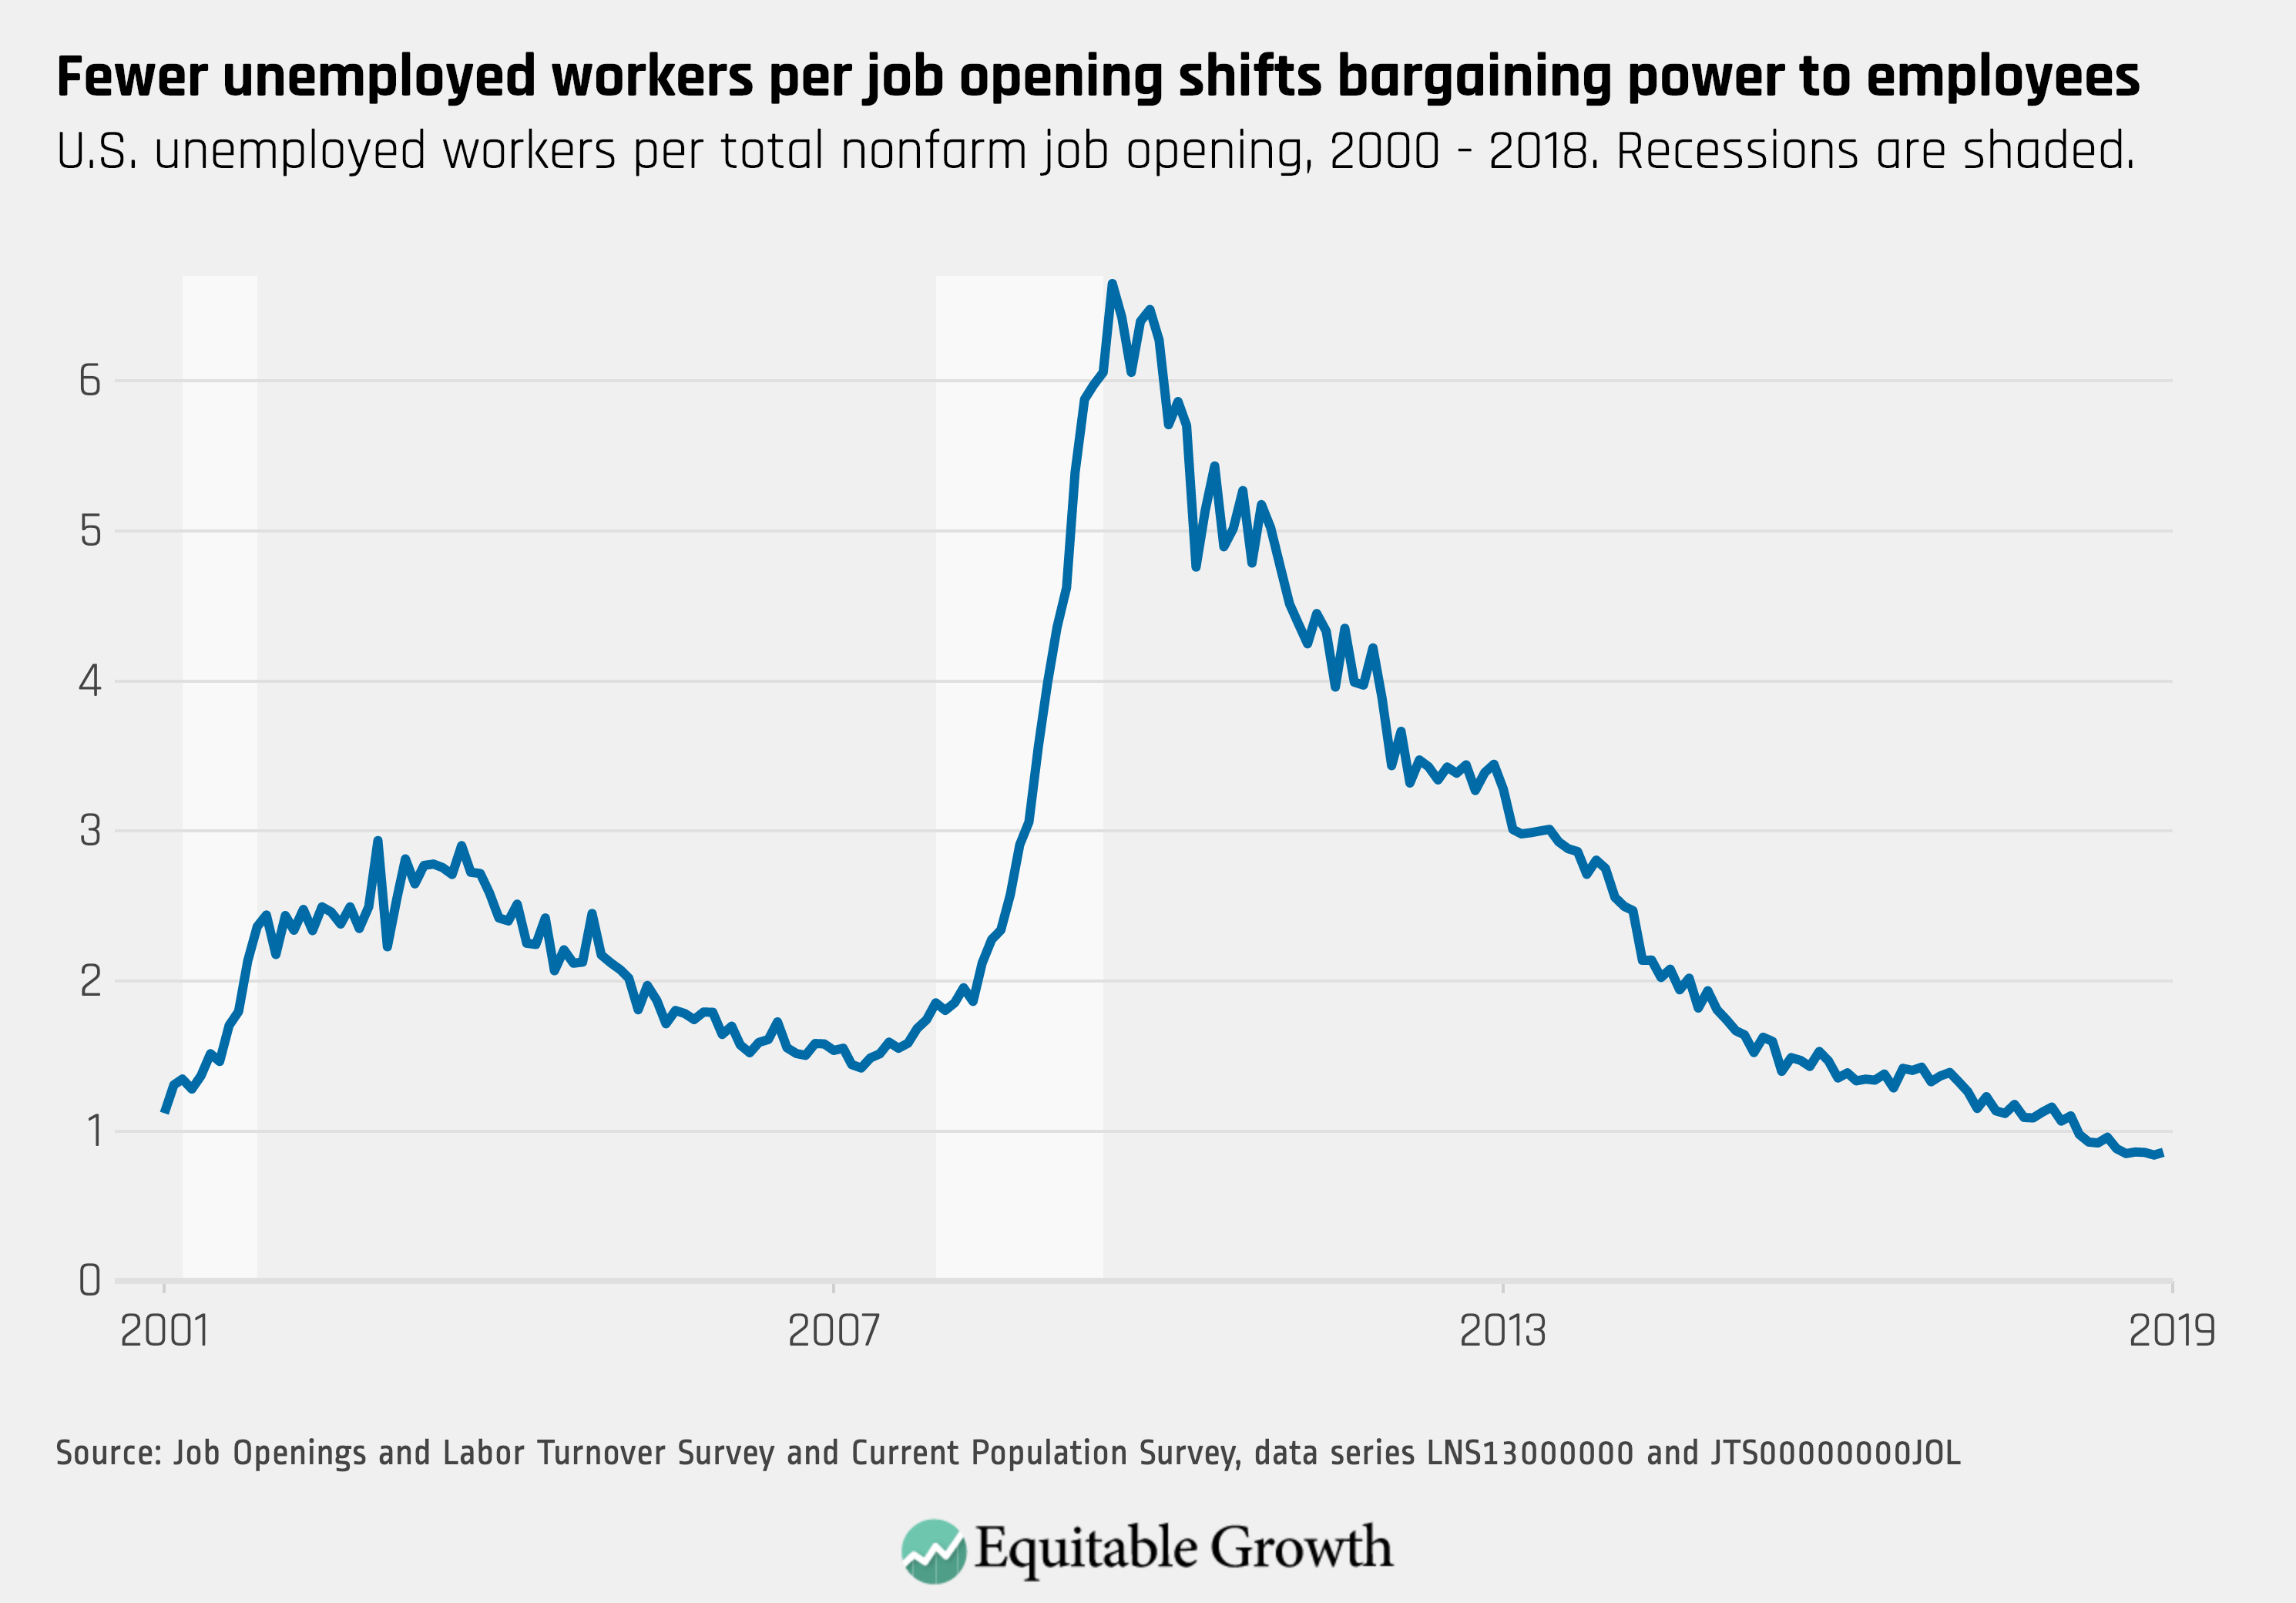
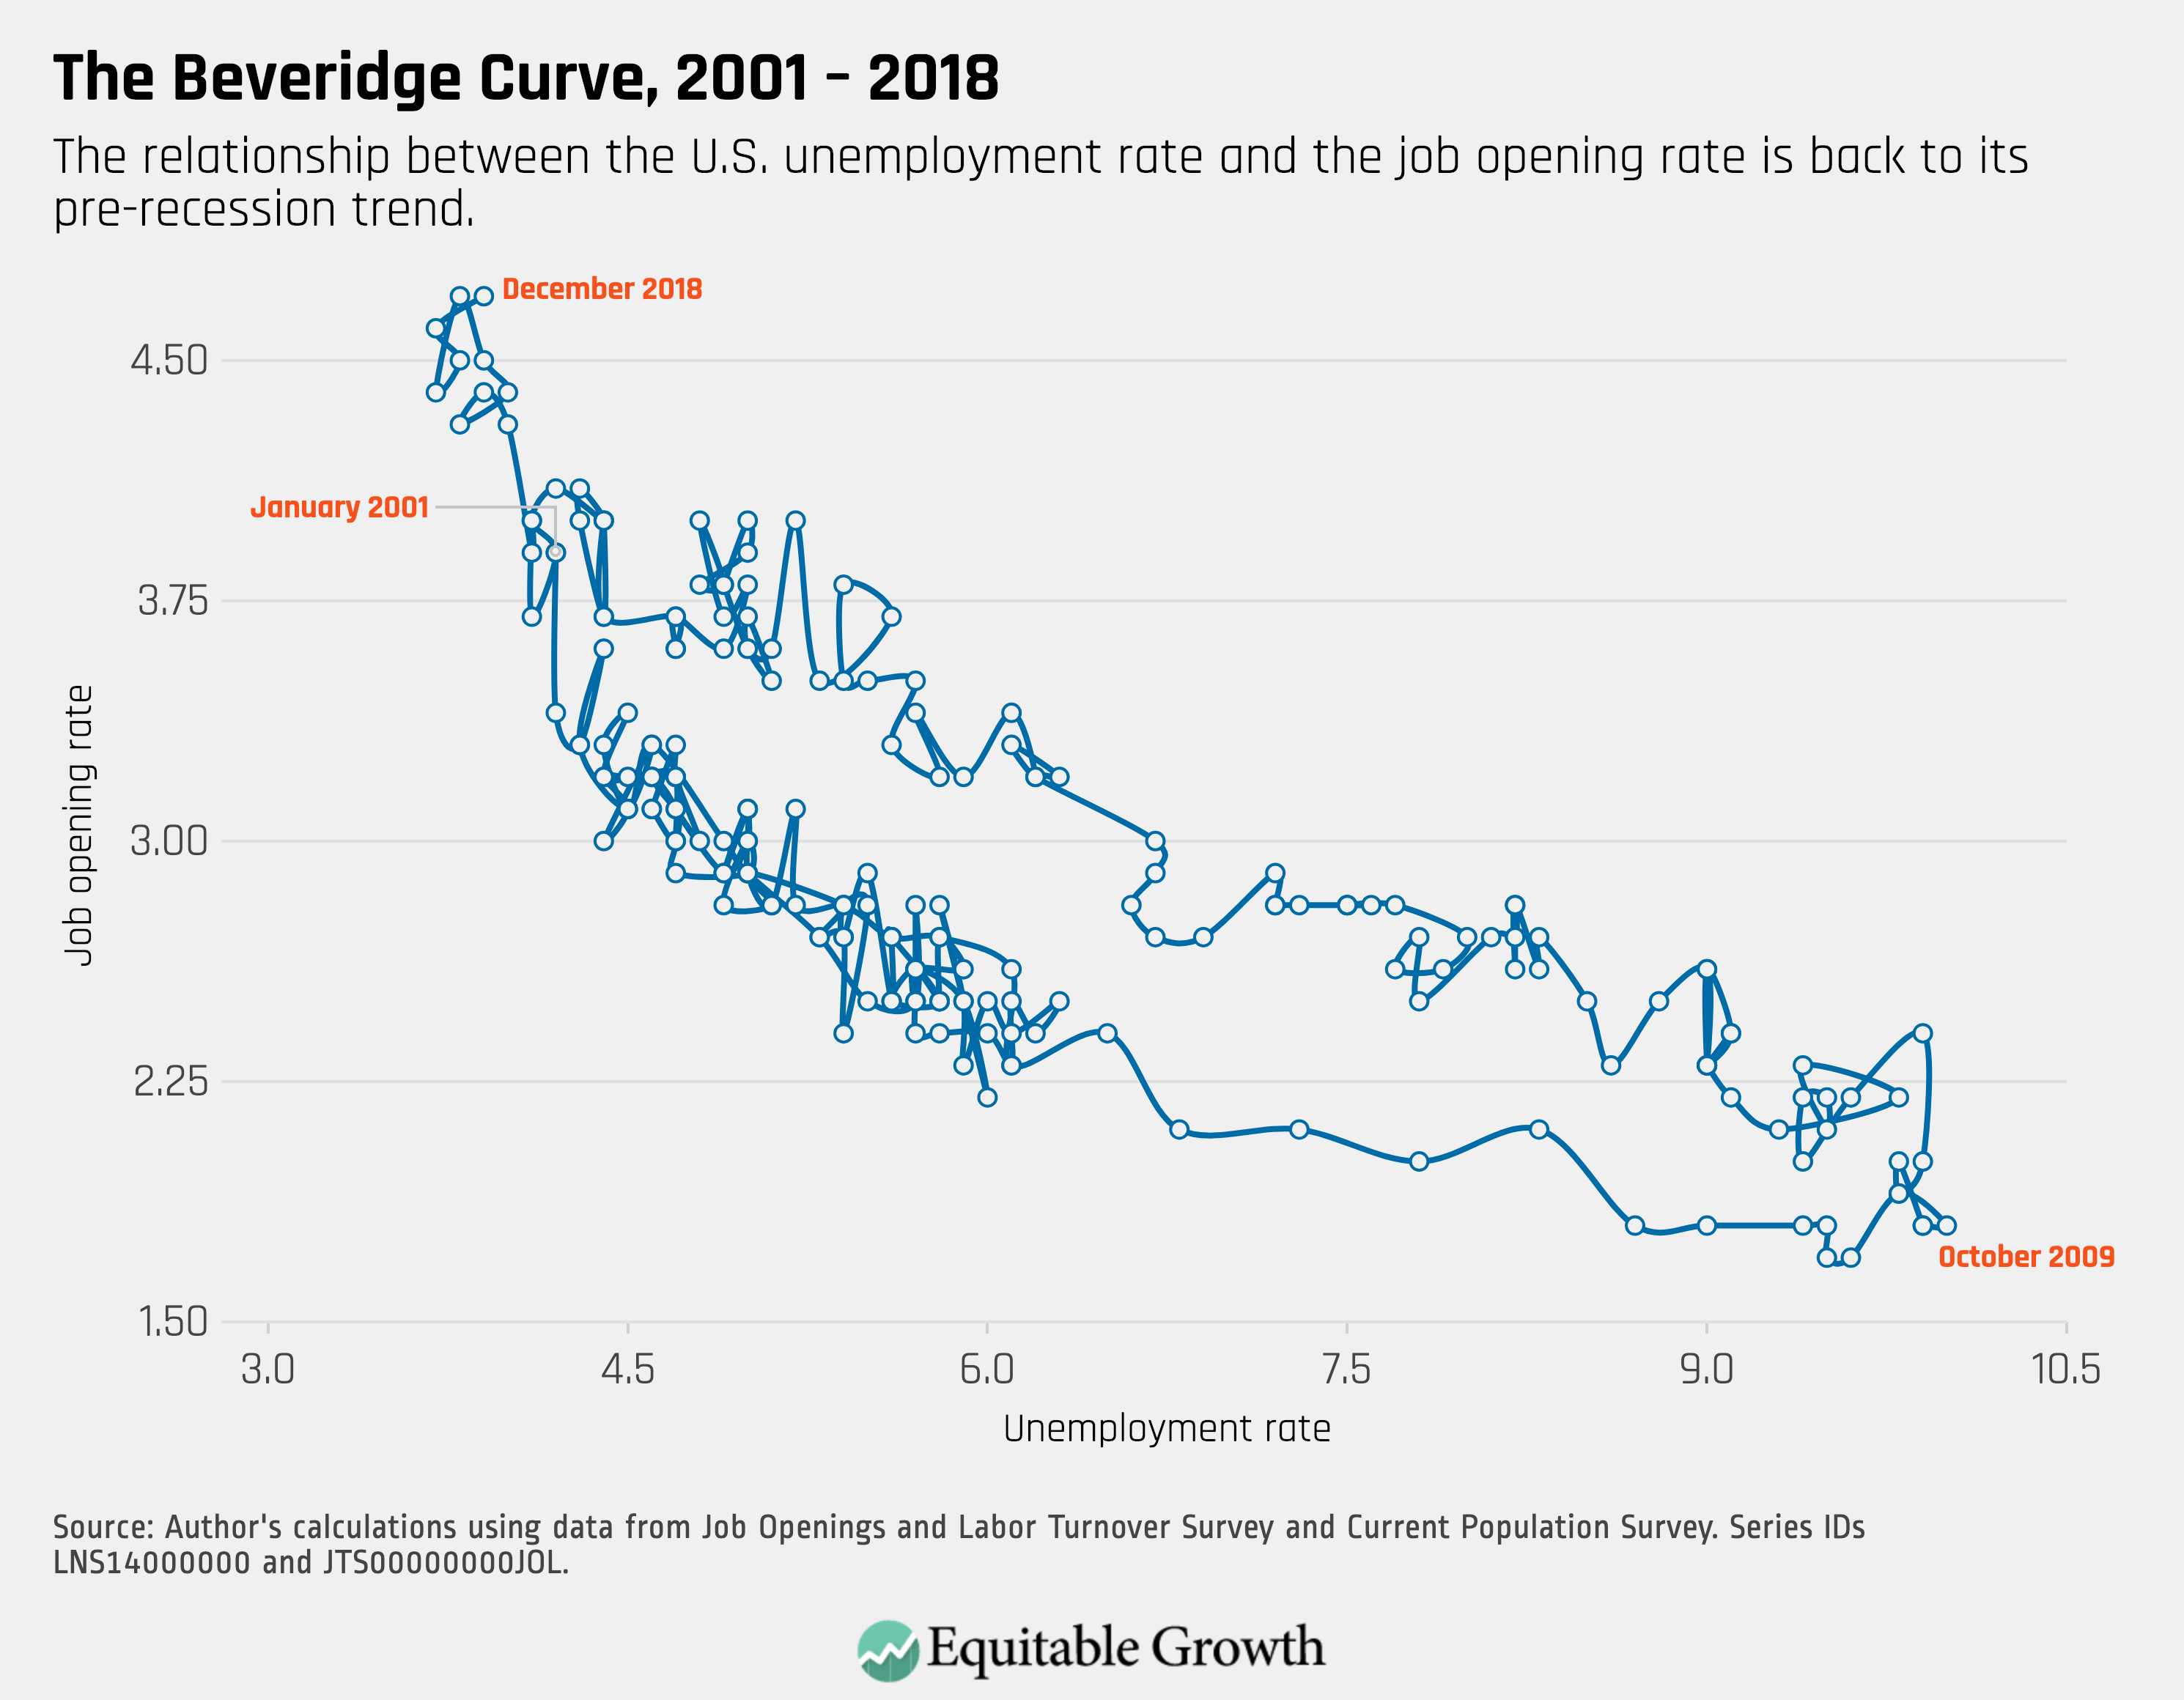
  1. In her column for The Hill, “Failed Tax-Cut Experiment in Kansas Should Guide National Leaders,” Heather Boushey attempts to make sense of the relative economic disaster that has been Kansas under its former governor, Sam Brownback (R). It is turning out to be rather hard to find convincing channels through which Gov. Brownback’s policies could plausibly and easily have had such disastrous relative effects on employment that we see were suffered by the Kansas economy over the past 8 years. I find myself wondering about whether it might have been the effect of Gov. Brownback’s waging an aggressive rhetorical culture war against many in, and many who might have moved to, Kansas: Telling lots of people in and out of Kansas that the governor and the power structure in that state does not want people who think well of places such as California and New York—and, in fact, would rather that they stayed in or moved to Colorado or Iowa or Missouri—is not something that is in our standard economic models. But perhaps it should be: Read Boushey’s column, in which she writes: “Sam Brownback’s failed “red state experiment” has truly come to an end … In 2012 and 2013, Republican Gov. Sam Brownback signed into law the largest tax cuts in Kansas history. The top state income tax rate fell by nearly one-third and passthrough taxes that affected mainly relatively wealthy individuals were eliminated. With the decline in revenues came significant spending cuts.”
  2. Another in what is now a large series of papers finding long-run impacts from state-run pre-Kindergarten programs comes from Equitable Growth grantee Mariana Zerpa, “Short and Medium Run Impacts of Preschool Education: Evidence from State Pre-K Programs.” Once again, the working paper finds that it is difficult to attribute such large effects to the standard channels. Yet effects of this size are likely to turn out to be robust, rather than due to chance variation or minor details of econometric specification. Thus, we are likely to have to reach for more sociological explanations. They may, perhaps, involve huge peer and cultural effects—for example, that policies did not only change the lives of those directly affected, but also changed hearts and minds in the broader community. Read Zerpa’s working paper, in which she writes: “I also provide a discussion of two local average treatment effects under different counterfactual childcare arrangements. I find implied effects that are very large, although not very different from the estimates found in the literature on Head Start. This finding highlights the relevance of estimating intention-to-treat effects on the full affected cohorts of children, which do not rely on any assumptions regarding who are the affected children, and particularly on whether there are any externalities on children that do not attend the programs. The relevance of externalities and peer effects in early childhood experience is an open question that is part of a promising research agenda.”

Worthy reads not from Equitable Growth:
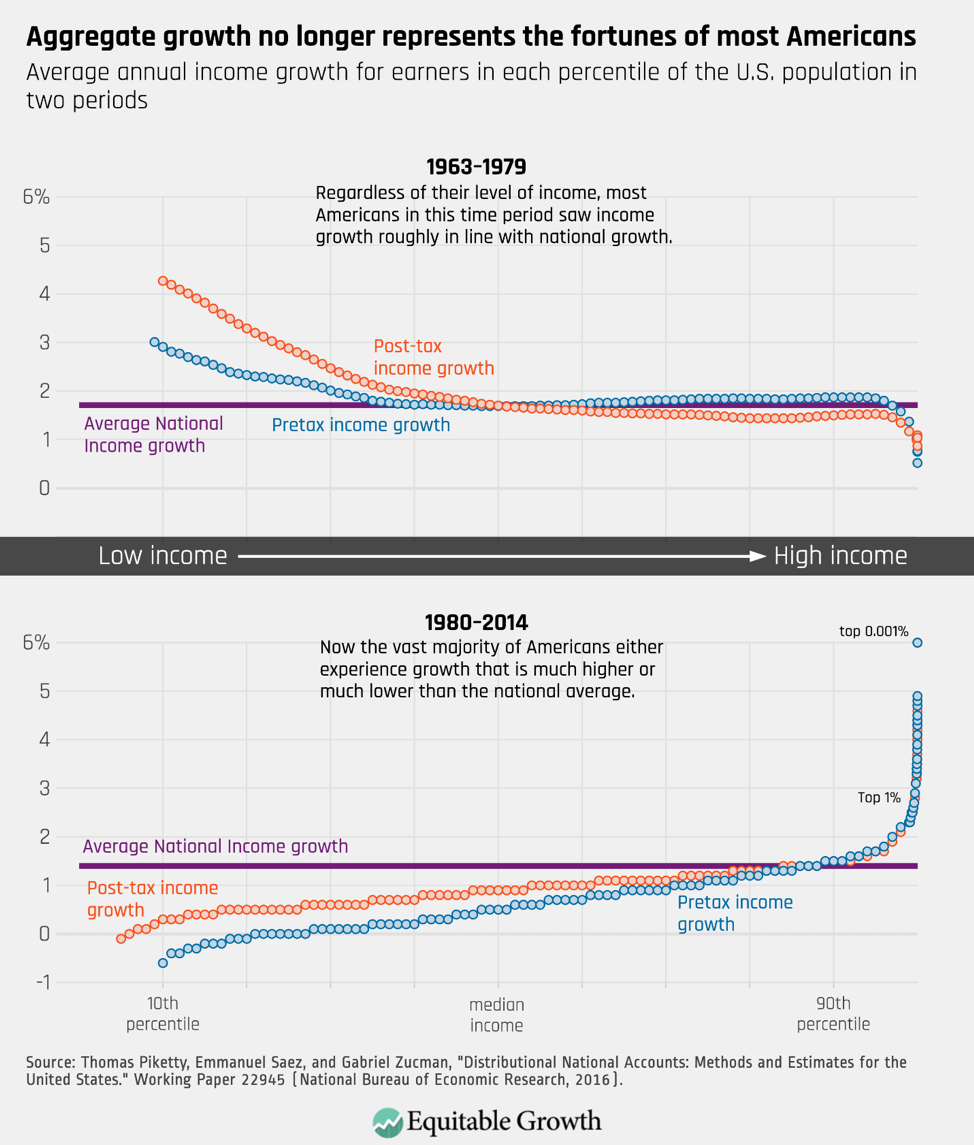
  1. This is an excellent paper about how the American feminist revolution supported rapid business-cycle recoveries in the1970s and 1980s, back when there was a huge reservoir of women who would take jobs but who had not previously held jobs only because of the lagging of social structure behind economic and cultural change—thus, increases in demand in recovery focused on this industrial reserve army could very easily and rapidly find good matches between unfilled jobs and unemployed workers. Read Masao Fukui, Emi Nakamura, and Jon Steinsson, “Women, Wealth Effects, and Slow Recoveries,” in which they write: “A female-biased shock generating a 1 percent increase in female employment leads to only a 0.15 percent decline in male employment (and this estimate is statistically insignificant). In other words, our estimates imply very little crowding out of men by women in the labor market … Seventy percent of the slowdown in recent business cycle recoveries can be explained by female convergence.
  2. Read Aline Bütikofer, Sissel Jensen, and Kjell G. Salvanes, “The Role of Parenthood on the Gender Gap Among Top Earners,” in which they write: “Recent literature argues that a ‘motherhood penalty’ is a main contributor to the persistent gender wage gap in the upper part of the earnings distribution. Using Norwegian registry data, this column studies the effect of parenthood on the careers of high-achieving women relative to high-achieving men in a set of high-earning professions. It finds that the child earnings penalty is substantially larger for mothers with an MBA or law degree than for mothers with a STEM or medical degree.”
  3. Read Antonio Fatas, “Global Rebalancing,” in which he writes: “Prior to the Global Financial Crisis the world economy experienced a period of increasing global imbalances … Today the world displays smaller imbalances than at the peak of 2008 but what it was more interesting is the extent to which rebalancing had happened between different country groups.”
  4. Read Andreas Beerli, Jan Ruffner, Michael Siegenthaler, and Giovanni Peri, “The Abolition of Immigration Restrictions and the Performance of Firms and Workers: Evidence from Switzerland,” in which they write: “We study a reform that granted European cross-border workers free access to the Swiss labor market. … Regions close to the border were affected more intensely and earlier. The greater availability of cross-border workers increased their employment but also wages and possibly employment of highly educated native workers although the new cross-border workers were also highly educated … the reform increased the size, productivity, innovation performance of some incumbent firms, attracted new firms, and created opportunities for natives to pursue managerial jobs.”
  5. Read Ramesh Ponnuru, “Recession Is a Far Larger Threat Than Inflation,” in which he writes: “We should use this moment of relative monetary calm to consider deeper questions, such as whether that target is the right one … The real failing of the current monetary regime is not that it generates too much inflation. We haven’t had ruinous levels of inflation since the early 1980s (something for which Volcker’s own chairmanship deserves great credit).”
  6. Read an excellent new paper by economist Mark Glick, “The Unsound Theory Behind the Consumer (and Total) Welfare Goal in Antitrust.”
  7. Read Noah Smith, “Trump’s Embrace of Tariffs Hurts U.S. Consumers More Than China,” in which he writes: “Trump’s goal of making the U.S. more competitive isn’t bad, but he needs to stop using bad tools. Tariffs … raise costs for American manufacturers and prices for American consumers. Tariff Man needs to cool his jets.”
Posted in Uncategorized

New Fed paper suggests it’s not all millennials’ fault after all

A new paper studies the mobility of millennials compared to Generation Xers and baby boomers, finding that while millennials are more educated than prior generations, they have lower incomes and fewer assets, as well as higher levels of student loan debt.

A commonly cited statistic about trends in absolute mobility over the past half-century is Harvard economist Raj Chetty and his co-authors’ finding that while more than 90 percent of people born in 1940 grew up to earn more than their parents—that is, they experienced upward mobility—the same was true of only about half of people born in 1980. This striking finding is echoed by a new discussion series paper by researchers at the Federal Reserve Board looking at how measures of millennials’ economic conditions compare to those of prior generations at similar ages.

Using data from the Panel Survey of Income Dynamics and the Current Population Survey’s Household Surveys, as well as the Pew Research Center’s definitions of millennials and other generations, the paper compares the income, assets, and debt of millennials (those born between 1981 and 1997) to Generation Xers (those born between 1965 and 1980) and baby boomers (those born between 1946 and 1964) at similar ages. It finds that “millennials tend to have lower income than members of earlier generations at comparable ages,” as well as fewer assets.

Specifically, average real (inflation-adjusted) labor earnings for men working full time were between 18 percent and 27 percent higher for Gen Xers and baby boomers, respectively, than millennials after controlling for demographic factors such as race and work status. In examining assets, the paper found that while the average value of assets held by millennials was more or less equivalent to that held by Gen Xers at a similar age, the median value of assets held by millennials ($55,000) was significantly lower than that of both Gen Xers and baby boomers at similar ages ($104,700 and $63,300, respectively). The fact that the average has held steady while the median has fallen suggests that the brunt of this downward mobility in assets has fallen more on those lower down on the distribution.

In examining debt, both the average and median debt held by millennials wasn’t dramatically different than that compared to Generation Xers overall—but not so the composition of that debt. Millennials are significantly less likely to have mortgage debt that Gen Xers at similar ages and significantly more likely to have student loan debt. “In 2004, 28 percent of Generation X members had a mortgage, well above the 19 percent share of millennials that had one in 2017,” according to the Fed report. Similarly, “While only 20 percent of Generation X members had a student loan balance in 2004, more than 33 percent of millennials had one in 2017,” says the report.

The increased prevalence of student loan balances on their own wouldn’t necessarily be concerning for millennials if the paper hadn’t also found the decline in income, which means this generation has less money to actually pay off that debt. Furthermore, because mortgage debt is less prevalent among millennials than among the immediately preceding generation, there is evidence suggesting that student loan debt is part of the reason that millennials are delaying homeownership—an asset that represents the bulk of wealth for most Americans.

What are the possible explanations for why millennials have lower incomes and fewer assets than did prior generations at similar ages? The authors conclude: “These balance sheet comparisons likely reflect, in part, the unfavorable labor and credit markets conditions that prevailed during the 2007–09 recession, some of which had prolonged effects.”

The Fed paper’s emphasis on the importance of the labor market conditions into which millennials graduated echoes the arguments made in my and my co-author Elisabeth Jacobs’ recent report, “Are today’s inequalities limiting tomorrow’s opportunities?” In the report, we lay out a framework for understanding the channels via which upward mobility can either be facilitated or impeded, arguing that while a great deal of attention is paid to factors that develop human capital such as education, more research is needed to understand how things such as prevailing labor market conditions can impede the deployment of that human capital.

Oftentimes, when seeking to understand or explain economic outcomes, researchers and policymakers place a great deal of emphasis on the importance of the development of human capital. Two examples of this focus are the emphasis on education and training to ensure that workers have the skills required in an increasingly global and technical marketplace. Certainly, education and training are crucial components of human capital and are key to ensuring workers are able to reach their full potential, but an emphasis on improving education alone as the policy solution to ensuring economic opportunity is insufficient. As the Fed paper discusses, each generation has been more educated than the one before it, and yet the most educated generation so far has lower incomes than prior generations—and more student loan debt to boot—at similar stages in their lives.

That’s why Jacobs and I argue that more attention is needed to how factors related to the deployment of human capital can help us understand how upward mobility and economic well-being are facilitated. As the Fed paper’s findings highlight, the labor market in which a generation first finds itself seeking employment can have profound implications for their economic conditions. There is extensive economic research finding that entering the labor market during recessions has deep and persistent effects on the earnings of those workers across their lifetimes.

The importance of labor markets rather than education for explaining economic outcomes is highlighted in a recent Equitable Growth working paper by University of California, Berkeley economist Jesse Rothstein, “Inequality of educational opportunity? Schools as mediators of the intergenerational transmission of income.” In it, Rothstein studies the intergenerational mobility differences for lower-income children growing up in areas where the gap in test scores is small between lower- and higher-income families. If education is a key driving force for intergenerational mobility, then one would expect to see the children from low-income families in communities with low gaps in test scores grow up to be more upwardly mobile, compared to those from areas with large test-score gaps between lower- and higher-income children. Yet his results find that children’s mobility outcomes aren’t dramatically different between low test-score gap areas and high test-score gap areas.

As Rothstein explains in a column for Equitable Growth about his working paper, these results suggest that, “There is little evidence that differences in the quality of primary, secondary, or postsecondary schools, or in the distribution of access to good schools, are a key mechanism driving variation in intergenerational mobility. The evidence instead points toward other factors influencing income inequality. In particular, labor markets seem to be quite important.”

Acquisition of human capital is, of course, a crucial factor to ensure people are as best prepared as possible to make the most of their potential. But the development of human capital is insufficient on its own to ensure that people experience upward mobility and economic well-being. Factors beyond their control—particularly the condition of the labor markets they find themselves in—play a significant role in their ability to fully deploy that potential. More attention needs to be paid to what the factors might be that impact that deployment of potential and what policies could ensure that upward mobility isn’t stymied by economic conditions outside of any individual’s control.

Posted in Uncategorized

New financial health survey shows that traditional metrics of economic growth don’t apply to most U.S. households’ incomes and savings

A new study shows that the traditional metrics of economic growth, such as GDP growth or stock market performance, don’t apply to most U.S. households by looking at the financial vulnerability of different segments of the U.S. population.

Headlines regarding the state of the U.S. economy often tout statistics that indicate robust economic expansion and a booming stock market. High Gross Domestic Product growth rates and low unemployment rates are important, but these single aggregate data points do not capture how economic growth is experienced by different people in very different ways. Similarly, a galloping stock market does not benefit all that many people because a majority of the population doesn’t own stocks.

Underscoring the importance of knowing who specifically benefits from a strong economy is a new survey by the Center for Financial Services Innovation, “U.S. Financial Health Pulse: 2018 Baseline Survey,” which takes aim at addressing this information deficit by disaggregating the data collected on U.S. households’ financial health and preparedness. The survey contains metrics that explain how the current economic expansion is being felt by various socioeconomic and demographic groups.

The Center, in collaboration with researchers at the University of Southern California’s Dornsife Center for Economic and Social Research, circulated the baseline survey to members of the university’s “Understanding America” study, which recruits participants using address-based sampling. Of the 6,161 panelists invited, 5,109 completed the survey, and 5,019 respondents were used to create the baseline survey sample. Questions asked revolved around the financial behavior of the respondents’ households, though the survey also collected the demographic data of individual respondents.

Their first survey, released last month, found that of the approximately 5,100 respondents, 55 percent are financially coping and 17 percent are financially vulnerable. Those in the “financially vulnerable” group are individuals “struggling with all, or nearly all, aspects of their financial lives,” while their counterparts in the “financially coping” category are those “struggling with some, but not necessarily all, aspects of their financial lives.” (See Figure 1, pulled from the report.)

Figure 1
Source: Center for Financial Services Innovation, “U.S. Financial Health Pulse: 2018 Baseline Survey” (2018), available at https://s3.amazonaws.com/cfsi-innovation-files-2018/wp-content/uploads/2018/11/20213012/Pulse-2018-Baseline-Survey-Results-11-16.18.pdf.

The financial health of individuals naturally depends in part on their income. Roughly 36 percent of respondents with a household income of $30,000 or less are financially vulnerable, compared to just 20 percent of respondents with household incomes between $30,000 and 60,000. But there are a variety of other factors that affect financial health. The study shows that 78 percent of respondents between the ages of 18 and 25 are financially coping, while 13 percent are vulnerable. But for those between the ages of 26 and 35 who responded to the survey, 57 percent are financially coping, while 19 percent are financially vulnerable.

The results also address economic outcomes by race and ethnicity. The survey finds that 68 percent of Native Americans, regardless of income, are financially coping and 24 percent are financially vulnerable. Similarly, 58 percent of African Americans are coping, while 24 percent are vulnerable. These percentages drop for white, non-Hispanic respondents, where 52 percent are coping and only 15 percent are vulnerable. (See Figure 2, pulled from the report).

Figure 2
Source: Center for Financial Services Innovation, “U.S. Financial Health Pulse: 2018 Baseline Survey” (2018), available at https://s3.amazonaws.com/cfsi-innovation-files-2018/wp-content/uploads/2018/11/20213012/Pulse-2018-Baseline-Survey-Results-11-16.18.pdf.

Respondents to the survey were more likely to be financially vulnerable if they were less well-educated. Thirty percent of respondents with less than a high school degree are financially vulnerable, but only 7 percent of those with a bachelor’s degree fall into this category.

Poor financial health in a good economy can have effects on the ability of individuals to save in preparation for emergencies or negative income shocks. The survey suggests that many Americans are shockingly unprepared for emergencies. Approximately 45 percent of those who are financially vulnerable said that if they had to live off the savings they had readily available, without withdrawing from retirement accounts or taking out a loan, they would survive less than a week. This could be because only 2 percent of financially vulnerable respondents said they were actively saving in a checking account, and only 6 percent were actively saving in a savings account. There is a $3,200 difference in the total median value of liquid savings accounts between financially coping and financially vulnerable respondents.

Many households also find themselves behind in saving for retirement. Approximately 42 percent of survey respondents have no retirement savings, while 75 percent of financially vulnerable respondents are not confident in their ability to meet their long-term savings goals. The median value of a financially vulnerable individual’s retirement account is $4,000, whereas the median value for a financially healthy individual is around $106,000.

These savings and retirements findings underscore that we should approach the glut of good news about the aggregate growth of the U.S. economy cautiously. Even amid a strong economy, when savings are poor, small downturns in the labor market can lead to crisis for many households and can result in widespread economic problems.

Posted in Uncategorized

Investments in early childhood education improve outcomes for program participants—and perhaps other children too

A new working paper examines the benefits, and the longevity of the benefits, of expanding and implementing universal pre-Kindergarten programs in the United States.

According to a growing body of empirical work, governments that spend money on early childhood education get a lot of bang for their buck—an estimated 7 percent to 10 percent annual return for programs targeted at disadvantaged children. Research by University of Chicago economist James Heckman and Princeton economist and Equitable Growth Steering Committee member Janet Currie found strong evidence that early childhood education results not only in substantial short-term boosts in test scores but also long-term improvements in human capital and earnings. But do those test-score gains last? A handful of studies on individual early childhood programs in recent years have reached mixed conclusions on the durability of test score improvements from early childhood education over time.

Mariana Zerpa, an Equitable Growth grantee and an economist at the University of Leuven in Belgium, addresses this question in a new Equitable Growth working paper. Zerpa constructs the largest and most representative dataset of targeted and universal state preschool programs in the United States, using individual-level data from the Current Population Survey and the National Health Interview Survey to analyze the short- and medium-term effects of early childhood education on academic outcomes. Zerpa compares 15 states that implemented or expanded early childhood programs between 1997 and 2005 to states where programs were not implemented during this period. While previous research has analyzed data on specific programs, Zerpa’s is the first to include such a wide and representative array of targeted and universal state-level programs.

Zerpa finds that children in states with early childhood education programs are 30 percent less likely to repeat a grade between ages 6 and 8—and that this effect lasts at least until age 12. Pre-Kindergarten programs also substantially reduce the probability of developmental and behavioral problems for children between ages 4 and 8, with approximately 60 percent of the effect sustained through age 12. Though the study uncovers one potential negative effect of early childhood programs—that pre-K expansions are associated with an average increase of 0.6 days in absences from school due to illness—this small effect disappears after 4 years. Furthermore, while Zerpa finds that universal programs result in greater “crowd-out” via switching from private to public preschools, she does not find statistically significant differences in the effects of the two categories of programs—in contrast to previous research finding universal programs to be more effective.

In addition to using her combined dataset to examine outcomes for all children ages 4 to 12 who live in states with pre-K programs, Zerpa also incorporates Current Population Survey data on individual pre-K enrollment to drill down and focus on the subset of children who participated in early childhood programs. In this secondary analysis, Zerpa again finds large, statistically significant improvements in academic—as well as developmental—outcomes for children who participated in early childhood education. The Current Population Survey data does not measure which specific pre-K programs students take part in, so Zerpa calculates ranges (instead of precise estimates) for the effect of enrolling in a state pre-K program.

Zerpa estimates that participation in a state early childhood program could reduce the likelihood of grade repetition between ages 6 and 8 by 13 percentage points to 34 percentage points for children who otherwise would not have been in center-based preschool. Zerpa hypothesizes that the large size of this effect reflects the fact that students who enroll in early childhood education programs from informal home care have particularly high risks of grade repetition, as they are more likely to be economically disadvantaged. Furthermore, this finding is consistent with several studies whose estimated impacts of preschool programs such as Head Start fall squarely within the intervals Zerpa calculates.

In addition to addressing a pressing question in the economic literature on early childhood education—do academic gains from early childhood education last?—Zerpa’s paper confirms that pre-Kindergarten programs are a worthwhile investment with direct and indirect returns lasting at least 8 years after preschool. Specifically, Zerpa demonstrates that pre-K expansions durably reduce grade repetition, as well as the occurrence of developmental and behavioral problems, for at least 8 years for the cohort of children who enroll in pre-K at age 4.

Taken as a whole, the magnitude of Zerpa’s findings indicates that state early childhood programs might have effects not only on children who otherwise would not have attended preschool, but also on children drawn from other, lower-quality preschools and even on other children who don’t attend preschool at all via peer effects. These results represent a powerful message to state policymakers considering expanding or creating early childhood programs.

While Zerpa’s paper presents more evidence of the positive effects of pre-K expansions, it also raises additional questions on the mechanisms through which these effects operate. To better understand the long-term effects of preschool on children and the associated savings for taxpayers, researchers need data tracking the educational and labor market outcomes for program participants across the course of their lives. Moreover, to separate out the direct and indirect effects of these programs, researchers also need data that tracks the outcomes of the siblings, future classmates, and other peers of program participants. While this will be a substantial undertaking, policymakers at all levels should work with researchers to make these data available for statistical analysis.

Previous research by former Equitable Growth economist Robert Lynch and former Research Analyst Kavya Vaghul has found that the aggregate benefits of early childhood programs more than cover their costs over time. If confirmed, the peer effects Zerpa references could result in even greater improvements in educational, developmental, and labor market outcomes for children—and thus even greater savings for society as whole.

Posted in Uncategorized