JOLTS Day Graphs: October 2018 Report Edition
Every month the U.S. Bureau of Labor Statistics releases data on hiring, firing, and other labor market flows from the Job Openings and Labor Turnover Survey, better known as JOLTS. Today, the BLS released the latest data for October 2018. This report doesn’t get as much attention as the monthly Employment Situation Report, but it contains useful information about the state of the U.S. labor market. Below are a few key graphs using data from the report.
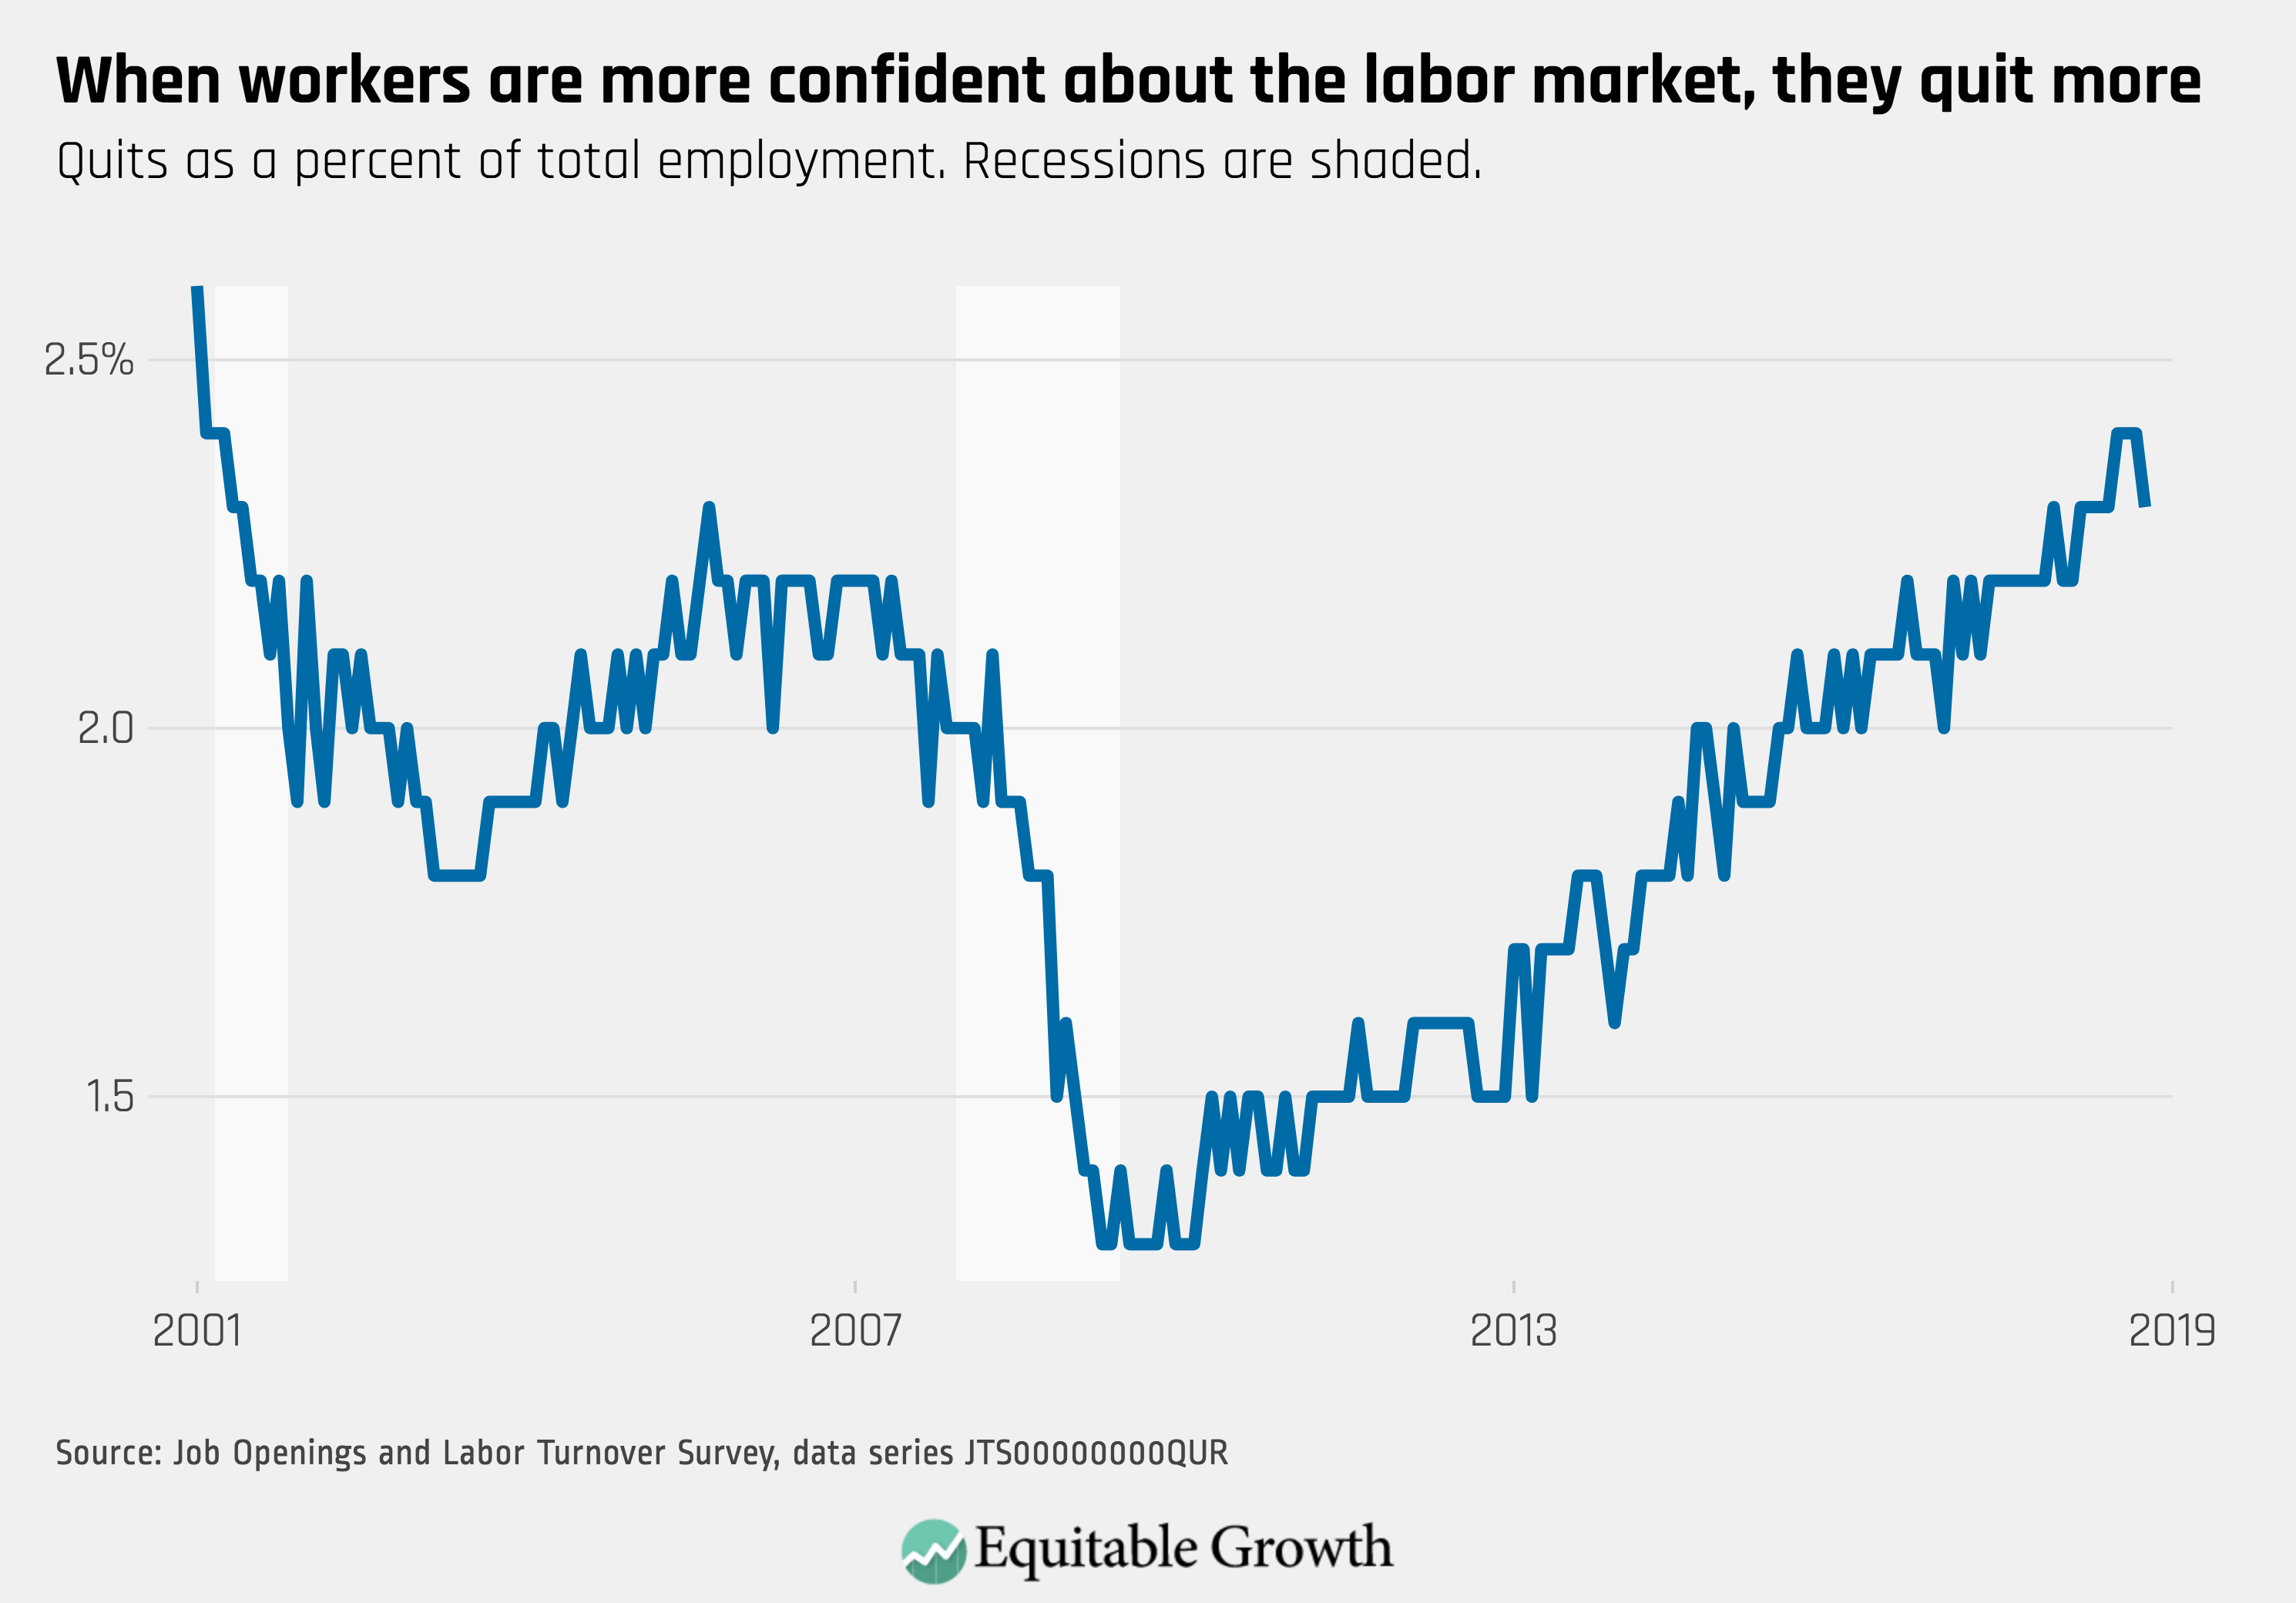
1.
The quit rate remained high at 2.3%, above levels in the previous expansion, demonstrating continued worker confidence in the labor market.
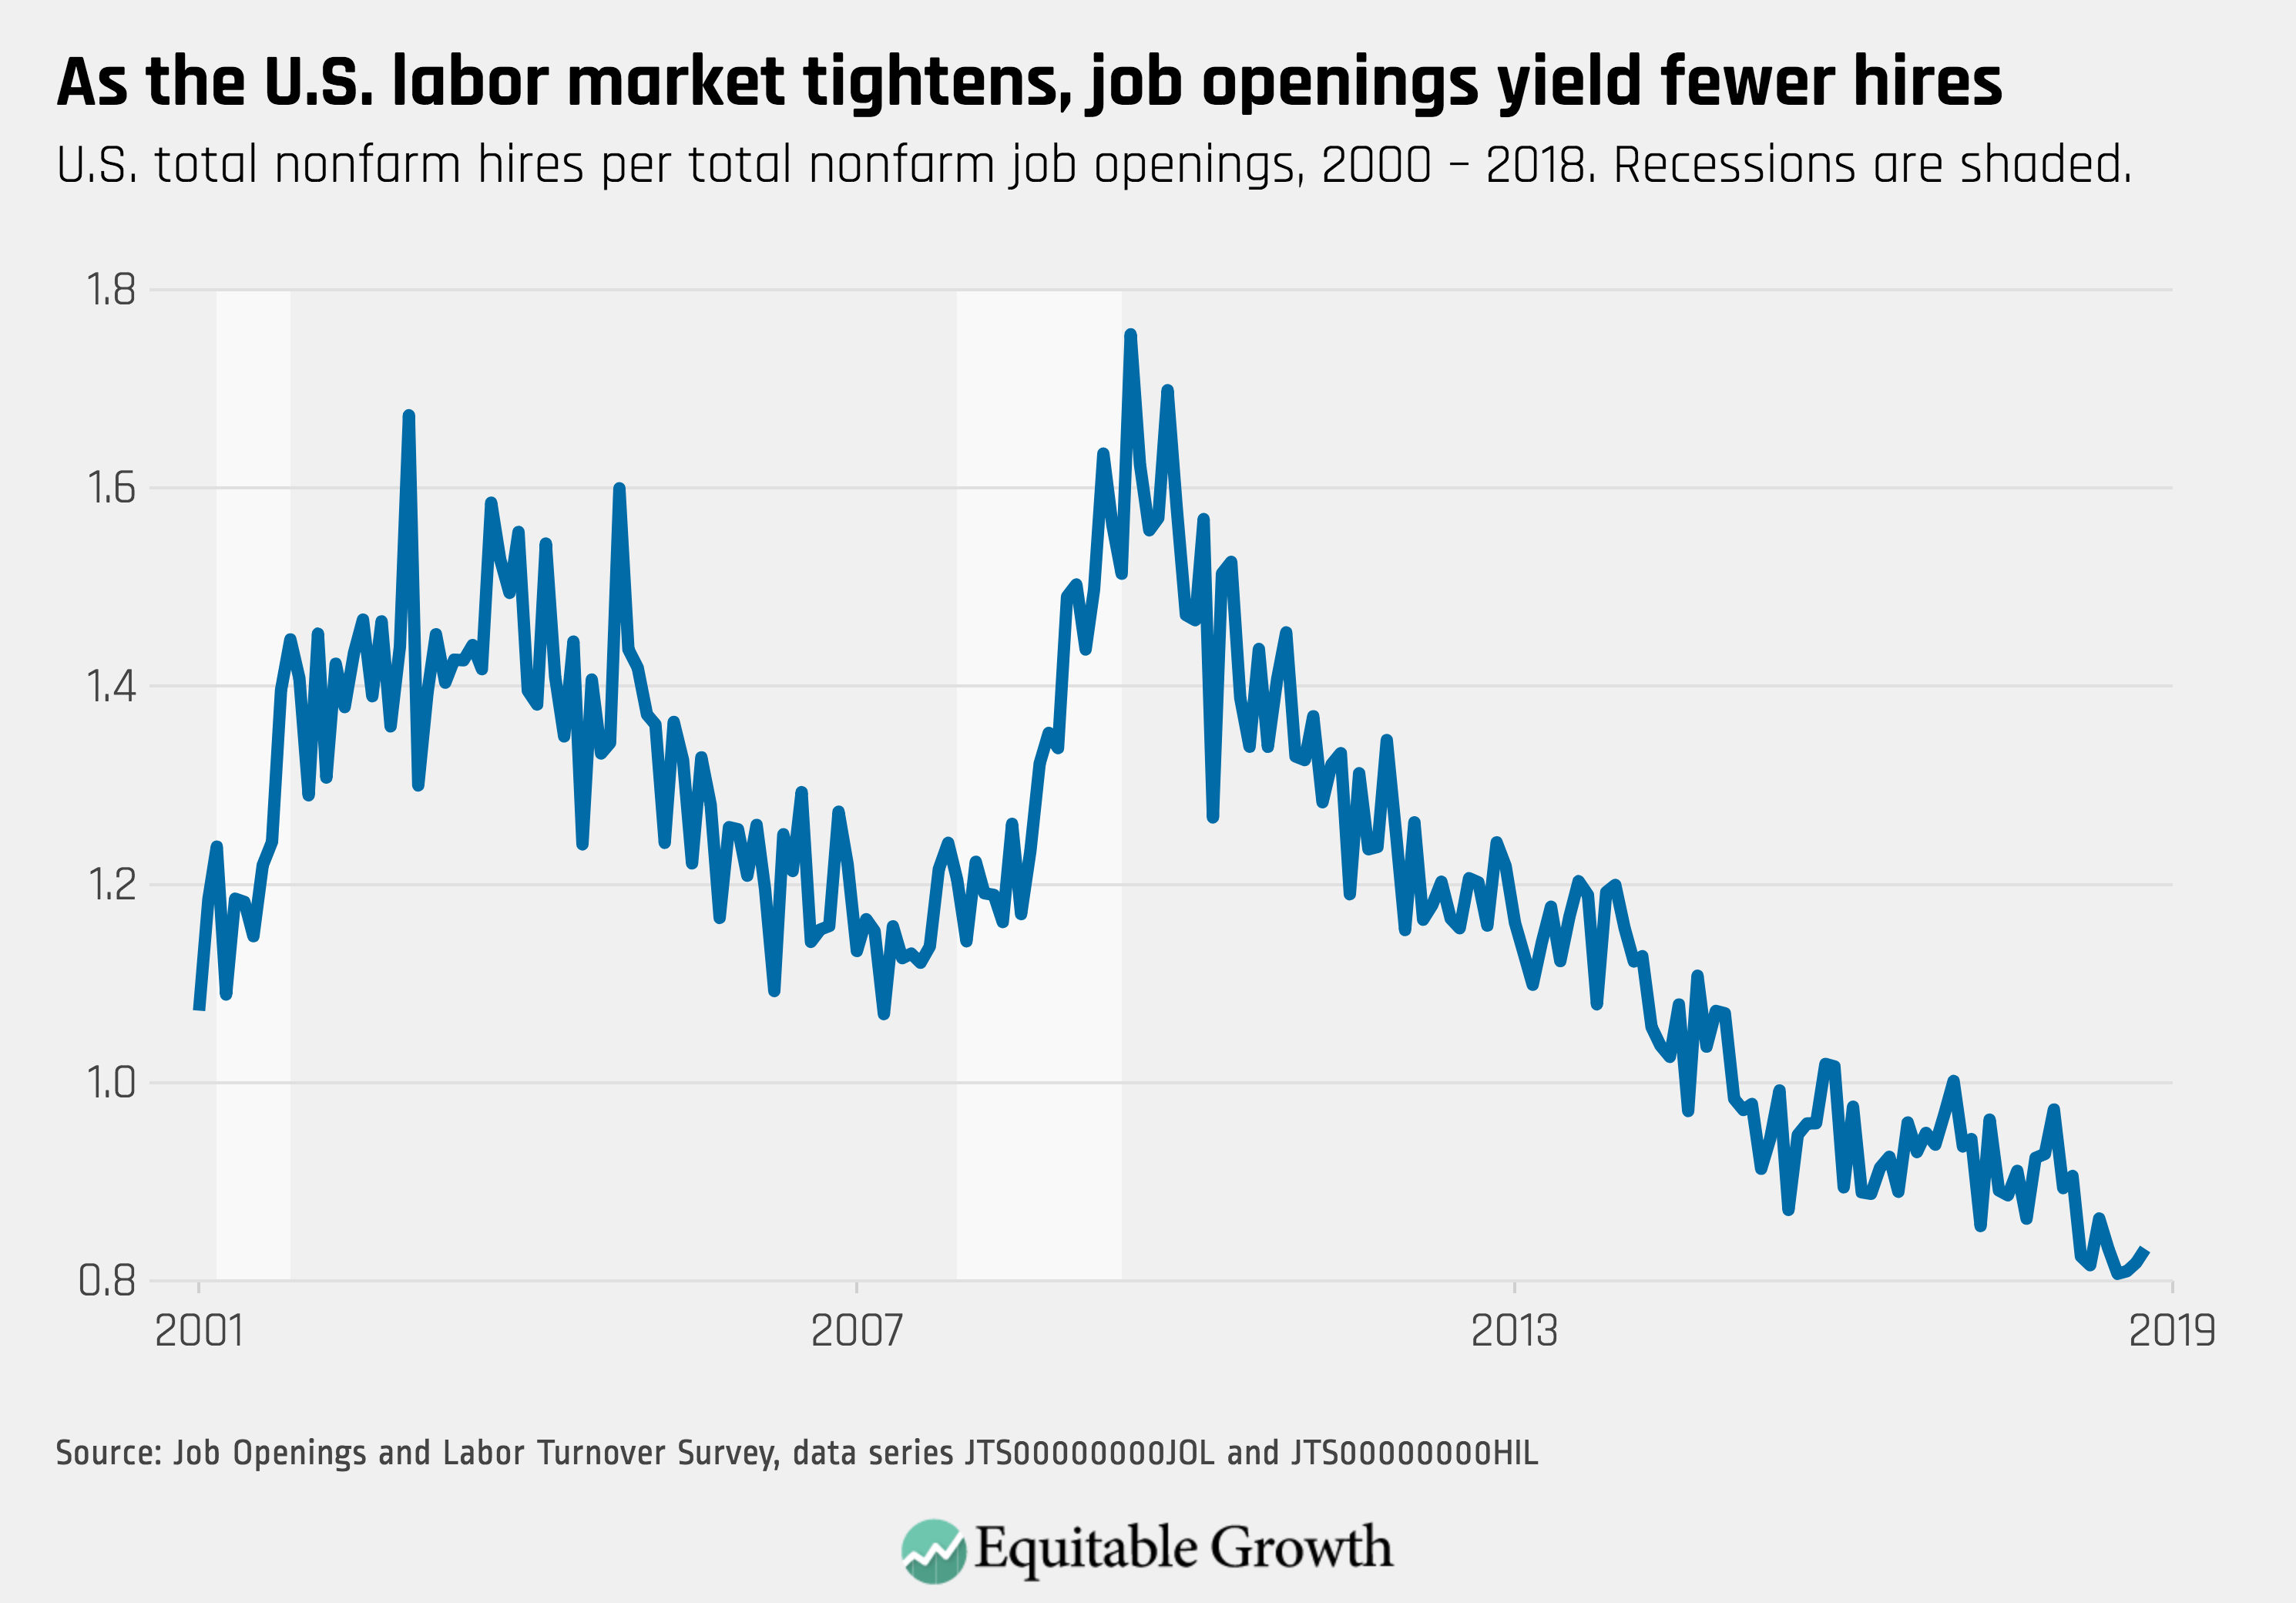
2.
The vacancy yield is at historic lows, below the levels of the full employment economy in the year 2000.
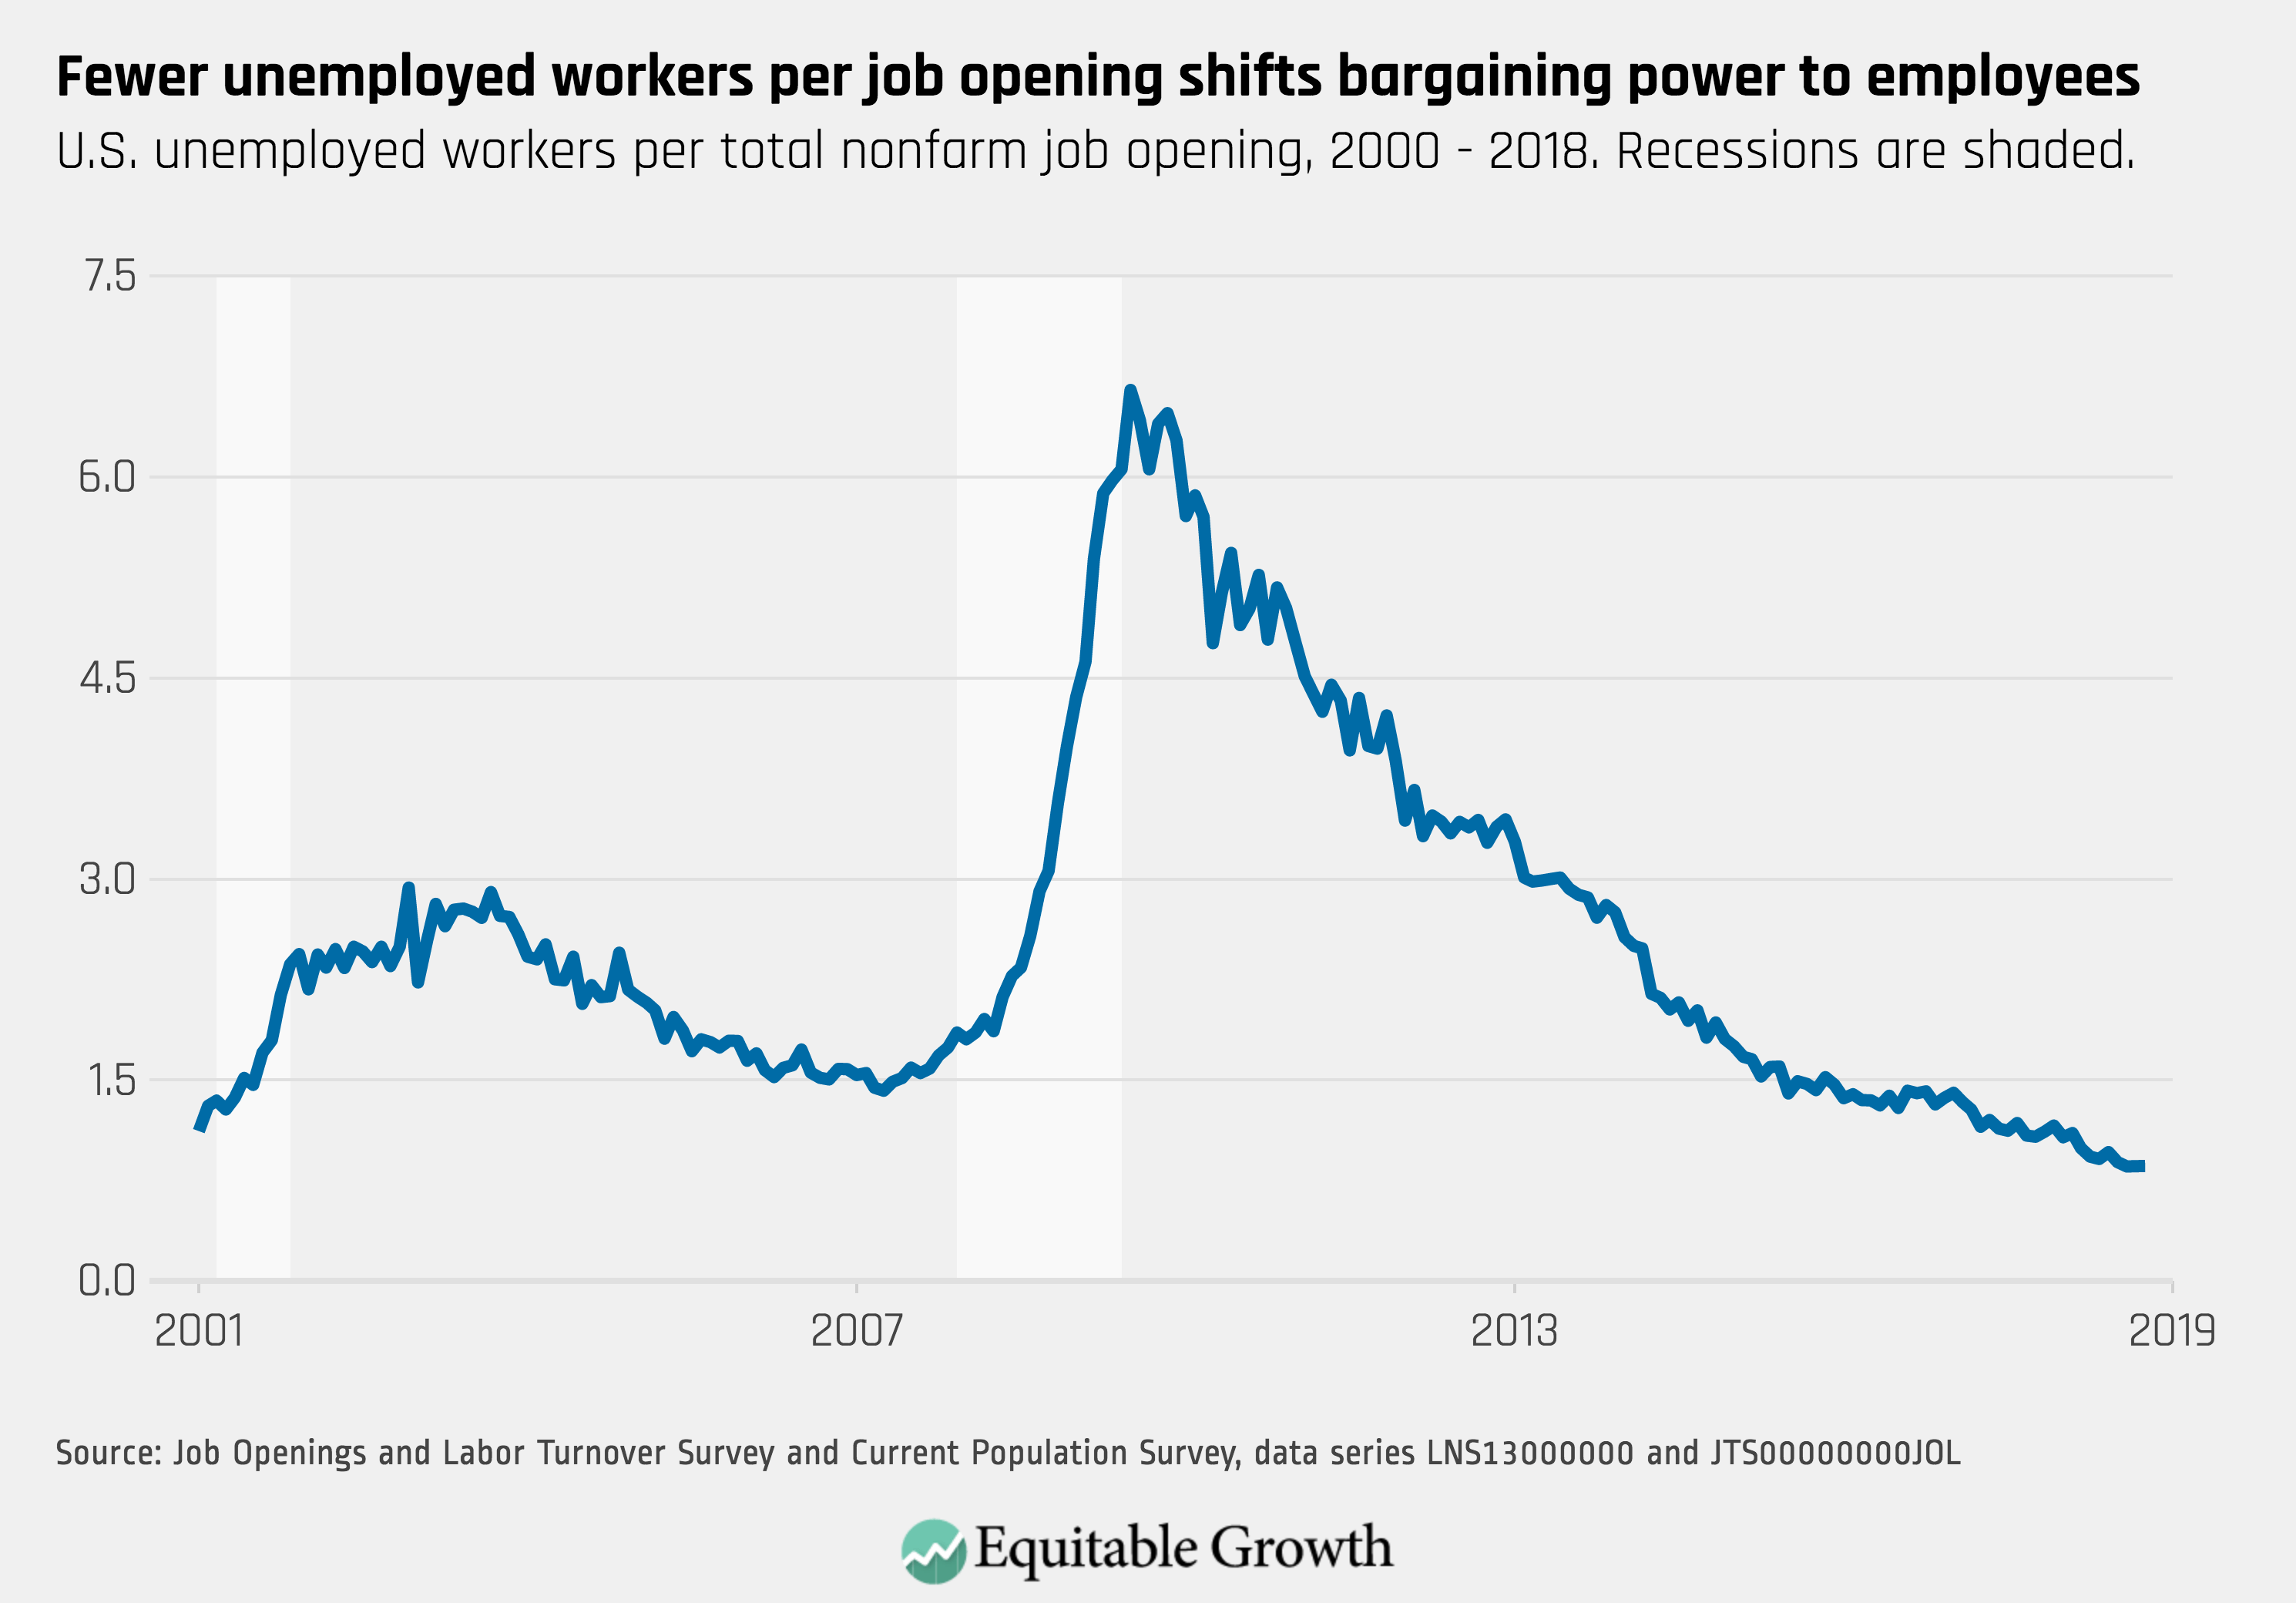
3.
The unemployment-per-job openings ratio continues its downward trend, with fewer unemployed workers actively seeking a job than the number job openings.
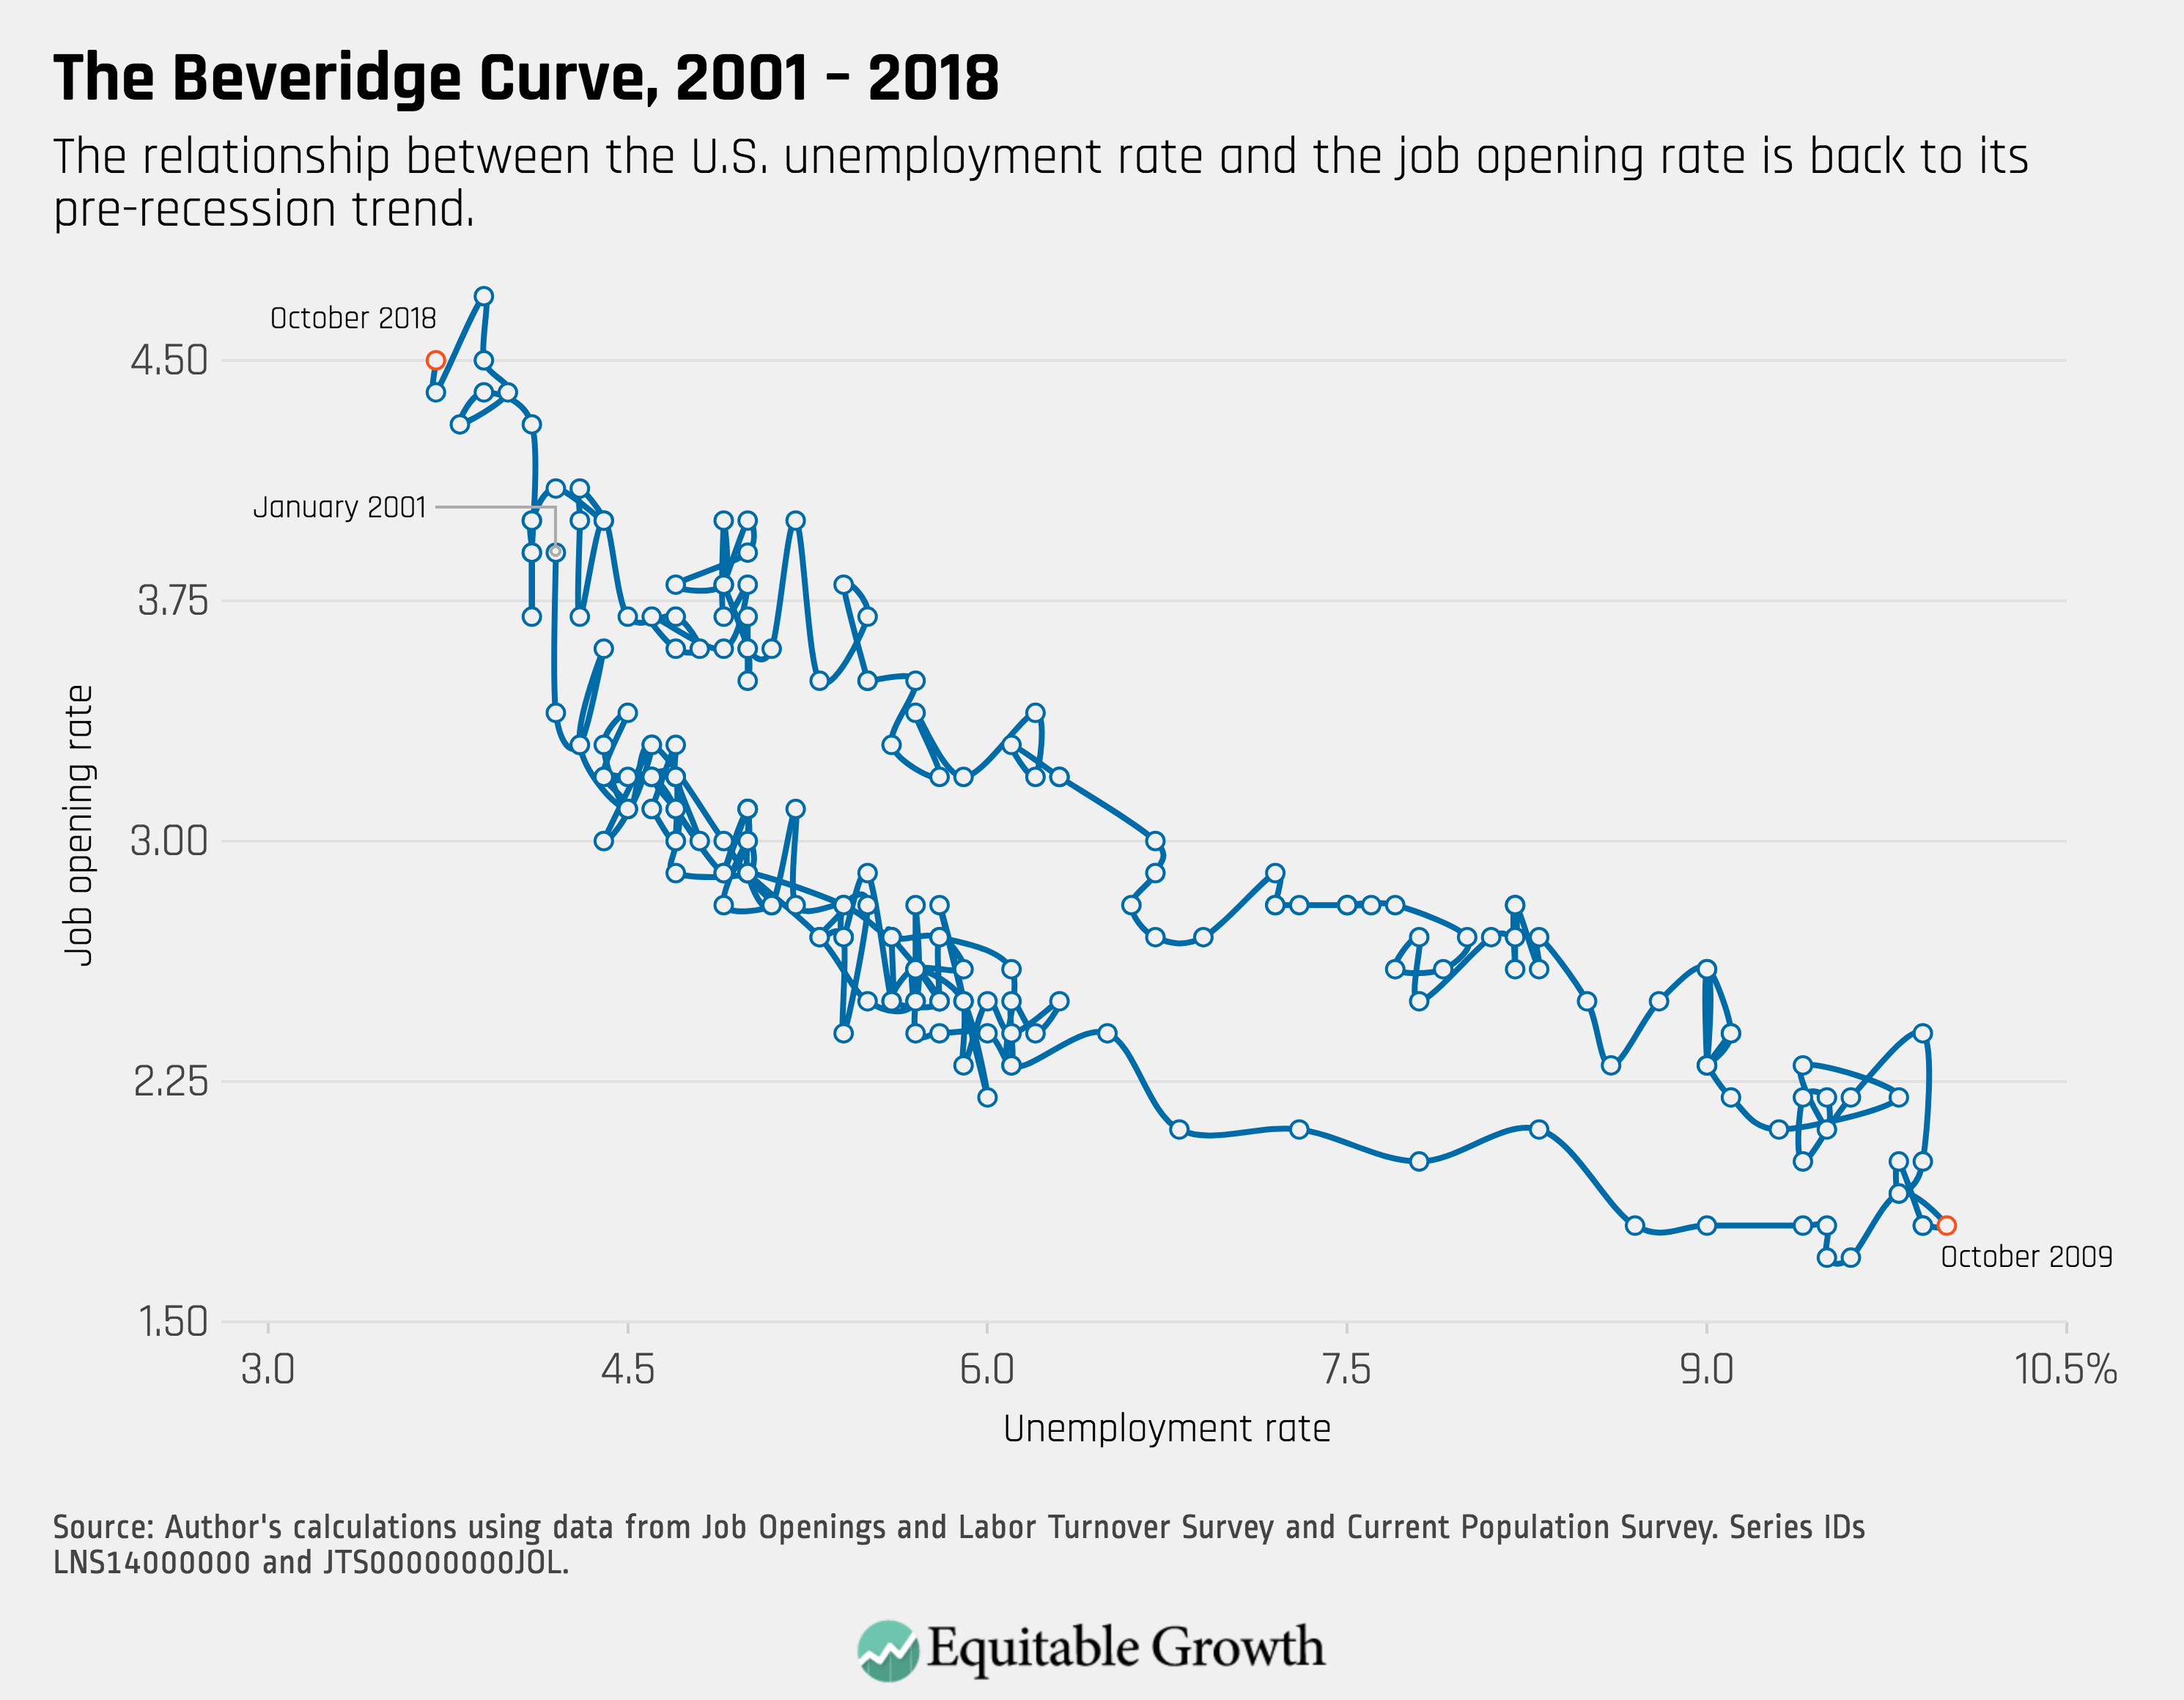
4.
The Beveridge Curve is little changed for October, representing a tight labor market.