This is a weekly post we publish on Fridays with links to articles that touch on economic inequality and growth. The first section is a round-up of what Equitable Growth published this week and the second is the work we’re highlighting from elsewhere. We won’t be the first to share these articles, but we hope by taking a look back at the whole week, we can put them in context.
Equitable Growth round-up
Equitable Growth Policy Director Alyssa Fisher penned a blog this week on the importance of increasing IRS funding to reduce tax evasion, especially among the ultra-wealthy. For one example of misplaced priorities, Alyssa points out the that recipients of the Earned Income Tax Credit in 2017 were twice as likely to get audited as families with earnings between $200,000 and $500,000. She concludes by calling for action by Congress and the Trump administration to increase funding for enforcement—particularly in light of the bipartisan understanding that spending on enforcement efforts ends up saving money by bringing in more revenue to the government, especially from the wealthiest taxpayers.
A study on “killer acquisitions” by London Business School economist Colleen Cunningham along with Yale University economists Florian Ederer and Song Ma was added to Equitable Growth’s working paper series. The three authors develop a model for acquisitions in which an existing firm acquires an innovative startup in order to neutralize competition. Using data from the pharmaceutical industry, they confirm this theory by showing that acquired drug projects are less likely to come to fruition when they are potential competitors for one of the existing drugs produced by the acquiring firm.
In his weekly “Worthy Reads” column, University of California, Berkeley economist and Equitable Growth columnist Brad Delong highlights recent research and writing in economics from Equitable Growth and other scholars. This week, Brad highlights Equitable Growth economist Greg Leiserson’s primer on the importance of distributional tables in analyzing the impact of tax reforms as well as my review of economist Mariana Zerpa’s study on the direct and potential spillover effects of early childhood education. Brad also points to recent writing on political economy from law professor Brishen Rogers and links it to previous path-breaking work on the symbiotic relationship between the market and the state by political economists Timothy Besley and Torsten Persson.
Links from around the web
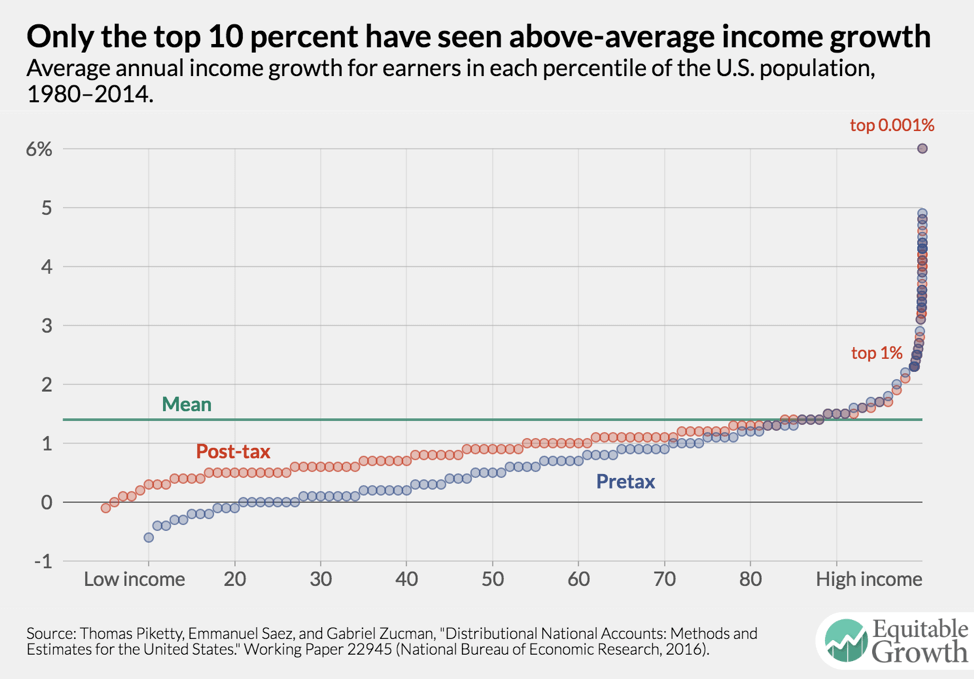
David Harrison at The Wall Street Journal broke the news this week that the Bureau of Economic Analysis would begin releasing distributional data that illustrates how economic growth is distributed among people with different incomes. This decision follows years of research and advocacy for better measures of economic inequality by Equitable Growth computational social scientist Austin Clemens, executive director and chief economist Heather Boushey, and other scholars. Harrison points out that the BEA’s decision would help confirm work by Equitable Growth Steering Committee member Emmanuel Saez and Equitable Growth grantee Gabriel Zucman, both economists at Berkeley, that the vast majority of income growth over the past decades has been concentrated among the richest families in the United States. [wsj]
The Economist delved into data on the extent and causes of income inequality across OECD countries. Specifically, the authors compare pre-tax and post-tax levels of inequality and note that the United States particularly stands out for its high levels of income inequality before taxes. The upshot of this finding is that in addition to creating a fairer tax system, policymakers must work to address other structural features in the U.S. economy, including wage inequality, a lack of competition between firms, and insufficient economic security for many families. [economist]
Moving beyond anonymous tax data, Binyamin Appelbaum made the case in The New York Times that all tax returns should be made available to the general public. He highlights research by former Equitable Growth Steering Committee member and Harvard University economist Raj Chetty as an important example of how this data can shed light on how the economy works—and how it is not working for so many Americans. Furthermore, Appelbaum argues that full disclosure would help reduce political corruption, fraud, tax evasion, and economic inequality. [nyt]
University of Chicago economist Bruce Meyer and Charles University economist Nikolas Mittag released a working paper this week on the advantages of linking administrative and survey data to better understand income inequality in the United States. Specifically, they show that doing so can increase the accuracy of income and poverty measurements in the U.S. Census Bureau’s Current Population Survey, and they provide suggestions for other researchers interested in applying this method. [nber]
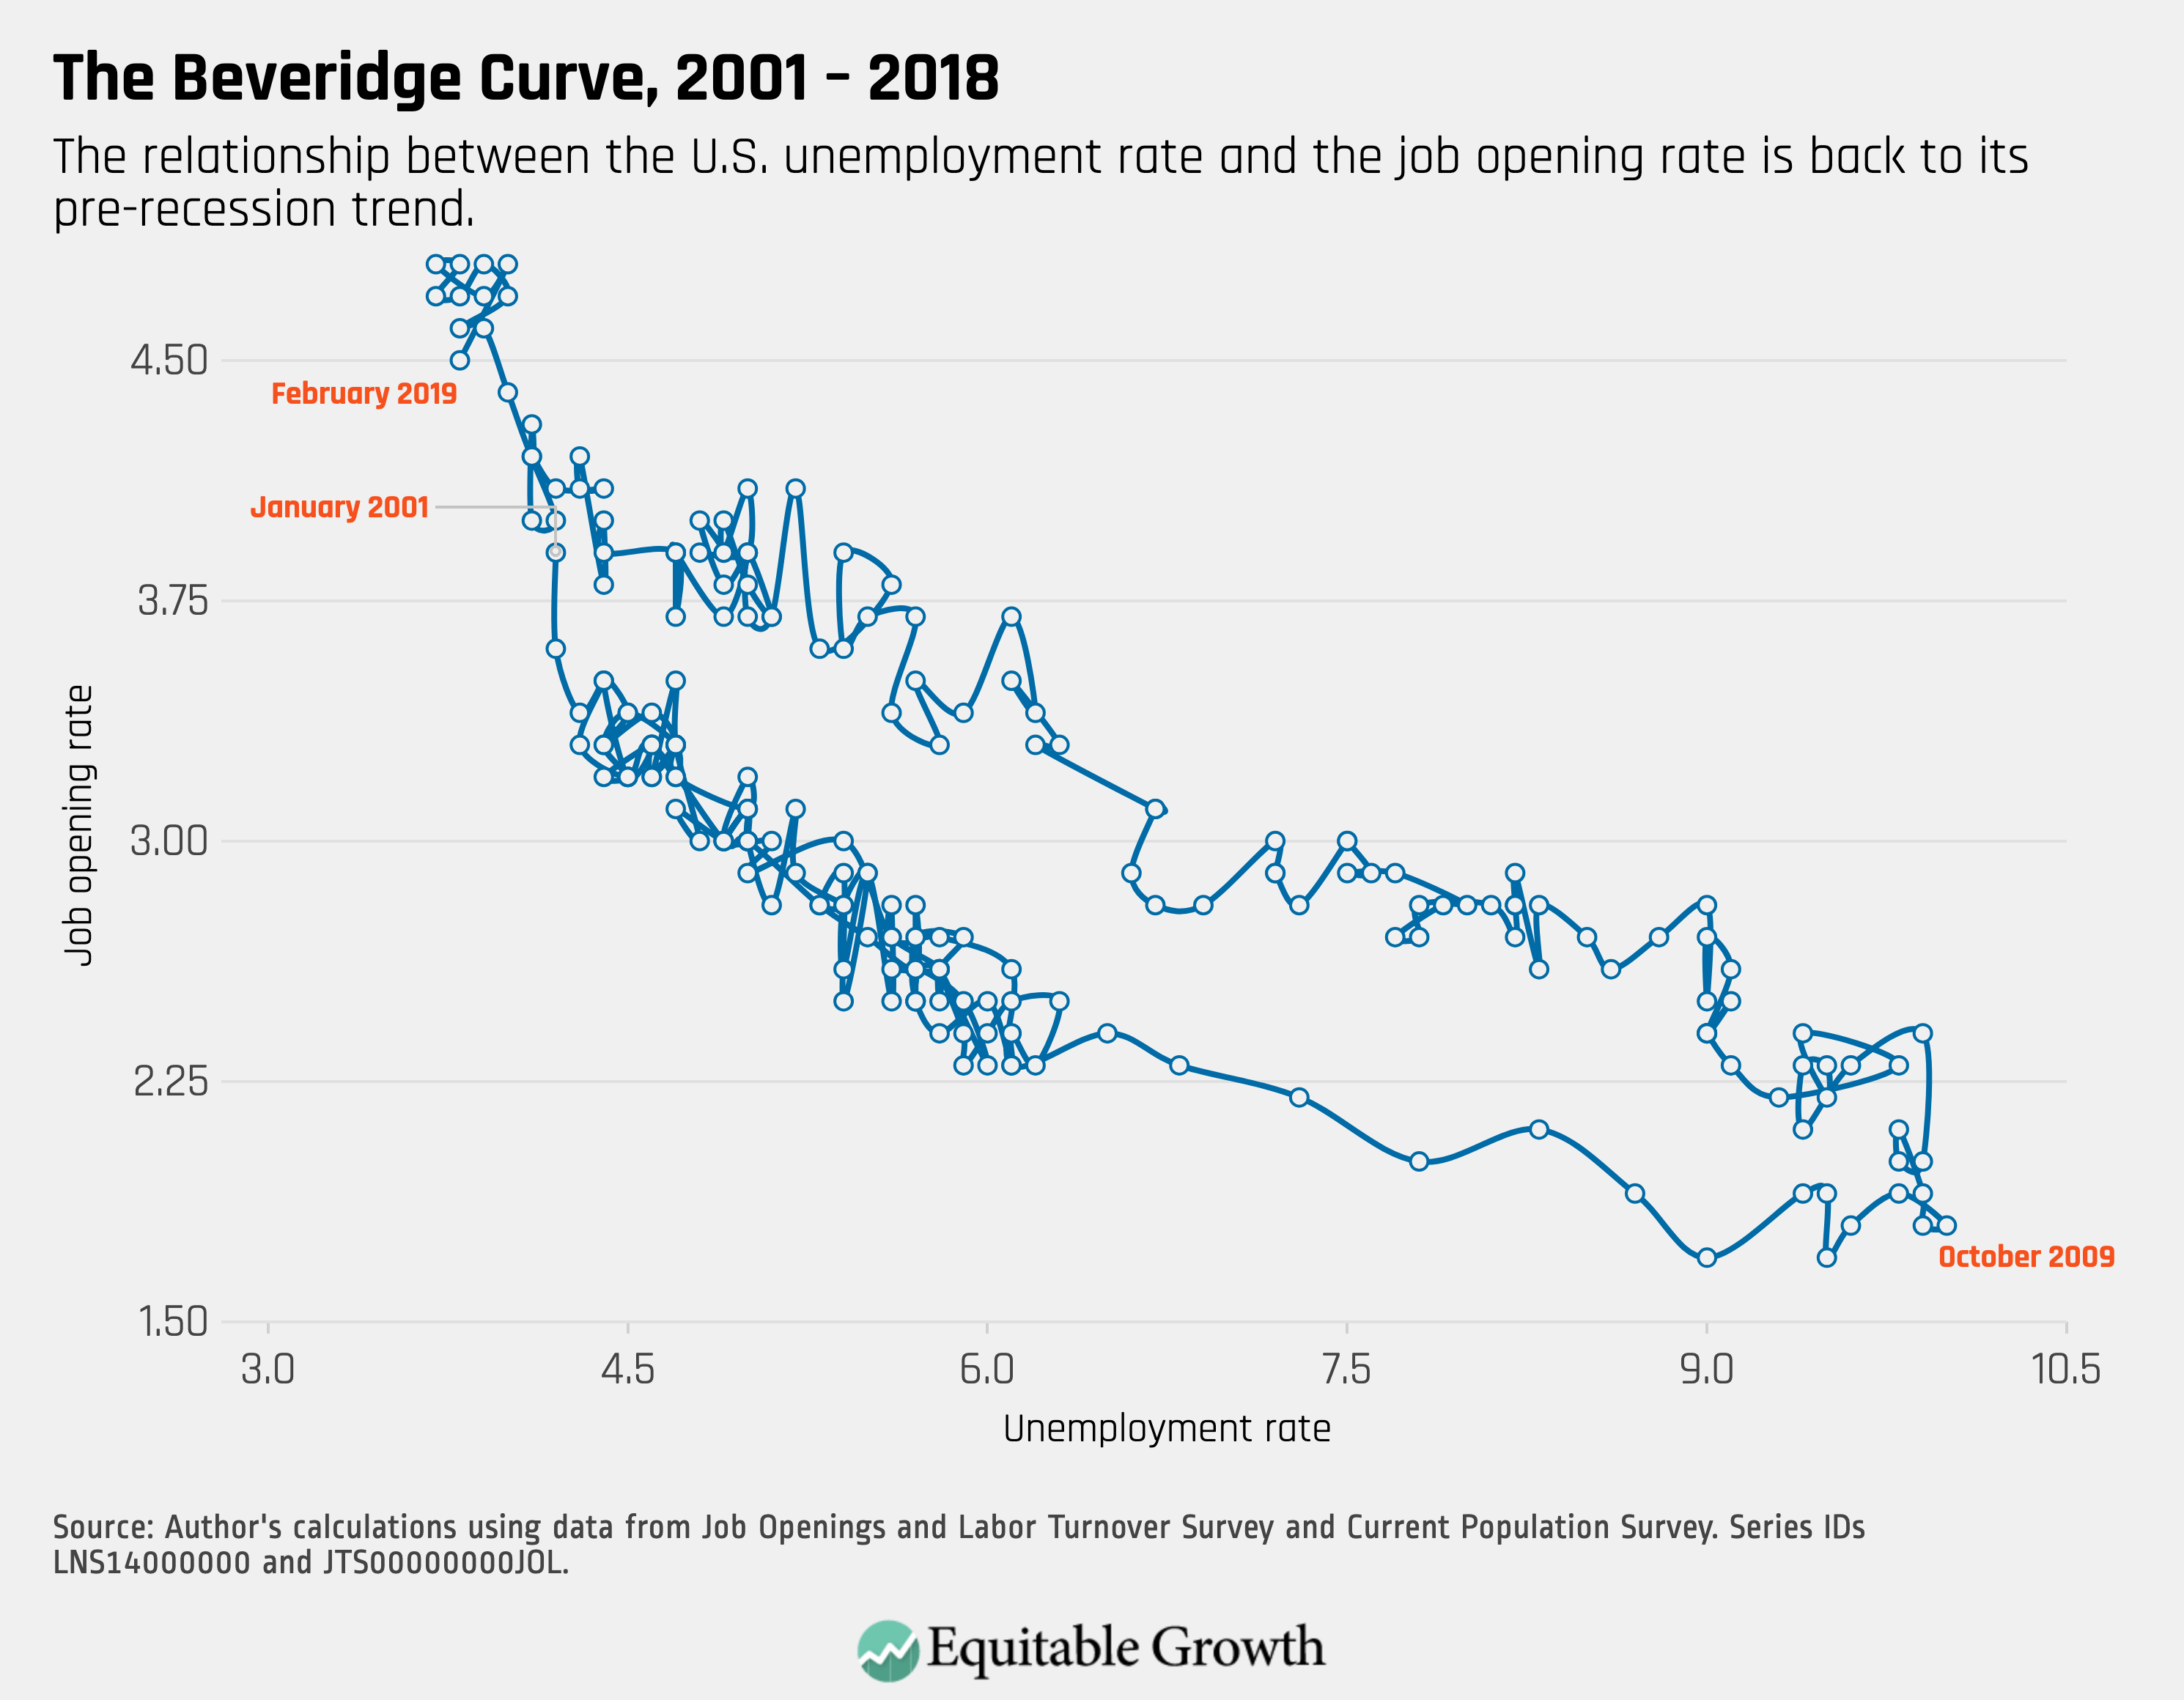
Friday Figure
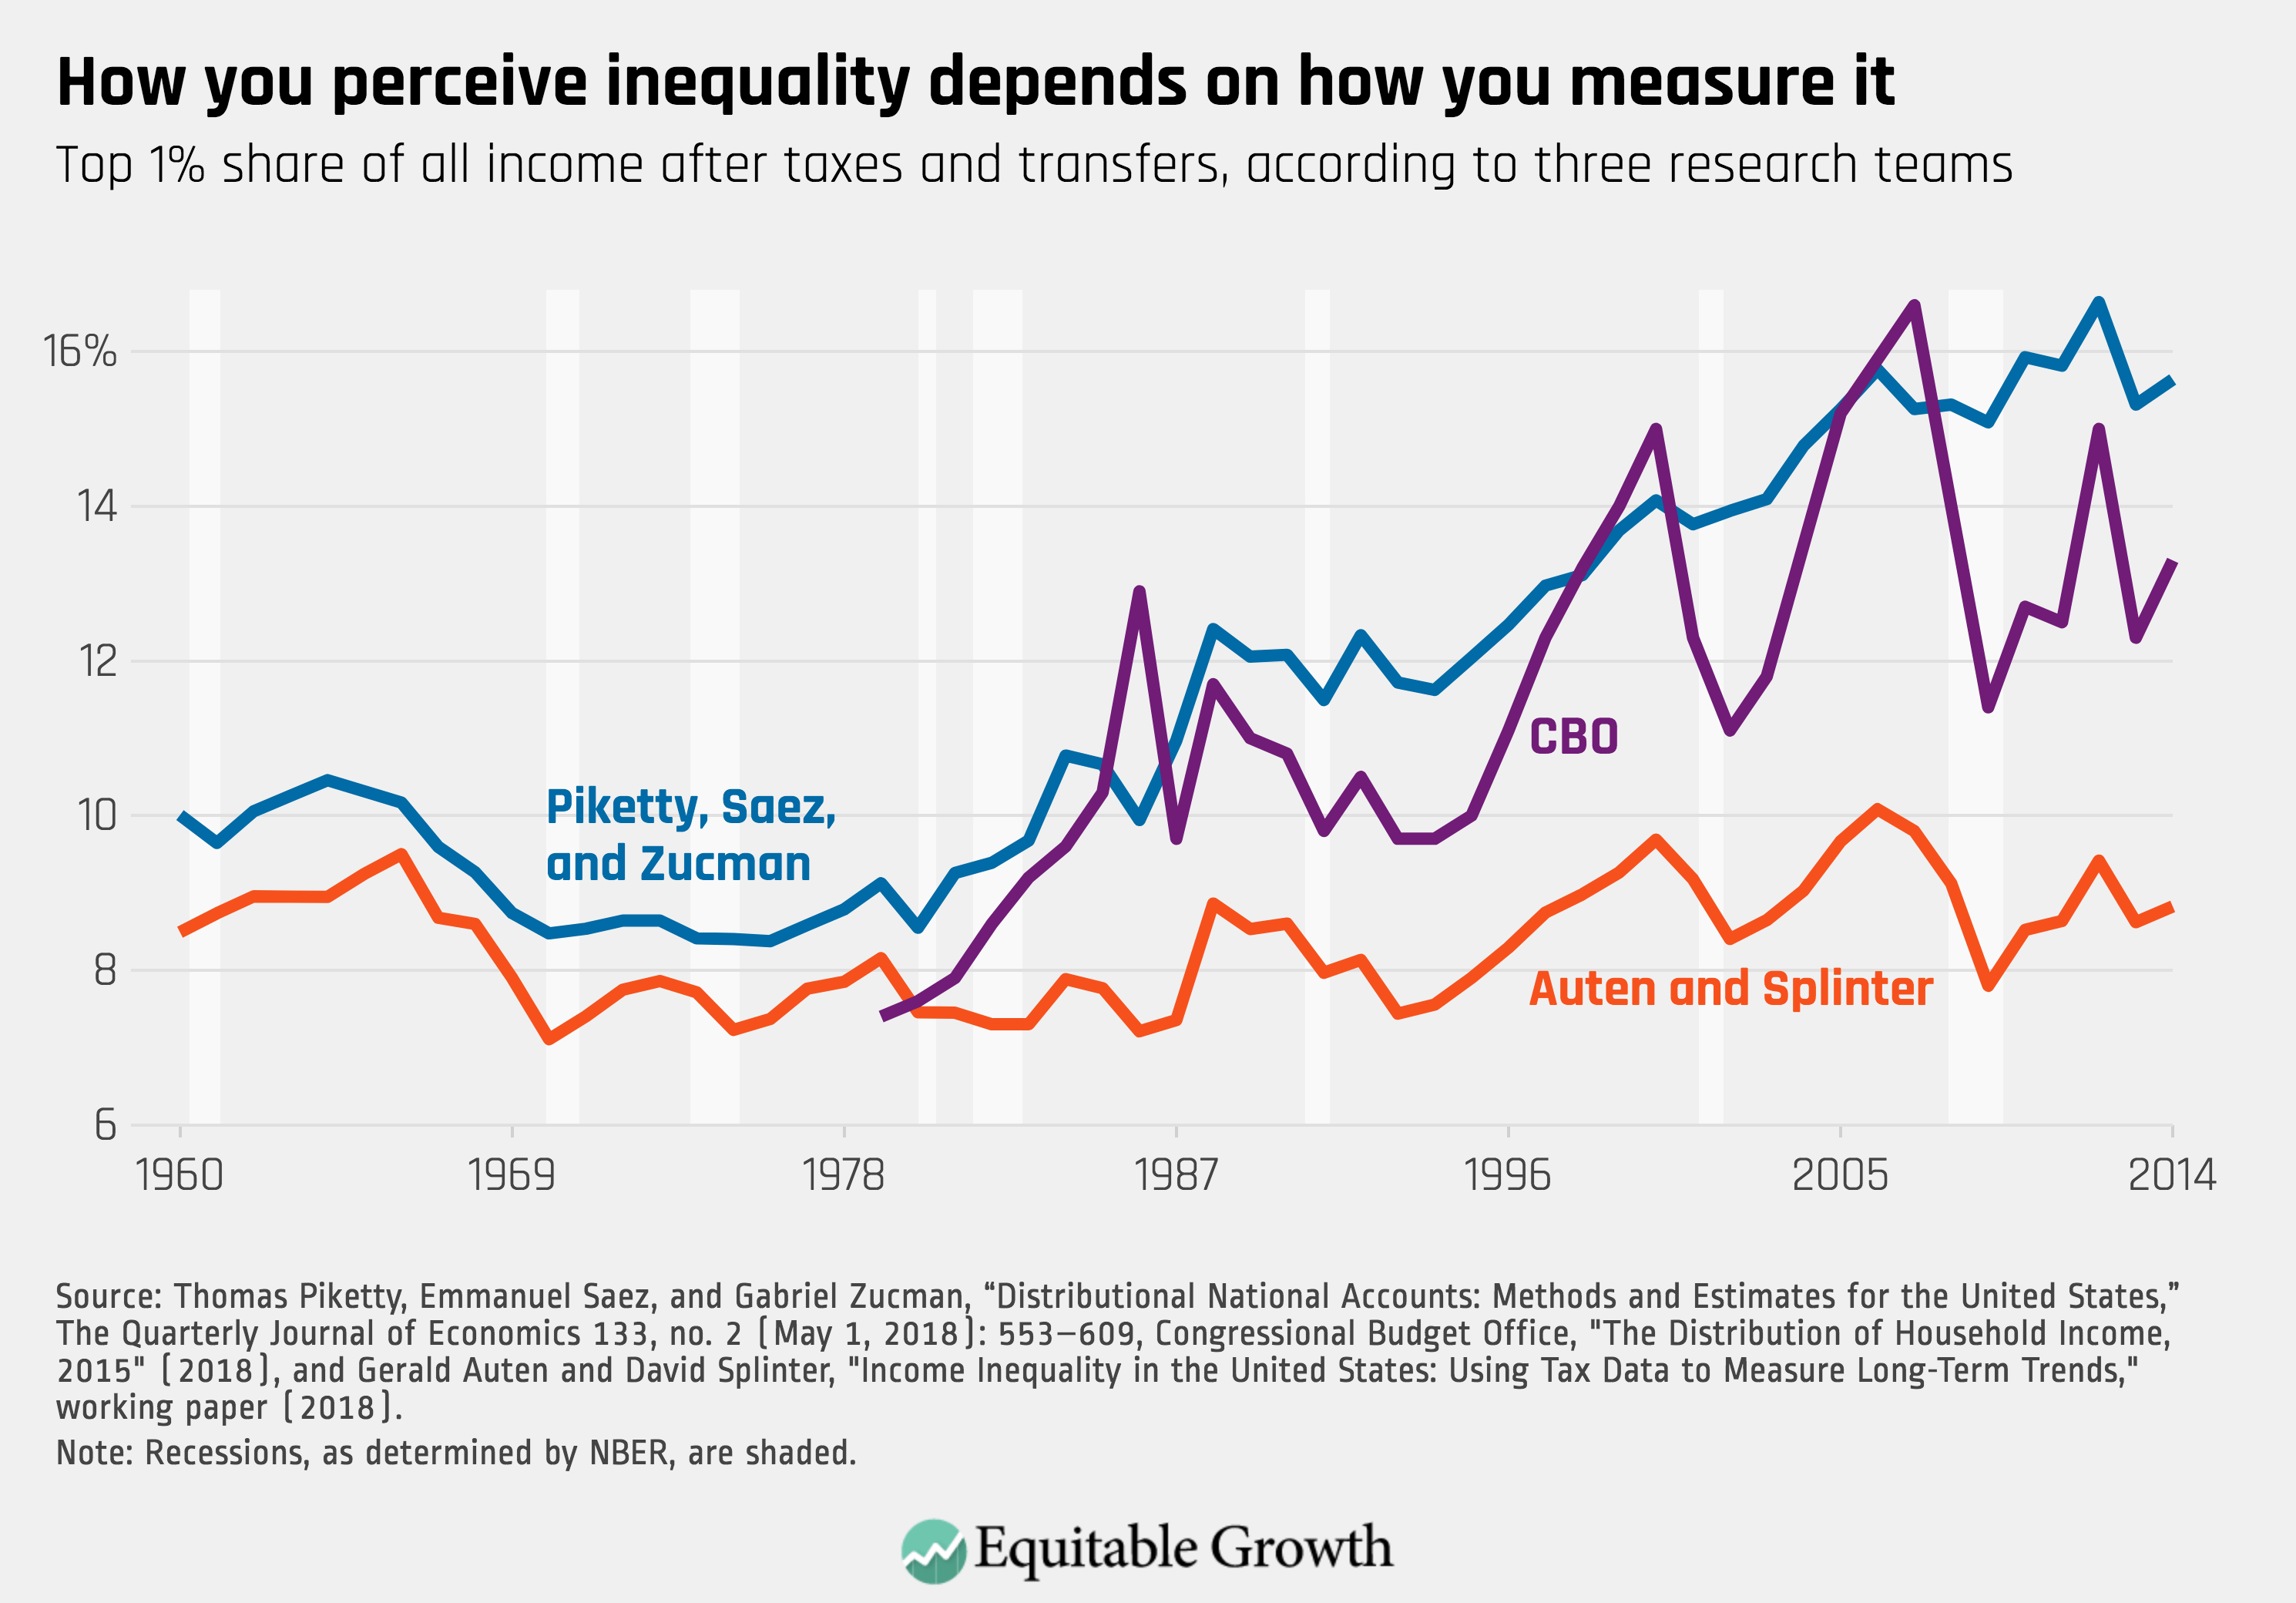
Figure is from Equitable Growth’s, “Progress toward consensus on measuring U.S. income inequality” by Austin Clemens.