Brad DeLong: Worthy reads on equitable growth, June 7–13, 2019

Worthy reads from Equitable Growth:

  1. The aging of America and the provision of illness-care workers is no longer a within-family matter, posing great problems that policymakers have not done nearly enough to think about. Read Jane Waldfogel and Emma Liebman, “Paid Family Care Leave,” in which they write: “The unmet need for leave to care for a family member with a serious illness is actually more widespread and more frequent than it is for the other types of family leave. This is why its relative neglect in research and its uneven treatment by policymakers is all the more striking. For these reasons, this paper focuses on reviewing what we know and do not know about family care leave. In particular, this paper contributes to an understanding of the need for paid leave to care for a seriously ill family member and the current state of policy and research. In doing so, we draw on the best available research on family care leave where available, but because such research is often lacking, we also draw on evidence about family and medical leave more generally when necessary.”
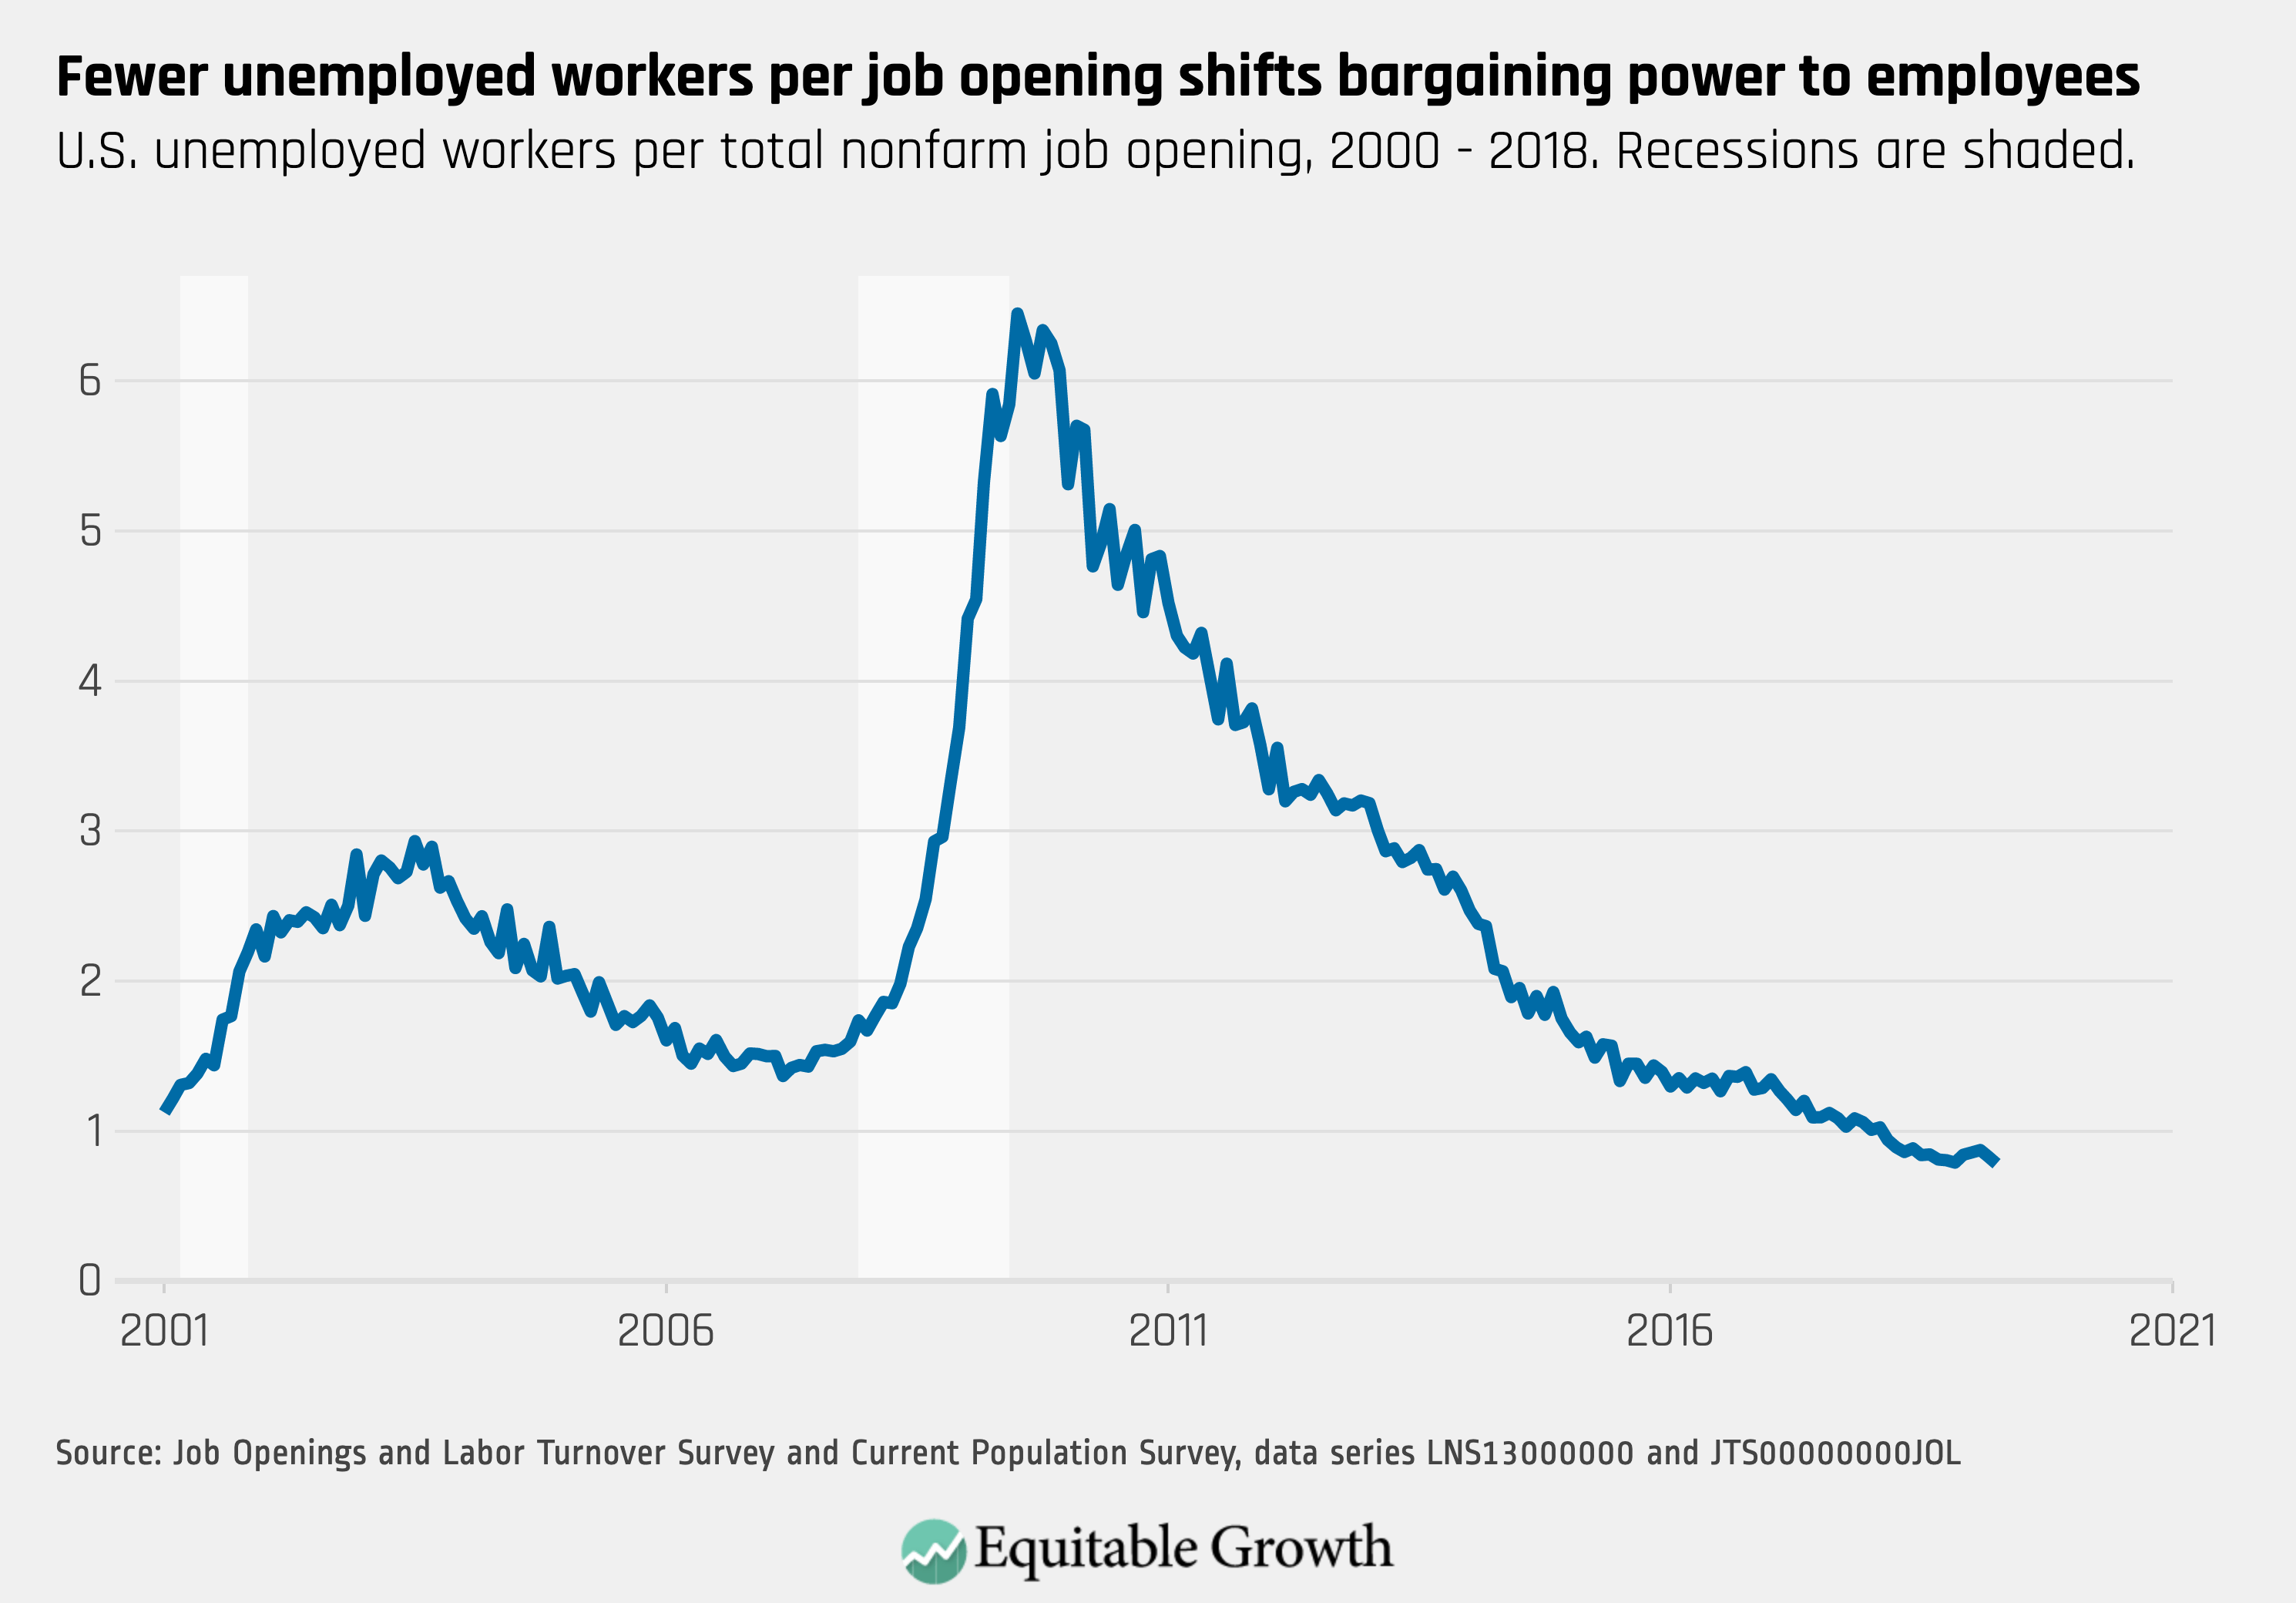
  2. On the eve of the 2001 recession, the ratio of unemployed workers to job openings was higher than it is now—and yet there is still next to no upward wage pressure now. This is a puzzle. Read Raksha Kopparam and Kate Bahn, “JOLTS Day Graphs: April 2019 Report Edition,” in which they write: “The ratio of unemployed workers to job openings hit a new low of 0.78, with fewer than one person looking for a job for each open position.”
  3. Statement on the Passing of Our Founding Funder, Herb Sandler”: “The Washington Center for Equitable Growth … would not exist without the support and leadership of Herb and the Sandler Foundation … He was generous with the resources of the Sandler Foundation and equally demanding when it came to creating, developing, and implementing their mutual vision of a nonprofit grantmaking organization that would fund original academic research and convey the evidence and policy ideas that emerged … The sadness felt by all of us at Equitable Growth is leavened by the knowledge that Herb lived to see the organization walk and then break into a run.”

Worthy reads not from Equitable Growth:

  1. I confess I do not understand what is to be done here—these internet platforms are not utilities (the technology is not stable and investments are not large enough), so rate regulation would seem inappropriate. The economies of scale on the production side and the economies of scope on the consumption side are very large, so it would seem inappropriate to sacrifice them to generate competition at the core services of each platform. Consumer surplus appears to be very large, so reducing the profits to successful innovators seems a very bad idea. And there is the question of whether these firms are giving their customers what they need instead of what they think they want—but do recall that, in early generations, one socialist critique of the market was that the market economy was making people unfree by failing to force them to wear identical blue overalls, drive identical utilitarian black cars, and listen to properly uplifting music: Read Ben Thompson, “Tech and Antitrust,” in which he writes: “That is not to say that tech deserves no regulation: questions of privacy, for example, are something else entirely. Nor, for that matter, is antitrust irrelevant in the United States generally: concentration has increased dramatically throughout the economy. What is driving that concentration matters, though: at the end of the day tech companies are powerful because consumers like them, not because they are the only option. Consumer welfare still matters, both in a court of law and in the court of public opinion.”
  2. The bond market thinks a recession is likely. The National Bureau of Economic Research—if it still paid attention to anything but payroll—would now be wondering when it should call the peak. But we seem to have decided that a recession is not a recession of economic activity in general from a previous peak, but rather a sudden, sharp, significant, and asymmetric fall in employment. The key would then be found in the hearts and minds of businesses: Are things likely to be bad enough in the future that we need to start shedding labor now? Can we use the excuse of ‘hard times’ to break our implicit contracts with our workers without incurring heavy costs in terms of reduced worker morale? When the answers two those two questions become ‘yes,’ that is a recession. We are not yet there—and we have no good models of what would push us there. Read Menzie Chinn, “Recession Anxieties, June 2019,” in which he writes: “Different forward-looking models show increasing likelihood of a recession. Most recent readings of key series highlighted by the NBER’s Business Cycle Dating Committee [or BCDC] suggest a peak, although the critical indicator—nonfarm payroll employment—continues to rise, albeit slowly.”
  3. A reminder that eliminating trade barriers and boosting trade through reducing tariffs, reducing quotas, and harmonizing regulations is one of the two things (along with deficit reduction at full employment when interest rates are high) we know how to do to materially and significantly boost prosperity in the medium run. Yes, it has an impact on income distribution. But everything has an impact on income distribution. Focusing your policies for equity on trade restrictions is counterproductive. Read Doug Irwin, “Does Trade Reform Promote Economic Growth? A Review of Recent Evidence,” in which he writes: “There appears to be a measurable economic payoff from more liberal trade policies … about 10–20 percent higher income after a decade … The gains in industry productivity from reducing tariffs on imported intermediate goods … show up time and again in country after country … As Estevadeordal and Taylor (2013, 1689) ask, ‘Is there any other single policy prescription of the past 20 years that can be argued to have contributed between 15 percent and 20 percent to developing country income?’”
  4. I am not sure whether what is needed is for economics to “go digital” as for economics to finally recognize what John Maynard Keynes called “the end of laissez-faire.” But since he wrote about the end of laissez-faire 94 years ago, I am not holding my breath for a better economics. Read Diane Coyle, “Why Economics Must Go Digital,” in which she writes: “Drug discovery is an information industry, and information is a nonrival public good which the private sector, not surprisingly, is under-supplying … Yet the idea of nationalizing part of the pharmaceutical industry is outlandish from the perspective of the prevailing economic-policy paradigm … Should data collection by digital firms be further regulated? … The standard economic framework of individual choices made independently of one another, with no externalities, and monetary exchange for the transfer of private property, offers no help.”
Posted in Uncategorized

Why it’s important to pay attention to distributional consequences of economic policies

In the decades following the 1980s, free market policies dominated policy agendas across the world. The gains from growth, however, were not broadly shared within countries, as evidenced by the high levels of economic inequality in the United States and most other advanced economies. In a recent paper, a group of economists at the International Monetary Fund argue for a rethinking of the rules—actual or perceived—that guide economic policies, so that the distributional consequences are considered and addressed by policymakers.

In their paper, IMF economists Jonathan D. Ostry, Prakash Loungani, and Davide Furceri argue there are four primary reasons why it is critical to pay greater attention to how economic gains are shared up and down the income ladder. First, their research shows that economic inequality leads to lower and less durable growth. Even when growth is the primary goal, attention to inequality is necessary. Second, they find that economic inequality may lead to social tension and ultimately political backlash against free market policies, including globalization. Third, redistributive policies to curb excessive inequality tend to support, not slow, economic growth. And fourth, many aspects of economic inequality are the result of policy choices made by governments, meaning policymakers should factor in the distributional consequences when designing and evaluating policies.

A disproportionate focus on growth over distribution was solidified among economists during the 1980s with the consensus view that the benefits of growth would trickle down the income ladder. Governments and institutions such as the IMF dismissed questions of distribution as secondary to growth, based on their confidence in markets to reward everyone fairly and their belief that redistributive policies hurt growth.

Ostry, Loungani, and Furceri question this conventional wisdom by showing that high inequality is bad not only for social reasons but also for growth. An increase in the so-called Gini coefficient—a standard measure of inequality that runs from zero (perfect equality) to one (perfect inequality)—from 0.37 (like the United States in 2005) to 0.42 (like Gabon in 2005) decreases economic growth by 0.5 percentage points. The authors also find that economic inequality shortens the duration of growth. An increase of 0.01 in the Gini coefficient is associated with a 7 percent decrease in expected spell length, or a 6 percentage point higher risk that a growth spell will end in the next year.

Moreover, the authors prove that concerns about the negative growth effects of redistribution are misplaced. Although excessive redistribution policies can slow growth, redistributive policies to reduce inequality actually support growth, on average, contrary to what many policymakers think. Often, policymakers are facing not a tradeoff but a win-win situation, where redistribution can reduce inequality and boost growth.

Given these findings, which build upon their earlier work, how should the rules of economic policymaking be corrected? The authors focus on two policies—fiscal consolidation and capital account liberalization—to illustrate why centering distributional considerations in the evaluation of policies can provide better guidance.

Fiscal consolidation refers to the reduction of the size of government, through spending cuts, limits on deficit levels, or the privatization of government functions. The evidence suggests that for countries with a high risk of imminent debt crises and facing pressure from financial markets, fiscal consolidation can be necessary. Yet countries with a strong fiscal track record and low risk of a crisis—with what the authors describe as “ample fiscal space”—such as the United States, it is better to live with current levels of public debt rather than pay down the debt or ramp it up further. In the U.S. context, the authors find that it is better to live with significant amounts of federal debt and let future growth reduce the debt-to-Gross Domestic Product ratio, even with a framework that is biased toward consolidation.

Other research shows that moving from a debt ratio of 120 percent of GDP to 100 percent of GDP over a few years reduces the probability of a crisis marginally, but has a significant welfare cost due to the distortionary taxation needed to service the debt. In this scenario, the likelihood of a negative fiscal event, such as a government debt default or a spike in inflation, decreases minimally from an already unlikely 2.6 percent to only 2.4 percent. But the benefit is about 0.5 percent of GDP—just one-tenth of the welfare cost of paying down the debt through distortionary taxation.

Even in the short run, fiscal consolidation reduces output and raises economic inequality. Looking at fiscal consolidation policies across 17 advanced economies of the Organisation for Economic Co-operation and Development, Ostry, Loungani, and Furceri find that fiscal consolidation has been followed by a significant drop in economic output—about 2 percent 2 years after the policy change. And economic inequality rises simultaneously—the Gini coefficient increases by more than 3 percent 2 years after the policy.

The authors’ other policy focus—capital account liberalization, or the opening up of economies to foreign capital and investments—boosts growth minimally but worsens economic inequality significantly. Standard economic theory indicates that capital account liberalization is beneficial for economies because savings across the world can flow to their most productive uses through freer capital markets. But the authors find that, on average, capital account liberalization has little impact on economic output, confirming the results of other empirical studies. While national economies experience moderate increases in GDP when there are no crises, liberalization leads to significant declines in output when followed by crises.

Moreover, capital account liberalization policies lead to higher economic inequality, depending on whether there is a crisis after the policy change. In another paper, Furceri and Loungani find that capital account liberalization typically leads to an increase in the Gini coefficient of about 0.8 percent 1 year after the policy change, and about 1.4 percent 5 years after.

Based on their findings about fiscal consolidation and capital account liberalization, the authors ask “why support them if there are scarce efficiency benefits for them but palpable equity costs?” The answer is important because fiscal consolidation and capital account liberalization are two policies that have historically been at the center of the IMF’s economic reform agenda. This paper is one illustration of a shift in policy priorities at the IMF, where leaders increasingly recognize that liberalization and tight fiscal policy are not always suited for sustainable economic growth.

As the IMF marks its 75th anniversary, Managing Director Christine Lagarde has argued for a renewed approach that tackles economic inequality, as well as climate change and corruption. Inequality affects economies through various channels, whether it blocks opportunity and innovation for those not at the top of the income and wealth ladders, destabilizes growth by distorting demand, and disables political systems through the influence of the economic elite. The research from the IMF shows that inequality itself has a direct economic impact of lower and less durable growth.

This new body of research matters because it shows that many of the negative distributional outcomes stem from intentional policy choices, not just from technological developments or factors beyond the control of governments. The authors note that even with better designed policies, there will be a need for the redistribution of the gains from overall economic growth, which the evidence shows can be both pro-growth and pro-equality, through spending on education and taxes on activities with negative externalities such as excessive risk-taking in the financial sector. But, first and foremost, policymakers can support sustainable growth by paying more attention to the distributional consequences of economic policies.

Posted in Uncategorized

Wealthier individuals receive higher returns to wealth

Wealth inequality has soared in the United States over the past three decades. Today, the top 1 percent own about 40 percent of the nation’s wealth, levels last seen during the Roaring Twenties. A growing body of research now suggests that those at the top not only own much more wealth, but also register higher rates of return from their wealth. Although there are conflicting findings on why the wealthy earn higher returns, these studies open the door to an important line of research that could give us insight into wealth inequality in the United States.

A recent working paper using Norwegian data shows that higher returns for wealthier individuals are persistent over time for the same individual and across generations—and not just because they are compensated for risk-taking. The paper (funded in part by Equitable Growth) by economists Andreas Fagereng of Statistics Norway, Luigi Guiso of the Einaudi Institute for Economics and Finance, Davide Malacrino of the International Monetary Fund, and Equitable Growth grantee Luigi Pistaferri of Stanford University studies individual returns to wealth over the entire wealth distribution, both within and across generations.

The authors use 12 years of tax records on the wealth and capital income of all taxpayers in Norway from 2004 to 2015. These exhaustive tax records are available in Norway because of a wealth tax that requires assets to be reported—often done by employers, banks, or other third parties, thereby reducing errors that arise from self-reporting. The authors also are able to match parents with their children, and thus look at intergenerational patterns in returns to wealth.

Individuals earn substantially different returns on their wealth. The four co-authors find 3.8 percent average returns on overall wealth (financial assets plus housing minus debt) with a standard deviation of 8.6 percent. The difference between the average return at the 10th percentile and 90th percentile of overall wealth is about 18 percentage points. Given that Norwegians in the bottom 20 percent of their nation’s wealth distribution have negative wealth—they have more debts than assets—the authors measure returns as a share of gross wealth to ensure that people with debt costs exceeding their asset incomes are counted as having negative returns.

Why do the wealthy get higher returns from their wealth? In part, it’s because they invest a higher share of their assets in the stock market and other risky assets, and therefore are rewarded for their risk tolerance with higher average returns. Wealthier investors also benefit from the scale of their wealth, for example, by using checking accounts that pay higher rates for larger deposits and buying financial advice that leads to higher returns—what the authors call “economies of scale in wealth management.”

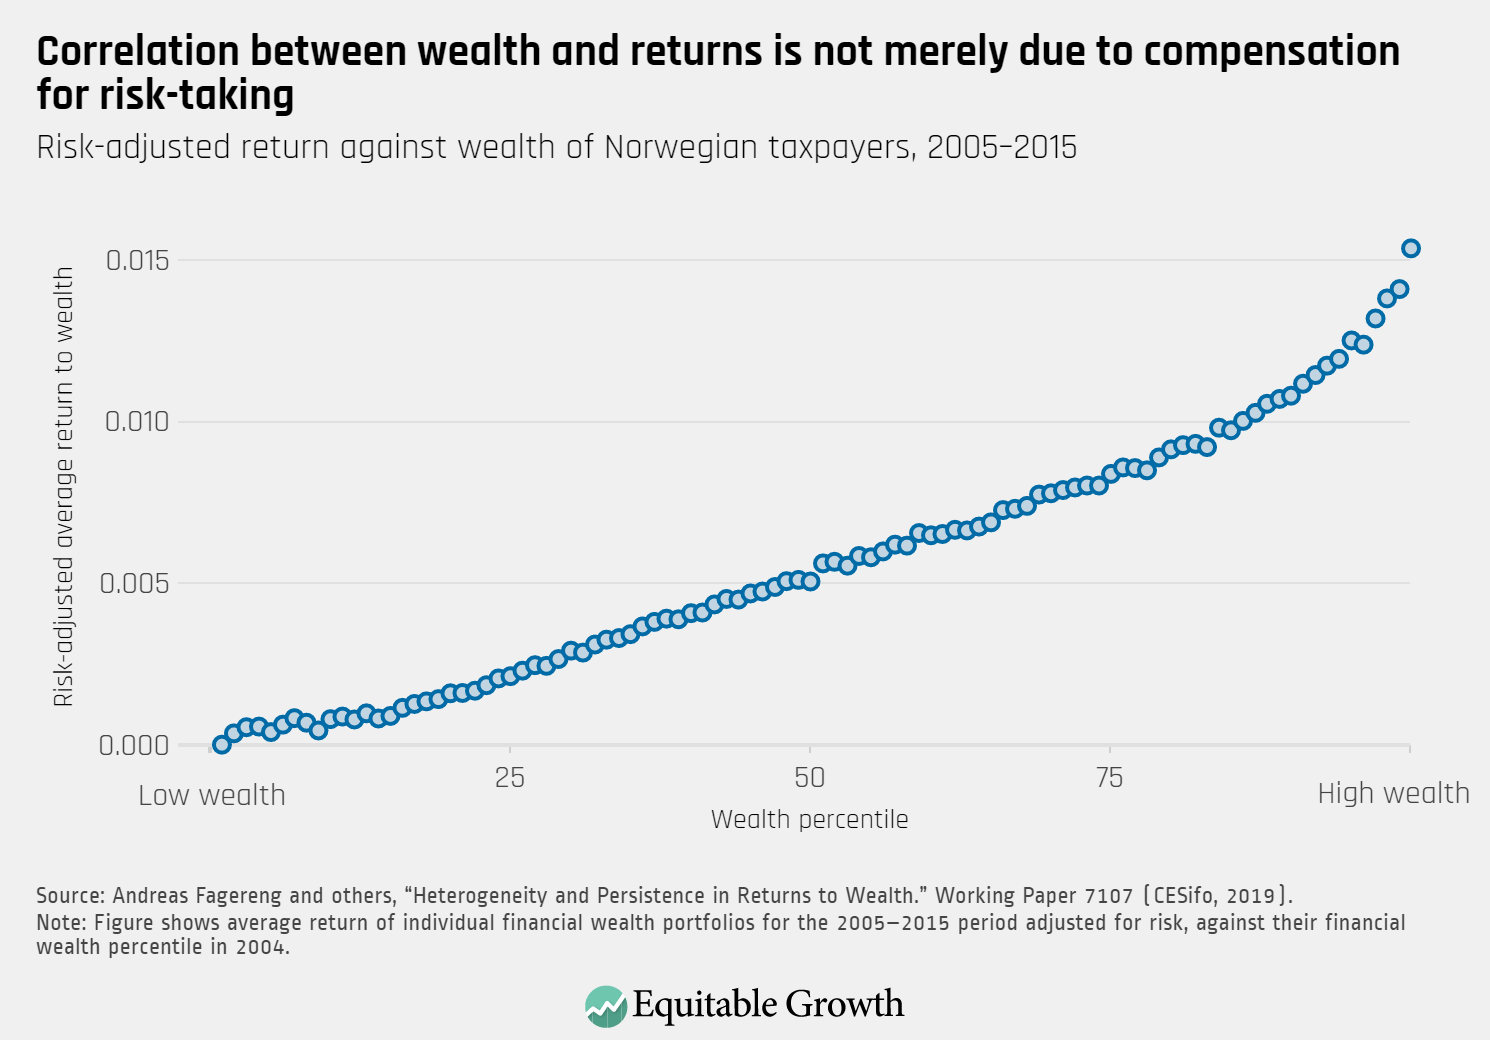
Yet the authors also find that risk compensation and scale, while important, are not enough to fully account for the variation in returns, or, in economic parlance, “return heterogeneity.” Bank deposit accounts are safe assets that bear essentially no risk. If return heterogeneity were explained by compensation for risk-taking, then there should be no variation in the returns that people get from deposit accounts holding the same amount of wealth. The authors find, however, that there is sizable heterogeneity: People with more education tend to deposit at high-return banks. Persistent variation in returns is therefore also explained, in part, by differences in financial sophistication and differences in ability to access and use superior information about investment opportunities. (See Figure 1.)

Figure 1

Returns to wealth persist across time when looking at the same individuals, but do they also persist across generations? The intergenerational transmission of wealth is well-documented: It is widely understood that the children of wealthy families are likely to have a lot of wealth as adults. The authors find that, like wealth, returns to wealth are correlated intergenerationally, though there are important differences in how returns to wealth accrue across generations.

At the top of the wealth distribution, the intergenerational correlation is higher, while at the top of the returns-to-wealth distribution, the intergenerational correlation is lower. So, a child of Amazon.com Inc. CEO Jeff Bezos will hypothetically own an extremely high level of wealth later in life, but will not generate returns from that wealth as high as did Bezos himself. In economic terms, those returns for Bezos’ child “revert to the mean.”

Some of the intergenerational correlation in returns to wealth is explained by scale dependence in wealth (higher levels of wealth getting higher returns), but correlation can also come from children imitating their parents’ investment strategies or inheriting traits related to risk preferences or talent in investing. Returns also are correlated when parents and children share a private business or they live close to each other and so earn similar returns on housing.

Compared to the United States, income is much more evenly distributed in Norway, but wealth is similarly concentrated. Another study by Laurent Bach at ESSEC Business School and his co-authors using Swedish administrative data also finds substantial heterogeneity in returns to wealth and a correlation between returns and level of wealth. These authors, however, find that the higher returns earned by the wealthy are compensation for taking higher systematic risk, not the result of exceptional investment skill or privileged access to information.

Even if the reasons behind the variation in returns to wealth have not yet been fully explained, these studies improve our understanding of how returns to wealth differ across the wealth spectrum. On the policy front, return heterogeneity could mean that a wealth tax would be more efficient than a capital income tax. Replacing a capital income tax with a wealth tax reduces the burden on high-return investors and thus may motivate more wealth accumulation. But a wealth tax might also widen the disparities in rates of return.

An ancillary benefit of a wealth tax in the United States would be the collection of more accurate data to estimate and track the wealth of the wealthiest Americans—just as the Norwegian wealth tax enabled Fagereng and his co-authors to do their data-driven research. Their findings are an important contribution to the empirical literature on the variation in returns to wealth, which can help policymakers understand the trends and dynamics of the extreme concentration in wealth and design policies that ensure that wealth disparities aren’t deepening generation after generation.

Posted in Uncategorized

JOLTS Day Graphs: April 2019 Report Edition

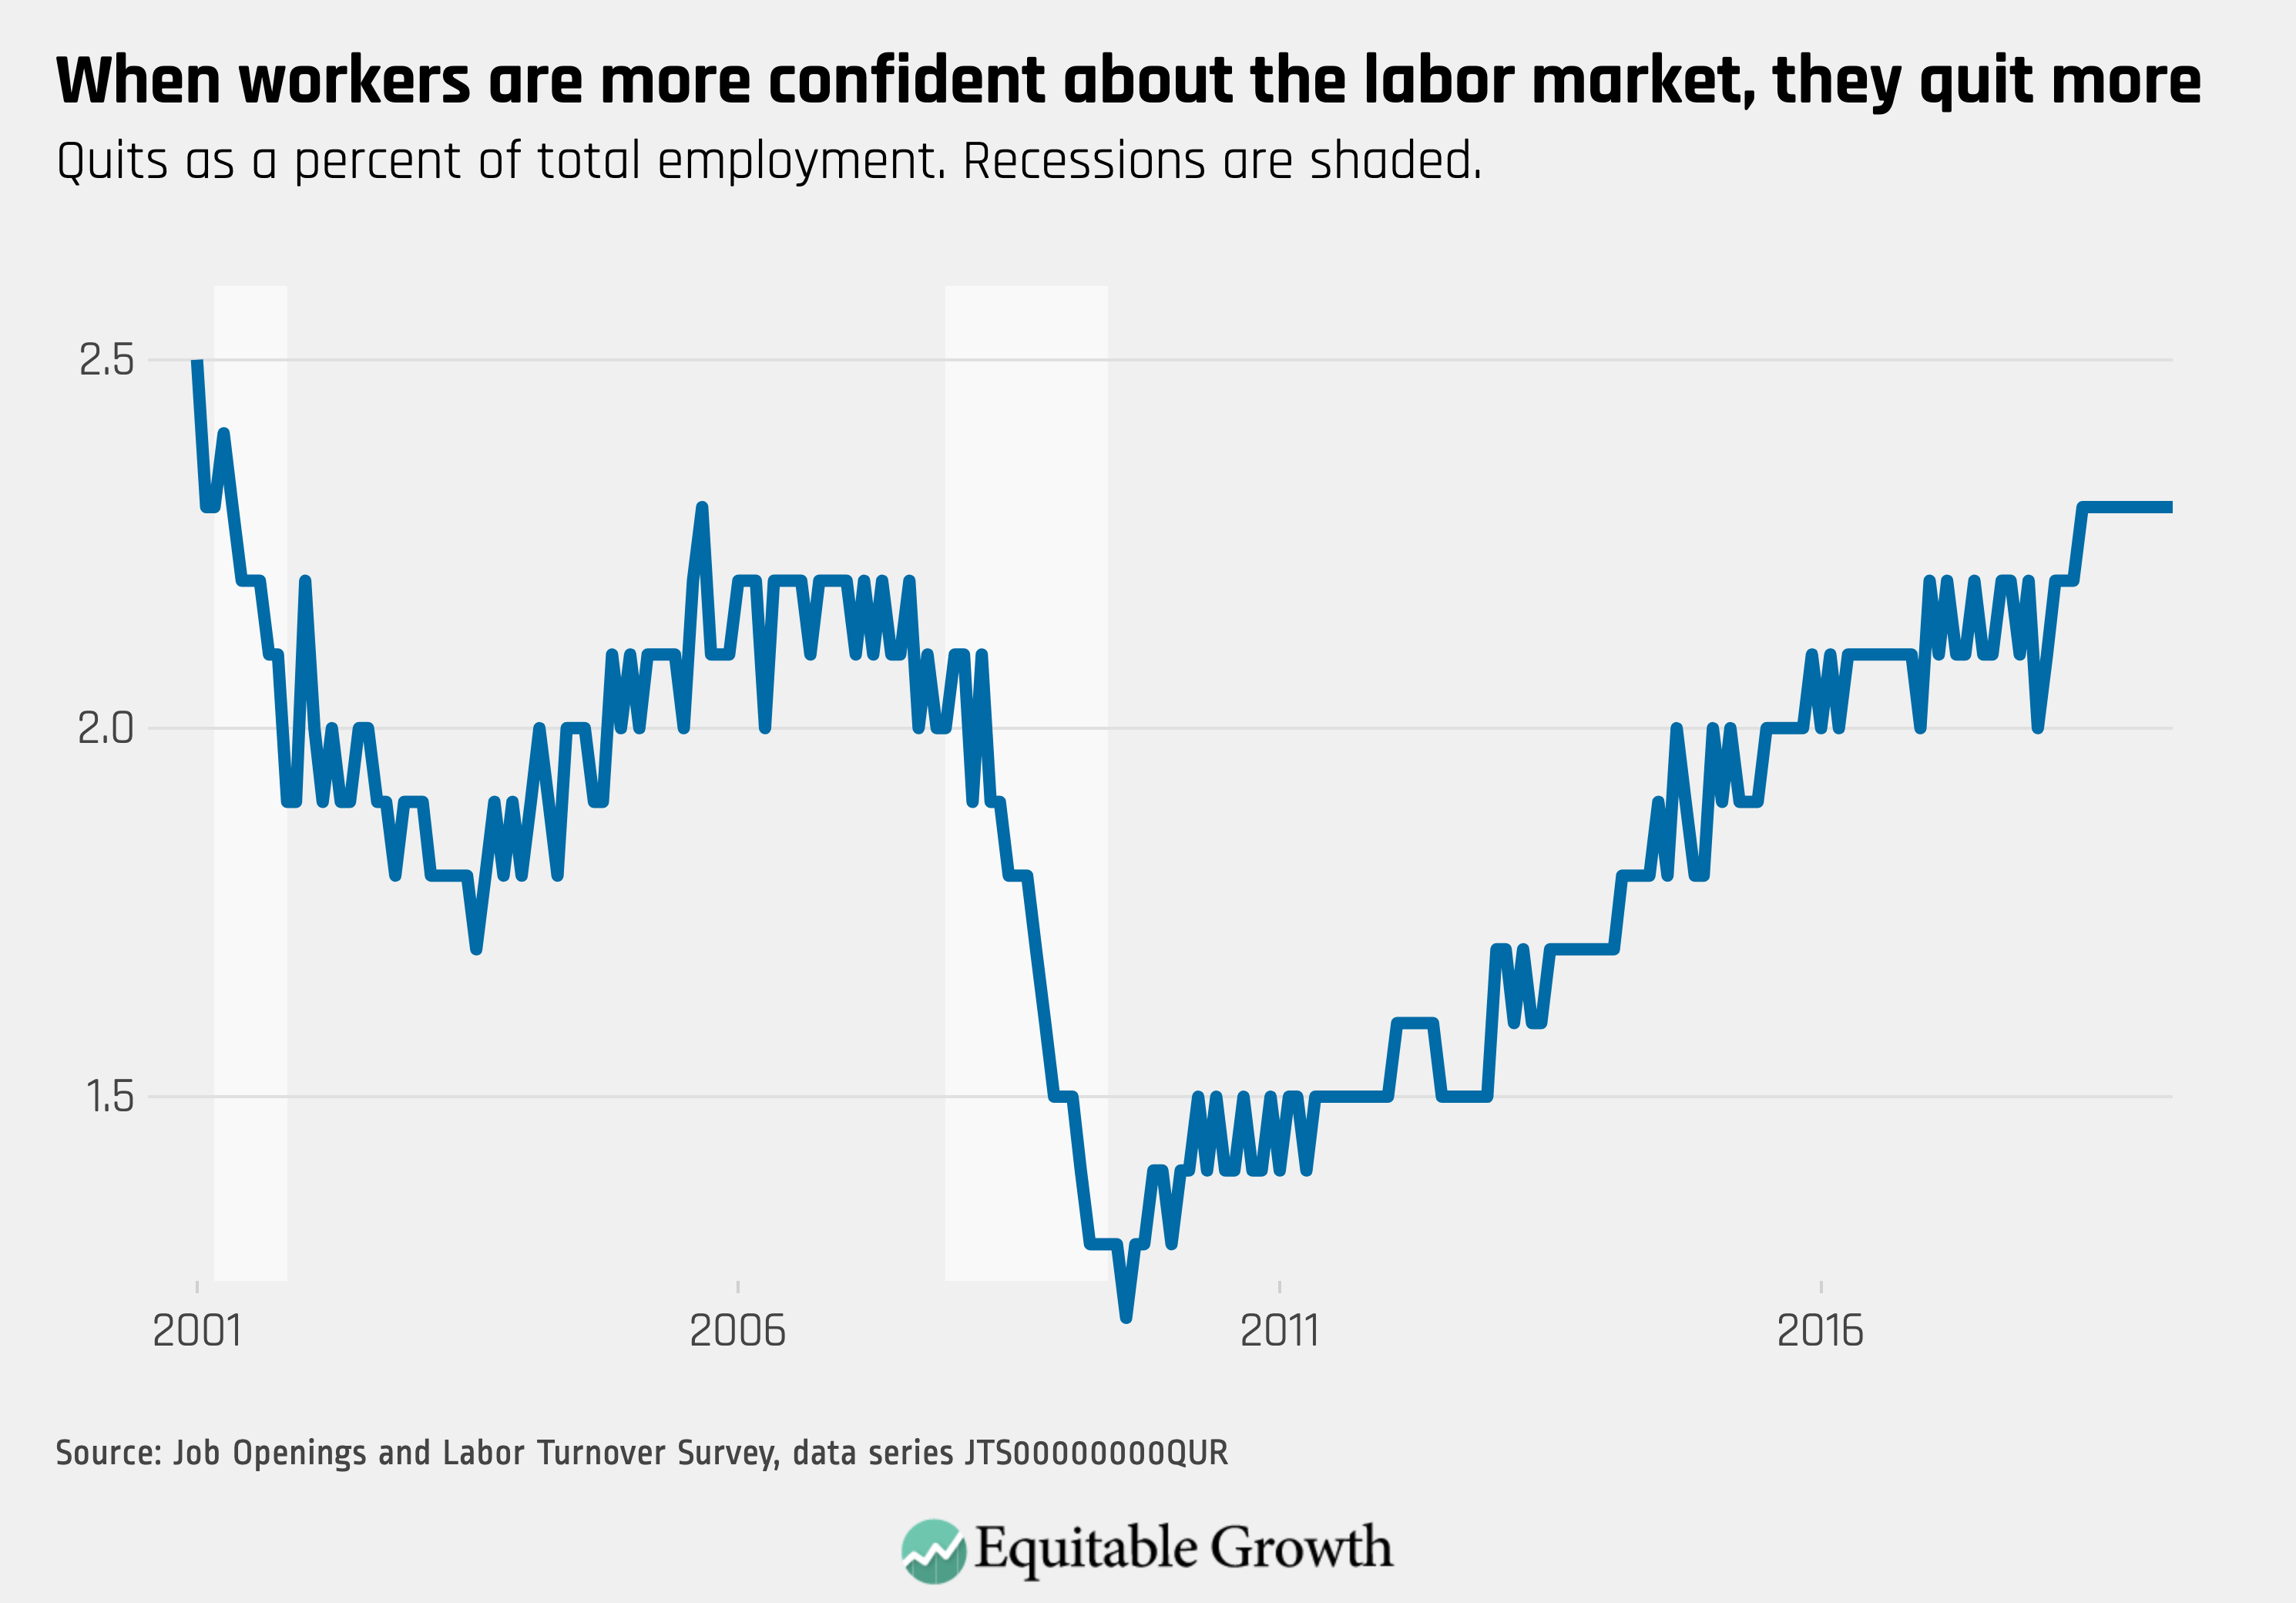
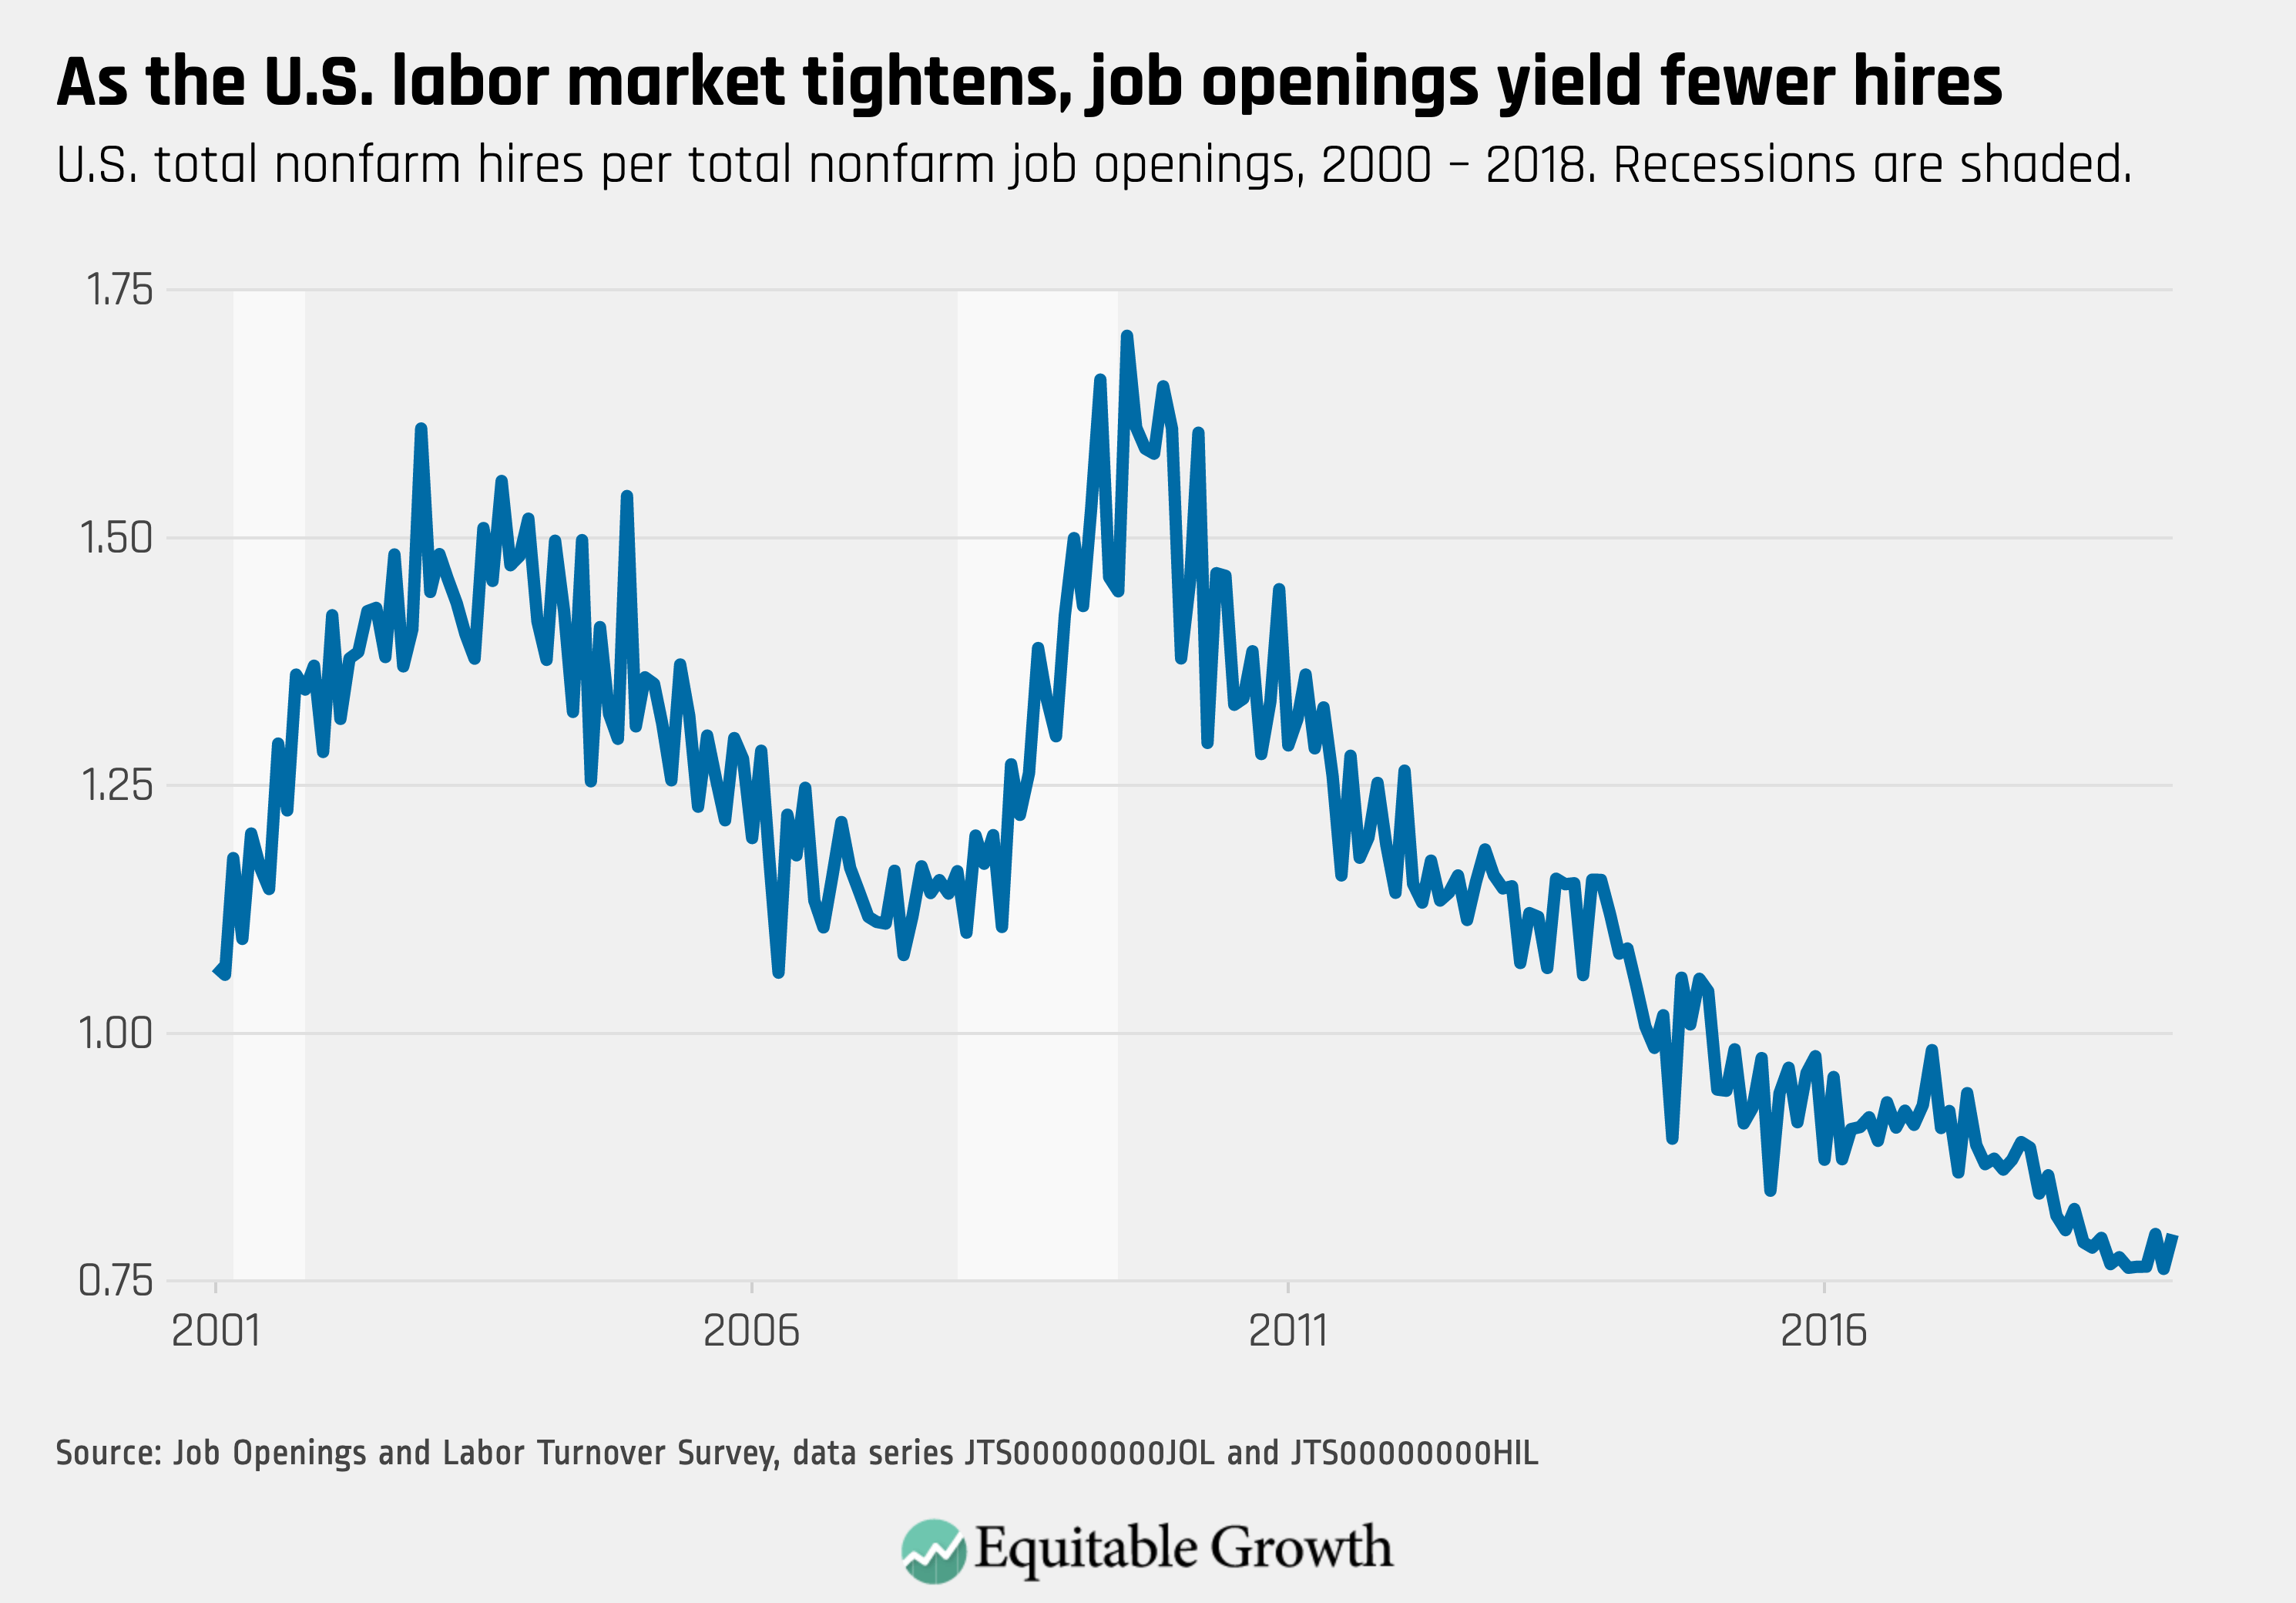
Every month the U.S. Bureau of Labor Statistics releases data on hiring, firing, and other labor market flows from the Job Openings and Labor Turnover Survey, better known as JOLTS. Today, the BLS released the latest data for April 2019. This report doesn’t get as much attention as the monthly Employment Situation Report, but it contains useful information about the state of the U.S. labor market. Below are a few key graphs using data from the report.

1.

The quit rate has held steady at 2.3% for 11 months, signaling worker confidence in the labor market.

2.

The ratio of hires to job openings increased slightly in April, as hires reached a series high of 5.9 million.

3.

The ratio of unemployed workers to job openings hit a new low of 0.78, with fewer than one person looking for a job for each open position.

4.

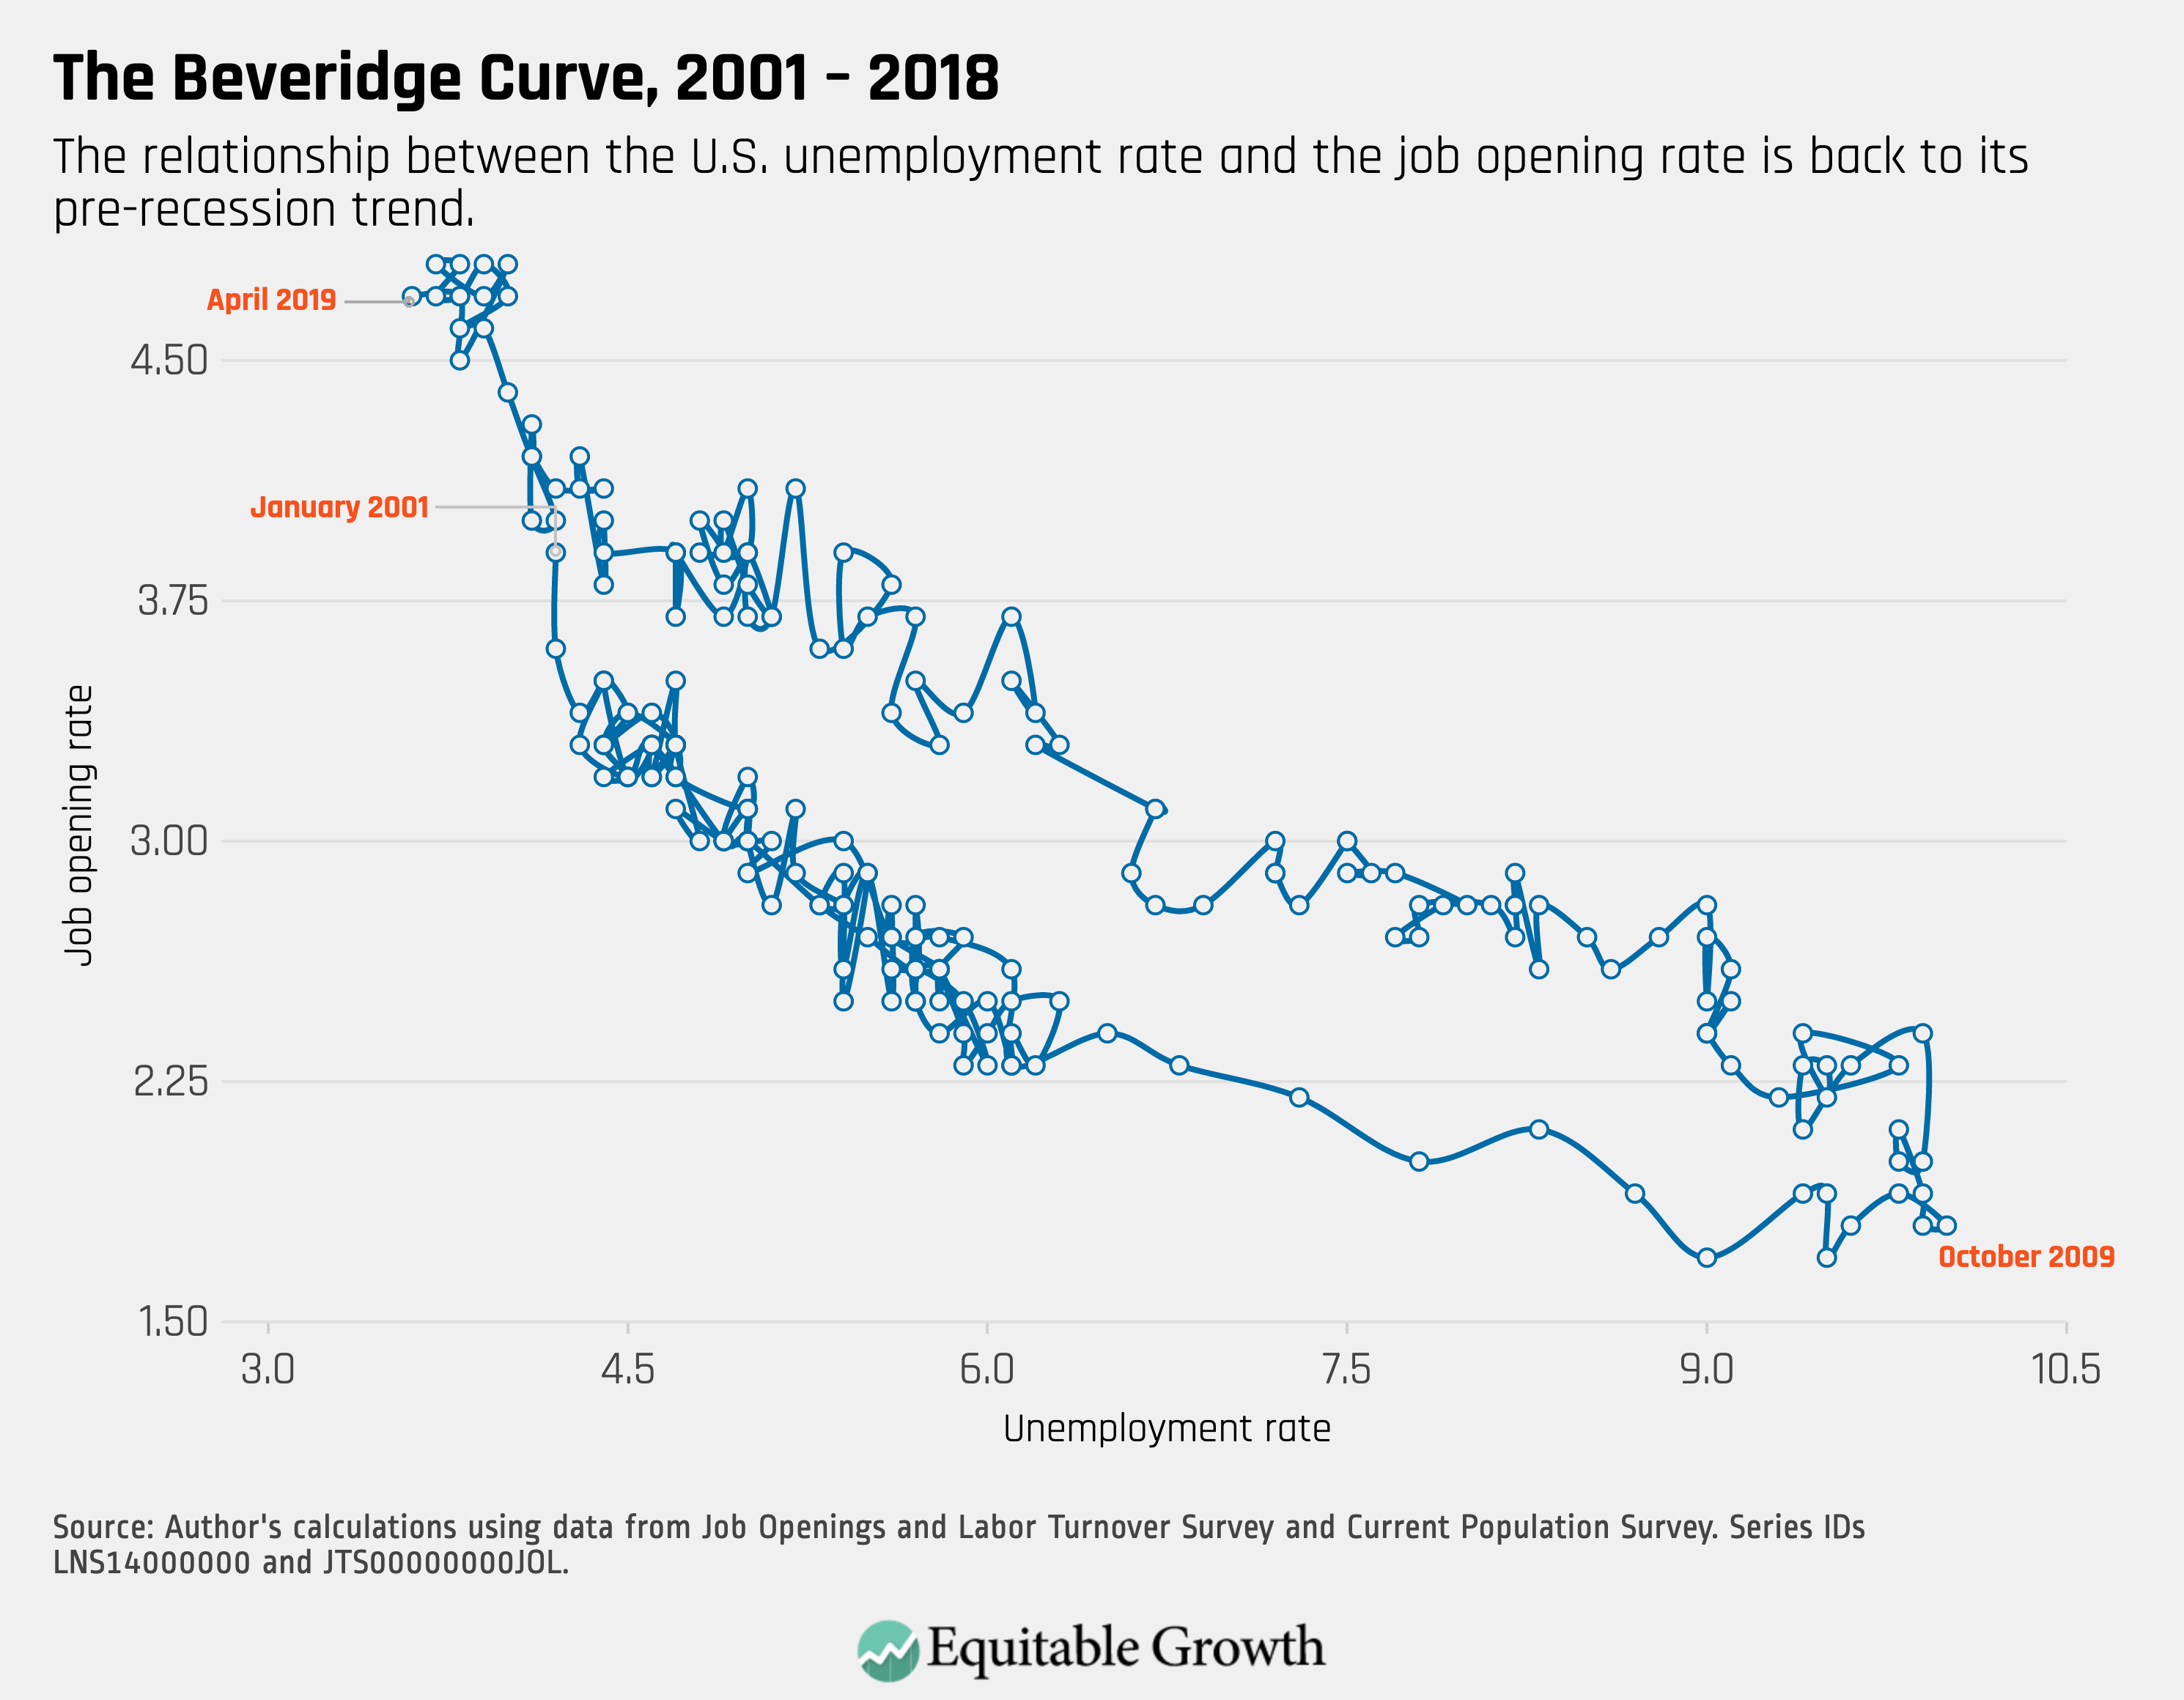
The Beveridge Curve continues its expansion, hovering around the same level for the past year.

Posted in Uncategorized

Paid family care leave is a missing piece in the U.S. social insurance system

The aging of the baby-boom generation means that millions of working families are part of a growing “sandwich generation,” juggling care for young children and aging parents. Many will need time off work to care for a seriously ill child, an ailing spouse, or an elderly family member, and the cost of caregiving is far more expensive than most realize. For instance, the cost of “informal caregiving” for a loved one with ovarian cancer averages more than $66,000, while caregiving for lung cancer costs nearly $73,000.

Download File
Paid family care leave: A missing piece in the U.S. social insurance system

The federal Family and Medical Leave Act of 1993 provides job-protected unpaid leave to some workers, yet many are either unable to take unpaid leave or not covered by the law at all due to eligibility restrictions that disproportionately impact low-income workers and their families. But
momentum continues to build around a national solution to make paid family and medical leave broadly available to American workers, understanding the need for family caregiving leave is all the more critical.

A newly published Washington Center for Equitable Growth report by Columbia University professor Jane Waldfogel and Columbia master of Public Health graduate student Emma Leibman summarizes why paid family care leave is a policy with important economic, social, and health implications for U.S. employers, employees, and their family members. Building on new research that draws on the experience of the growing number of states with paid family and medical leave policies in place—all of which include not only paid parental leave but also paid family caregiving leave—the evidence for the impact of such policies on not only families but also the economy as a whole is increasingly difficult to ignore.

Posted in Uncategorized

Weekend reading: “Stimulating Economic Growth” edition

This is a weekly post we publish on Fridays with links to articles that touch on economic inequality and growth. The first section is a round-up of what Equitable Growth published this week and the second is the work we’re highlighting from elsewhere. We won’t be the first to share these articles, but we hope by taking a look back at the whole week, we can put them in context.

Equitable Growth round-up

Earlier this morning, the U.S. Bureau of Labor Statistics released new data on the U.S. labor market during the month of May. Kate Bahn, Will McGrew, and I compiled five graphs highlighting important trends in the data.

This week, we mourn the loss of Herb Sandler, who supported the mission of equitable growth even before the creation of our organization. As our founding funder and head of the Sandler Foundation, Herb was committed to reshaping the economic policy debate to prioritize the elimination of inequality.

Brad DeLong compiles his most recent worthy reads on equitable growth both from Equitable Growth and outside press and academics.

Fatih Karahan, Benjamin Pugsley, and Aysegül Sahin propose a simple explanation for the long-run decline in the rate of start-up companies: It was caused by a slowdown in labor supply growth since the late 1970s, largely pre-determined by demographics. The authors find this channel explains roughly two-thirds of the decline.

Links from around the web

A new study by the Federal Reserve Bank of New York finds that people’s attachment to their communities contributes to their willingness to move for higher-paying jobs. Richard Florida looked at the variety of explanations for declining mobility and saw that those who identify as “rooted” (people who have the resources to move yet prefer to say where they are) make up almost 50 percent of survey respondents. Approximately 15 percent of respondents identify as “stuck,” meaning they want to move for better opportunities but don’t have the resources, and these individuals have less educational attainment or poor health conditions. [citylab]

Eric Ravenscraft delves into competing definitions of the term “living wage” this week in The New York Times. While he concedes that having “enough” money can be a nebulous concept, he points to helpful tools like the Massachusetts Institute of Technology’s “Living Wage Calculator” that help paint the picture of the minimum required to cover basic expenses in different communities.[nyt]

In ProPublica, Justin Elliot follows up on a previous story that U.S. congressional leaders had agreed to include a provision in the Taxpayer First Act that would prohibit the IRS from developing its own tax filing assistance service. After public backlash claiming the bill favors the often predatory practices of private tax-filing firms, Elliot reports that the provision has been removed from the bill. [propublica]

The House Judiciary Committee announced the launch of a “top-to-bottom” antitrust investigation of Silicon Valley’s largest tech firms, including Apple Inc., Alphabet Inc.’s Google unit, Facebook Inc., and Amazon.com Inc. The Federal Trade Commission and the U.S. Department of Justice will be investigating the tech industry’s impact on local journalism, consumer protection and privacy, and barriers to entry. [cnn]

Economists at the U.S. Department of Agriculture find that the Supplemental Nutrition Assistance Program helped stimulate economic growth, especially in rural America, after the Great Recession. Every $22,000 in taxpayer dollars spent on nutrition assistance between 2001 to 2014 led to the creation of about one job. Researchers found that spending on these benefits helped the U.S. economy more than any other government spending program in the years following the recession. [vox]

Friday Figure

Figure is from Equitable Growth’s, “Equitable Growth’s Jobs Day Graphs: May 2019 Report Edition” by Kate Bahn, Raksha Kopparam, and Will McGrew.

Posted in Uncategorized

Equitable Growth’s Jobs Day Graphs: May 2019 Report Edition

Earlier this morning, the U.S. Bureau of Labor Statistics released new data on the U.S. labor market during the month of May. Below are five graphs compiled by Equitable Growth staff highlighting important trends in the data.

1.

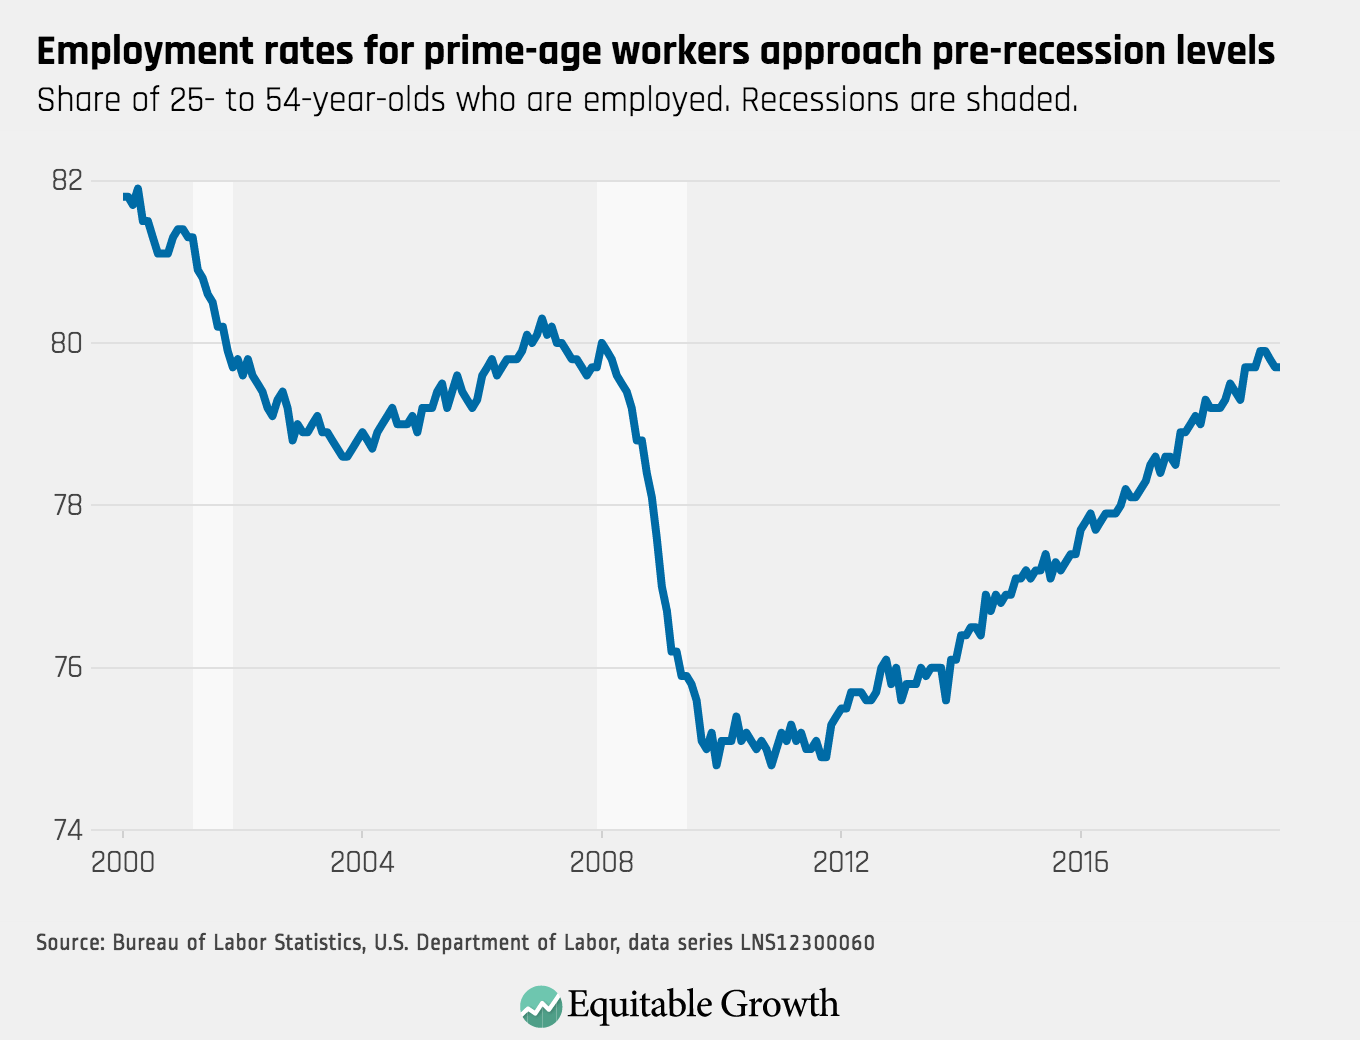
The prime-age employment rate held steady at 79.7%, recovered from the Great Recession but still slightly below its pre-recession heights.

2.

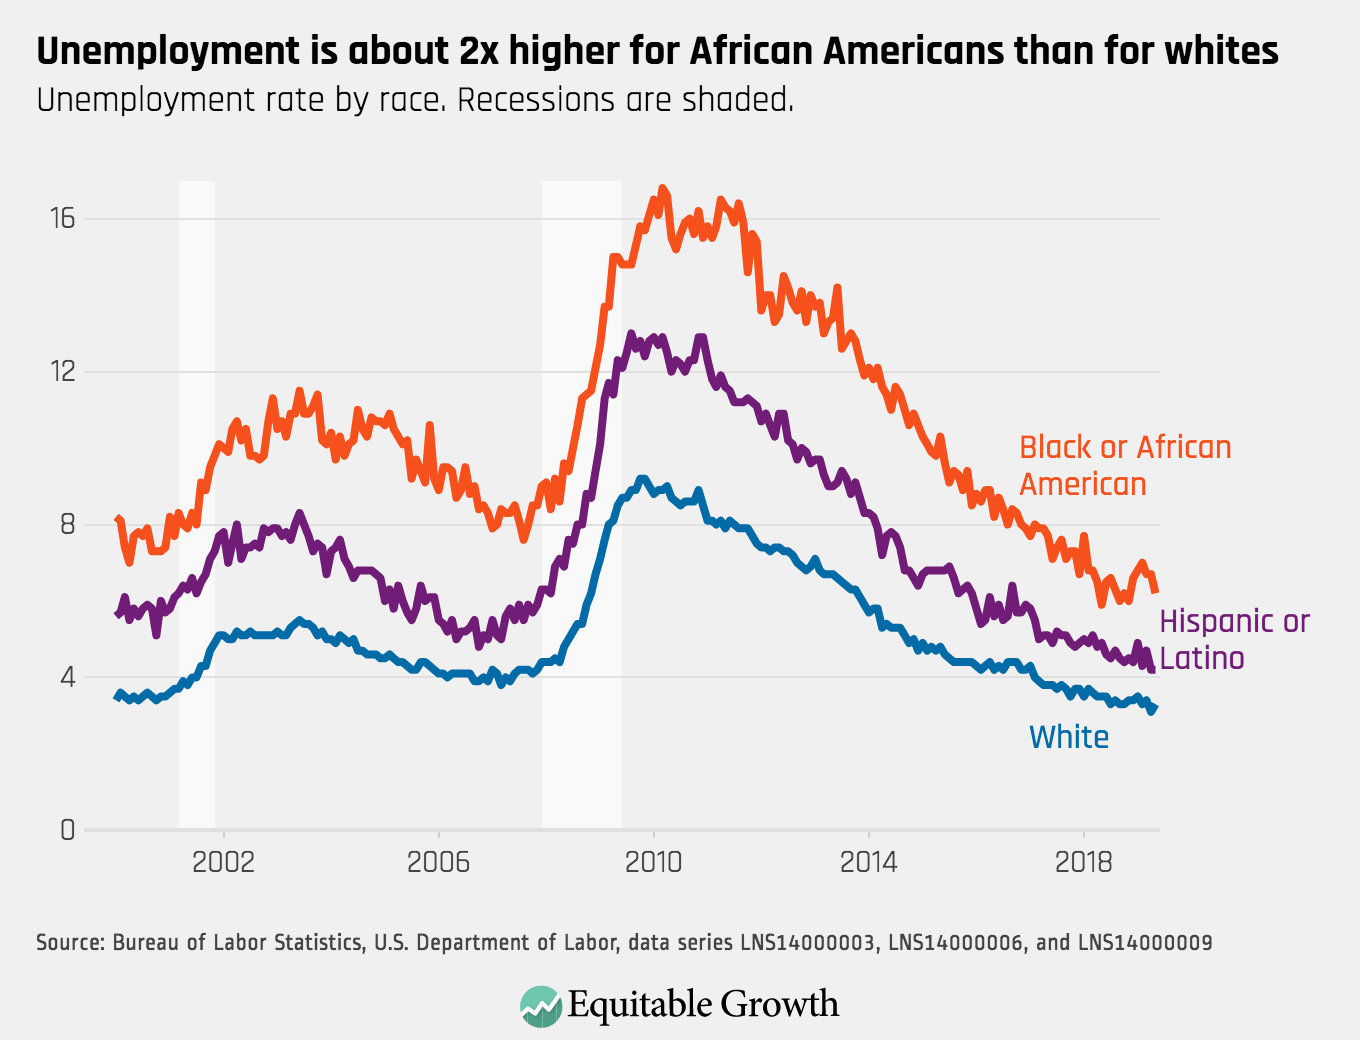
The Black unemployment rate decreased to 6.2%, offsetting the recent upward trend, but remains significantly higher than the White unemployment rate.

3.

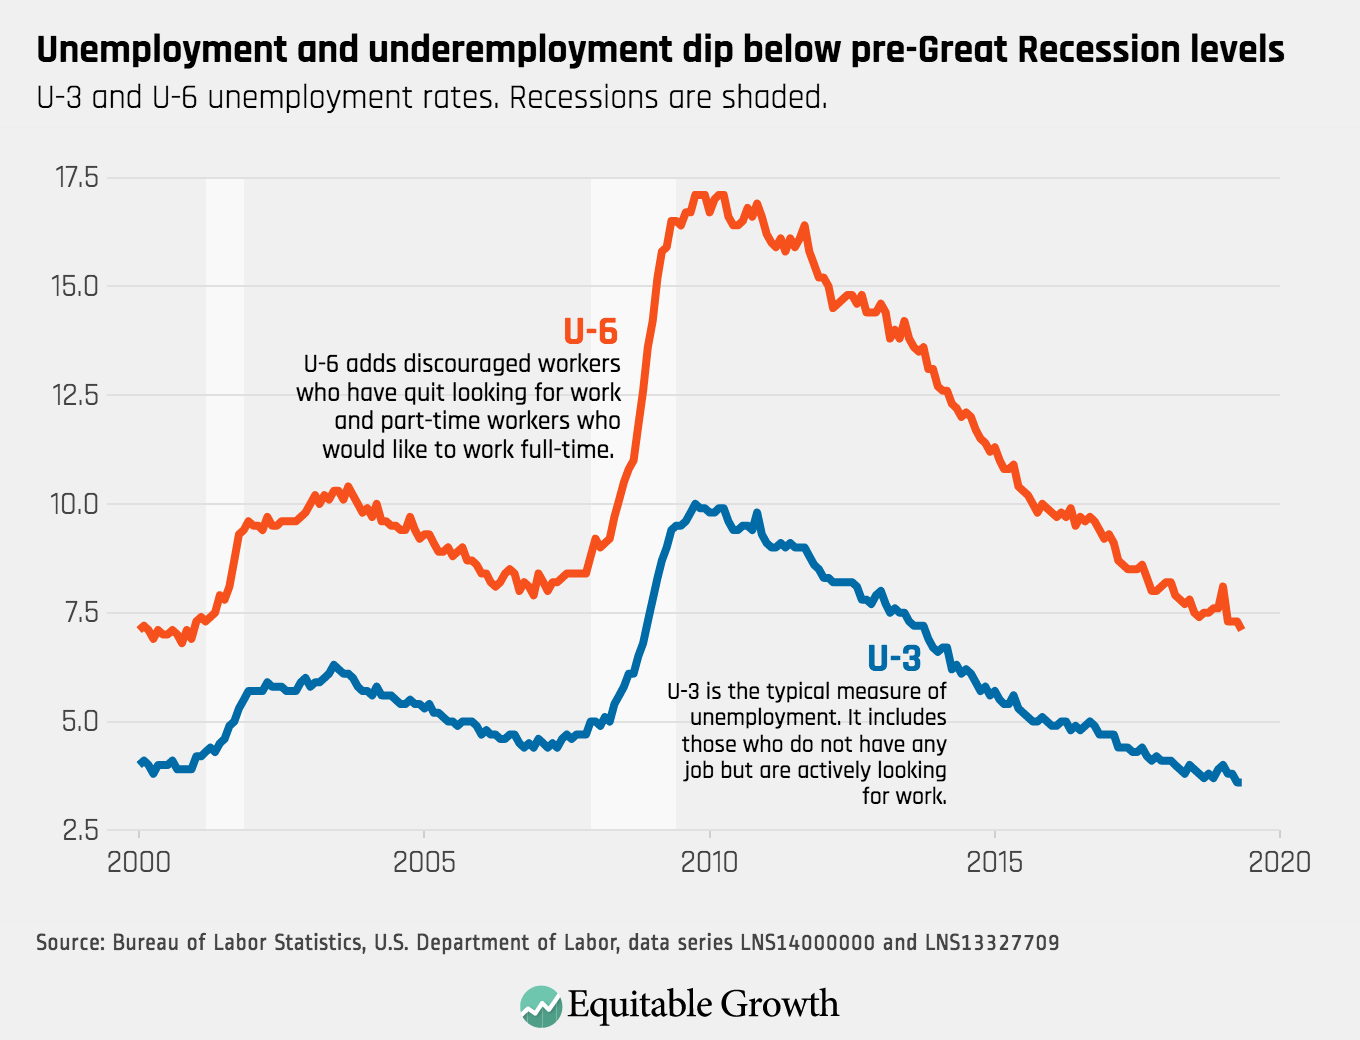
The U-6 employment rate, which includes marginally attached workers, trended downward while the U-3 unemployment rate held steady.

4.

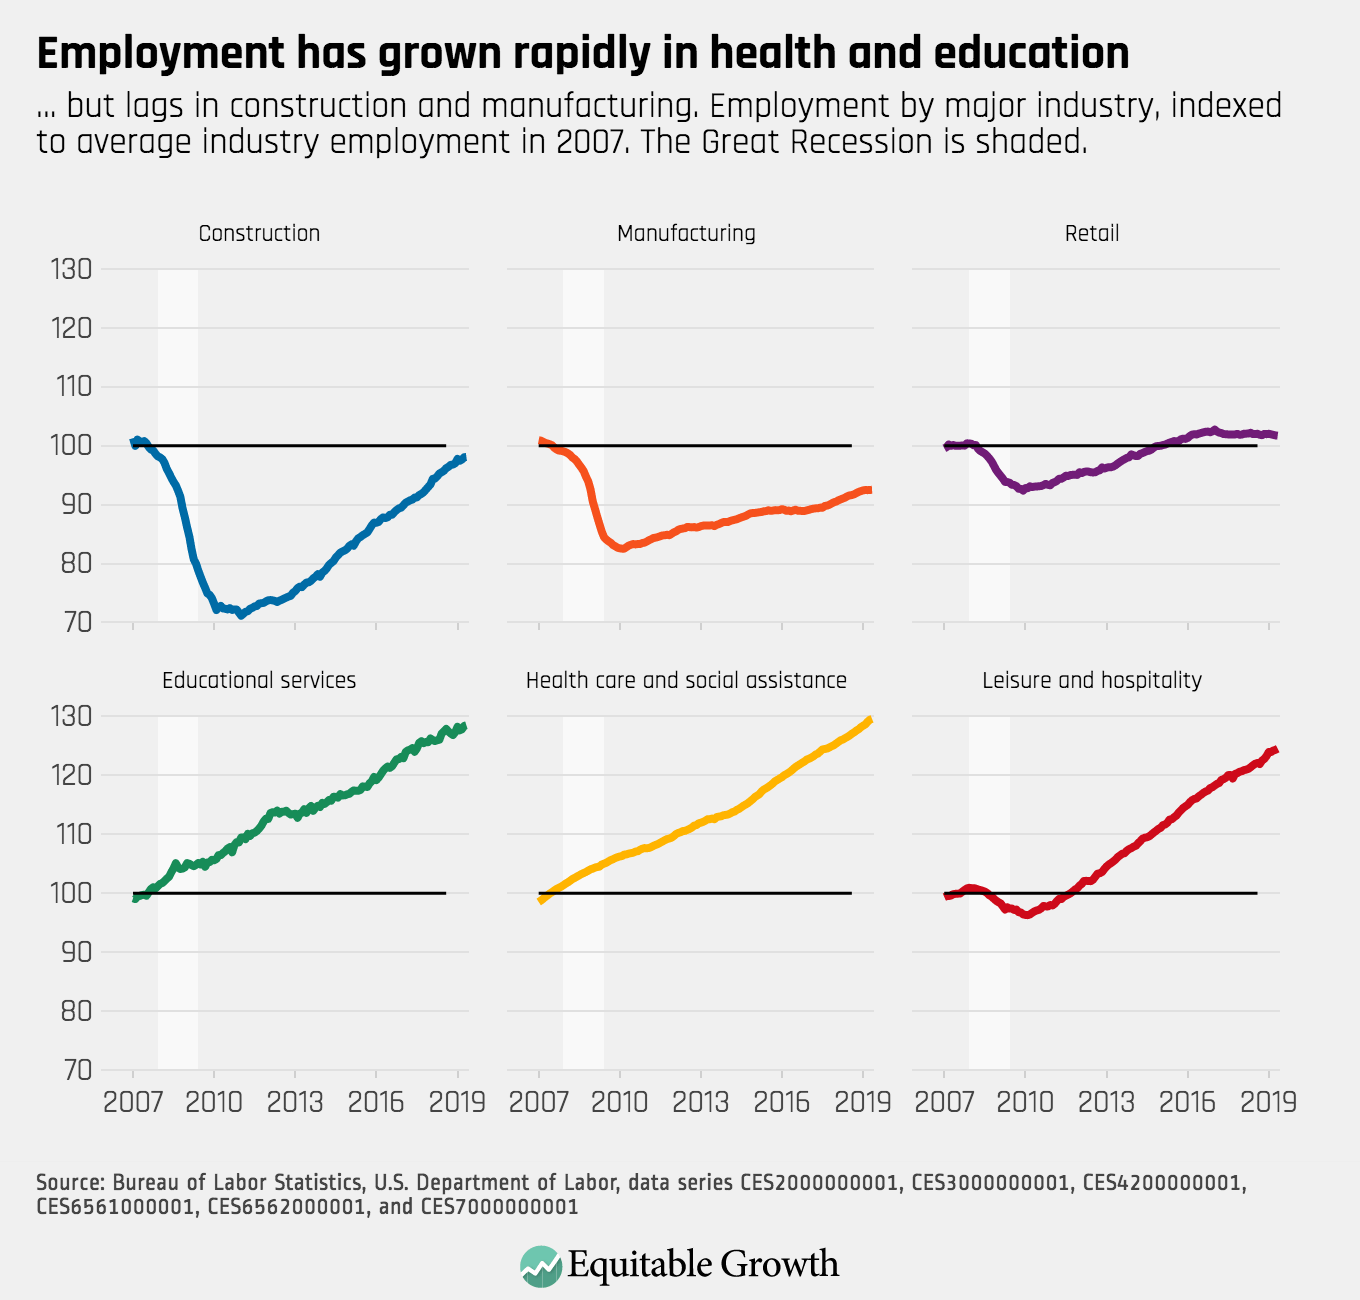
Employment in service sector jobs like health care and leisure and hospitality continues to have strong growth, while employment in construction and manufacturing has plateaued in recent months.

5.

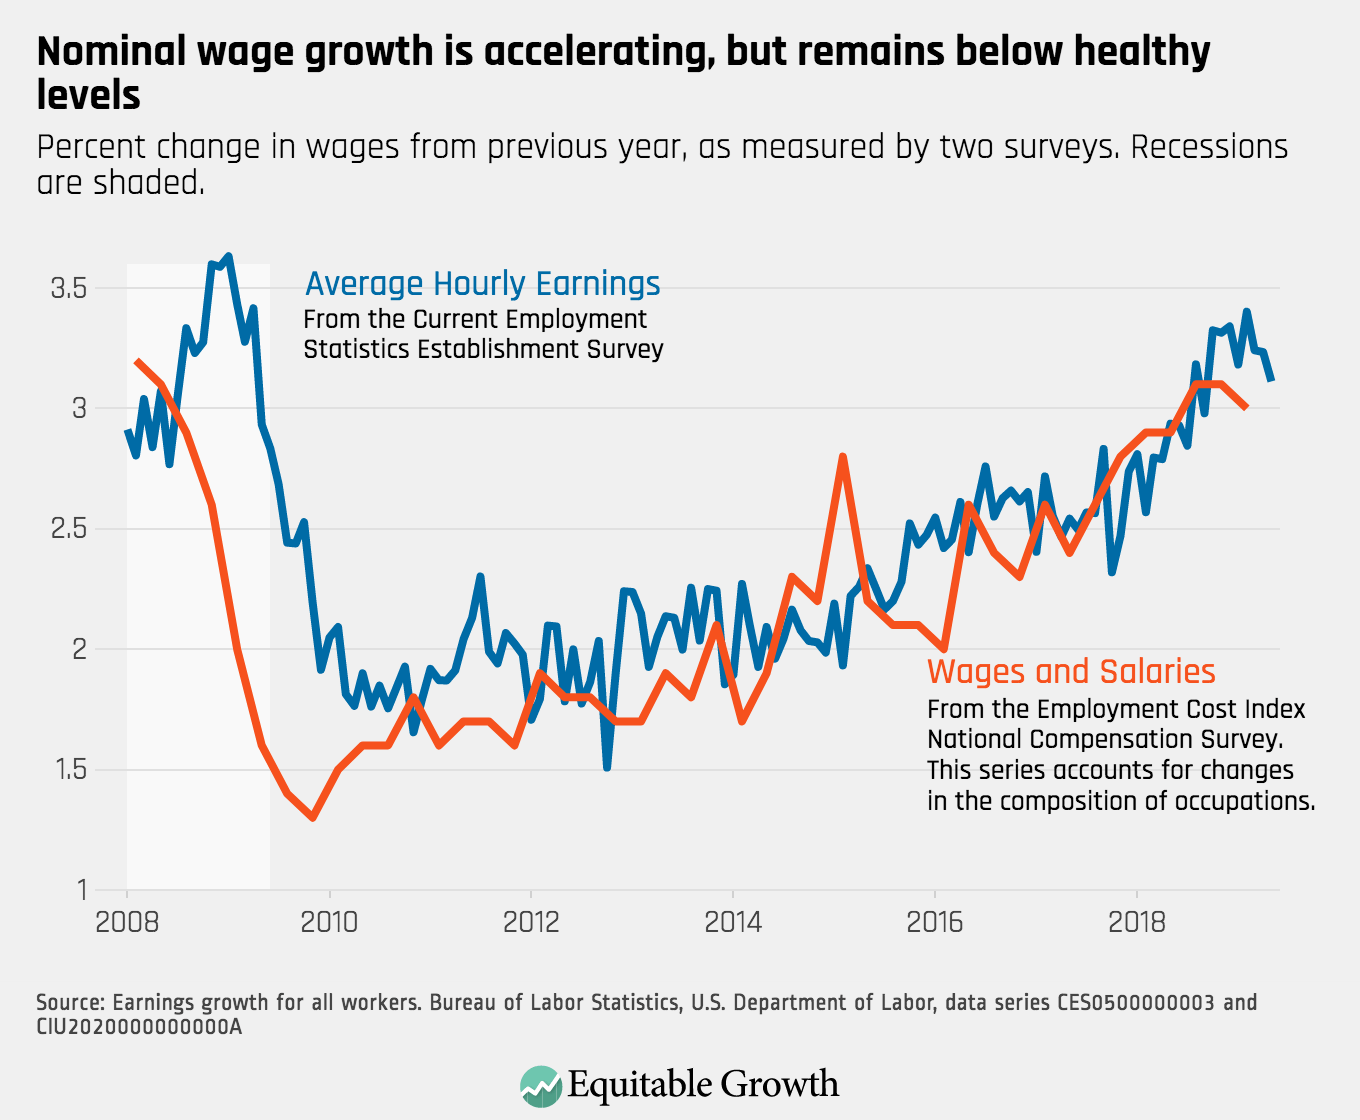
The year-over-year rate of wage growth slowed to 3.1% in May, and remains below the target of 3.5% for a healthy labor market expansion.

Posted in Uncategorized

Statement on the passing of our founding funder, Herb Sandler

Herb Sandler passed away on June 5, 2019.

Herbert Sandler, whose death we deeply mourn, never had a title at the Washington Center for Equitable Growth. But this organization, with its mission of advancing evidence-backed ideas and policies that promote strong, stable, and broad-based economic growth, would not exist without the support and leadership of Herb and the Sandler Foundation.

In 2014, Equitable Growth had two official co-founders, Heather Boushey and John D. Podesta. But Herb was effectively the third. He was generous with the resources of the Sandler Foundation and equally demanding when it came to creating, developing, and implementing their mutual vision of a nonprofit grantmaking organization that would fund original academic research and convey the evidence and policy ideas that emerged from that research to policymakers and journalists.

“Herb was committed to equitable growth long before our organization launched,” said Boushey, who serves as Equitable Growth’s executive director. “He saw the need to reshape the national economic policy debate from one that put markets first to one that recognizes how economic inequality obstructs, subverts, and distorts our society, our democracy, and our economy. His dedication to this idea led him to engage with our nation’s top economists and bring them on board to help us achieve our mission.”

University of California, Berkeley professor of economics and Equitable Growth Steering Committee member Emmanuel Saez said, “Herb wanted to transform academic research in economics to put fairness and inclusivity on equal footing with growth, and make sure the research would have an impact on policymaking. In the past decade, in part because of Herb’s inspiration and support, equitable growth research has thrived, attracting many young talented scholars and reshaping the field of economics.”

“Herb Sandler was a visionary philanthropist,” said Melody Barnes, Equitable Growth Steering Committee member and co-founder and principal of MBSquared Solutions, LLC. “Always rigorous and unafraid of doing big things, he supported and challenged us to bridge the gap between academic research and policy. His wisdom, wit, and deep commitment to progressive causes will be sorely missed.”

Equitable Growth is not the only organization that owes its existence to Herb Sandler and his late wife, Marion. Many have been inspired by the breadth and depth of the couple’s commitment to making this country the just and equitable society they knew it could be. Whether it was promoting economic inequality or human rights or investigative journalism or progressive ideas generally, they had the commitment, discipline, and generosity to find people in whom they believed. Then, they helped those people envision and stand up, one organization after another, and gradually let them walk and then run on their own.

The sadness felt by all of us at Equitable Growth is leavened by the knowledge that Herb lived to see the organization walk and then break into a run. The Sandler Foundation was Equitable Growth’s sole funder when it opened for business, providing the seed money an organization needs to begin its existence. Despite that seminal role, Herb never tried to dictate the research or policy ideas on which that money would be spent. Five years later, Equitable Growth has a dozen foundations investing in its work, with the Sandlers’ share of funding down to about one-third in 2020.

“Just as Herb was committed to the idea of equitable growth, he was committed to the institution of Equitable Growth,” Boushey added. “He was deeply engaged in providing leadership for the organization, as well as a sounding board for ideas, and an advocate for the institution with other potential stakeholders. I met Herb near the end of his life; his mentorship and support of the development of an institution that could help change the national economic narrative—always with good cheer—are gifts for which the organization and I will always be grateful.”

Posted in Uncategorized

Brad DeLong: Worthy reads on equitable growth, May 31–June 6, 2019

Worthy reads from Equitable Growth:

  1. Fascinating! Very, very big if true—and it might well be. Read Fatih Karahan, Benjamin Pugsley, and Aysegül Sahin, “Demographic Origins of the Start-up Deficit,” in which they write: “We propose a simple explanation for the long-run decline in the start-up rate … a slowdown in labor supply growth since the late 1970s, largely predetermined by demographics. This channel explains roughly two-thirds of the decline and why incumbent firm survival and average growth over the lifecycle have been little changed … We test the mechanism using shocks to labor supply growth across states.”
  2. “Charlatans and cranks” was what George W. Bush’s chief economist Greg Mankiw called Arthur Laffer and his ilk. Heather Boushey’s recent tweet about Laffer, “A few thoughts on Arthur Laffer’s legacy,” gets to the core of this criticism. She writes: “Laffer promoted a set of ideas to policymakers that promised to deliver a more fulsome American Dream, even though they were not grounded in empirical evidence. Time and again, we’ve seen that Laffer’s hypothesis that tax cuts will lead to an amount of growth that would make up for lost revenue and improve economic well-being broadly is false … Research undermines the contention since the 1970s that lower rates stimulate the economy. What they seem to do instead is increase inequality. Millions of families have felt the effects of stalled incomes and cutbacks in much-needed government services, including education … Former Kansas Gov. Sam Brownback, a proponent of Laffer’s ideas, admitted that putting his supply-side tax cut plan in place would be ‘a real live experiment,’ one that failed so spectacularly his Republican legislature overrode his veto.”
  3. Let me highlight something of mine from a couple of years ago that is worth highlighting now, in these days of trade wars. Read my interview in the San Francisco Review of Books. An excerpt: “Typically and roughly, the average import we buy from other countries we get for 30 percent off—we use foreign currency that costs us $1.40 to purchase goods and services made abroad that would cost us $2 worth of time, energy, resources, and cash to make at home. But there’s more. Typically and roughly, we sell the typical export to foreigners for about 40 percent more than we would get if we had to find a market for it at home: It costs us $1 worth of time, energy, resources, and cash to make stuff that we can sell to foreigners for $1.40 worth of foreign currency. Thus, for the country as a whole, our foreign trade sector—exports and imports—is a way to get $2 worth of value for $1 worth of work. That’s a very good deal. Our foreign trade sector takes advantage of this good deal on a mammoth scale: In the fourth quarter of 2016, we were trading goods and services at a rate of $2.8 trillion a year—17.5 percent of national income. That means that in a typical year, we sell exports that we could get $2 trillion for if we had to sell them here at home and get imports that would cost us $4 trillion. That makes us $2 trillion per year—$25,000 per family each year—richer and more prosperous. That is a big deal.”

Worthy reads not from Equitable Growth:

  1. I was remiss a couple of years ago in not highlighting this, by four very good friends of Equitable Growth. During the Great Recession, unemployment-benefit extensions had essentially no effect discouraging employment at all: Nobody took advantage of the unemployment-benefit extension to take an extra vacation on Uncle Sam’s dime. Read Christopher Boone, Arindrajit Dube, Lucas Goodman, and Ethan Kaplan, “Unemployment Insurance and Employment during the Great Recession,” in which they write: “We compare 1,161 county pairs that straddle the border between two states, such as Allegany County, Maryland, and Bedford County, Pennsylvania. Within each pair, counties share a similar geography and economic environment, but may have … different lengths of benefits, largely due to the economic situations in the rest of the state … Extending benefits by 73 weeks increased the employment-to-population, or EPOP, ratio by 0.2 percent, a negligible amount that is not statistically significant. While our employment estimates are not statistically distinguishable from zero, they do rule out moderate-sized negative employment effects of the UI extensions on EPOP of 0.5 percent or more.”
  2. We still do not really know why the distribution of income has shifted against labor so much in the past generation. Read Tim Taylor, “Why Did the U.S. Labor Share of Income Fall So Quickly?” for some ideas from a recent report from The McKinsey Global Institute by James Manyika, Jan Mischke, Jacques Bughin, Jonathan Woetzel, Mekala Krishnan, and Samuel Cudre. Taylor notes that the report finds: “From 1947–2000, the labor share of income fell from 65.4 percent to 62.3 percent. There already seemed to be a pattern of decline in the 1980s and 1990s in particular, which was then reversed for a short time at the tail end of the dot-com boom. But since 2000, the labor share has sunk to 56.7 percent in 2016 … ‘We find that that the main drivers for the decline in the labor share of income since 1999 are as follows, starting with the most important: supercycles and boom-bust (33 percent), rising depreciation and shift to IPP capital (26 percent), superstar effects and consolidation (18 percent), capital substitution and technology (12 percent), and globalization and labor bargaining power (11 percent) … One possible interpretation is that sharp drop in labor income from 1999–2016 was a little deceptive, because in part it was based on cyclical factors, but a number of the factors underlying a longer-term decline in labor share continue to operate.”
  3. The eurozone has neither domestic monetary space nor fiscal space nor exchange rate depreciation space to fight a recession, should it come. Of course, the United States is in no better a position. Read Paul Krugman, “After Draghi,” in which he writes: “Europe’s overall performance since the 2008 crisis has been better than, I believe, most U.S. observers realize. The big problem now, I’d say, is the extreme fragility of Europe with respect to any future shocks. In the years since Draghi came in, the euro area has done surprisingly well in restoring growth and regaining employment losses. But this success rests on extremely low interest rates and an undervalued euro. What this means is that Europe has essentially no “monetary space”—there is nothing more it can do if something goes wrong. If there’s a Chinese recession, or Trump slaps tariffs on German cars, or whatever, what can Europe do? The European Central Bank can’t significantly ease monetary policy. Fiscal expansion could help, but it would have to be led by Germany, which seems implausible.”
  4. The focus in “How to Design a Stimulus Package” on the unemployment multiplier number seems very good. The two authors, Pascal Michaillat and Emmanuel Saez, write: “the size of the stimulus does not follow the bang-for-the-buck logic … Stimulus spending should be similarly small when multipliers are small and large. The stimulus should only be large for medium multipliers. Relatedly, the threshold value of one for the multiplier plays no role at all … A well-designed stimulus package should also depend on the usefulness of public expenditure … When the elasticity of substitution is higher, extra public goods are more valuable, so stimulus spending is more desirable … We find that the output multiplier is not a robust statistic to use in stimulus discussion. Instead, we should use the ‘unemployment multiplier.’”
Posted in Uncategorized

Weekend reading: “Alternative workers” edition

This is a weekly post we publish on Fridays with links to articles that touch on economic inequality and growth. The first section is a round-up of what Equitable Growth published this week and the second is the work we’re highlighting from elsewhere. We won’t be the first to share these articles, but we hope by taking a look back at the whole week, we can put them in context.

Equitable Growth round-up

Raksha Kopparam briefly details the findings from Equitable Growth guest author Fiona Scott Morton’s review of recent academic literature on U.S. antitrust and competition issues, arguing that modern research does not support recent policy pushes for antitrust laws to be more limited in scope.

Catch up on Brad DeLong’s latest worthy reads from Equitable Growth and around the web.

Equitable Growth’s Liz Hipple discusses the research findings from Marie Connolly, Miles Corak, and Catherine Haeck that compares intergenerational mobility within and between the United States and Canada and the effects of public policy, race, and inequality in influencing children’s economic outcomes in the two countries.

Links from around the web

Alphabet Inc.’s Google unit, like many other high-tech companies, has worked to garner a reputation as an idyllic workplace with high pay and great benefits. But Daisuke Wakabayashi of The New York Times tells the story of Google’s overlooked workers—its temps and contractors—who now outnumber full-time employees and are making less money, receiving poor benefits, and garnering no paid vacation time. (nyt)

Gig economy workers are facing extreme financial hardships, according to the latest report from the Federal Reserve examining economic well-being in the United States. Vox’s Alexia Fernandez Campbell breaks down the shocking statistics, including that 58 percent of gig economy workers couldn’t afford a $400 emergency and that 40 percent of drivers qualify for Medicaid and 18 percent qualify for food stamps. (vox)

Will Parker and Cameron McWhirter of The Wall Street Journal shed light on Uber Technologies Inc. drivers facing economic hardships who have taken on new part-time jobs in the gig economy—working for house flippers. In the struggle for additional cash, Uber drivers are being paid by house flippers to identify homes on their routes that real-estate firms can buy, flip, and quickly sell for large profits. (wsj)

The U.S. economy has seen a shift over the past decade of minimizing labor costs and cutting lasting ties to their workers as the rest of the country’s quest for decent jobs continues. Steven Greenhouse, Lawrence Mishel, Katherine Stone, and David Weil discuss the toll that alternative work arrangements are taking on American workers in The American Prospect. (prospect)

Chris Westfall asks why 46 percent of Americans are finding themselves working side jobs in order to make ends meet and looks at whether our strong Gross Domestic Product numbers are being felt by everyday workers. (forbes)

Friday Figure

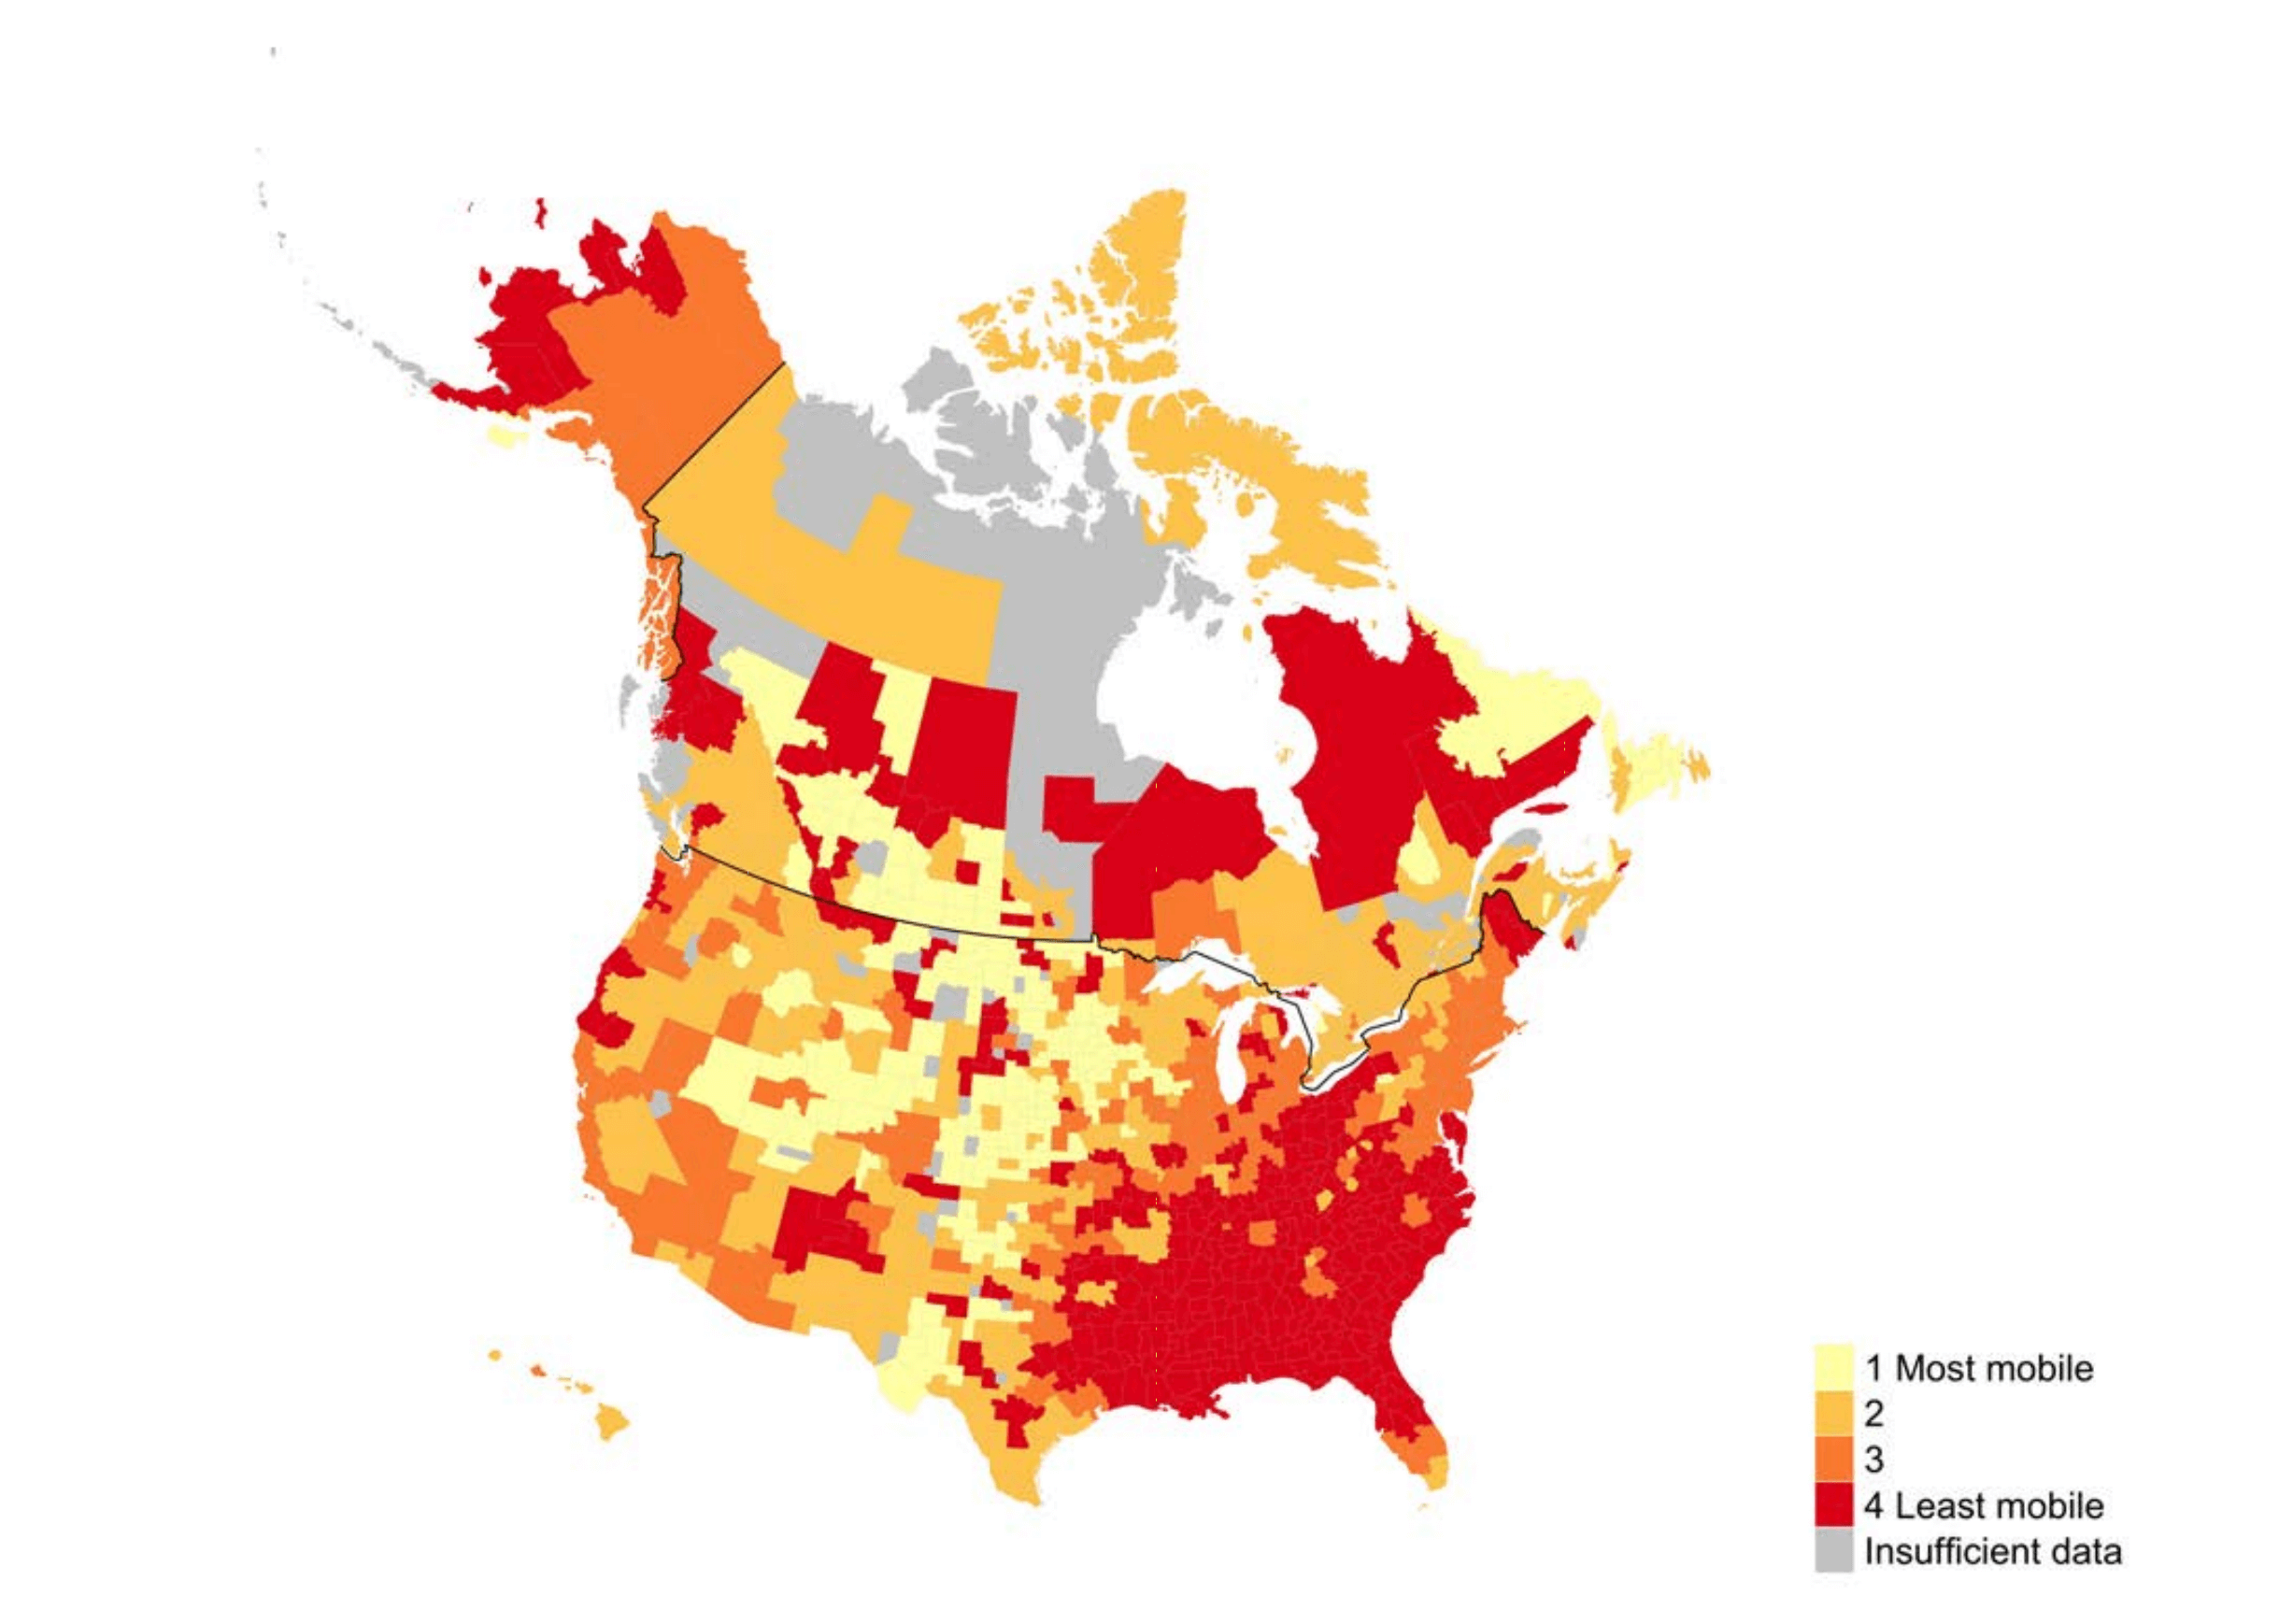
U.S. and Canadian rates of economic mobility

A cluster map of mobility rates shows that while there are areas of low mobility in both Canada and the United States, areas of low mobility are more widespread in the United States

Source: Marie Connolly, Miles Corak, and Catherine Haeck, “Intergenerational Mobility between and within Canada and the United States.” Working Paper No. 25735 (National Bureau of Economic Research, 2019), available at LINK.

Figure is from Equitable Growth’s, “Low intergenerational mobility in the United States shows impact of race and public policy” by Liz Hipple.

Posted in Uncategorized