JOLTS Day Graphs: March 2019 Report Edition
1.
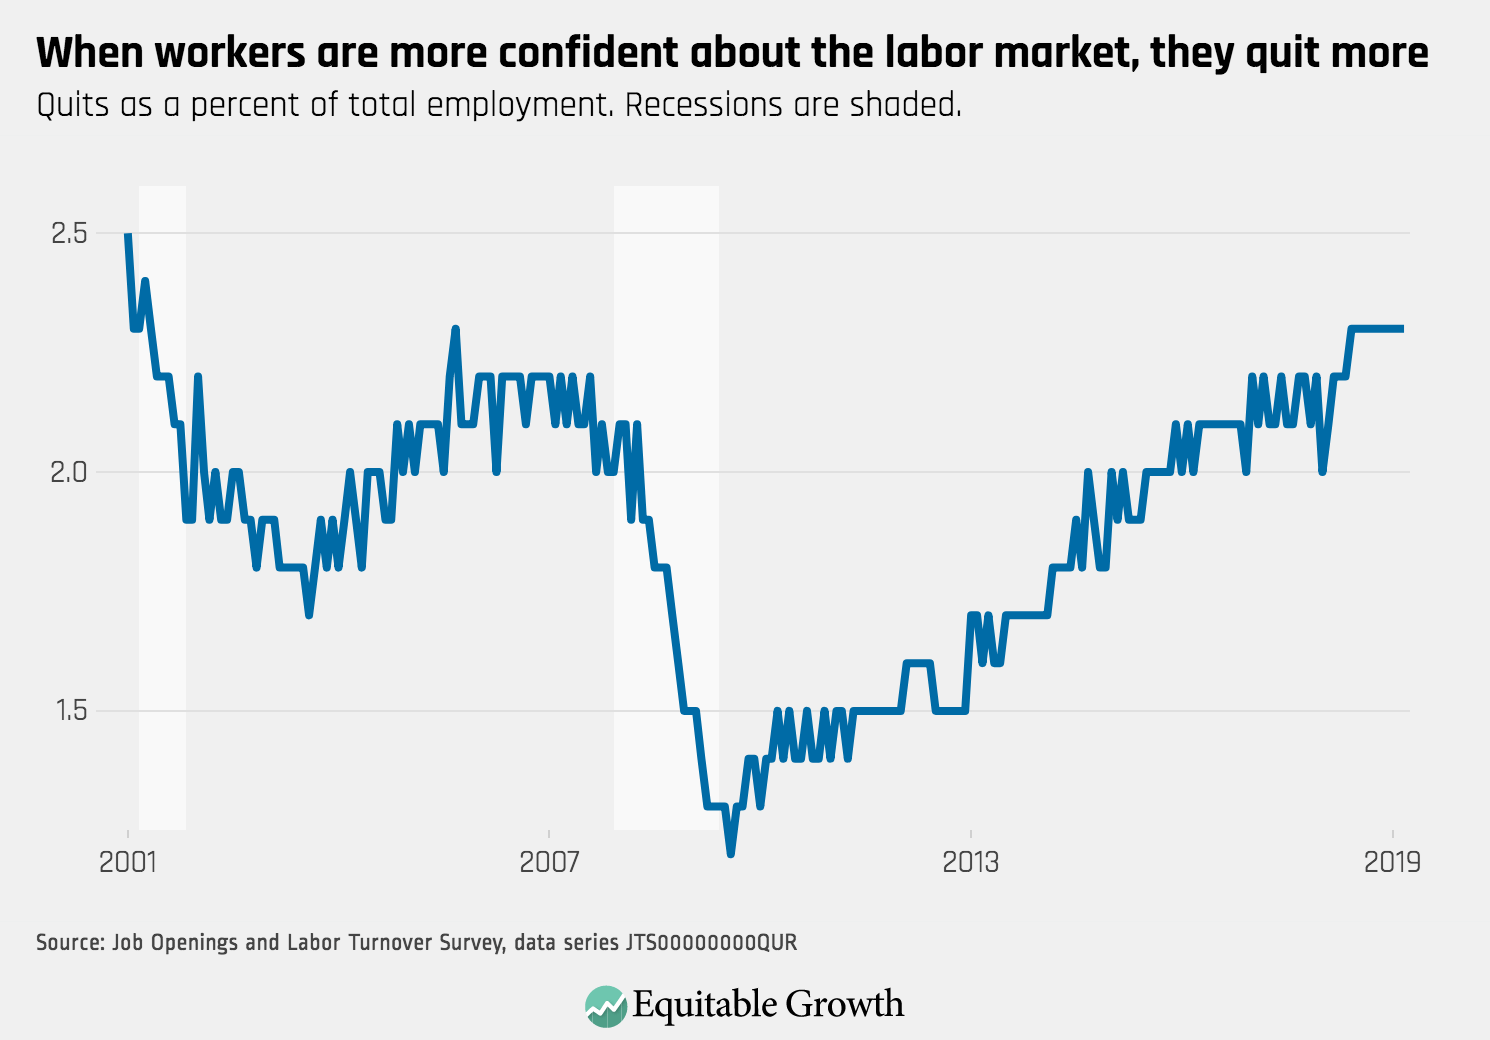
The quits rate held steady at 2.3% for the 10th month in a row, reflecting a steady labor market where workers are confident leaving their jobs to find new opportunities.
2.
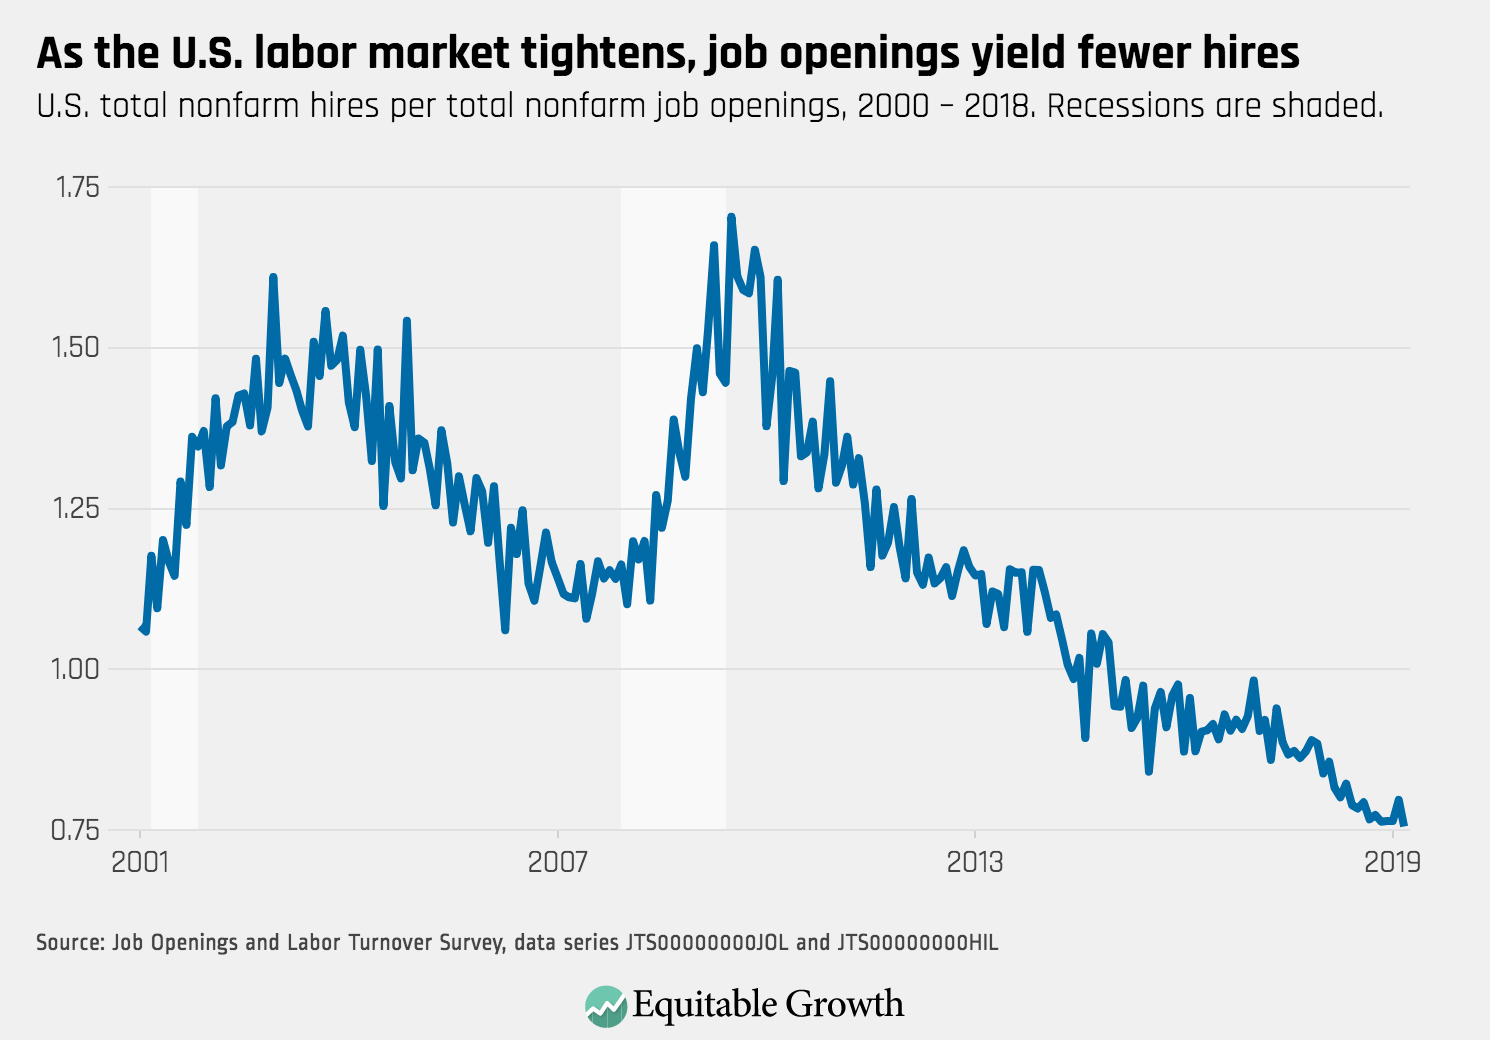
The rate of hires-per-job opening was little changed at 3.8%, reflecting 5.7 million hires in March.
3.
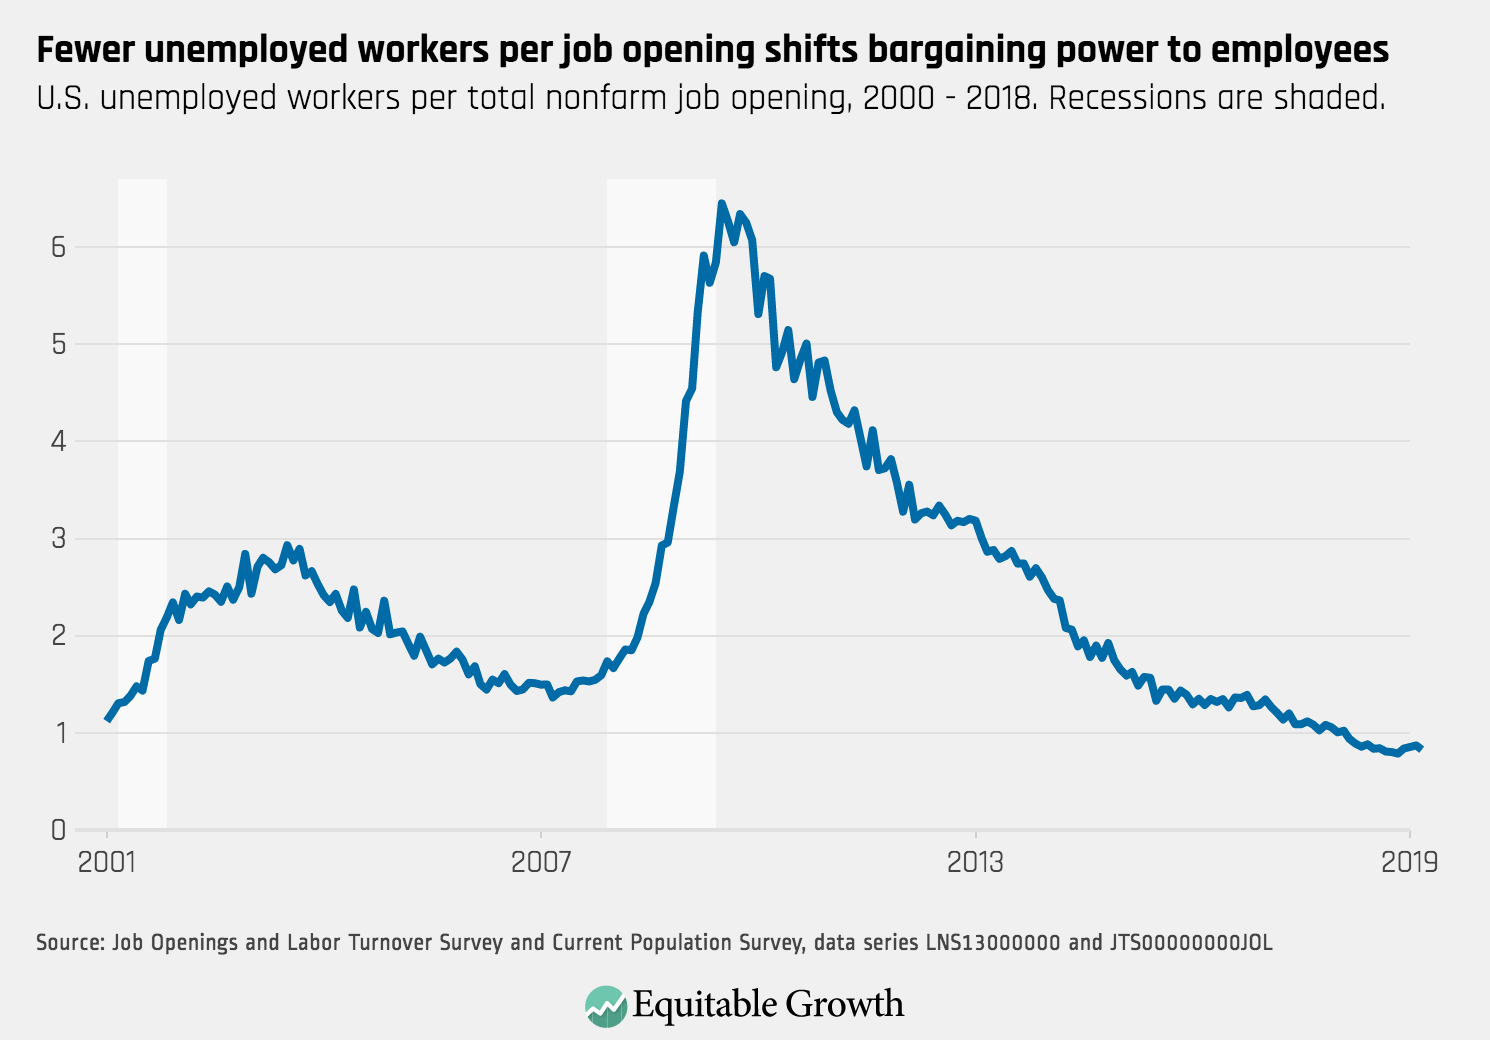
The number of job openings increased to 7.5 million in March and remains below one, indicating fewer unemployed workers than there are job openings.
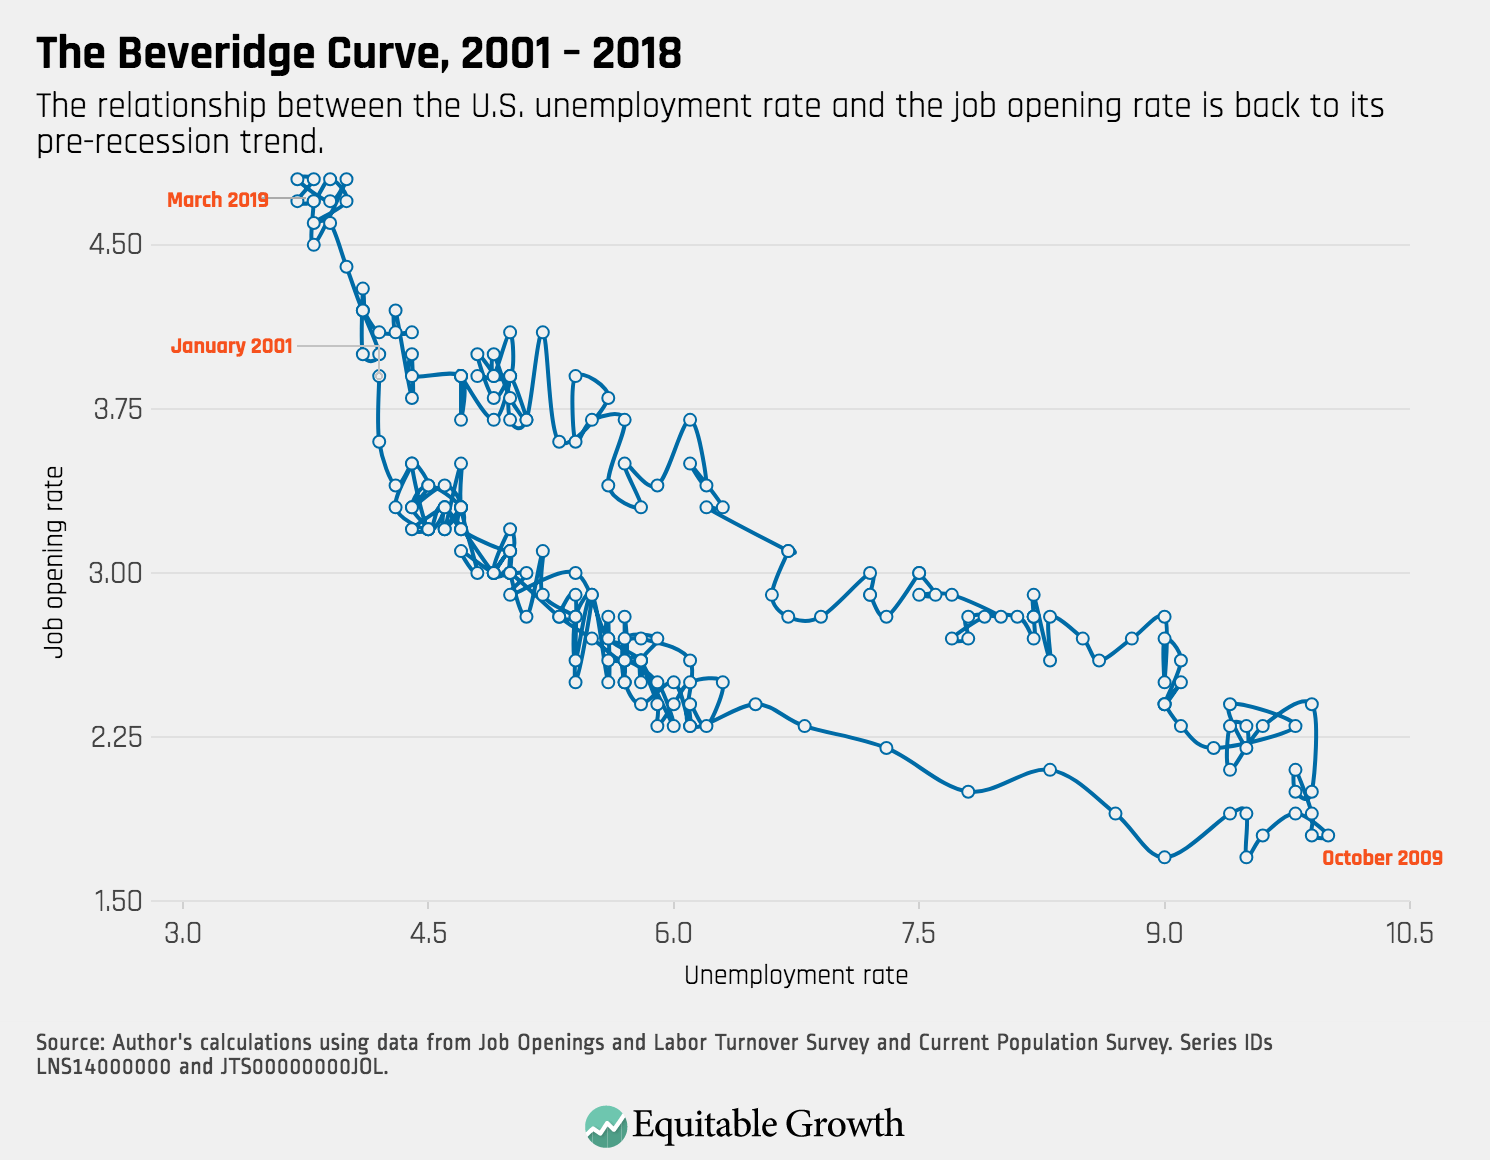
4.
The Beveridge Curve continues to reflect an expansionary labor market, above the levels of the early 2000s expansion because of the historically low unemployment rate.