Michael Linden Washington Center for Equitable Growth Testimony before the House Budget Committee on The Fiscal State of the Nation
May 7, 2025
Chairman Arrington, Ranking Member Boyle, members of this committee, thank you for the opportunity to be here.
Today, I’d like to make three main points.
First, the main culprit responsible for our nation’s weakened fiscal situation is the series of repeated, large tax cuts that primarily benefited wealthy individuals and corporations. Put simply, over the past 25 years, Congress has spent many trillions of dollars on unpaid-for tax breaks, and that is the main reason why our national debt is on an upward trajectory.
Second, if you are interested in efficiency and cost savings, this Congress is looking in the wrong place. The federal tax code is rife with loopholes, special subsidies, and giveaways that benefit the very wealthy and giant corporations with little or no discernable benefit to the public.
And finally, cutting Medicaid, cutting food assistance, and raising the costs of everyday goods, all to partially offset yet another round of massive tax cuts for the wealthy, is both economically and fiscally reckless, as well as morally indefensible.
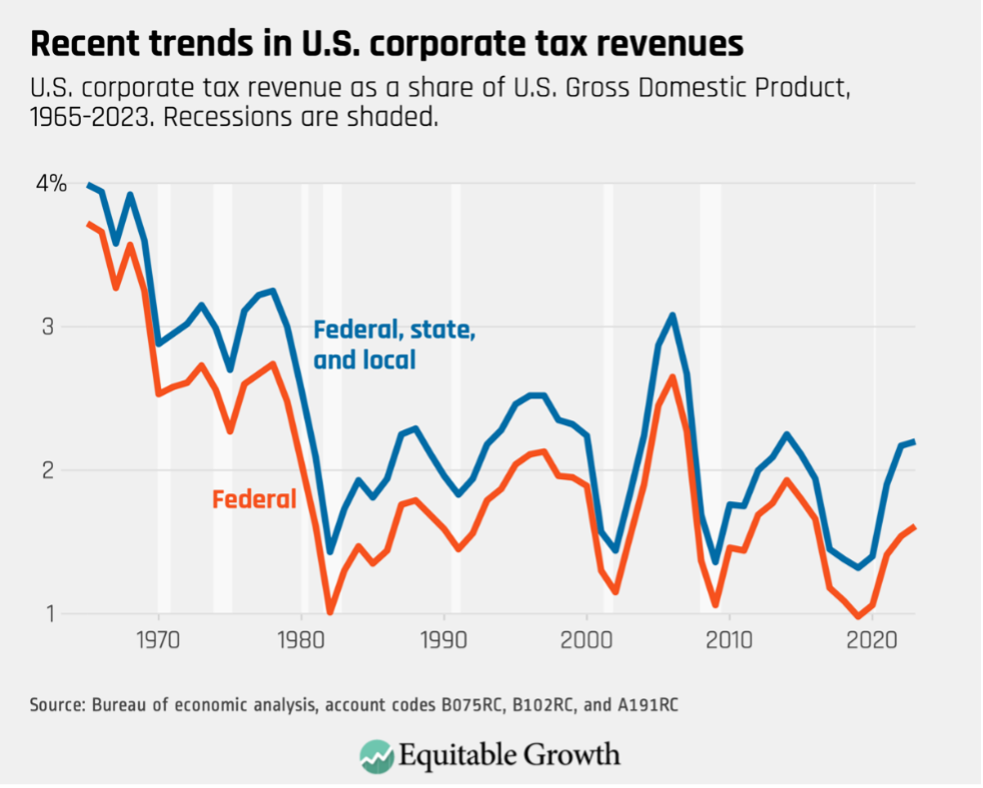
To begin with, the primary (if not sole) reason why current projections have the federal debt rising in perpetuity instead of falling is because of tax cuts. If not for the series of tax reductions enacted in 2001 and 2003, and then extended in 2010 and 2012 and added to in 2017, the debt as a percent of Gross Domestic Product would be on a permanent downward trajectory.1 Let me repeat that, the debt, today, would be falling, instead of rising, if we hadn’t spent trillions of dollars on tax cuts over the past quarter-century.
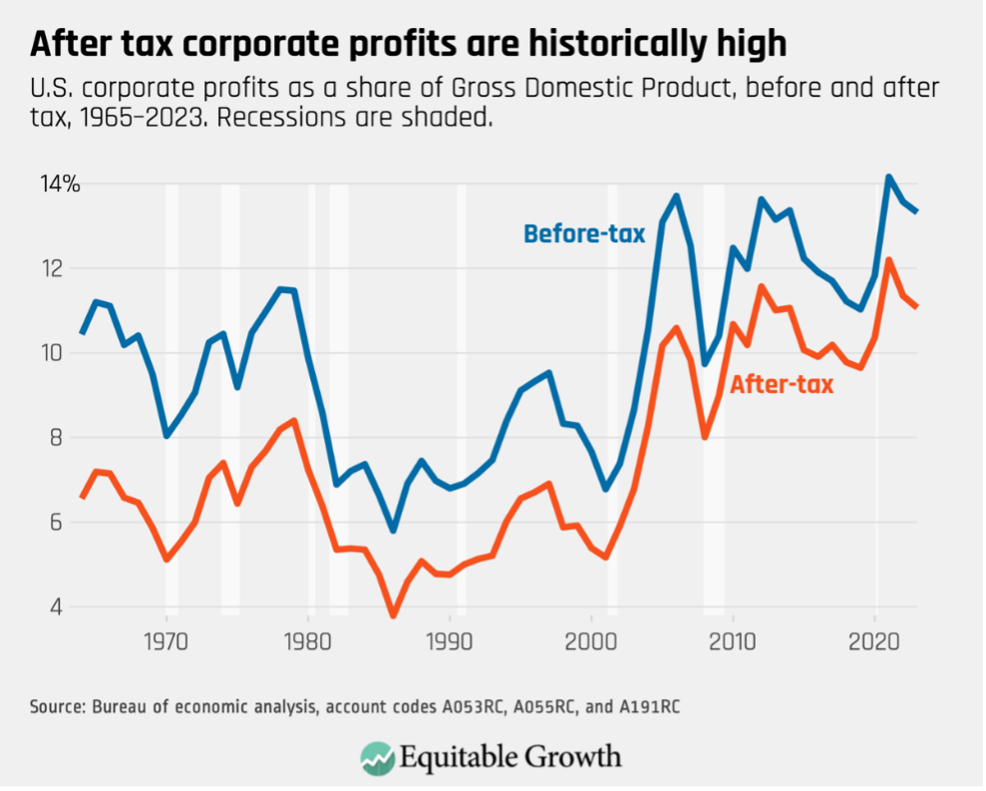
We always knew that costs would rise for programs, such as Social Security and health care, as my parents’ generation entered retirement. And yet, even with these expected added costs, the fiscal situation was projected to be stable before all of those tax cuts were enacted. And, as it happens, since 2000, spending on Social Security, Medicare, and Medicaid has grown much more slowly than anticipated, not more quickly. Despite this, our fiscal situation has deteriorated. That’s because, while the federal government is spending less today than expected on retirement and health care and on everything else, our tax code is generating much less revenue than it used to.2
Making matters worse, a disproportionate share of those tax cuts has gone to very high-income households. Across all of the tax cuts enacted since 2001, close to half of the total benefit has gone to the richest 5 percent of households.3 For a household in the richest 1 percent, their combined tax cut from all the changes enacted since 2001 is roughly 45 times larger than the tax cut for a family in the middle of the income distribution.
That’s why it is so surprising this Congress is seriously considering whether to enact yet another round of very expensive tax cuts that disproportionately benefit the wealthy. The first thing you should do if you want to get out of the hole that previous rounds of tax cuts have created is stop digging.
Instead, this Congress has passed a budget framework that would allow the federal government to spend as much as $5.5 trillion on more tax breaks for the wealthy. It is hard to take seriously anyone who claims to care about the fiscal state of our nation while simultaneously pushing a budget that would continue the pattern of reckless tax cuts for the rich that put us here in the first place.
Moreover, it is simply wrong to place the blame for our fiscal challenges on the everyday Americans who rely on Medicaid or food assistance for basic survival needs, instead of on the expensive tax cuts that have gone overwhelmingly to the rich and corporations. Federal health care spending, to take a pertinent example, has come in far lower—not higher—than what was predicted a dozen years ago. The Congressional Budget Office now expects that we will spend about $5 trillion less on health care over the next decade, compared to its 2012 projection, but those trillions of dollars in savings are dwarfed by the roughly $15 trillion that the previously enacted tax cuts will cost our nation. And this Congress is contemplating adding another $5 trillion to that already-staggering number.
Instead of cutting programs, such as Medicaid, that deliver real benefits to everyday people and are already fairly lean, this Congress should be focusing on the area of the federal budget that truly is bloated with wasteful costs, unnecessary subsidies, and counterproductive incentives for the wealthy and corporations: the tax code.
Consider the 40 percent reduction in the tax rate for massive corporations in 2017 under President Donald Trump during his first term. That single giveaway is estimated to have cost roughly $1 trillion already—and will cost trillions more over the next decade. These corporations didn’t raise wages or create more jobs.4 They enriched their shareholders and executives. That is the definition of wasteful spending.
Those who are quick to scrutinize the choices of a poor family receiving $6 a day in food benefits never get around to asking whether a giant corporation is doing what they promised to do with their billions in tax cuts—or whether they needed them in the first place.
The truth is that far too many Americans are struggling to make ends meet while those at the top get richer and richer. That’s why most Americans support investing more—not less—in supporting the most vulnerable among us.5
But, right now, this Congress is crafting a budget plan that would do the opposite. It would take health care away from at least 10 million people and potentially millions more. It would mean more hungry children. And, at the same time, it would ask struggling families to make do with less while bestowing another tax giveaway for the ultra-wealthy.
One analysis of this Congress’ budget framework finds that cutting Medicaid and food assistance, combined with renewing all of the expiring tax cuts, results in 70 percent of the benefits going to the richest 5 percent, while the bottom 40 percent pays more.6 And it would do all of this while making our federal budget deficit worse. That is a terrible policy mix, and it is no surprise that the American people strongly oppose it.
It is perfectly reasonable to be concerned about the fiscal state of our nation. What is not reasonable—and is, in fact, totally backwards—is asking millions of struggling families to pay more while the rich and corporations pay less.
Did you find this content informative and engaging? Get updates and stay in tune with U.S. economic inequality and growth!
Most U.S. labor market data characterize jobs by describing the categories of industry and occupation to which the jobs belong. But to understand why some types of jobs tend to pay well while others do not, even the most detailed versions of these categories are not that helpful. Nothing about the terms “fast food and counter workers” and “bioengineers and biomedical engineers” explains why workers in the former category tend to have low wages while workers in the latter category tend to have high wages.
To understand differences in wages across occupations—why some jobs pay better than others—it helps to consider how the content of jobs differs across occupations. What do people do at work? What skills do they use? What talents or abilities help people perform well? Data from the Occupational Information Network, or O*NET, help researchers measure how occupations differ on these dimensions, among many others.
In particular, O*NET measures the degree of importance and complexity of dozens of skills, abilities, and work activities within hundreds of detailed occupations. To make things concrete:
Skills are capabilities people develop that help them learn or do their jobs. Examples include critical thinking, active listening, computer programming, and complex problem solving.
Abilities are more permanent talents that can help people do their jobs. Examples include stamina, memorization, and written expression.
Work activities are sets of similar actions or tasks performed together across different jobs. Examples include staffing organizational units, performing administrative activities, selling or influencing others, and scheduling work and activities.
For each skill, ability, and work activity, a combination of expert analysts at O*NET and workers surveyed about their jobs assess the importance of each of these more-detailed job characteristics (on a five-point scale) and the degree of complexity involved (on a seven-point scale) in how they figure into each occupation. Correlating these measures with wages can help reveal what is driving pay differences across occupations.
This issue brief will explore these differences in pay across a variety of occupations and how real wages, after factoring in inflation, changed over the course of the past 25 years. While policymaking undoubtedly plays an important role in wage dynamics over time, it is also important to have a clear understanding of the role played by economic fundamentals. Our aim is to begin an examination of how demand for skills, abilities, and work activities changed across and within different occupations, explore how these changes relate to job quality, and lay the groundwork for discerning how the U.S. labor market will shift anew as new technologies such as artificial intelligence become more prevalent in U.S. workplaces.
How do wages relate to job content?
Because the content of jobs in any given pair of occupations will differ on many dimensions at once, we use a regression framework to consider how the importance of each skill, ability, and work activity that O*NET measures relates to wages. Our estimates answer the question, “A one unit increase in the importance of this characteristic is associated with what percent change in average wages, holding all else constant?” We start by using data from 2020 through 2024.
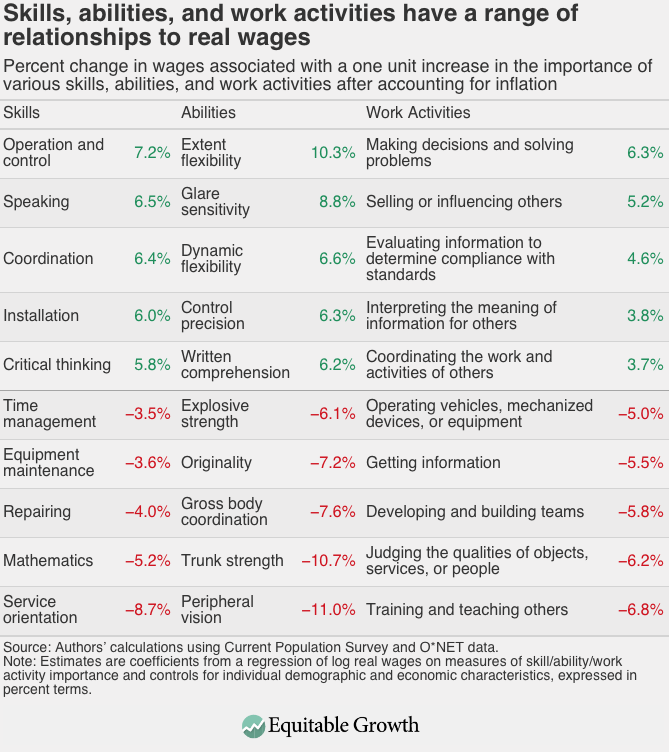
Table 1 below shows the five skills, abilities, and work activities that we estimate to have the strongest positive and negative correlations with wages. Some of these correlations may be surprising. Within skills, for example, consider mathematics, which is negatively correlated with real wages. If you expected mathematics to be positively correlated with wages, why is that? Could it be because mathematics skills help workers complete in-demand, remunerative tasks, such as making decisions and solving problems, which are among the activities most positively associated with wages? Or because mathematics seems similar to other important skills such as critical thinking, which is among the most positively associated with wages?
By comparing occupations on all these dimensions at once, our regression attributes to each one only the relationship with wages directly connected to it, rather than lumping together contributions from sets of connected characteristics. (See Table 1.)
Table 1
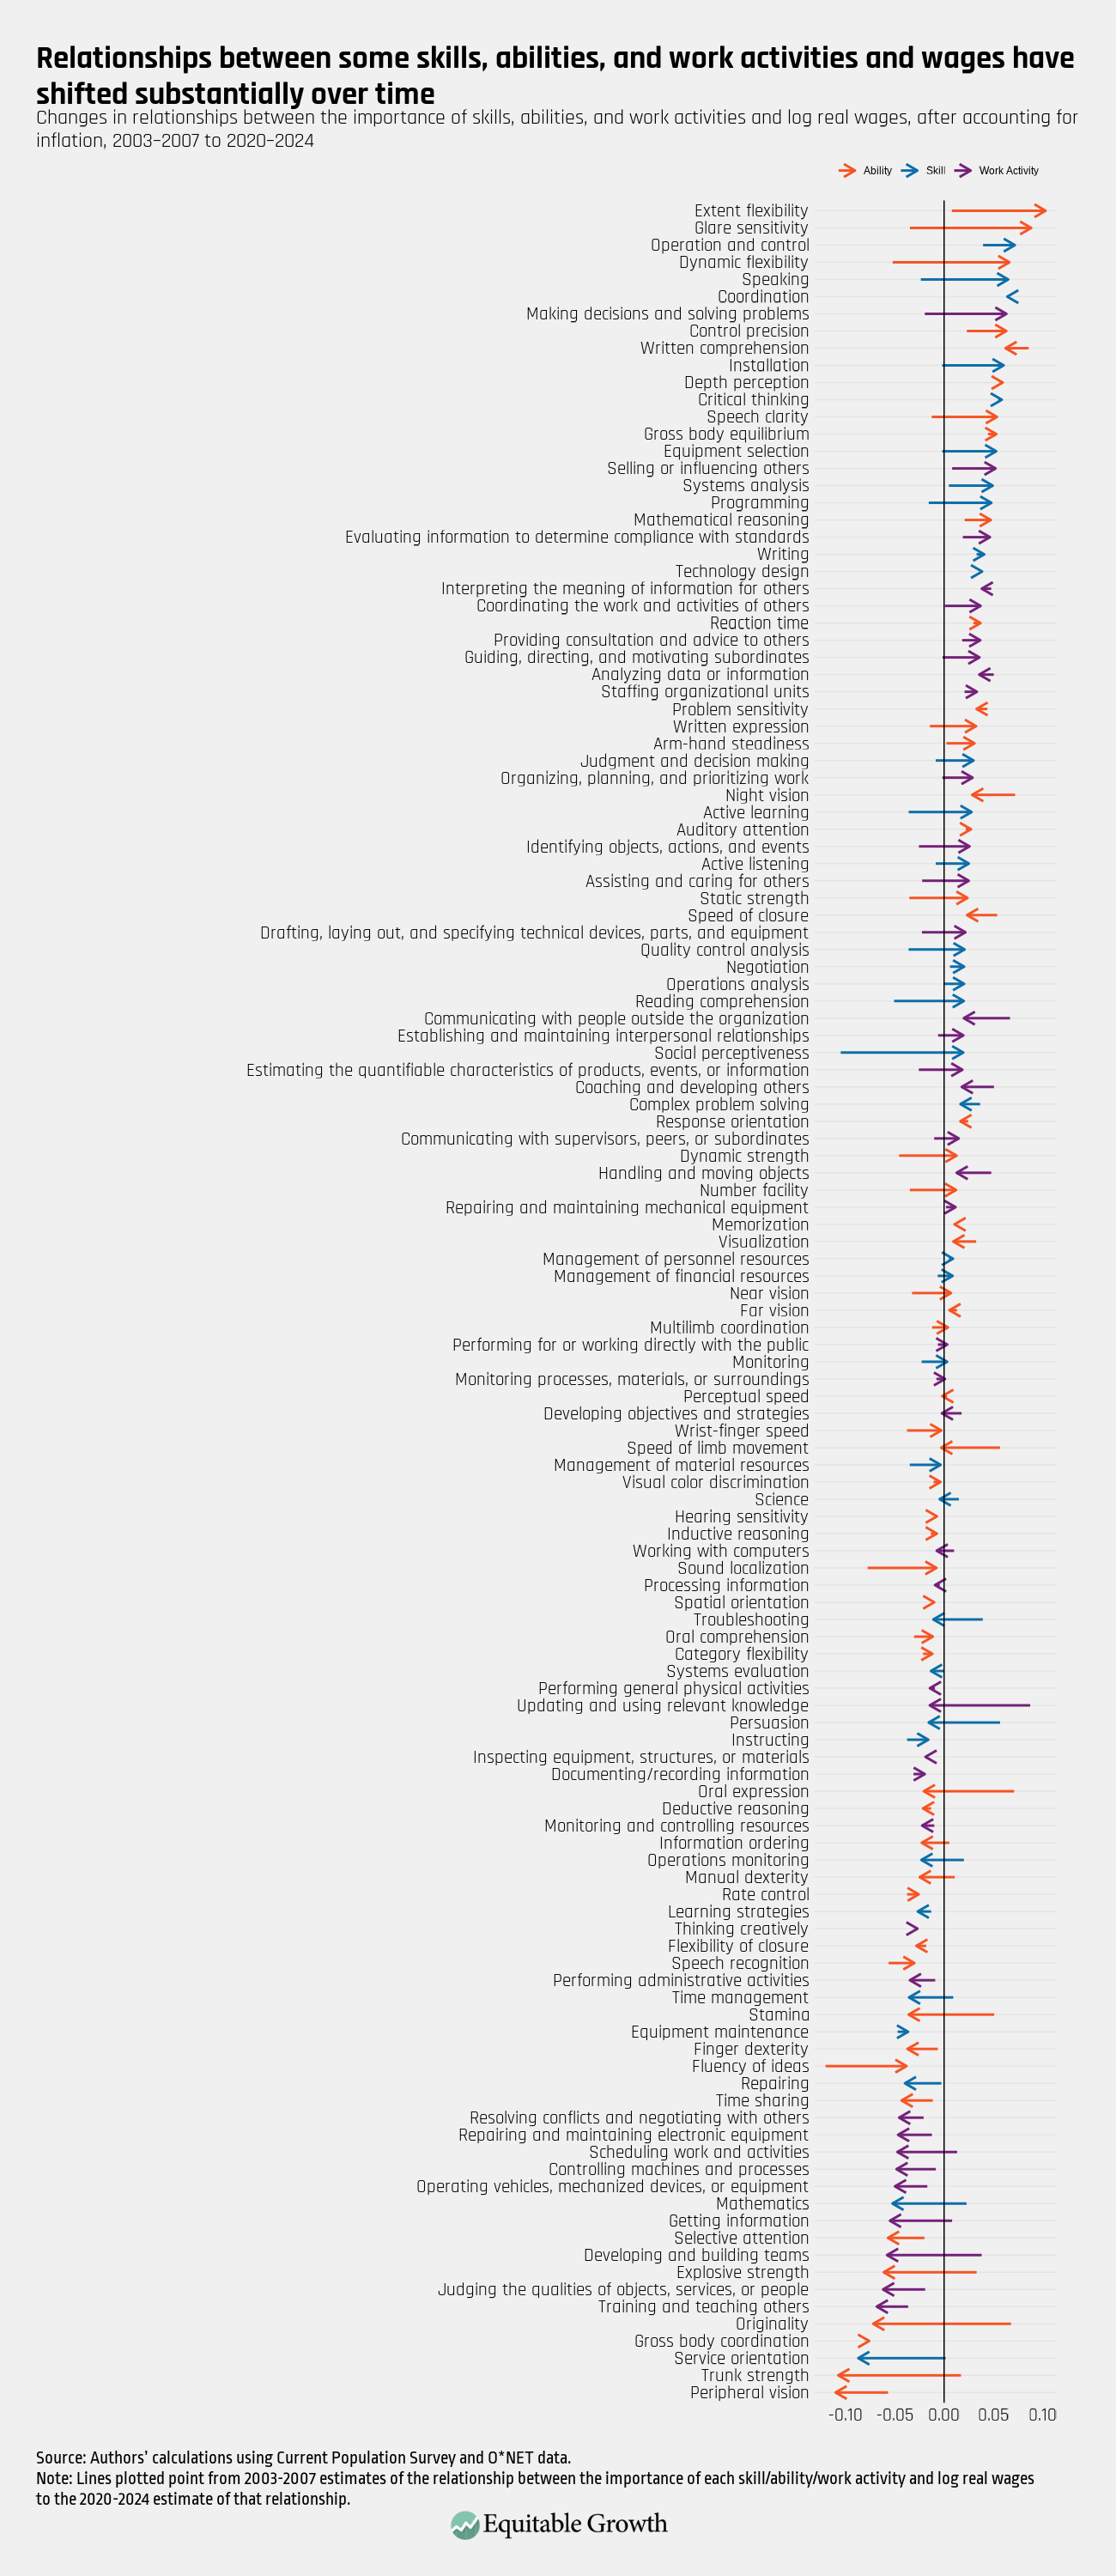
Next, we investigate how the relationships between skills, abilities, and work activities have changed over time. Figure 1 below shows how the association between each skill, ability, and work activity and real wages, after accounting for inflation, has changed between 2003–2007 and 2020–2024. (Characteristics are sorted according to their 2020–2024 correlations with wages.) Several characteristics have registered substantial shifts in their wage correlations over this period, including many that are currently among the most positively and negatively correlated with wages.
The physical abilities that appear in Table 1, in particular, have displayed big shifts since 2003–2007. Extent flexibility (the ability to bend, stretch, twist, or reach), glare sensitivity (the ability to see objects in the presence of glare or bright lighting), and dynamic flexibility (the ability to quickly and repeatedly bend, stretch, twist, or reach) have all gone from being minimally or negatively correlated with wages to among the abilities most positively correlated with wages. At the other extreme, trunk strength and explosive strength went from having positive wage correlations to having among the most negative wage correlations. (See Figure 1.)
Figure 1
This raises interesting questions about what has happened. Differential progress in the development of technologies that assist or replace the performance of work requiring strength and gross body movements versus precision and fine motor control could have changed the relationship between the importance of these abilities for workers and the associated compensation. Looking further into these and a number of other shifts depicted in Figure 1 would be very interesting for researchers to further detail these changing workplace dynamics.
It is also interesting to think about how these relationships might change in the future. Rapidly developing artificial intelligence technologies are very likely to change the content of some jobs in the short term to medium term, and the range of longer-term possibilities is wide. We will address questions related to AI more extensively in a future column.
Did job content matter for post-pandemic wage growth?
Following the onset of the COVID-19 pandemic in 2020—and potentially encouraged by the policy responses to it—the U.S. labor market experienced a period of unusually high job turnover, first driven by layoffs amid pandemic shutdowns and later driven by voluntary quits. Collectively, this period has sometimes been called the Great Resignation or the Great Reshuffle.
One important consequence of this period is that many workers were doing different kinds of work at the end of it than they were at the beginning. At the same time, pandemic conditions led to large shifts in consumption, first away from and then back toward in-person services. Could these shifts have been accompanied by changes in the returns to earnings of different skills, abilities, or work activities?
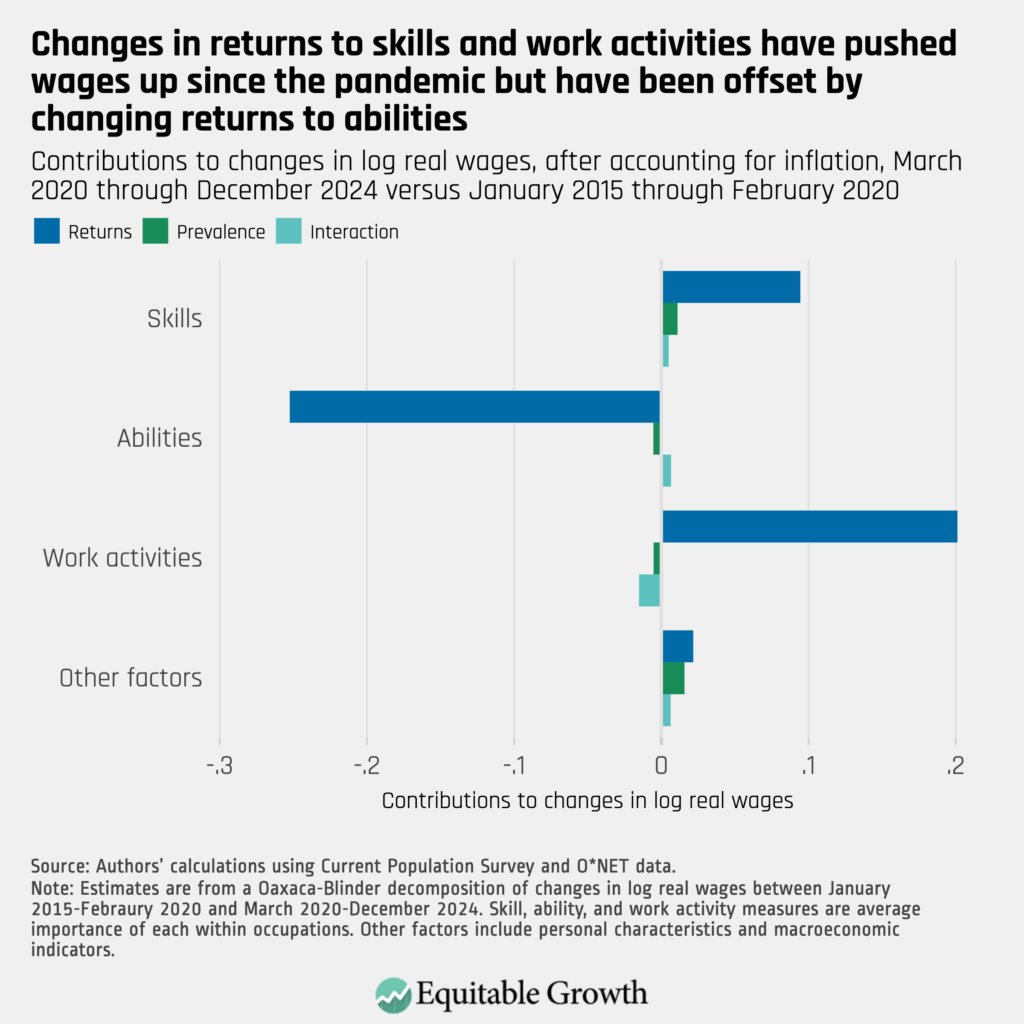
From the beginning of the pandemic through the end of 2024, real wages were about 9 percent higher on average than they were from the beginning of 2015 through February 2020. We use a statistical technique known as the Oaxaca-Blinder decomposition to break down how changes in the prevalence of various skills, abilities, and work activities (their average importance across jobs) and changes in the returns to those same skills, abilities, and work activities (the correlation between their importance and earnings) contributed to that difference. The decomposition also attributes some of the change in wages to the interaction between changes in prevalence and changes in returns.
Figure 2 below shows the results of our decomposition. Collectively, changes in the relative importance of skills, abilities, and work activities in the average job made only minor and partially offsetting contributions to the difference in average real wages between these two periods. The change in the relative importance of skills pushed wages up slightly, while the change in the relative importance of abilities and work activities pushed wages down slightly. Combined, these changes in the importance of the average skill, ability, or work activity pushed wages down slightly. (See Figure 2.)
Figure 2
Change in the returns to these characteristics made more substantial contributions to the change in real wages. Changes in the returns to work activities pushed real wages up by about 21 percent, while changes in the returns to skills pushed real wages up by nearly 8 percent. This was offset, however, by changes in the returns to abilities, which pushed wages down by about 26 percent.
Changes in both the composition of other controls, such as demographic characteristics and macroeconomic indicators, and their returns tended to push real wages up slightly after the pandemic. Overall, changes in returns accounted for a statistically significant 6 percent increase in real wages, with changes in average values of those characteristics across periods and interactions between those two types of changes accounting for the rest.
What else matters for wages?
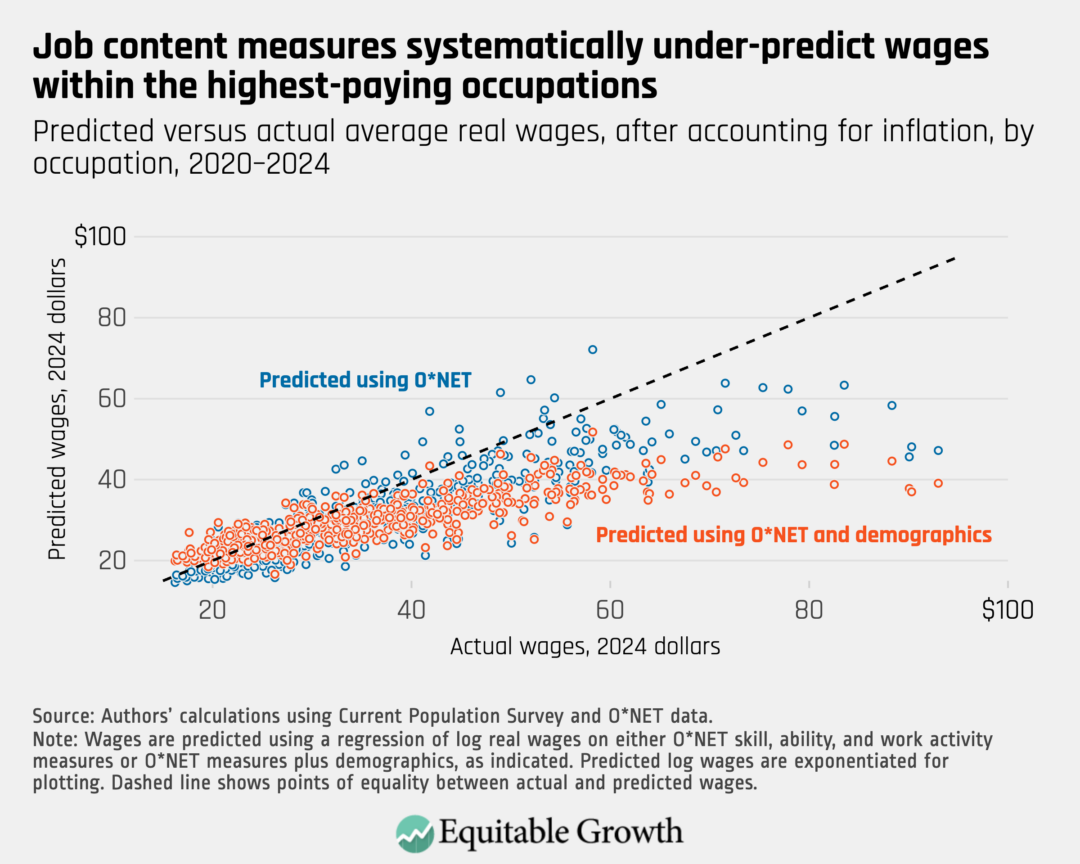
As useful as considering the content of jobs is for understanding why some occupations have high wages and others have low wages, the measures considered here are far from the only things that matter for wages. Differences in job content across occupations explain about 31 percent of variation in wages in a simple individual-level regression of log real wages on skill, ability, and work activity importance from O*NET.
This is a relatively large amount for a few categories of occupational characteristics but still far from most of the variation. Figure 3 shows that estimates from that regression systematically underpredict average wages in the highest-paying occupations. Adding workers’ personal characteristics to this regression does not change this result (and, if anything, exacerbates the issue). (See Figure 3.)
Figure 3
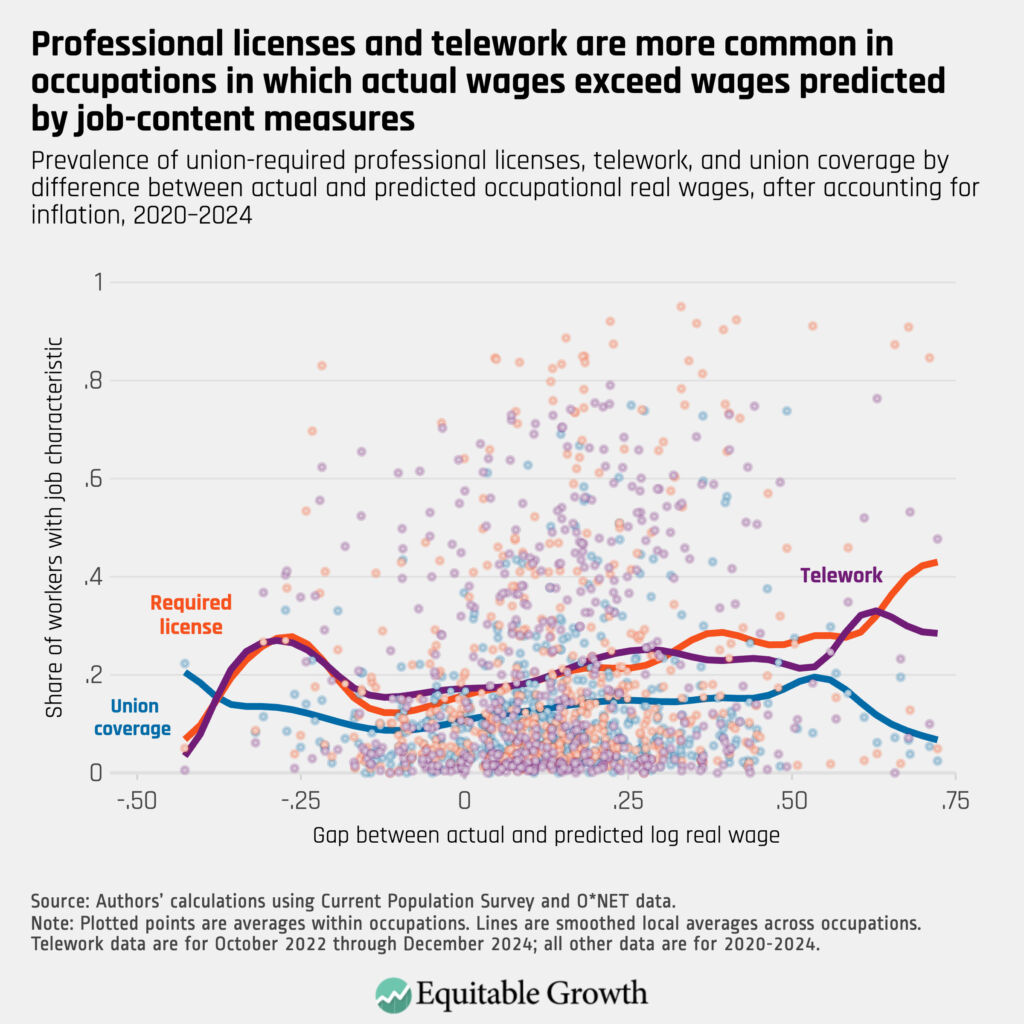
This gap between actual real wages and those wages predicted using measures of job content in high-paying occupations raises an interesting question: Why else are these occupations so high-paying? What else makes these jobs good? As an initial exploration of this question, Figure 4 looks at how a few other job characteristics vary with the gap between actual and O*NET-predicted occupational real wages. (See Figure 4.)
Figure 4
Barriers to entry could provide one explanation for how jobs that are already expected to be high-paying based on their content end up being even higher-paying than expected. Many high-paying jobs require substantial education, but some also explicitly require professional certifications, such as a medical license for doctors or admission to the bar for lawyers. Figure 4 shows that required licenses or professional certifications are indeed more common in occupations with larger gaps between actual real wage and O*NET’s predicted wages. While this is only suggestive, it illustrates another factor worth considering when thinking about what makes jobs good.
The gap between actual and predicted wages may even understate the degree to which wages in high-paying occupations exceed those predicted by job-content measures. Telework—an amenity that the average worker would be willing to give up a nonnegligible share of their wages to access—is also more common in occupations with larger gaps between actual and predicted wages. This is likely also true of other forms of compensation, such as employer-sponsored health insurance or retirement plans, which are available more often in higher-paying jobs. Union representation, one mechanism by which workers might try to secure higher pay or access to benefits, does not seem to be systematically related to the gap between actual and predicted real wages.
Conclusion
Differences in job content play a meaningful role in explaining why some occupations have high wages and others have low wages. But the relationships between measures of job content and wages are not necessarily stable, as shifts over the past two decades indicate. These shifts can have macroeconomically important implications, a possibility to which to remain attuned, as AI technology continues to develop. As informative as these relationships are, a full accounting of differences in wages across types of jobs should also consider how job content interacts with other forms of compensation, such as fringe benefits and job amenities, as well as how barriers to entry influence wages in certain jobs.
The Inflation Reduction Act of 2022 is the most significant economic and clean energy jobs program the United States has ever initiated. To improve overall understanding of whether the new law has been effective in achieving its economic policy goals, the Washington Center for Equitable Growth is engaging with policymakers and academics to discuss evaluation and research opportunities that have emerged since its implementation. Through the release of our Request for Proposals: The economic effects of the Inflation Reduction Act, our goal is to stimulate new research on the law’s impact on local and regional labor markets, job creation, innovation, and investment.
The Inflation Reduction Act included a variety of policy tools, such as tax credits, competitive grant programs, and loans. It is essential to understand which tool or set of tools were most effective at spurring innovation and investment and improving outcomes at the intersection of decarbonization and equitable economic growth. To that end, we asked Susan Helper—the Frank Tracy Carlton Professor of Economics at Case Western Reserve University, former senior advisor for industrial strategy at the White House Office of Management and Budget, former senior economist at the Council of Economic Advisers, and former chief economist at the U.S. Department of Commerce—what scholars should consider when designing research on the distributional economic outcomes of the Inflation Reduction Act.
The Q&A below is intended to serve as a resource for academics seeking to sharpen their research questions on the law and its impact. The conversation touched upon the following main themes:
Examining the effects of the Inflation Reduction Act
Industrial policy design and implementation
The innovation-to-commercialization pipeline
Examining the effects of the Inflation Reduction Act
Equitable Growth: What key indicators can researchers use to quantify the long-term economic effects of IRA-driven investments?
Sue Helper:There are a variety of potential impacts of IRA-driven investments, not all of which fit into a macro or fiscal bucket.
Starting with the macro implications, green investments may have significant impacts on business cycles. Research by Elizabeth Klee of the Federal Reserve Board, Adair Morse at University of California, Berkeley, and Chaehee Shin also of the Federal Reserve shows that defaults on car loans for electric vehicles are lower, even after controlling for borrower characteristics, due in part to the fact that EVs are not affected by gas price volatility. Similarly, Harvard University’s Elaine Buckberg has suggestive evidence that more electrification would reduce the magnitude of business cycles because electricity prices are more stable than gas prices. She also argues that this would remain true with a switch to more renewables, even if they are intermittent.
Ideally, we would want to see impact on greenhouse gas emissions, though it may take some time for these impacts to become apparent. John Bistline and co-authors lay out some of the emissions and energy impacts of the law in a recent Science article, for example. As we wait for more data to emerge on emissions, we should look for intervening variables, such as investment in green technology manufacturing and adoption of such technologies, among other indicators.
In addition, we would hope to see that IRA provisions on job quality and training lead to better jobs. For guidance there, Equitable Growth recently released a resource guide on how to best evaluate the law’s effect on job quality, spillovers, and place-based policymaking.
Equitable Growth: What data gaps or other challenges exist in assessing the Inflation Reduction Act’s effectiveness at attracting private investment and understanding the impact of those investments across supply chains?
Helper: Bistline and his co-authors summarize helpfully, writing that “several implementation challenges are difficult to model, including the scale-up of supply chains and materials, siting and permitting, infrastructure expansion, network effects, non-cost barriers to consumer uptake of incentives, and the economic incidence of subsidies.” Researchers should look at these specific challenges with case studies. Such studies could analyze both where implementation went well and where it didn’t go so well.
Econometric examinations of particular provisions of the law also would be informative, such as whether delegation to states leads to slower implementation and/or better long-run success due to attention to local conditions. And research that focuses on the impact of policies complementary to the Inflation Reduction Act—for example, convening or government procurement—would be of great interest to policymakers.
Key to the design of the Inflation Reduction Act was the idea that policy could “crowd in” private investment due to factors such as de-risking emerging technologies, achieving economies of scale, increasing certainty of demand, accelerating learning curves and building network effects, addressing externalities (such as climate impacts), and solving coordination problems. The law did indeed generate large commitments of private investment. Research could examine the magnitude of these effects by looking both at particular industries targeted by the law and at particular policy levers (for example, grants, loans, or tax credits).
It would be useful to understand interactions of individual provisions of the Inflation Reduction Act with other IRA provisions and with other policies. In my time in government, I found information failures even among firms to be very large, especially for small firms. It would be good to research improved ways of convening and/or providing integrated services as suggested here (in general) and here (for the case of EVs).
It also would be useful to understand incidence within supply chains. Well-publicized incentives to consumer-facing firms were largely passed on to consumers. Yet it’s not clear that incentives to lead firms were passed on to suppliers, or that lead firms (e.g., in autos or heat pumps) provided much assistance—financial or otherwise—to help suppliers with forecasting, capital, or training costs of scaling up to provide a new product. This research would be hard because the prices of components are typically not public but would be especially useful. In studying resilience and incidence, it’s important to go beyond simply “mapping” supply chains, to analyze the nature of ties between supplier and customer.
Industrial policy design and implementation
Equitable Growth: What policy design features of the Inflation Reduction Act are most important for researchers seeking to study the intersection of efficiency, equitable economic outcomes, and lower emissions?
Helper:Some key choices that could be examined are tax credits versus loans versus grants; tech-neutral credits (which can promote innovation) versus industry-specific credits (which can drive certainty in that industry, promoting investment); and the role of Community Benefits Plans—roadmaps for how developers engage with and benefit communities affected by infrastructure projects—and whether they slowed investment and/or promoted good outcomes, including for business, by drawing resources toward building a skilled workforce.
There is some variation in the ways that the Inflation Reduction Act and other programs administered by the U.S. Department of Energy conceive of and incentivize Community Benefits Plans. For example, the $2 billion fund for retooling existing auto plants provided points for adopting various high-road business practices inside plants, while other programs focused on benefits to residents near plants.
Research could examine the effects of these provisions on selection of recipients, performance of recipients on various metrics, and long-lasting impacts, if any.
Equitable Growth: How can we apply lessons from the Inflation Reduction Act to understand whether to leverage industrial strategy to address other pressing global or national challenges?
Helper: Policymakers need to understand how IRA implementation and coordination actually worked and build on any successes. The impact of the law will be due to not just the policies in the bill, but also to the process of writing guidance and building cooperation across agencies.
For example, the U.S. Treasury Department knows how to administer tax policy and drive stakeholder engagement, increasing benefit uptake with states, localities, Tribal governments, nonprofits, and industry. Amid IRA implementation, the Treasury Department learned to cooperate with the U.S. Department of Labor to implement provisions around apprenticeships and prevailing wages and with the U.S. Department of Energy on the state of clean energy manufacturing and greenhouse gas emissions. It also had to learn from the private sector about conflicts and complementarities around goals such as defining domestic content and incentivizing increased job quality, about convening experts and potential recipients to design the guidance and to build awareness of policies, and more.
Equitable Growth: What natural experiments, innovative data methods, or structural modeling can inform the development of industrial strategy theory, along with the design and implementation of future policies?
Helper: Mixed methods approaches are great. Researchers also should not overlook the power of case studies; modelers should look out for bottlenecks, information issues, and market power, to name a few, that affect incidence of incentives, and also look out for nonlinear, self-reinforcing effects.
It’s helpful if researchers can understand the dynamics of the industries they study. For example, Stanford University’s Hunt Allcott and his co-authors find that the Inflation Reduction Act could have reduced greenhouse gas emissions more efficiently if it offered greater incentives for smaller vehicles. While it is very useful to understand the magnitude of the effect (which is large), they do not point out the impact of such a policy on job quality, given decades of trade and labor policies that have led unionized U.S. companies to focus on large vehicles.
Strengthening the innovation-to-commercialization pipeline
Equitable Growth: What examples have you seen where regional and state differences in infrastructure, labor markets, and policy environments are affecting the success of clean energy commercialization efforts? How can early examples or case studies be used in research designs to inform a broader understanding of the effectiveness of IRA design and outcomes?
Helper:The deployment of electric vehicle chargers is an important case to study. Although funded under the Bipartisan Infrastructure Law passed in 2021, the slow roll out of EV chargers affected the demand for these vehicles, a key IRA target. There was wide variation in state performance. Indeed, Ohio deployed the first National Electric Vehicle Infrastructure charger in December 2023, yet some states had still not deployed any by March 2025.
Equitable Growth: What policy levers should researchers focus on to understand and enhance the Inflation Reduction Act’s intent to deploy new technologies at scale, drive down costs, and enable the technologies to ultimately reach full market acceptance?
Helper: Researchers should understand (and help investors understand) how climate goals affect other goals that private investors care about, such as lead time and supply chain resilience. Similarly, research can, and is beginning to, look at impacts on utility bills and the distributional impact of any changes.
Equitable Growth: What data and metrics from the innovation-to-commercialization pipeline could be used to refine future policies for equitable clean energy growth?
Helper: Ideally, granular, high-frequency data on both supply and demand for new technologies would be great. It’s important to understand what supply chains and demand factors drive these.
In contrast, modelers were too quick to assume we were on the steep portion of the S-curve of adoption for electric vehicles. Yet part of this slowdown in acceleration of demand was due to policy issues, such as the slow roll out of chargers, as discussed above.
Around the globe, people are increasingly dissatisfied with the state of democratic capitalism. In the United States and other rich democracies, economic policy has too often in recent decades produced rising economic inequality across individuals, as well as regions within countries, stagnant economic growth and innovation, rising costs of essential goods and services such as housing, health care, and education, greater economic insecurity, and declining job quality and stability.
Voters have communicated their discontent with a surge of support for populist parties, politicians, and political causes that challenge incumbent elites and profess to speak directly to the needs of “real” people. In some countries, the populist insurgency has a left-wing character, but in most cases to date, voters have gravitated to populism’s right-wing variants such as the AfD in Germany, the National Rally in France, Fidesz in Hungary, the Sweden Democrats, and the UK Independence Party.
This essay is the first in a series Equitable Growth will publish by a number of experts exploring the implications of right-wing populism for those making and following U.S. economic policies. In this essay—and throughout the broader essay series—we stress three intellectual contributions of the overall series.
First, we argue that the surge in support for right-wing populism merits attention not just from political pundits and strategists, but also from policy leaders who research, design, and implement economic policies. Put simply, the downstream effects of economic policy for politics and democracy merit far more attention than they have been getting in policy design and implementation.
Second, we argue that meeting this new view of economic policymaking will require drawing from a broader set of scholarship than traditionally has been engaged in the U.S. economic policy process. That includes economics but also expands to cover work in political science and sociology.
And third, we argue that U.S. policymakers, who often are used to thinking about American exceptionalism, need to learn from the broader global shifts in support for right-wing populism around the globe. This means placing the U.S. experience with right-wing populism into the broader context of the global shift toward this movement, and to look for potential causes and levers to dampen support both abroad and at home.
The essay series thus lays out the case for why U.S. policymakers should approach economic policy with an eye to its downstream political effects on democracy, as well as descriptions of what this approach could look like across different policy domains.7 The essays take different approaches. Some focus on diagnosing how economic policy has produced conditions that fostered support for right-wing populism. Others propose new economic policy levers for mitigating the appeal of right-wing populism.
No series could cover all of the possible connections between economic policy and right-wing populism. Instead, our goal is to offer a model of an approach to the design of economic policies that takes seriously how people experience the economy and society’s need for democracy. The essay series will cover a variety of important policy areas and invite further scholarly engagement. Importantly, we seek to model the kind of approach we think is necessary from research and policymaking, one that incorporates more disciplinary perspectives (especially from political science and sociology) and one that considers the United States in a comparative context, learning from the experiences of other countries around the world.
It is important to note that the turn toward right-wing populism in the United States not only threatens democratic institutions and systems but also puts Americans’ economic well-being at risk. Economic policy can work to counteract this trend and bolster U.S. democracy—but is less likely to do so as it has traditionally been developed. At a time when the broader policy community is still debating the implications of the 2024 presidential election results and the extent to which it was a referendum on former President Joe Biden’s economic policies, we hope that this essay series will broaden the debate about the future of economic policy and politics in the United States at a moment of democratic crisis.
Defining right-wing populism and reviewing its recent surge in support
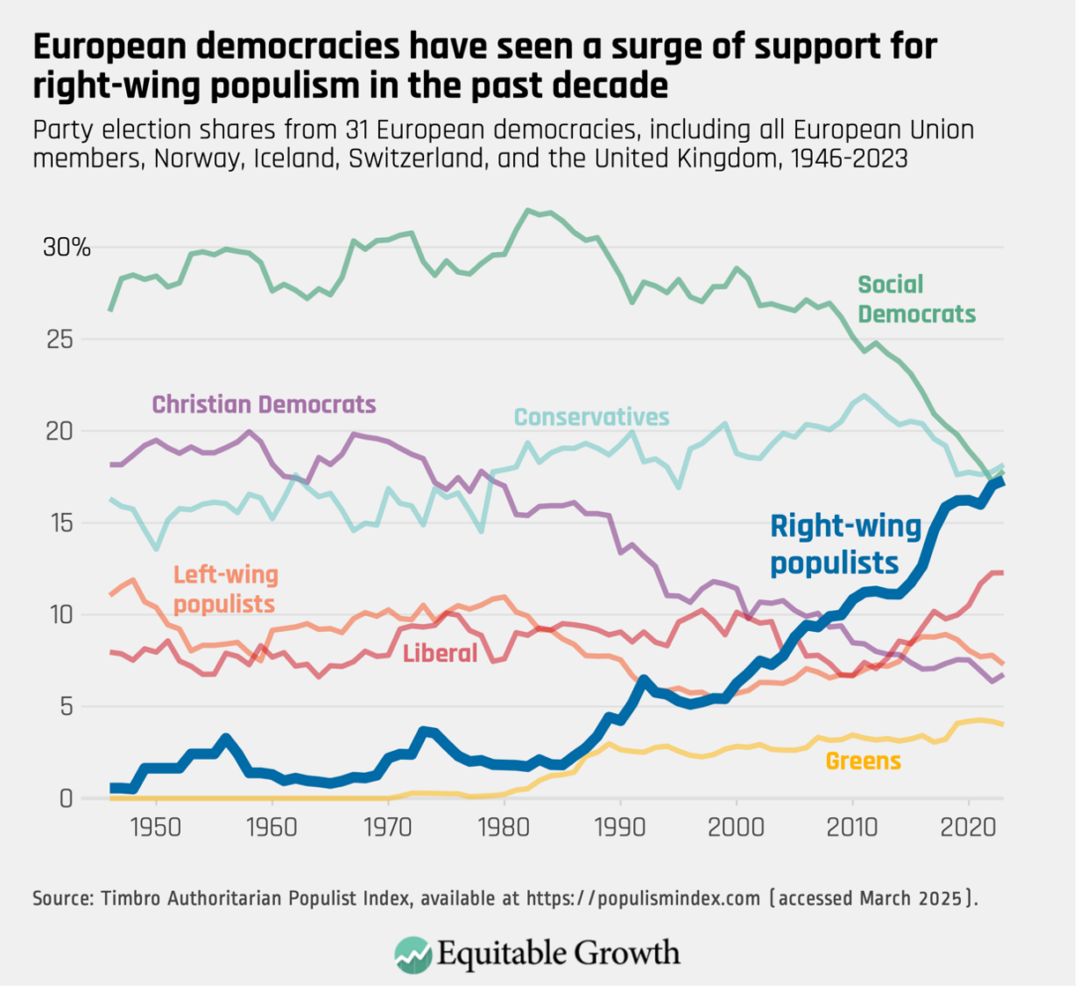
There are numerous dueling definitions of right-wing populism.8 We adopt the definition offered by comparative political scientist Sheri Berman at Barnard College. This definition captures the core features of most right-wing populist movements: appeals and positions that emphasize “a Manichean, us-versus-them worldview in which the ‘us refers to the ‘people,’ defined often in ethnic or communal terms and seen as engaged in a zero-sum battle with ‘them,’ defined most often as liberal elites, the establishment, and minorities and/or immigrants’.”9 Equally important to the “us-versus-them” nature of right-wing populism, according to Berman, is its “disdain for many of the basic norms and institutions of liberal democracy, such as free speech, freedom of the press, recognition of the legitimacy of opposition, and acceptance of the separation of powers in general and limits on the executive in particular.”10
Data from the Timbro Authoritarian Populist Index,11 which tracks the electoral support that left-wing and right-wing populist parties have received in 31 European countries, show changing dynamics between European political parties between 1945 and 2023. More specifically, we can see that left-wing populism has fallen from its immediate post-World War II peak, while right-wing populist candidates and parties have steadily grown their mass electoral support. Support for right-wing populist politicians has now surpassed other traditional center-right parties (notably the Christian Democrats) and now is on par with stalwarts of the left (notably Social Democratic and Labor parties) and traditional conservative parties. (See Figure 1.)
Figure 1
The United States is no exception to this trend. The Great Recession of 2007–2009 and its aftermath saw the rise of the Tea Party,12 a right-wing populist movement that fused a variety of sometimes-contradictory views.13 These included opposition to financial bailouts for homeowners and financial leaders perceived to be undeserving, nativist appeals against immigrants, support for protection of traditional social benefit programs for deserving citizens (especially Social Security and Medicare), and skepticism of new government initiatives to control climate change and expand health care to those perceived to be undeserving such as young people and communities of color.
The Tea Party, in turn, laid the foundation for the surprise 2016 Republican Party nomination, 2016 election, and eventual reelection of Donald J. Trump to the presidency in 2024.14 Departing from decades of Republican orthodoxy,15 Trump’s presidential campaigns—though generally not his first-term governing agenda—pivoted to a right-wing populist platform, stressing protectionism, protection of core social programs for deserving Americans, and ethnonational attacks on immigrants.
Much ink has been spilled between pundits, scholars, and political strategists over the sources of President Trump’s rise and reelection in 2024.16 But far too often, such takes have been based on the U.S. experience alone, pointing to idiosyncratic aspects or choices of the candidates in question and failing to recognize how right-wing populist shifts in the United States are part of broader global trends—trends linked to changes in economic policies over the past five decades.
Democracy and experience of the economy as goals for economic policy design
Why should policymakers—especially those focused on economic policy—care about the surge in right-wing populism in the United States and around the globe? Traditionally, economic policymakers have not tended to think about the downstream political implications of their policies, focusing instead on putting forward policies that maximize preferred economic outcomes.17
While this essay series is not primarily aimed at critiquing economic policymakers, it also exists in the context of a broader debate that economic policymakers and economists have been having about the appropriate way to make economic policy. Recently, economists have struggled with their own sense of relevance in a Biden and Trump world.18 This essay series suggests that focusing policy purely on economic outcomes, as many economists have traditionally done, and the very real economic trade-offs policymakers must grapple with,19 is crucial but not sufficient at this moment in history.
The rise in right-wing populism across the globe requires economic policymakers, including in the United States, to think about how their proposals shape not just economicoutcomes in a narrow sense but also people’s experiences of the economy, filtered through their social identities, narratives, and social institutions and organizations.20 To put a finer point on it, thinking about economic outcomes also requires thinking about democracy. Doing so is essential because of the threat that right-wing populism poses to both the U.S. economy and democracy.
The track record of right-wing populists in power is clear. Across countries, these leaders and parties tend to pursue policies that erode the rule of law, attack the foundations of an independent civil society, including universities21 and the civil service,22 and entrench personalistic control over the levers of government. This is how right-wing populists assume unchecked control over government processes and decisions previously guided by the rule of law and independent expertise.23 Together, these interventions dampen economic growth and innovation and undermine the pillars of inclusive prosperity.24 Thus, even for policy leaders who typically only focus on economic outcomes, considering the downstream political consequences of economic policy matters because of the substantial negative economic threats of right-wing populism.
How economic policy can help explain support for right-wing populism
As the essays in this series will argue, economic policy plays an important role both in helping to explain the rise of right-wing populism in the United States and other rich democracies and in providing a lever to dampen support for populist candidates, causes, and parties.
To say that economic policy matters for the appeal of right-wing populism, however, is not to say that support for right-wing populism depends on a simple tally of the economic benefits and costs that individuals have experienced. Indeed, the large literature in economics, sociology, and political science on the origins of right-wing populism suggests that objective economic circumstances are only a modest predictor, at best, of right-wing populist support.25 Nor is it to say that economic policy is the only driver of support for right-wing populism, which includes many other factors we do not cover in this paper and may not be amenable to change through policymaking.
Instead, what we argue is that support for right-wing populism involves a more nuanced interaction between economic and cultural factors—interactions to which economic policymakers and researchers should be much more attuned than they have been as they think about policy design. Just as important to note, some hypothesized sources of support for right-wing populism—such as some forms of economic insecurity—can explain small shifts that may be relevant in the context of a close election, while other hypothesized mechanisms offer greater explanatory power working on deeper mechanisms.26
Below, we detail some of the variety of the scholarship that documents links between past changes in economic policy and support for right-wing populism in ways that merge economic and cultural dimensions and consider a range of important outcomes related to right-wing populist support.
Economic dislocations and the unresponsiveness of government social programs
Even as individual-level objective economic security is not consistently related to support for right-wing populist causes and candidates, there is stronger evidence linking the perceived failure of social policies, especially in the face of economic dislocations and shocks, to shifts to right-wing populism. As one study documented, regions in the United Kingdom that were exposed to austerity-induced cutbacks in social programs were more dissatisfied with UK politics and more supportive of Brexit.27
In a similar vein, an analysis of elections from 1990 to 2017 across rich democracies found that populist parties did better when incumbent parties made cuts to social spending, especially unemployment benefits, and populist parties fared worse when countries spent more on such benefits—evidence that compensating individuals and communities facing economic shocks can blunt demand for right-wing populism.28 And a third study found that government austerity, especially cutbacks to income support programs, pulls economically vulnerable regions and individuals to the populist right.29
Trade is an especially important dislocation that may drive support for right-wing populism,30 particularly when individuals feel their livelihood has been threatened by competition with other countries and especially when politicians can activate latent resentments and concerns about threats to the status of affected workers.31 There is some evidence from the United States that greater government support for trade-affected communities can mitigate these polarizing effects of trade.32
Beyond trade, scholars have also found that transitions to cleaner energy sources to address climate change can spur right-wing populist backlash among the populations who are most negatively affected by the costs of the transition, such as increased energy costs.33
Community and regional decline
In a similar vein, feelings of grievance from living in a “left-behind” region, especially regions hollowed out by deindustrialization and trade, can generate resentments that fuel support for right-wing populism.34 In Sweden, for example, research documented how depopulating areas experience negative spirals, with declines in local services sparking further out-migration.35 As conditions worsen, voters in those regions feel ignored by mainstream political parties, and savvy right-wing populist politicians have found strong electoral success in playing up resentments against urban areas.
That work from Sweden resonates with research on the United States, which found that rural and exurban areas feel neglected by politicians and public policies—even when their objective economic circumstances are similar to those in other regions. Those resentments can then fuel appeals made by right-wing populist candidates and parties.36
Cost-of-living shocks and inter-group competition
Although much attention on the appeal of right-wing populists has focused on rural versus urban cleavages, geographic differences even within urban areas matter. New research suggests that concerns about shocks to individuals’ cost of living—especially housing—can spur greater support for right-wing populism, especially when individuals feel they are in direct competition with immigrants for scarce resources.
Studying German rental markets, scholars recently documented that increases in local rent prices drive support for the populist right in urban areas, particularly among low-income voters who lack the resources to fully absorb potential rent increases and where individuals fear dislocation and threats to their social status.37 Similarly, in Austria, researchers found that individuals’ support for right-wing populist candidates and parties increases when they are more exposed to potential competition with immigrants over limited housing stock, exacerbating a sense of competition over scarce and valuable resources.38 And looking across Scandinavian countries, research found that homeowners left behind in surges of housing prices became strongholds of right-wing populist parties.39
Macrofinance, economic crises, and inequitable bailouts for economic elites
Another relevant area fusing economic and social concerns involves financial crises, and in particular the Great Recession of 2007–2009. Although business cycles do not appear to be strongly predictive of shifts toward the populist right, the experience of enduring financial crises, especially when paired with fiscal austerity-based responses by an incumbent government, have formed the basis for right-wing populist mobilization.
In the United States, for example, it was the 2007 financial crisis—and specifically the housing crisis and the subsequently proposed bailout measures—that fueled the proximate rise of the Tea Party movement within the Republican Party.40 Looking across more countries, scholars have argued that the “financial crises of the past 30 years have been a catalyst of right-wing populist politics. Many of the now-prominent right-wing populist parties in Europe, such as the Lega Nord in Italy, the Alternative for Germany, the Norwegian Progress Party or the Finn’s Party are ‘children of financial crises,’ having made their breakthrough in national politics in the years following a financial crash.”41
Loss of status
Another relevant dimension involves status, dignity, and fairness. Everyone has different forms of status across the various domains of our lives, derived from our identities as students, workers, family members, friends, volunteers, congregants, or hobbyists.
As we previewed above, scholars have found that when individuals’ sense of their social standing in their community falls, especially in ways that feel unfair, they become more receptive to appeals made by right-wing populists,42 who provide alternative forms of status, identifying the sources of declining status in out-groups (such as immigrants) and elites (such as corrupt politicians or cultural leaders). It is important to note that the loss of status and dignity is not just a proxy for economic class; the same study, using the European Social Survey (covering 25 European countries), demonstrated that income level, educational achievement, and occupational class “explain only a limited amount of the variance in subjective social status.”43
For instance, one researcher found that, looking across 11 Western European countries, when households experience greater labor market risk—though not actual unemployment—those households turn toward the populist right, reflecting threats to households’ social standing.44 Another study found that loss of economic status above and beyond absolute changes in individuals’ incomes predicts support for the populist right.45
Researchers of right-wing populism have dubbed this mechanism “nostalgic deprivation,” capturing “the discrepancy between voters’ subjective understandings of their current status and their perceptions about past positionality.”46
Dignity at work
While declining social status has many causes,47 one important way that people evaluate their social standing is through the meaning they find from their jobs.48 Threats to job security and quality—such as deskilling, automation, or offshoring—appear in research to be closely related to perceptions of economic unfairness,49 which, in turn, is linked to support for populist right-wing candidates.
By comparison, policies or institutions that improve workers’ jobs and status in the workplace can mitigate the appeals of right-wing populism. Unionized workers have objectively better working conditions and also report higher levels of social standing, dampening support for the populist right.50 In some cases, unions may also create social identities for workers that can build greater solidarity with others—including immigrants and other minority outgroups—in ways that diminish the appeals of right-wing populists.51
Conversely, declines in unionization may help explain rising support for the populist right, even in countries with previously high levels of union membership. Research on Sweden, for example, suggests that sharp declines in unionization through the mid-1990s can help explain the increase in support for right-wing populist voting among working-class Swedish workers.52
A new approach to economic policymaking: Going beyond ‘deliverism’ to craft policy that resonates with people
While in office, former President Biden pursued a set of economic policies that broke from traditional approaches for economic governance, recognizing the ways that trade, antitrust, and consumer regulatory policies have, over decades, often eroded working- and middle-class jobs and advantaged concentrated economic interests over workers.53 President Biden and his team sought to leverage historic new infrastructure investments to create high-quality new jobs in stagnating communities across the country. Building on new scholarship in economics and law, this bundle of approaches pursued by the Biden-Harris administration came to be dubbed “Bidenomics.”
The thinking behind Bidenomics and the framework we have laid out in this essay are quite aligned. Specifically, they both highlight how past economic policy decisions around trade and regulation have hollowed out working-class communities across the country and both focus on strengthening unions as an economic and democratic imperative, on checking outsized corporate influence on the economy and politics to boost government responsiveness to working- and middle-class workers and their families, and on investing in good jobs in specific communities and places, not just transferring money to people.
But there are some important ways in which our framework either goes beyond the Bidenomics approach or departs from it. Perhaps most notably, much of the Biden-Harris administration assumed that good economic policy decisions would speak for themselves. When presidential administrations make policy, they inevitably have a heuristic they use to quickly check whether a given policy design meets their internal goals. The Biden-Harris administration’s shorthand was sometimes dubbed “deliverism”—a strategy to achieve political support by producing concrete material gains for the public—and policies were evaluated internally in part by whether they fit the goals of deliverism.54
In fact, as has been widely reported, deliverism underlaid a lot of the administration’s strategy around the enhanced Child Tax Credit in the American Rescue Plan. This policy delivered hundreds of dollars in monthly benefits to more than 60 million children for one year. The administration hoped that the public would appreciate the benefits of the short-term CTC expansion and then demand that Congress continue those benefits in the longer term.
Yet the expansion of the Child Tax Credit failed to build a popular constituency for the program. Recipients of the tax credit were no more supportive of the Biden administration’s policies than nonrecipients, and Congress ultimately did not permanently expand those benefits.55
Part of what this essay series suggests is that expecting good economic policy to translate to good economic outcomes, which, in turn, will translate to political support for democracy, is misguided. As we described above, a large literature in the social sciences suggests that we cannot expect changes in individuals’ material conditions, on their own, to produce changes in an individual’s political views and actions—let alone changing their attachment to democracy—especially on such a short-term basis.
For policies to register political impacts, policymakers must craft policies that can resonate in individuals’ lives, and especially with their identities and the narratives that structure their worldviews over time. As one of us recently argued in Democracy Journal,56 this will require significant changes to policy development, implementation, and messaging and narrative—and also will take time. People need to “see” themselves in the design and delivery of policies.57
New criteria for economic policymaking
More research and experimentation is needed to help flesh out what a comprehensive approach to policymaking would look like when it takes into account people’s experiences of the economy, their identities and narratives, and support for democracy. But drawing from the essays in this series, as well as our reading of the social science literature on right-wing populism and economic policy, we sketch out several criteria for policymakers to consider.
First, economic policies need to affirm and activate people’s identities, especially their agency, dignity, and social standing. Too much of the U.S.-centric work on the appeal of right-wing populism creates a false dichotomy between whether voters were racist or xenophobic or whether they were responding to material shifts in economic conditions.
As this essay proposes, a more productive perspective—and one that aligns with existing research from around the world—is that what matters for many voters is a sense of agency and dignity in their own lives. The task then for policymakers is to craft policies that affirm social standing, agency, and dignity, especially for individuals whose standing might feel threatened by changing economic, demographic, or social changes, thus tackling “nostalgic deprivation.”58
One especially important source of identity involves community and place, and as such economic policies need to recognize that community and place matter to voters—especially in the U.S. political context, with its territorially defined system of political representation.59 Past research on support for right-wing populism in the United States and abroad stresses how important perceptions of community decline are for generating resentment against government agencies, as well as demographic groups perceived to be undeserving, such as immigrants, young people, or others who are seen as benefiting from government interventions while one’s own community is neglected.
For many years, economic policy has stressed the importance of “people over places,” encouraging fiscal transfers to individuals experiencing economic hardship and supporting policies that could help move individuals from economically distressed regions to more productive areas. Yet such policies fly in the face of the dense social connections and practical realities that moor individuals to specific places and ignore the ways that communities’ perceptions of neglect fuel right-wing populist appeals. Policymakers need to focus on programs that can reinvest in communities experiencing economic and social decline and, in the process, provide alternative narratives about the standing of individuals living and working in those communities.
A potential starting point for policies that reinforce, activate, and support social identities and dignity is shifting the balance of economic policy. Our current system often focuses predominantly or exclusively on “compensating the losers”60 of trade, automation, globalization, and other economic shifts through government transfers after these individuals experience dislocations. We propose a modification, to an approach that more heavily weights predistribution—changing the balance of economic power, resources, and outcomes before tax-and-transfer policies by intervening directly in markets to reduce inequality.
One example of this approach is increasing the minimum wage rather than increasing tax credits available to those workers, thus shifting underlying economic and political resources and power.61 In tandem with this predistribution approach, policymakers might also prioritize efforts that rebuild good jobs in specific communities, attacking the root problem from multiple angles.
Last, people need to perceive that the government is meeting their needs and not simply acting on behalf of economic elites. Past research from the United States and abroad makes clear the toxic brew generated by a sense that the government is not acting on one’s behalf, especially during periods of economic risk or dislocation. The contribution of financial crises, in which the government is seen as bailing out financial institutions while neglecting the economic strains faced by working and middle-class Americans, is one example of this dynamic, as is the finding that more generous Unemployment Insurance buffered the effect of economic crises on support for right-wing populists across European democracies.
This will require economic policies that adequately meet the economic risks faced by citizens, of course. But policies also must go beyond simple risk-buffering to actively show citizens the role that the government is playing in their lives. This means that policies must be visible, tangible, and traceable back to the government.62
In the United States, this has always been a daunting task, given the growing complexity of government (across, for instance, different agencies and levels of government), the decline of traditional and trusted media outlets covering government, and partisan polarization. To the extent that policymakers can break through these barriers, research suggests the need for policies to build on the trusted relationships that citizens hold with civic organizations, such as unions, churches, or community-based groups.
Conclusion
Our framework suggests a new way of thinking about the 2024 election results and its implications for Bidenomics battles over the future of progressive economic policy. Moreover, our arguments are relevant now, as policymakers consider whether to focus on a politics of “abundance” that focuses on removing constraints on new production, manufacturing, and innovation.63
Our framework suggests that the abundance approach could reduce the sense of competition over scarce goods and services—such as housing or health care—that can fuel right-wing populism. At the same time, we urge an important note of caution: Without adequate attention to how the gains of abundance are shared—and even more, how the gains of abundance are perceivedto be shared and with whom—how abundance policies build a sense of community, dignity, and identity, and the organizational underpinnings of abundance policies, an abundance approach that prioritizes production at all costs risks generating populist backlash.64
Broadly speaking, the urgent need for a new approach to economic policymaking is clear, as the U.S. democratic system—and other capitalist democracies around the world—face existential threats from rising right-wing populist movements. The framework proposed in this essay and the evidence from the broader essay series that will follow are not comprehensive; indeed, our hope is that this initiative can help spur further research, experimentation, and policy development in the months to come. Such work will be essential to building policies that not only deliver more inclusive and stable economic growth, but also reinforce the political foundations of democracy in a moment of democratic crisis.
Alexander Hertel-Fernandez is associate professor and Vice Dean at the Columbia University School of International and Public Affairs and an Equitable Growth fellow. His research and teaching focuses on the intersection of politics and markets in the United States, especially the politics of policy design, labor, and government influence. He previously served in the Biden-Harris Administration in the U.S. Department of Labor and the Office of Management and Budget and is the author or co-editor of three books, most recently The American Political Economy (Cambridge, 2021).
Shayna Strom is the president and CEO of the Washington Center for Equitable Growth. Previously, Strom served as the chief deputy national political director at the American Civil Liberties Union. She also has had a significant government career, including serving on the Biden-Harris transition team, working for 4 years in the Obama White House Office of Management and Budget, and serving as counsel on the Senate Judiciary Committee for Sen. Al Franken (D-MN). Strom has taught at Johns Hopkins University, Sarah Lawrence College, and the Biden Institute at the University of Delaware.
Did you find this content informative and engaging? Get updates and stay in tune with U.S. economic inequality and growth!
The Inflation Reduction Act of 2022 is the most significant economic and clean energy jobs program the United States has ever initiated. To improve overall understanding of whether the new law has been effective in achieving its economic policy goals, the Washington Center for Equitable Growth is engaging with policymakers and academics to discuss evaluation and research opportunities that have emerged since its implementation. Through the release of our Request for Proposals: The economic effects of the Inflation Reduction Act, our goal is to stimulate new research on the law’s impact on local and regional labor markets, job creation, innovation, and investment.
Improving models, particularly better integration of climate and economic research frameworks, will be essential to measuring and evaluating the macroeconomic effects of the Inflation Reduction Act. To that end, we’ve asked Heather Boushey what scholars should consider when designing research to study the distributional economic outcomes of the Inflation Reduction Act. Boushey served as the chief economist for the Invest in America Cabinet at the White House and member of the Council of Economic Advisers from 2021–2025. She was deeply involved in the design and implementation of the Inflation Reduction Act. (Boushey was also the founding President and CEO of Equitable Growth and currently serves on the organization’s Steering Committee.)
The Q&A below is intended to serve as a resource for academics seeking to sharpen their research questions on the law and its impact. The conversation touched upon the following main themes:
Improving economic and climate modeling
Best practices for evaluating policy effectiveness
Measuring the macroeconomic and fiscal impacts of IRA investments
Improving economic and climate modeling
Equitable Growth: How did your time in government shape your current view on the effectiveness of existing economic and climate models?
Boushey:In my time in the White House, with my colleagues at the Office of Management and Budget, I led the Biden administration’s work to “develop methodologies to quantify climate risk within the economic assumptions and the long-term budget projections of the President’s Budget,” as laid out in the president’s Executive Order on Climate-Related Financial Risk. Working with the teams at the Council of Economic Advisers and the Office of Management and Budget, we created an interagency technical working group that wrote three major reports on new methodologies. These reports culminated in a memo to relevant federal agencies to support the quantification, assessment, and management of economic and financial climate risks.
As part of this work, we engaged key stakeholders, hosting convenings with macroeconomic forecasters, initiating a National Academy of Sciences workshop on macroeconomics and climate-related risks and opportunities, and partnering with our colleagues at the Treasury Department to engage the global economics community through a series of multilateral meetings and events.
There is much work to be done on modeling; I would point researchers to a few documents we produced that are laid out in this issue brief. Specifically, the White Papers we produced over the years assess the landscape, identify how we could rethink the models, and put these ideas into practice by laying out a rich research agenda.
Equitable Growth: What is missing from the models available to policymakers, and how can researchers help improve them for the future?
Boushey: We laid this out in the joint memo I just mentioned from the Council of Economic Advisers, Office of Management and Budget, and TreasuryDepartment. The memo identifies priority areas for improving federal modeling and data tools to better integrate climate risks into economic policymaking.
Specifically, this memo suggests that macroeconomic modeling tools: “1) include nonprice policies 2) account for transitional dynamics and frictions, 3) account for interaction between physical and transition risks, 4) account for effects on particular income groups, subnational units, and subsectors of the economy, 5) account for extreme risk events, and 6) include short- and intermediate-term timescales and greater spatial granularity.”
Best practices for evaluating policy effectiveness
Equitable Growth: What is your perspective on emerging strategies for evaluating the effectiveness of policy levers at the intersection of decarbonization and economic growth? How can researchers help study those effects both nationally and regionally?
Boushey:We need to do more to build a new community of practice, connecting energy modelers with economists who understand supply chains, finance, and labor markets. Equitable Growth could play a role, bringing in economists with these areas of expertise.
Several efforts in support of that goal are being launched by those thinking about these questions. For example, in 2024, the Earth Fund, together with the U.S. Department of the Treasury, the Danish Finance Ministry, and the Coalition of Finance Ministers for Climate Action, hosted the first Forum on the Macroeconomics of Green and Resilient Transitions in Washington, DC. The forum provided a community platform for finance ministries to lay out their emerging analytical needs, and it allowed modelers and analysts to showcase new methods and new data for meeting those needs.
Measuring the macroeconomic and fiscal impacts of IRA investments
Equitable Growth: Many researchers studying the Inflation Reduction Act have suggested that the macroeconomic effects of IRA investments will be minimal and potentially not worth studying further. If you agree with that sentiment, what macroeconomics questions should researchers seek to answer moving forward?
Boushey: I would like to see more investigation on several questions. Why did macroeconomic forecasts consistently underpredict the investment boom from the Bipartisan Infrastructure Law, the CHIPS and Science Act, and the Inflation Reduction Act? Are these models capable of assessing the potential effects of transformational change? If not, how are we to understand the potential economic effects—or lack thereof—of a swift transition to clean energy?
What are the medium- to long-term effects of building—or not building—a clean energy economy on productivity and growth? Do we need to find new ways to assess this outside of current macro tools?
Prior leaps in economic growth have been associated with innovations in energy that required public investment to solve market failures and become general purpose technologies. How do we think about medium- to long-term economic growth within this historical context as we confront new clean energy technologies?
The employer-provided child care credit, also referred to as Section 45F in the Internal Revenue Code, provides a limited subsidy to businesses in the United States that provide child care to their employees. Employer-provided child care benefits can support businesses by attracting and retaining workers, especially when the U.S. labor market is strong and child care is scarce. Access to child care also can support a more reliable and productive workforce, which benefits businesses.
Roughly half of America’s children live in so-called child care deserts, areas with fewer available child care slots than children. And even when families are able to locate an available child care slot, the cost is often exorbitant, exceeding the cost of public in-state college tuition in some states. Indeed, survey data suggest that parents are spending an estimated 22 percent of their income on child care alone, with 33 percent of parents reporting they had to tap into their savings to cover the cost.
This has led some federal policymakers on both sides of the aisle to seek ways to address the nation’s child care shortage, but how to get these solutions across the finish line into law is elusive. The Trump administration and the Republican-controlled U.S. Congress are more focused on cutting federal support for child care to cover the cost of extending tax cuts for corporations and wealthy Americans, but therein lies one way to alleviate some of the strain in the child care market through the employer-provided tax credit.
At the end of 2025, many provisions passed under the 2017 Tax Cuts and Jobs Act will expire and provide policymakers with an opening to reform the tax code. Based on existing proposed legislation, it’s likely that the 119th Congress will pursue revisions to Section 45F to expand the subsidies available for businesses that offer employer-provided child care in an attempt to address some of the nation’s child care shortage.
To date, however, this tax credit has not been widely used, limiting its potential impact to provide families with young children the support they need. This factsheet summarizes what we know about employer-provided child care and some of the proposals to reform it.
The basics of Section 45F, the employer-provided child care tax credit
Qualified child care expenses include the costs for “acquiring, constructing, rehabilitating, or expanding a child care facility; operating a qualified child care facility, including training and certain compensation increases for employees with advanced levels of child care training; and contracting with a qualified child care facility to provide child care.”
Qualified child care resource and referral service expenditures include “expenses incurred to help employees find child care services.”
Few U.S. firms currently offer employer-provided child care and thus few workers have access to it
A 2022 U.S. Government Accountability Office report utilizing 2016 data estimated that only 169 to 278 corporate tax returns claimed the credit at an estimated cost of $15.7 million to $18.8 million in credits. In comparison, in 2016, between 70,001 and 70,808 corporate tax returns filed a General Business Credit form to claim multiple business credits on their taxes.
Partial data from 2018 analyzed by the Government Accountability Office suggested that U.S. firms reduced spending on child care facilities and resource expenses. The GAO report cites the complexity in administering child care and a general lack of awareness of the credit as key drives of the lower uptake.
In 2018, the Government Accountability Office also found that an estimated 16,846 to 21,378 individuals that own pass-through businesses claimed an estimated $6.4 million to $8 million in employer-provided child care tax credits. Compared to the estimated 633,000 and 695,000 individuals that filed tax returns for pass-through firms, few firms claim the credit. (Individual tax returns for pass-throughs do not amount to the total number of businesses since multiple individuals can be partners or shareholders in one business.)
In 2020, nearly 30 percent of high-salaried, private-sector employees had access to employer-provided child care, compared to only 11 percent of overall U.S. workers at the time. Additionally, analysis of Bureau of Labor Statistics data suggests that workers in metropolitan areas and industries with more educated workers are more likely to utilize employer-provided child care benefits.
Could reforms to the employer-provided child care tax credit improve business uptake?
The small size of the employer-provided child care tax credit limits its utility, but increasing its utility may not be the most efficient allocation of scarce government dollars. Specifically:
The cost of constructing a child care center can range from $1 million to $3 million, compared to the maximum annual credit limit of $150,000. For large employers, the credit may not be enough to entice them to construct an employer-provided child care facility.
Economists have argued that the low uptake of the tax credit suggests that it may be an optimal candidate for reform as a vehicle to expand the provision of child care in U.S. workplaces since the credit could be reformed to better support the construction of new child care facilities and the creation of additional child care slots that parents desperately need. Importantly, reforming the credit would not be subsidizing existing centers because the historic low levels of businesses claiming the credit illustrate that new claims of the credit would likely result in the creation of new centers and increase the supply of available child care. If the credit already had high levels of businesses claiming it—and claiming it at its maximum value—then it would be a poor candidate for reform as it would suggest it was a behavior that businesses would otherwise pursue on their own.
Increasing the value of the employer-provided child care credit, however, is probably not the best way to improve child care availability. Increased funding could be better targeted to families that have a greater need for direct child care income support. The Joint Committee on Taxationestimated the Section 45F tax credit would cost $100 million over the 5-year period between fiscal year 2022 and 2026. That magnitude of increased spending on the employer-provided child care tax credit could be more efficiently allocated directly to help low- and middle-income working families access child care because white-collar, highly paid workers are already the most likely to have access to employer-provided child care or direct employer-provided child care benefits.
Other child care policy considerations
Surveys suggest that parents support employer-provided child care as it is a prerequisite for many parents to find employment and remain productive at work if they have young children.
Employer-provided benefits in general can create additional friction, factors that reduce workers’ abilities to move more efficiently between jobs in the labor market, which can create a less dynamic economy resulting in lowered productivity in the labor market. In an economy with an undersupply of child care, access to an employer-provided child care slot might keep workers in a job they might otherwise leave out of fear of losing the provided benefit. This is often referred to as “job lock” and is heavily associated with employer-provided health care benefits.
Incentivizing investment in child care through the tax code will not address a pervasive issue in child care that contributes to its lack of supply: the low wages paid to child care workers, despite the high prices parents pay. Low pay in the sector—roughly $14.60 an hour, or $30,370 annually, in 2023—contributes to high levels of turnover in the profession and increased levels of stress for those who remain.
There is some evidence that employer-provided child care may result in greater gender discrimination on top of the existing workplace discrimination and gender wage gaps. In Chile, researchers found that the implementation of a requirement for employers to provide child care resulted in a wage penalty on female workers.
It is possible to encourage and support businesses and communities to provide child care outside of the tax code, where greater guardrails and flexibility can be implemented. For example:
In 2022, President Joe Biden signed the CHIPS and Science Act into law. The law supported the U.S. domestic semiconductor manufacturing sector through increased federal investment and included provisions requiring companies that applied for more than $150 million in grants to provide affordable, accessible, and high-quality child care for workers. There are concerns that the second Trump administration will try to eliminate the congressionally created program.
In 2023, Indiana announced a $25 million Employer-Sponsored Child Care Fund to provide up to $750,000 in grants to Indiana-based employers with 20 or more employees, or a community nonprofit applying on behalf of a group of local employers. The program provided considerable flexibility, allowing employers to utilize the funds to provide on-site or near-site care, child care tuition benefits, or support dependent care assistance plans, an employee benefit plan that reimburses up to $5,000 annually to employees that pay for dependent care. The state utilized some of the state’s remaining federal relief funds from the COVID-19 pandemic and required that applicants implement the program within a year and match only 10 percent of the grant amount.
Bipartisan legislation in the 119th Congress to adjust the employer-provided child care tax credit
U.S. Sens. Katie Britt (R-AL) and Tim Kaine (D-VA) proposed the Child Care Availability & Affordability Act (S.847) alongside U.S. Reps. Salud Carbajal (D-CA), Michael Lawler (R-NY), Sharice Davids (D-KS), and Juan Ciscomani (R-AZ) (H.R. 1827). The proposed legislation would increase the maximum credit up to $500,000 and allow percentage of expenses covered up to 50 percent. It also would allow small businesses a maximum credit up to $600,000 and allow them to file a joint application. The Child Care & Affordability Act also would make changes to the Child and Dependent Care Tax Credit and Dependent Care Assistance Program.
U.S. Reps. Sharice Davids (D-KS), Brian Fitzpatrick (R-PA), Suzanne Bonamici (D-OR), and Ryan Mackenzie (R-PA) introduced the Affordable Child Care Act (H.R. 1408) to expand the maximum 45F credit to $300,000.
The U.S. child care market desperately needs reform. Yet under the new Trump administration and Republican-controlled 119th Congress, it’s unlikely the pressure on parents in need of affordable child care is going to be alleviated. Indeed, recent deep cuts to the U.S. Department of Health and Human Services’ Administration for Children and Families—which supports child care, early childhood development, Head Start programs, and other crucial programs—the pain may only get more acute for parents struggling to afford the crushing cost of child care in the United States.
The impending expiration of the 2017 Tax Cuts and Jobs Act suggest that if anything gets done by Congress in 2025, it is going to be tax reform. Revision of the Section 45F employer-provided child care tax credit will likely be included based on existing policymakers interest, yet revisions to the tax code alone will not be enough to support the growing needs of U.S. families.
Interested in learning more about the critical role of the child care market in the U.S. economy and its relationship with broad-based economic growth? Take a look at the following pieces by Equitable Growth:
The Inflation Reduction Act of 2022 is the most significant economic and clean energy jobs program the United States has ever initiated. To improve overall understanding of whether the new law has been effective in achieving its economic policy goals, the Washington Center for Equitable Growth is engaging with policymakers and academics to discuss evaluation and research opportunities that have emerged since its implementation. Through the release of our Request for Proposals: The economic effects of the Inflation Reduction Act, our goal is to stimulate new research on the law’s impact on local and regional labor markets, job creation, innovation, and investment.
The questions and answers outlined below serve as a resource for academics seeking to sharpen their research questions on how the Inflation Reduction Act is shaping distributional economic outcomes on inequality and growth.
What key provisions of the Inflation Reduction Act are most important for researchers seeking to explore its effectiveness in revitalizing local labor markets?
The Inflation Reduction Act was initiated by the Biden administration to respond to decades of U.S. economic and trade policies that resulted in hollowed-out communities, brittle global supply chains, and the consequences of these baleful economic dynamics on workers and their families amid rising income and wealth inequality. The law marked a shift toward economic and clean energy policymaking that deploys public investments to create jobs in local economies. Initial evidence suggests that IRA investments have generated more than 400,000 new clean energy jobs across 48 states and Puerto Rico, while other evidence suggests that if fully implemented, the law’s energy tax credits could lead to 1.7 million new U.S. jobs by 2030.
Job creation is a key economic aim of the Inflation Reduction Act, but the law is specifically designed to create good jobs, which have been shown to benefit both workers and businesses. Many of the law’s policy levers targeting the creation of good jobs offer strong opportunities for policy evaluation.
More research is needed to understand the effects of IRA investments on the quantity and characteristics of jobs created or displaced, as well as the law’s effects on local and regional labor markets, including whether there are notable differences across places. More specifically, are there regional characteristics associated with different outcomes?
What labor provisions within the Inflation Reduction Act may be underappreciated or misunderstood by researchers?
The Inflation Reduction Act’s prevailing wage provision requires IRA-funded projects to pay wage rates at or above industry standards for comparable positions, attempting to incentivize companies to fairly compensate workers on publicly backed projects. These wage rates are determined by the U.S. Department of Labor’s Wage and Hour Division.
In addition, the IRA apprenticeship provision requires these projects to employ apprentices from registered apprentice programs, meeting a three-pronged requirement that examines total project-labor hours completed by apprentices, the number of apprentices hired by credit recipients, and the daily ratio of apprentices-to-skilled journeyworkers. Combined, the prevailing wage and apprenticeship provisions allow projects receiving IRA tax credits and meeting these standards to receive a multiplier of up to five times their tax credits.
Project labor agreements, or PLAs—collective bargaining agreements between contractors and labor organizations before a project begins—typically outline wages, benefits, working conditions, and dispute-resolution procedures for workers. In the context of the Inflation Reduction Act, PLAs serve as a tool for gauging compliance with the law’s prevailing wage and apprenticeship provisions and also can provide employers protection against tax penalties for errors in implementing these provisions. This helps firms with IRA-funded projects maintain their five-times bonus credit, while also encouraging other high-road labor practices, such as dispute resolution mechanisms, guarantees against strikes or lockouts, and worker safety protections.
These provisions provide researchers with a framework for assessing the Inflation Reduction Act’s broader impacts. Researchers should explore what role the IRA labor and community protections are playing in efficient and effective project delivery and outcomes for workers, communities, and firms.
How can researchers begin to evaluate the effectiveness of the Inflation Reduction Act’s investment in place-based policy?
The Inflation Reduction Act was designed to address regional and local economic inequality through place-based policymaking. Directing clean energy investments to economically distressed regions, particularly those which have historically relied on fossil fuels, is an attempt to limit acute economic shocks such as the departure of dominant employers, which have historically had spillover effects to neighboring communities as well.
One mechanism for achieving this goal is the energy community bonus credit. This credit gives developers a 10 percent additional tax credit for clean energy projects in designated energy communities, defined as either former brownfield sites, metropolitan statistical areas with jobs or with tax relationships with fossil-fuel extractive industries, or with unemployment rates higher than national average or former coal communities.
A similar mechanism, the clean electricity low-income community bonus credit, grants a 10 percent to 20 percent increase in the so-called 48E clean electricity investment tax credit for projects sited in low-income communities, on American Indian land, in low-income residential buildings, or those defined as low-income economic benefit projects. These policy designs aim to spur economic revitalization in the areas most exposed to shocks and hardest hit by the clean energy transition.
This design creates avenues for researchers to evaluate the law’s economic effects on local and regional policymaking. More research can determine how states and municipalities are leveraging investments, braiding or stacking them with other major federal investments, or using them to access other financial tools. Where have IRA investments occurred, and how have they connected to local economic development? How are IRA place-based policy designs affecting supply-side activity or demand-side behavior in communities affected by previous manufacturing declines or energy shocks?
How can researchers leverage energy and economic data to analyze the Inflation Reduction Act?
Researchers evaluating the Inflation Reduction Act’s place-based and regional spillover effects may encounter data-availability challenges, but there are public resources, such as USASpending.gov, which allow researchers to track how investments are flowing into these communities and examine whether projects are meeting their intended goals. State variation will also likely provide opportunities for policy-relevant natural experiments, and state utility data could serve as a valuable tool for assessing energy investment impacts and consumption trends at a granular level.
Some examples of the use of innovative data include this research in the Journal of Public Economies by Peter Christensen at the University of Illinois at Urbana-Champaign and co-authors, which accesses data from Illinois’s Home Weatherization Assistance Program to develop a machine-learning function that ultimately aims to increase the benefits per dollar invested. Similarly, a working paper published by the U.S. Census Bureau uses comprehensive administrative data to track the effects of the coal industry’s transition on workers’ earnings.
Conclusion
By focusing on the specific needs of a community and acknowledging that one size does not fit all, researchers can evaluate the Inflation Reduction Act’s place-based policy initiatives to help identify what is working and where challenges remain with the law’s policy design and delivery mechanisms. We hope this resource guide helps researchers prepare their applications in response to our Request for Proposals: The economic effects of the Inflation Reduction Act.
Did you find this content informative and engaging? Get updates and stay in tune with U.S. economic inequality and growth!
Single-mother households are becoming more and more common in the United States. Over the past 50 years, the number of children raised by single mothers has more than doubled. It is the second-most common living arrangement for children in the United States; living with co-habitating parents is the only more common arrangement. More children in the United States are raised by single parents, the majority of whom are single mothers, than in any other country in the world.
Single mothers and their children across the United States face particularly challenging economic circumstances. For instance, it is well-documented that single mothers, compared to mothers in co-habitating living arrangements, are at a greater risk of living in poverty. According to the most recent U.S. Census Bureau’s Supplemental Poverty Measure, almost a quarter of single-female-headed households live in poverty, at 23.9 percent.
U.S. economic policies have not evolved to adequately serve single mothers. As a whole, social infrastructure policies in the United States may only modestly ameliorate the risk of poverty for single mothers and their children because targeted income support programs tend to be insufficient for lifting families out of poverty.
The U.S. Congress and the second Trump administration can help support single moms and their children. Three factsheets and an overarching column, authored by the Washington Center for Equitable Growth and published by Share Our Strength’s Center for Best Practices, explain in detail why these young families in particular need support. But briefly, these analyses present the evidence that government income support programs such as the Supplemental Nutrition Assistance Program, the Child Tax Credit, and Unemployment Insurance, as well as Medicaid, not only help young families, especially those led by single mothers, but also boost stronger long-term U.S. economic growth. These factsheets and column also detail policy recommendations, many of which enjoy bipartisan support in Congress.
Yet already-divisive congressional debates over tax and budget policies in 2025 signal strong efforts to gut these programs in favor of tax cuts for the wealthy and corporations. The tax cuts enacted during the first Trump administration greatly benefited these two privileged constituencies and are set to expire in September. To maintain those tax breaks, Republican members of Congress and the new Trump administration are eying massive cuts to the bedrock social infrastructure that provide income support to single-mother households, young families in general, and underpin broad-based U.S. economic growth and long-term prosperity.
To learn more about economic status of single mothers and the policies available to support improved economic outcomes for single mothers and their children, you can read the column “Three policies to improve economic outcomes for single mothers and their children across the Unites States.” Recently enacted policies that were briefly implemented in the United States have successfully reduced poverty for single mothers—most notably, the temporary expansion of the Child Tax Credit amid the COVID-19 pandemic.
While the success of this tax credit points to a way forward for policymakers, strong evidence suggests there are other policies available to ensure robust economic security and thus more equitable economic growth. These include, but are not limited to, eliminating work requirements for income supports, streamlining access to income supports, and improving child care infrastructure.
Indeed, income support programs, such as Unemployment Insurance and Temporary Assistance for Needy Families, fulfill multiple key roles in the functioning of a strong economy. During economic downturns, income supports automatically stabilize the U.S. macroeconomy by maintaining spending and consumption levels despite higher rates of unemployment.
Many families in the United States do not have a robust network of support when it comes to raising children. Approximately half of families in the United States, for instance, live in so-called child care deserts, or U.S. Census Bureau tracts with more than three children under age 5 for every one licensed child care slot. Recent survey research suggests that finding child care is a significant barrier to accessing child care, with 79 percent of single-parent families reporting difficulty finding care. When families can find care, it is often unaffordable, especially for single-mother households. To learn more, read “Factsheet: Improving child care infrastructure supports single mothers and promotes equitable growth in the United States.”
Despite this weight of evidence, it’s unclear whether the second Trump administration and Republican majorities in the 119th U.S. Congress will pursue any policies to alleviate the child care burden faced by families, despite severalbipartisanefforts to do so now before Congress. It is clear, however, that they intend to pursue increased implementation of work requirements to reduce federal spending and access to income support programs that low-income families, and especially single-mother households, rely on in order to provide tax cuts for the wealthiest Americans and corporations.
Tax cuts are neither a path to stronger economic growth nor a way to help young parents and the next generation of Americans they are raising prepare for the second half of the 21st century. Rather, pro-growth tax reform in 2025 would boost the U.S. economy and support young families for years to come.
Did you find this content informative and engaging? Get updates and stay in tune with U.S. economic inequality and growth!
The Washington Center for Equitable Growth last week hosted a briefing for Capitol Hill staffers on multinational corporate tax trends and policies—another in our “Econ 101” series for Hill staffers. Over the past few decades, multinationals corporations have grown into economic giants, accounting for more than 30 percent of global Gross Domestic Product and dominating international trade flows. These companies’ cross-border operations raise fundamental questions about how they should be taxed in an increasingly globalized economy.
Our March 28 briefing was led by David S. Mitchell, Equitable growth’s senior fellow for tax and regulatory policy, and Elena Patel, assistant professor at the University of Utah’s Marriner S Eccles Institute for Economics and non-resident senior fellow at the Urban-Brookings Tax Policy Center. The briefing was timely for Hill staffers because lawmakers around the world are engaged in on-going negotiations to curb the harmful tax competition that has driven corporate tax rates to unsustainably low levels, fueled aggressive and inefficient tax planning, and eroded corporate tax bases.
After years of international negotiations led in large part by the United States, the world in 2021 coalesced around a solution: the Global Tax Deal. This ambitious framework—agreed to by more than 130 countries, including the United States—aims to modernize how large corporations are taxed in an increasingly interconnected global and digital economy. But recent policy shifts by the second Trump administration have introduced fresh uncertainty, throwing the stability of the agreement into question.
Mitchell opened the briefing by describing the U.S. corporate tax, an entity-level tax that applies to C-corporations—so-named based because their tax treatment is governed by subchapter C of the U.S. Internal Revenue Code. These companies are subject to a flat 21 percent corporate tax on their taxable profits, but they can reduce their tax bills by taking advantage of deductions and credits that are designed to influence corporate behavior.
As a result, Mitchell noted that roughly half of large corporations and one quarter of large, profitable corporations do not owe any federal tax each year. The effective tax rate, or the ratio of a firm’s tax bill to profits, reflects the actual tax burden faced by a firm. The nonpartisan Government Accountability Office, the investigative arm of Congress, estimated that the average effective tax rate among large, profitable corporations was just 9 percent in 2021, or less than half of the statutory rate of 21 percent.
U.S. corporate tax revenue has been relatively flat over the past 40 years, at about 1 percent to 3 percent of GDP, even though corporate profits have nearly doubled. (See Figures 1 and 2.)
Figure 1
Figure 2
One reason is that sophisticated cross-border tax planning undertaken by multinational corporations tends to push taxable profits into low-tax jurisdictions. As Patel explained, multinational corporations choose where to locate assets and sell their products, taking into consideration the myriad of corporate tax rates available to them across the globe. The rise of intangible assets, such as intellectual property, only further complicates these choices because intangible assets are highly mobile and difficult to price, making them an easy vehicle for shifting profits across borders.
In fact, since 2015, about 40 percent of foreign income earned by U.S. multinationals has been booked in just six low-tax countries. This does not necessarily mean that multinationals are outsourcing physical operations or jobs to these countries, but that they also could be using accounting strategies related to transactions between the parent company and its foreign subsidiaries that results in profits being reported there. In response to these trends, countries have begun to undercut each other’s corporate tax rates, leading to a global race to the bottom.
Patel went on to explain how these emerging trends have called into question the fundamental principles of international income tax on which tax treaties and national tax codes have been based. The first right to taxation of corporate income, for example, typically belongs to the country where a company has a physical presence, or what is referred to as its nexus. Yet the advent of digital services introduces questions about where exactly value is being created and the first right to taxation.
For example, if a tech company sells advertisements on its search engine to foreign companies that are viewed only by foreign customers, is the value created by the foreign customers, or is the value created by the servers that run the search engine? These concerns have led some countries to deviate from international norms and unilaterally impose a Digital Services Tax on the gross revenues from search engines, social media platforms, and online marketplaces operating within its borders—actions that have been interpreted as discriminatory by the U.S. government because many of these services are provided by U.S. multinational corporations. Countries that have put in place or have threatened to put in place a Digital Services Tax include the United Kingdom, several countries in the EU, Canada, and India.
The first Digital Services Tax predates the 2017 Tax Cuts and Jobs Act, which marked a turning point in the U.S. tax treatment of multinational corporations. The tax law replaced the U.S.’s worldwide tax system, which had led to more than $4 trillion in earnings being held offshore to avoid costly repatriation taxes, with a territorial system that only taxes income earned within the United States—more closely aligning with the tax systems of other member nations of the Organisation for Economic Co-operation and Development.
At the same time, the 2017 tax law introduced three key measures—usually referred to in tax parlance by their acronyms GILTI, FDII, and BEAT—all of which depart from a pure territorial approach to protect the U.S. corporate tax base. GILTI serves as a minimum tax on certain foreign income to discourage profit shifting. FDII provides a preferential tax rate for income earned from certain exports to encourage onshoring. And BEAT prevents the erosion of the corporate tax base through certain deductible payments made to foreign affiliates.
None of these new measures, however, appear to have been successful in bringing the taxation of profits or physical production back to the United States, underscoring the challenges policymakers face by attempting to unilaterally correct for global tax competition. That’s why the Global Tax Deal introduces a two-pillar framework that reflects a cooperative effort to re-align the principles of international corporate taxation to escape the race to the bottom.
Under the first pillar, tax rights pertaining to a portion of the profits (referred to as Amount A in the treaty) of highly profitable, large companies are reallocated to market countries based on the relative size of their consumer base. This first pillar is meant to replace the current patchworked system of Digital Services Taxes and reform the concept of a company’s nexus to acknowledge both its physical and digital presence.
Under the second pillar, participating countries agree to implement a self-reinforcing set of minimum taxes designed to ensure that each affiliate of a multinational pays a 15 percent minimum effective tax rate, regardless of where it operates, and to create incentives for low-tax jurisdictions to raise their rates to meet that minimum. So far, more than 70 countries are in the process of or have already enacted legislation complying with this second pillar. Negotiations concerning the first pillar are ongoing. Notably absent: the United States.
Patel and Mitchell concluded this Econ 101 Hill briefing by emphasizing that ending harmful tax competition requires global cooperation—and that the United States has been a key leader in shaping the Global Tax Deal while protecting U.S. interests. With thoughtful adjustments, parts of the U.S. tax code, such as GILTI, could be adopted to align the U.S. tax code with the Global Tax Deal’s framework. Ultimately, these changes require congressional leadership.
Equitable Growth’s latest Econ 101 briefing will enable congressional staff to be better prepared to navigate the complex tax issues that underlie this important debate and ensure that the United States remains a leader in shaping fair and stable international tax rules.
This year’s debate over the expiring personal income and estate tax provisions of the 2017 Tax Cuts and Jobs Act provides an opportunity for reforming the qualified small business stock exclusion. The QSBS exclusion, which allows investors to avoid paying taxes on capital gains earned on the sale of early-stage stock purchases, is costly and disproportionately benefits the wealthy. It was originally enacted in 1993 and has been subsequently expanded and modified, significantly increasing its cost despite little or no evidence that it promotes economic growth or innovation.
Research published by the U.S. Department of the Treasury’s Office of Tax Analysis in January 2025 quantifies the cost and identifies the beneficiaries of the QSBS exclusion.65 Prior to the release of this research, little was known about the quantity of gains qualifying for the exclusion or the characteristics of QSBS claimants. The new study finds that between 2012 and 2022—the period covered by the Treasury Department’s research—more than $152 billion in exclusion claims were filed, with the amount claimed rising significantly in recent years.66 During that period, individual filers’ claims (as opposed to those from trusts and estates) accounted for $130.6 billion of that amount. Within that group, claims by filers with total positive income of more than $1 million accounted for 26.1 percent of returns claiming the exclusion and a substantial 74.4 percent of excluded gains.67
The new research builds on prior work, including a June 2023 study published by Equitable Growth.68 Taken together, the available research makes a strong case for reforming or eliminating the preferential treatment of QSBS gains. Eliminating the exclusion would raise an estimated $44.6 billion from 2025 to 2034, based on estimates by the U.S. Department of Treasury as part of its annual tax expenditure report, and $81.5 billion from 2026 to 2035, based on a new study from the Yale Budget Lab.69
In this issue brief, I will review the history of the qualified small business stock exclusion, detailing how it has expanded over time into a far more complex tool that overwhelmingly benefits the wealthiest investors. I close this issue brief with a set of recommendations that would eliminate or reduce abusive practices that allow wealthy investors to make excessively large claims. Such reforms would return billions of dollars to the U.S. Treasury Department.
What is the qualified small business stock exclusion?
The QSBS exclusion (also known as Section 1202 for the Internal Revenue Code section authorizing the exclusion) allows investors in qualified stock issued by small businesses, generally start-ups, that are organized as C corporations to exclude the gains from the sale of stock held for at least 5 years. Certain limitations apply, and the amount of excludable gains from the investment in a single company is limited to the greater of $10 million or 10 times the basis in the stock that is sold within the year.70
Individuals and trusts and estates are eligible to claim the exclusion.71 The recently released Treasury report finds that individuals accounted for about 90 percent of the unique claimants benefitting from the exclusion and about 86 percent of excluded gains, with trusts and estates accounting for the remainder.72 (See text box.)
Three types of investors typically hold qualified small business stock: founders of the company, venture capitalists and other early-stage investors, and early employees. For founders and early employees, stock grants often constitute a significant share of their compensation, promising big rewards should a business prove successful. While data on the industries issuing qualified stock are not available, the applicability of the QSBS exclusion to venture capital investments has led researchers to suggest that investors in tech start-ups are major beneficiaries.73
Intended as an incentive for investors to back high-risk, early-stage businesses, Section 1202 applies to just a small fraction of the nation’s small businesses: those organized as C-corporations.74 Less than 10 percent of U.S. small businesses are organized as C corporations, and, based on the most recent available information from the IRS, C corporations accounted for a declining share of all business income.75
The history of the qualified small business stock exclusion
The QSBS exclusion was enacted in 1993 with the aim of spurring investment in start-up businesses. It came on the heels of the Tax Reform Act of 1986, which eliminated the ability to exclude 60 percent of all long-term capital gains, raising concern that investors would be unwilling to take the risk of investing in start-up businesses.76 At the time of enactment, the QSBS exclusion allowed investors to exclude 50 percent of the gains earned on the sale of stock held for at least 5 years that also met other specified conditions.77 Over time, the exclusion has been modified and expanded.
The 1997 and 2003 reductions in the top tax rate that applied to all long-term gains narrowed the gap between the effective top rate on all gains and that on qualified small business stock.78 Small business stock advocates pushed to widen the differential to increase the relative benefits of the QSBS exclusion. The law now allows for the full exclusion of the excess of qualified gains on stock issued after September 28, 2010.79 (See Table 1.)
The new study published by the U.S. Department of the Treasury examined 11 years of tax returns claiming QSBS exclusions.81 The authors find that the wealthiest tax filers—those with total positive incomes of more than $1 million—accounted for roughly three-quarters of QSBS gains excluded on individual tax returns during the period examined, but only about one-quarter of the claims filed. Meanwhile, 1 out of 5 individual tax returns claiming the exclusion reported incomes up to $100,000, with these returns accounting for just 1.4 percent of actual excluded gains. (See Figure 1.)
Figure 1
This disparity reflects a dramatic difference in the amount of excluded gains claimed, with a median claim of $20,850 for filers with incomes of more than $1 million, or 1,226 times the median claim of filers with incomes less than $100,000. The very largest claims—those at the 90th percentile filed by claimants with incomes of more than $1 million—averaged $1.84 million. This would translate into a tax reduction of $438,536 for a claimant taxed at a rate of 23.8 percent (the 20 percent long-term capital gains tax rate plus the 3.8 percent net investment income tax rate).82 (See Figure 2.)
Figure 2
The QSBS exclusion contributes to the rising share of capital gains that go untaxed
Recent estimates suggest that a large share—potentially as much as one-third to one-half of all income from capital gains—goes forever untaxed due a number of preferential rates, exclusions, and other special treatment.83 Similarly, research finds that more than half of the estates of the wealthiest decedents—those with more than $100 million in assets—comes from unrealized, and thus untaxed, capital gains.84
While the QSBS exclusion accounts for a relatively small share of all realized capital gains—1.5 percent of those reported on tax returns between 2012 and 2022, according to the conservative estimates from the recent Treasury Department study—the 100 percent exclusion and the rise in excluded gains is significant both in absolute terms and as a percentage of all capital gains in the period studied.85
The current structure of the QSBS exclusion can be gamed by investors
While a company must have assets valued at no more than $50 million at the time the stock qualifying for the exclusion is issued, qualified stock maintains that status no matter how large the business grows.86 Moreover, although the maximum excludable gain is limited to the greater of $10 million or 10 times the claimant’s basis in the stock, the ability to gift stock to friends and family or to a trust expands the benefits of QSBS status.
An early-stage investor, for example, could establish trusts for their heirs to shelter additional gains from taxation.87 Similarly, the total gain excluded by claimants’ participation in an investment partnership, such as a venture capital fund, could exceed the $10 million-or-10-times basis limit. Consider, for example, a venture capital fund with more than 50 investors that makes a $50 million investment. In this example, more than $500 million in gains could well be excluded if the total number of general partners in the venture capital fund making the qualified investment is greater than 50.88
Other areas that leave the asset limit open to abuse include contributions of intellectual capital, made without compensation, by a founder to a start-up and self-created goodwill. In each case, the value to the company for tax purposes would be zero, while the economic value to the firm could be substantial.
Venture capital fund managers are likely to be one of the largest classes of QSBS exclusion beneficiaries.89 In brief, individual fund managers typically invest a portion of the fund’s working capital in the firms in which they invest. The venture capital fund managers receive a proportionate share of the gains on this investment when the stock is sold.
Fund managers then receive a “second bite of the apple” with respect to gains they receive as carried interest, partial compensation for management of the investment fund. The carried interest payment, typically equal to 20 percent of the gains earned by the venture capital fund, allows managers to benefit each time the fund sells a stock eligible for the QSBS exclusion. This exacerbates the effect of the controversial carried interest loophole, which provides preferential treatment to venture capital and private equity fund managers by treating a portion of their management fee as an investment, rather than as wage and salary income.90
More recently, investment advisors have marketed structures aimed at allowing QSBS owners to avoid the 5-year holding period and/or increase the amount of tax-free gains.91 These firms, for example, market investment pools that allow gain holders who sell before the end of a 5-year holding period to roll over the gain from a sale and escape the payment of tax or to multiply excludable gains by stacking a series of trusts. Others advise investors on how to set up a QSBS qualified business to use as a gain-sheltering investment.92(See illustration below.)
Advertisement for strategies to avoid QSBS anti-abuse provisions
The rising volume of QSBS claims has led to an increase in the provision’s estimated cost. The U.S. Treasury Department’s FY 2020 Tax Expenditure report estimated a 10-year cost of $17.6 billion.93 By 2024, the department projected a 10-year cost of $44.6 billion, and a recent study by the Yale Budget Lab estimated the 10-year cost from 2026–2035 to be $81.5 billion.94 (See Figure 3.)
Figure 3
The actual cost could be much higher than these projections, considering the increase in the value of initial public offerings and that accurate forecasting is complicated by the lack of information reporting or certification requirements imposed on corporations that issue stock used to qualify for the QSBS exclusion.95
Does the QSBS exclusion promote economic growth and innovation?
The original intent of the QSBS exclusion was to encourage investment in small businesses that might otherwise have difficulty attracting capital.96Limited research suggests that the exclusion results in a modest increase in early-stage funding but at a relatively high cost. Moreover, a large share of the benefit—approximately one-third—accrues to investors who are disproportionately very wealthy and not to the small businesses.97
The dramatic expansion of the venture capital sector in recent years draws into question whether the conditions that led to the enactment of the exclusion still apply today. Some researchers argue that there is now a “glut” of venture capital available and that investable funds exceed quality investments.98These critics charge that the QSBS exclusion provides a costly windfall that narrowly benefits extraordinarily wealthy investors.
Options for reforming the qualified small business stock exclusion
Congressional debate over the expiration of the personal income and estate tax provisions of the 2017 Tax Cuts and Jobs Act provides an opportunity to eliminate or reform the QSBS exclusion. As discussed above, eliminating the exclusion would raise an estimated $44.6 billion from 2025–2034, based on 10-year cost projections of the provision by the U.S. Department of the Treasury, and $81.5 billion from 2026–2035, based on a new study from the Yale Budget Lab.99
Short of repealing the exclusion, options for reform include:
Limiting the size of the QSBS exclusion available to high-income individuals: The U.S. Congress previously considered reducing the percentage of excludable gains to 50 percent for individuals with incomes greater than $400,000 and for trusts.100 A 2021 Joint Committee on Taxation estimate projected savings of $5.7 billion from imposing such a limit over 10 years.101The exclusion could also be phased out entirely for those incomes in excess of $400,000. Implicitly, a limitation on excludable gains would also subject included amounts as income for purposes of the Net Investment Income Tax, consistent with the treatment of other investment-related income.
Limiting the use of multiple stacked trusts to increase the volume of excluded QSBS gains and to minimize the amount of taxable gains: This could be accomplished by establishing a lookback rule applying to transactions with multiple trusts.102
Eliminating QSBS gains as a preference item for the purposes of calculating Alternative Minimum Tax liability: Requiring these gains to be included would help ensure that the Alternative Minimum Tax provides a meaningful backstop, so that the wealthy pay at least a minimum level of tax on the income they receive.
Extending the holding period for qualified small business stock and limiting the exclusion for stock that is held for shorter periods of time: A recent analysis by the Yale Budget Lab projected that requiring stock to be held for 7 years to qualify for a 100 percent QSBS exclusion, while limiting the exclusion to 50 percent for stock held for 5 years and 75 percent for stock held for 6 years, would raise about $8.5 billion over the 10-year budget forecasting window.103
Limit QSBS treatment to corporations that have raised less than $10 million in equity capital: Imposing such a capital ceiling would limit QSBS treatment to early-stage start-ups that have yet to demonstrate an ability to tap into unsubsidized forms of capital.
Eliminate the tax-free rollover provision: Under current law, taxpayers avoid paying taxes on gains received from the sale of qualified small business stock held for at least 6 months if they are used to purchase replacement qualified small business stocks. The rollover provision does nothing to increase the total amount of capital flowing to start-up firms and has spawned abuse and provides opportunities for investors to circumvent the 5-year holding requirement and other protections.
Issuing regulations to clarify how companies’ valuation is calculated for the purposes of determining whether stock is “qualified”: Areas in need of clarification include limits on the use of bonus depreciation when determining whether a company meets the $50 million asset threshold.104
Apply the limit on excludable gains to investments made by partnerships at the partnership, rather than partner, level: This would prevent the use of partnership structures to evade the $10 million-or-10-times-basis cap on excludable QSBS gains.
Targeting the QSBS exclusion to truly small businesses, such as by substituting a limit of no more than $10 million of total annual income for the current $50 million asset test: A limit at this level would be consistent with the existing Treasury Department definition of a small business.105
Imposing reporting requirements so that policymakers and researchers can better understand the value of outstanding excludable gains and the characteristics of QSBS exclusion claimants: A reporting requirement could be linked to a pre-certification of eligibility requirement, which could help reduce potential noncompliance.
Conclusion
The 2025 tax debate offers an opportunity for the U.S. Congress to revisit and reform the QSBS exclusion. As the new Treasury data demonstrate, the exclusion overwhelmingly benefits the wealthy and has risen in cost over time. The rising cost of the QSBS exclusion, coupled with well-documented opportunities for its abuse, call for scrutiny as the tax debate moves forward in 2025.
The author wishes to thank David Mitchell, Gregg Polsky, and Manoj Viswanathan for their very helpful comments and suggestions.
About the author
Jean Ross is an economist and tax policy analyst and the principal of Jean Ross Policy | Strategy. She holds a M.C.P from the University of California, Berkeley in regional economics and economic development.
Did you find this content informative and engaging? Get updates and stay in tune with U.S. economic inequality and growth!