This is a weekly post we publish on Fridays with links to articles that touch on economic inequality and growth. The first section is a round-up of what Equitable Growth published this week and the second is the work we’re highlighting from elsewhere. We won’t be the first to share these articles, but we hope by taking a look back at the whole week, we can put them in context.
Equitable Growth round-up
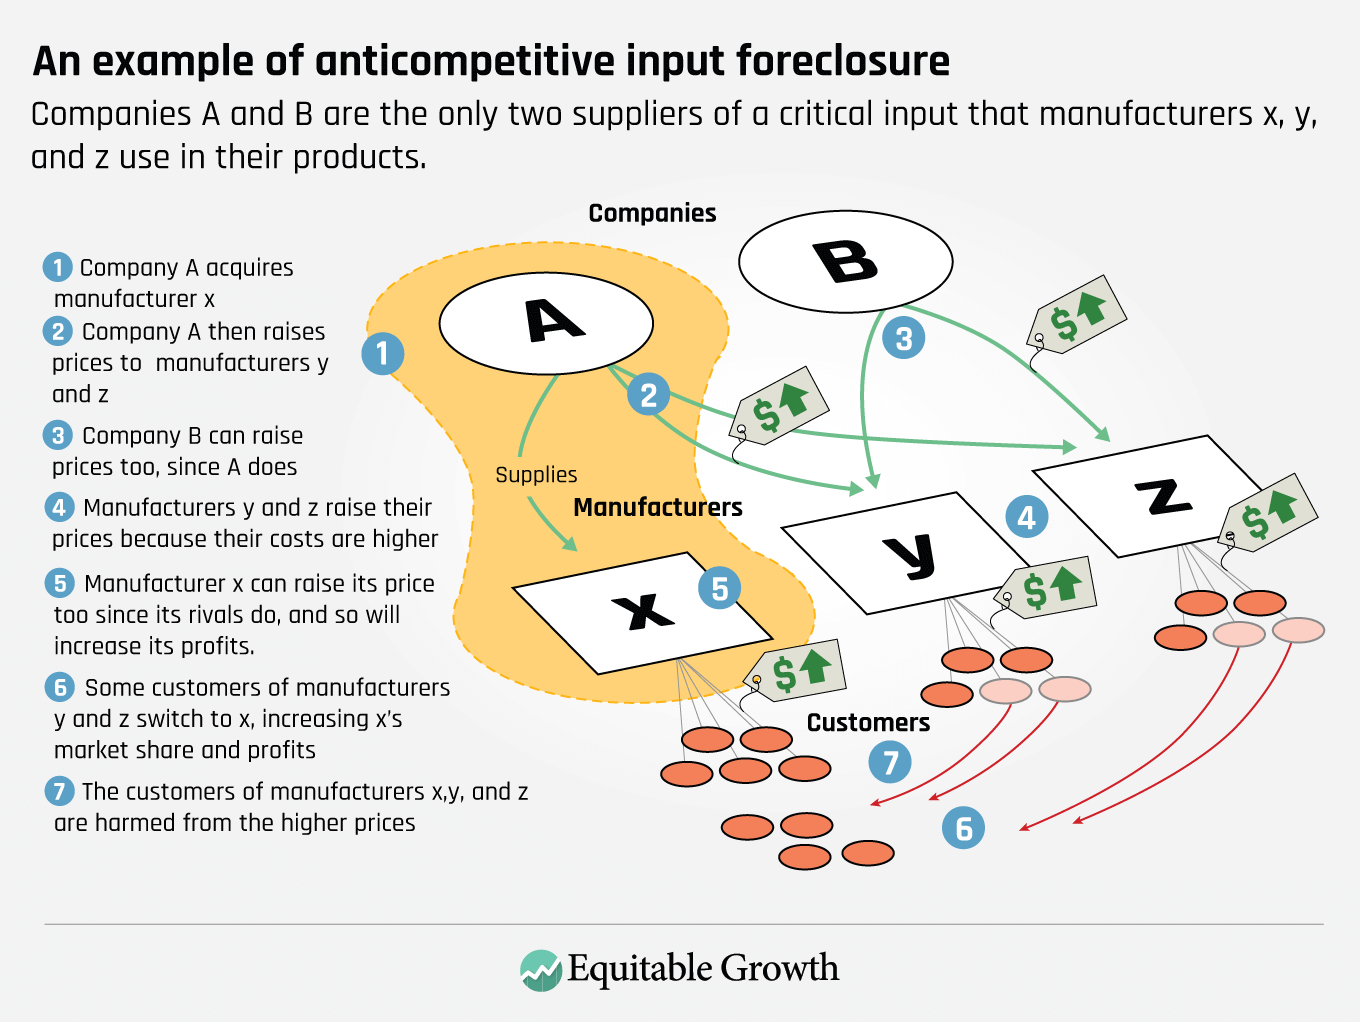
Raksha Kopparam briefly details the findings from Equitable Growth guest author Fiona Scott Morton’s review of recent academic literature on U.S. antitrust and competition issues, arguing that modern research does not support recent policy pushes for antitrust laws to be more limited in scope.
Catch up on Brad DeLong’s latest worthy reads from Equitable Growth and around the web.
Equitable Growth’s Liz Hipple discusses the research findings from Marie Connolly, Miles Corak, and Catherine Haeck that compares intergenerational mobility within and between the United States and Canada and the effects of public policy, race, and inequality in influencing children’s economic outcomes in the two countries.
Links from around the web
Alphabet Inc.’s Google unit, like many other high-tech companies, has worked to garner a reputation as an idyllic workplace with high pay and great benefits. But Daisuke Wakabayashi of The New York Times tells the story of Google’s overlooked workers—its temps and contractors—who now outnumber full-time employees and are making less money, receiving poor benefits, and garnering no paid vacation time. (nyt)
Gig economy workers are facing extreme financial hardships, according to the latest report from the Federal Reserve examining economic well-being in the United States. Vox’s Alexia Fernandez Campbell breaks down the shocking statistics, including that 58 percent of gig economy workers couldn’t afford a $400 emergency and that 40 percent of drivers qualify for Medicaid and 18 percent qualify for food stamps. (vox)
Will Parker and Cameron McWhirter of The Wall Street Journal shed light on Uber Technologies Inc. drivers facing economic hardships who have taken on new part-time jobs in the gig economy—working for house flippers. In the struggle for additional cash, Uber drivers are being paid by house flippers to identify homes on their routes that real-estate firms can buy, flip, and quickly sell for large profits. (wsj)
The U.S. economy has seen a shift over the past decade of minimizing labor costs and cutting lasting ties to their workers as the rest of the country’s quest for decent jobs continues. Steven Greenhouse, Lawrence Mishel, Katherine Stone, and David Weil discuss the toll that alternative work arrangements are taking on American workers in The American Prospect. (prospect)
Chris Westfall asks why 46 percent of Americans are finding themselves working side jobs in order to make ends meet and looks at whether our strong Gross Domestic Product numbers are being felt by everyday workers. (forbes)
Friday Figure
U.S. and Canadian rates of economic mobility
A cluster map of mobility rates shows that while there are areas of low mobility in both Canada and the United States, areas of low mobility are more widespread in the United States
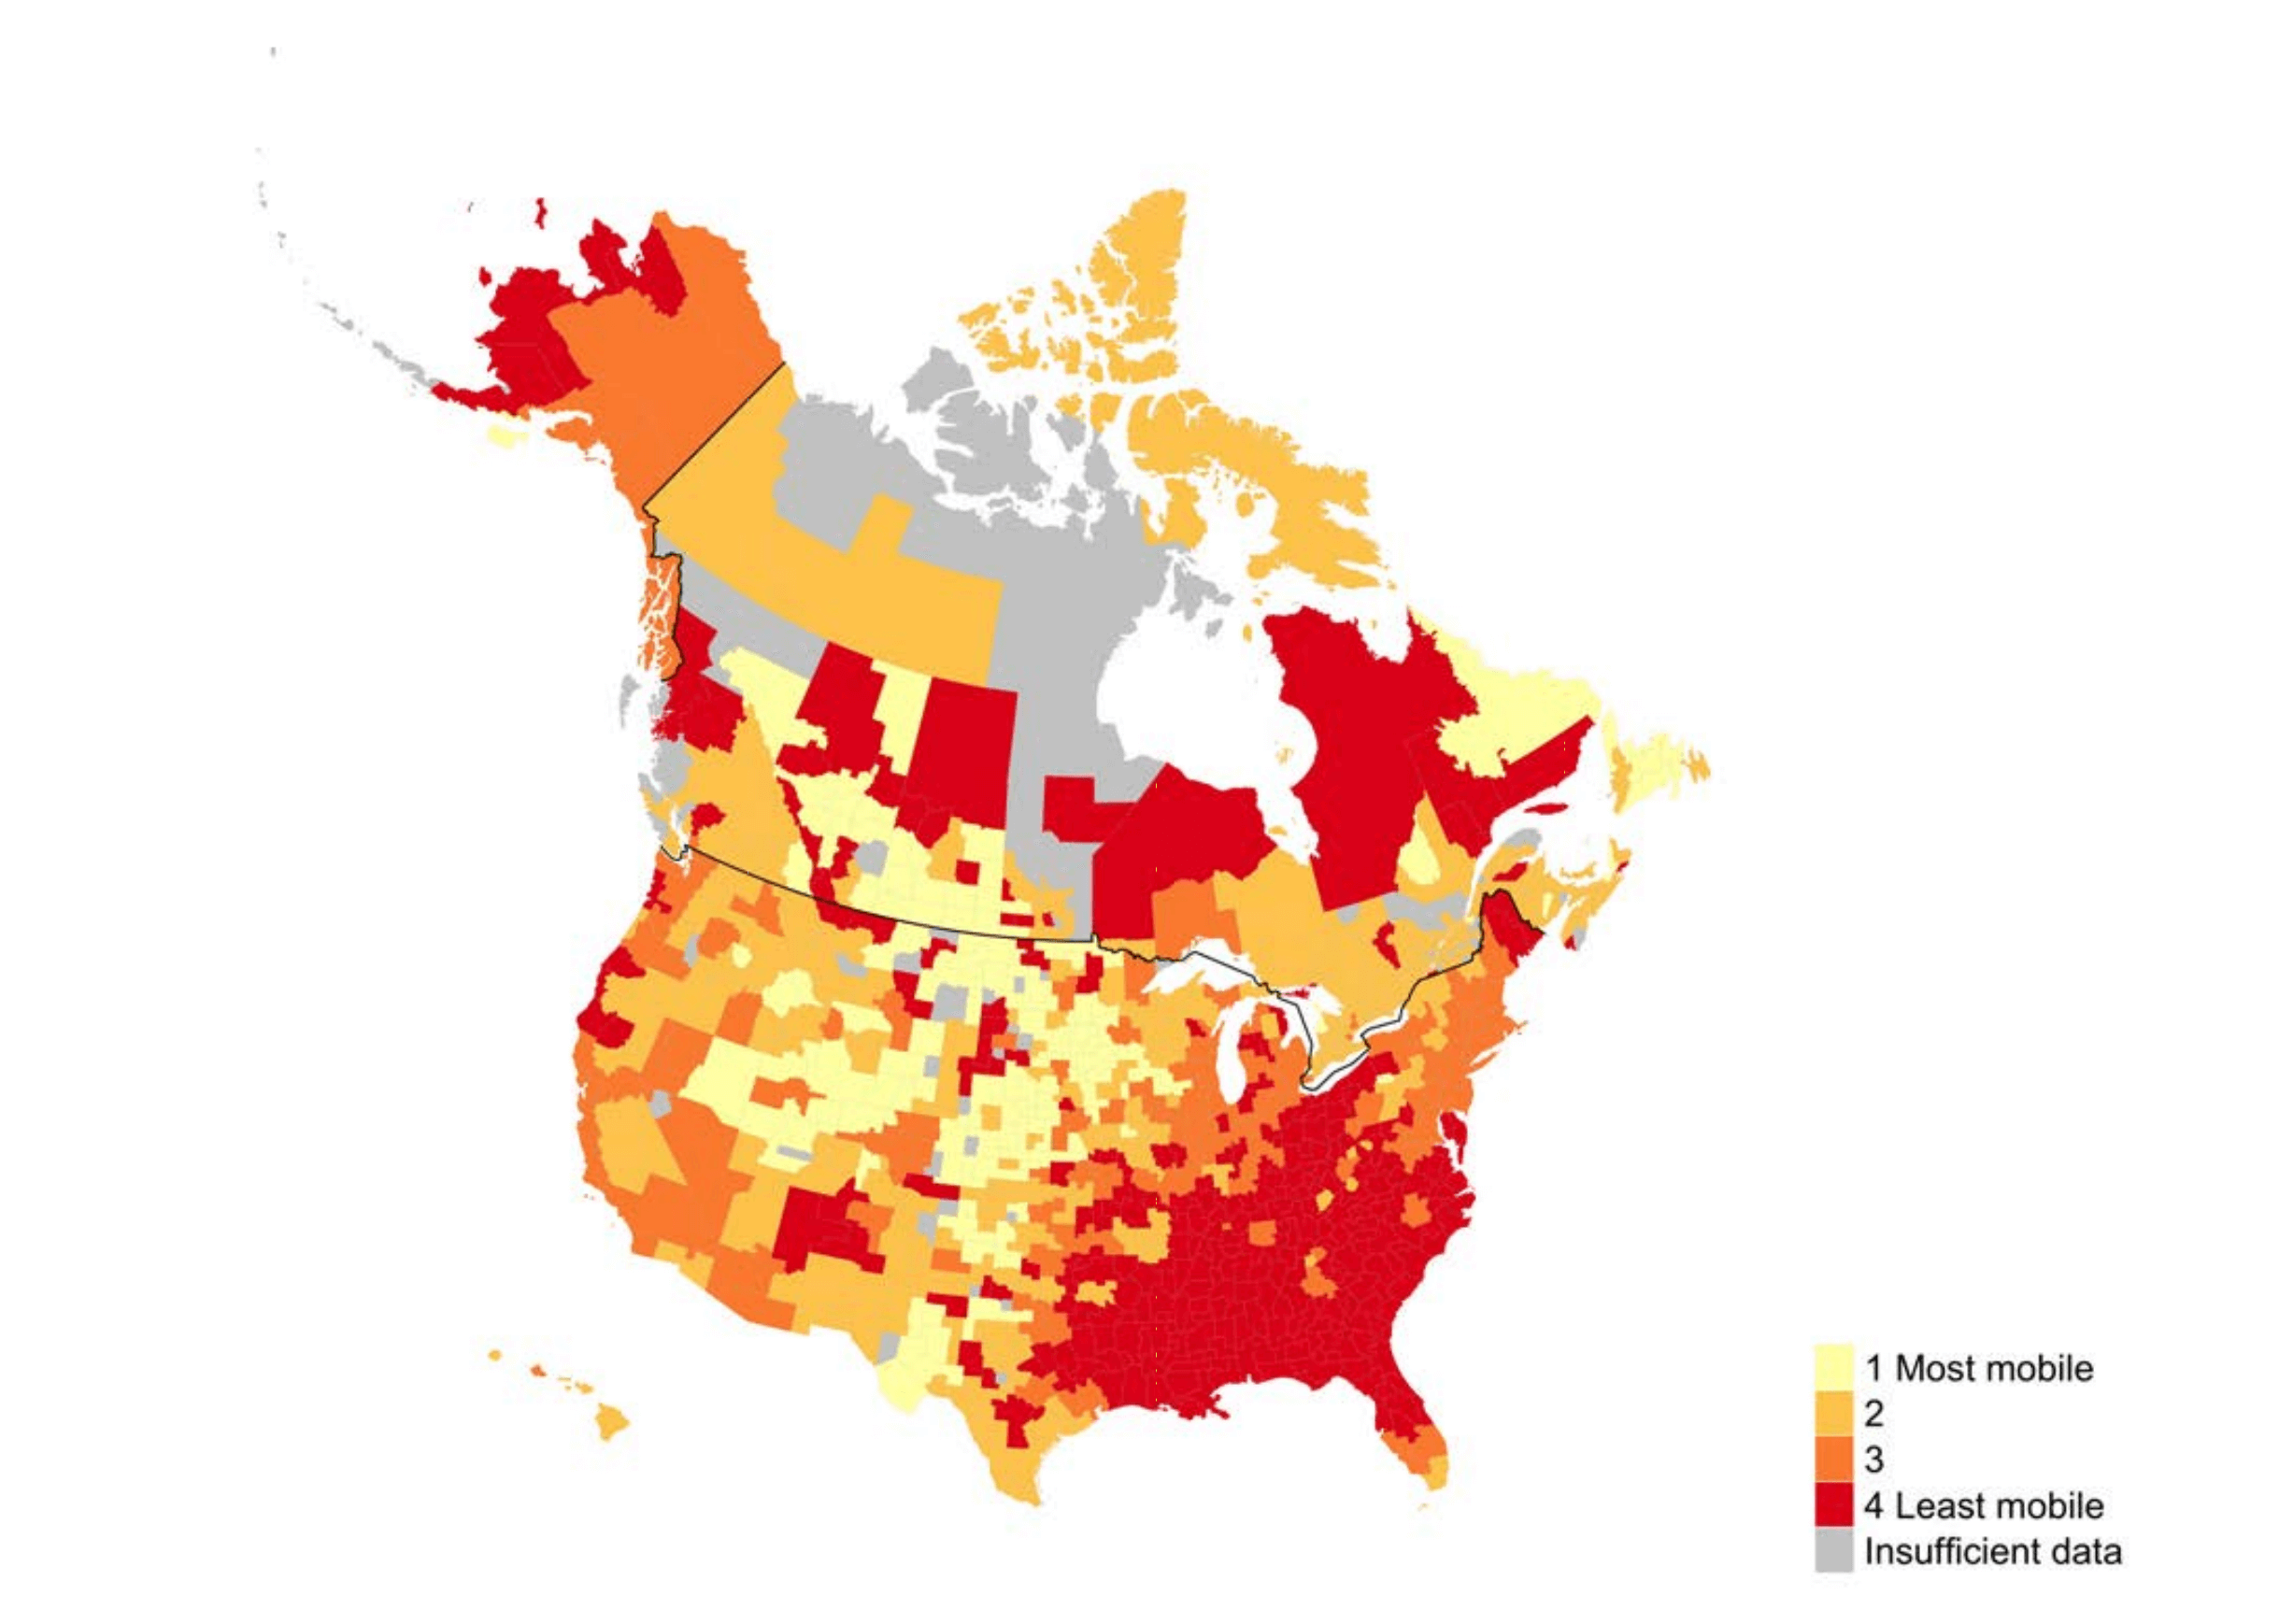
Source: Marie Connolly, Miles Corak, and Catherine Haeck, “Intergenerational Mobility between and within Canada and the United States.” Working Paper No. 25735 (National Bureau of Economic Research, 2019), available at LINK.
Figure is from Equitable Growth’s, “Low intergenerational mobility in the United States shows impact of race and public policy” by Liz Hipple.