Equitable Growth’s Jobs Day Graphs: June 2023 Report Edition

On July 7th, the U.S. Bureau of Labor Statistics released new data on the U.S. labor market during the month of June. Below are five graphs compiled by Equitable Growth staff highlighting important trends in the data.

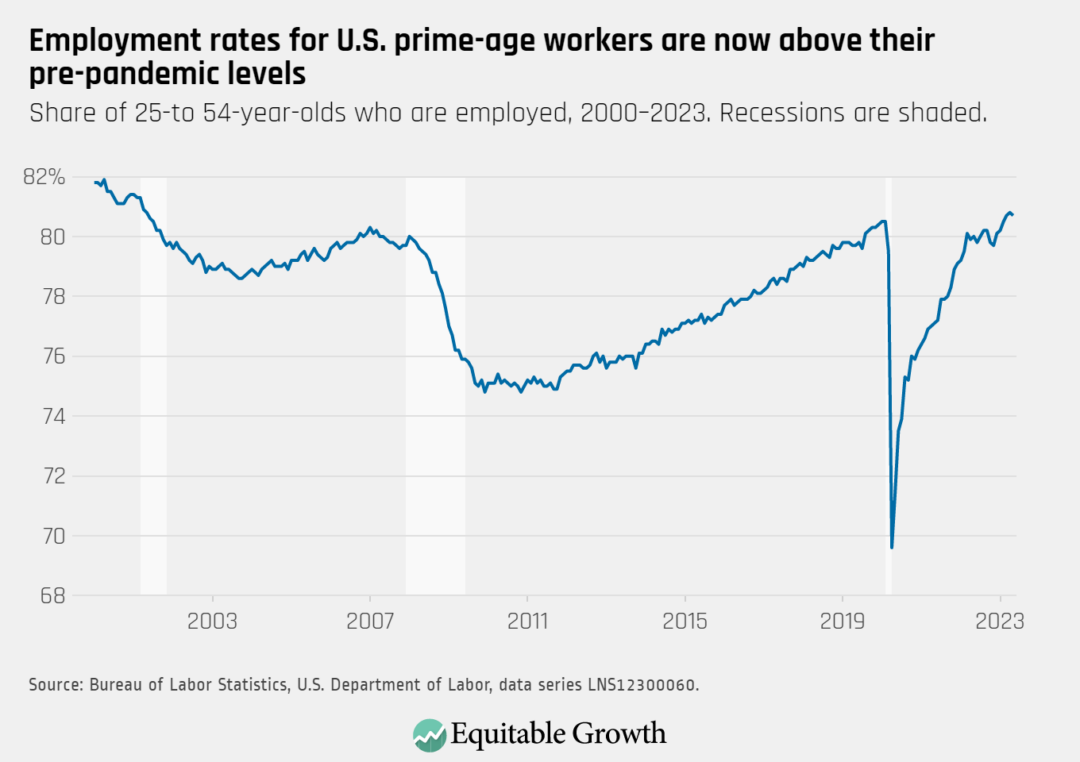
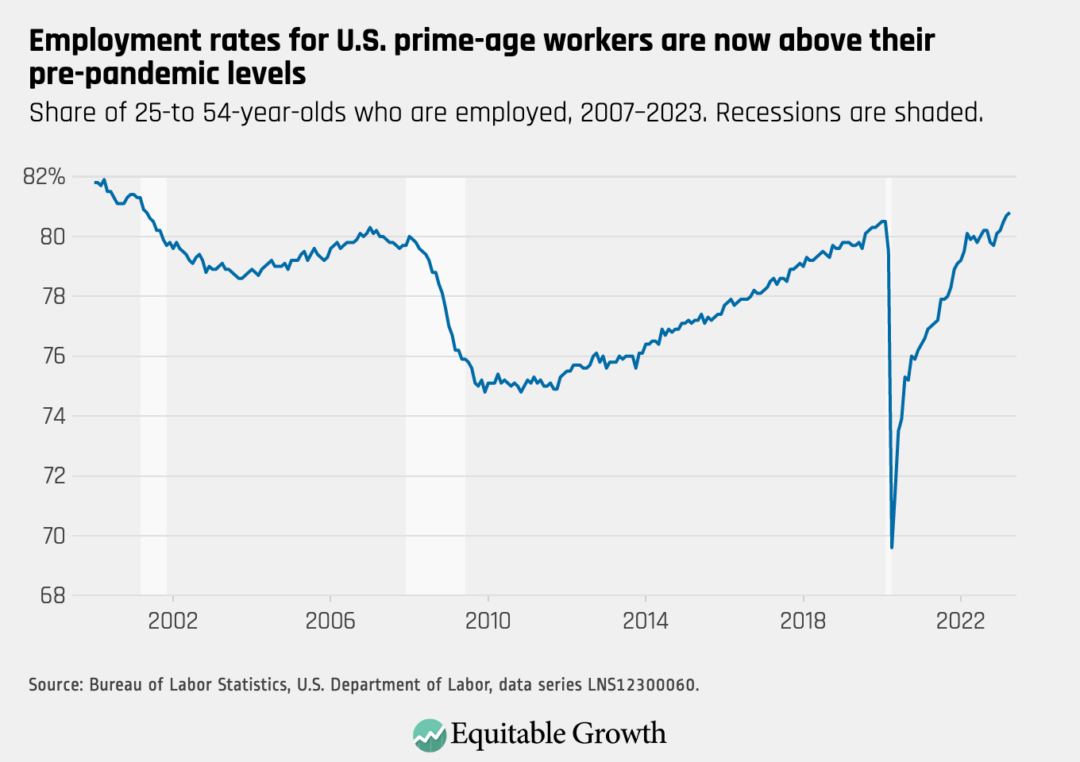
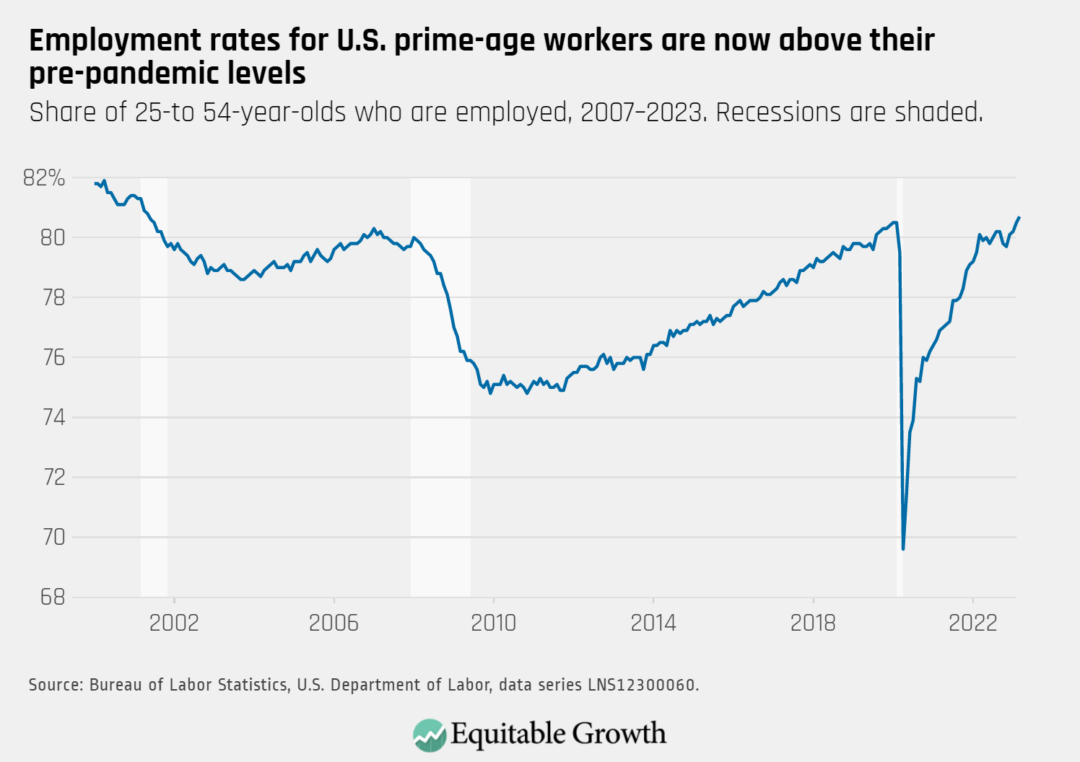
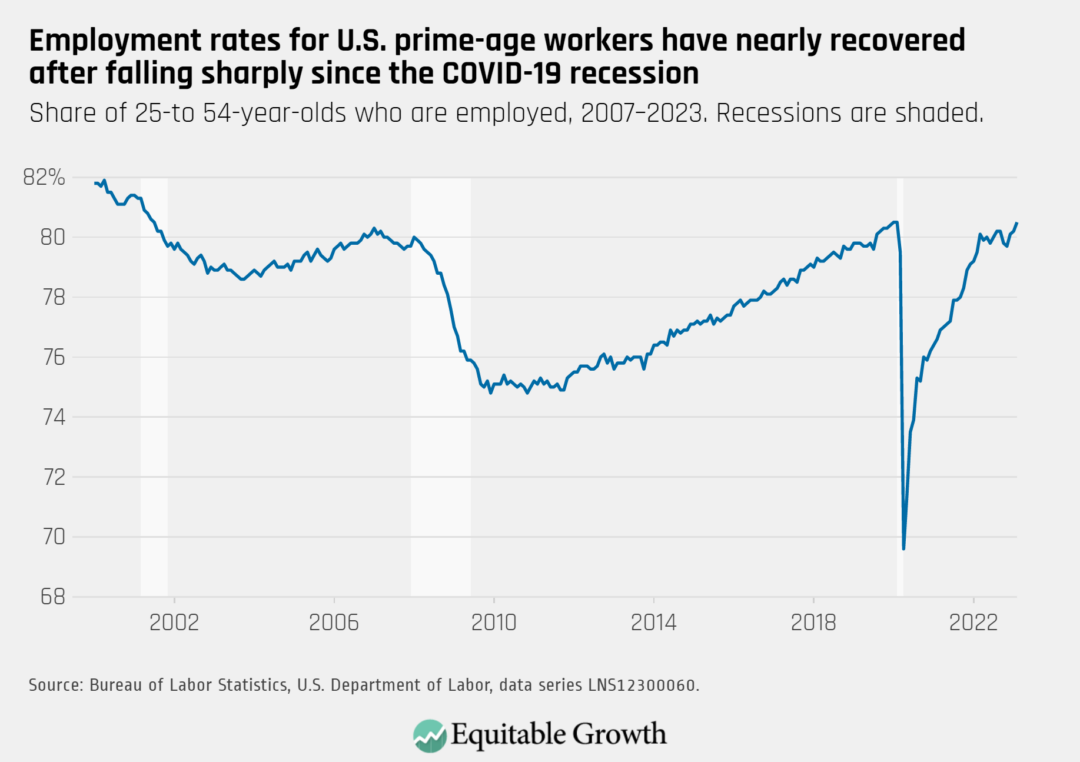
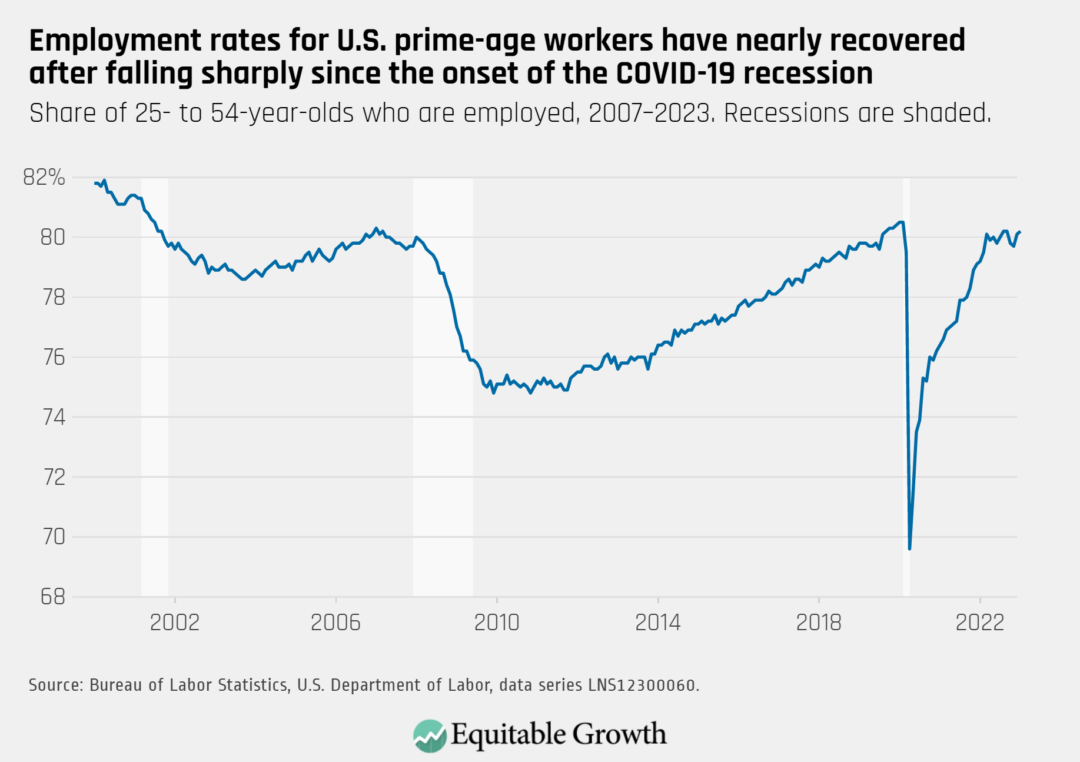
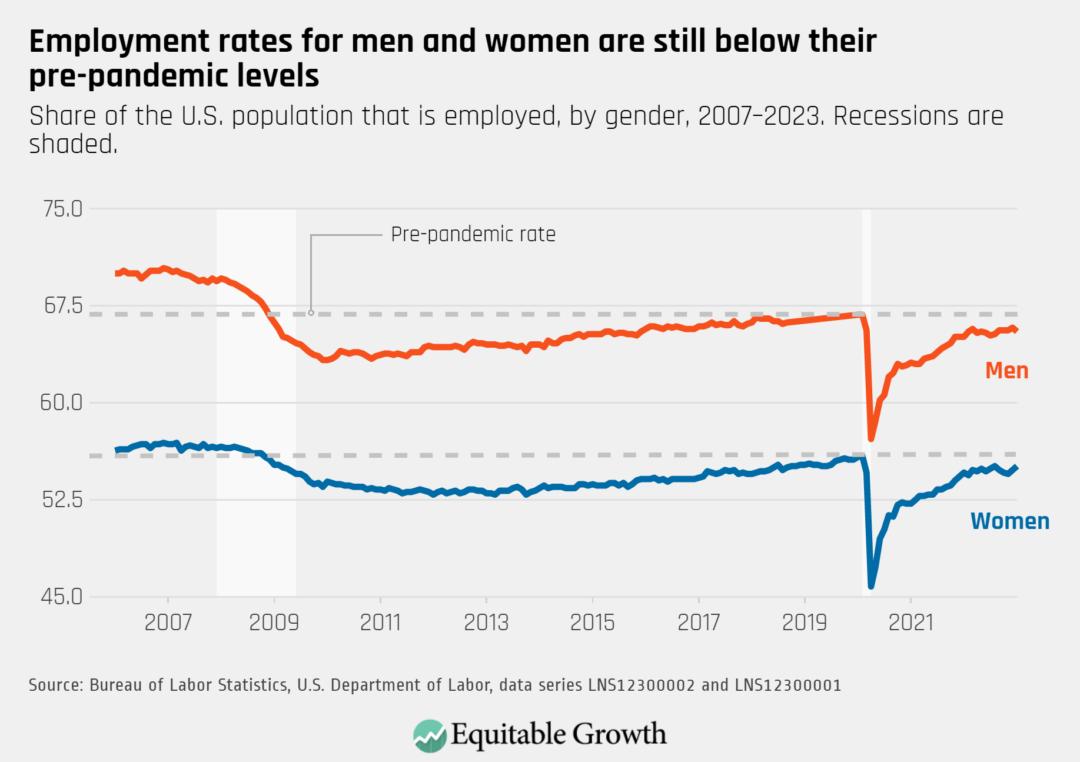
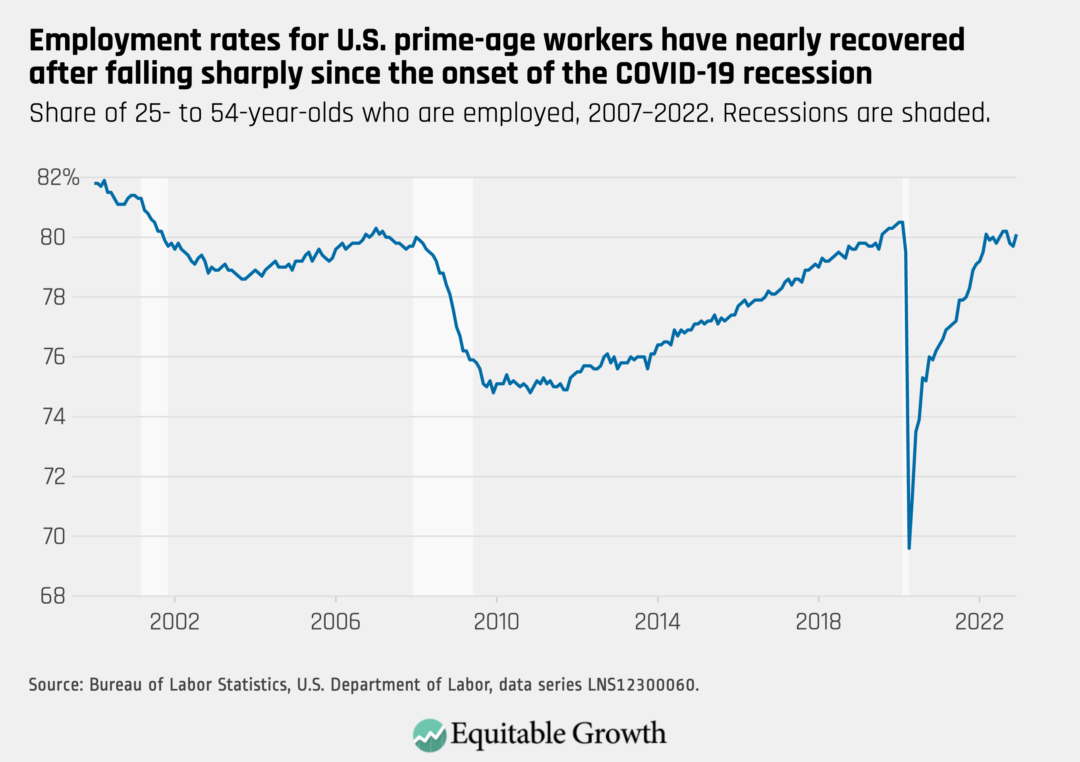
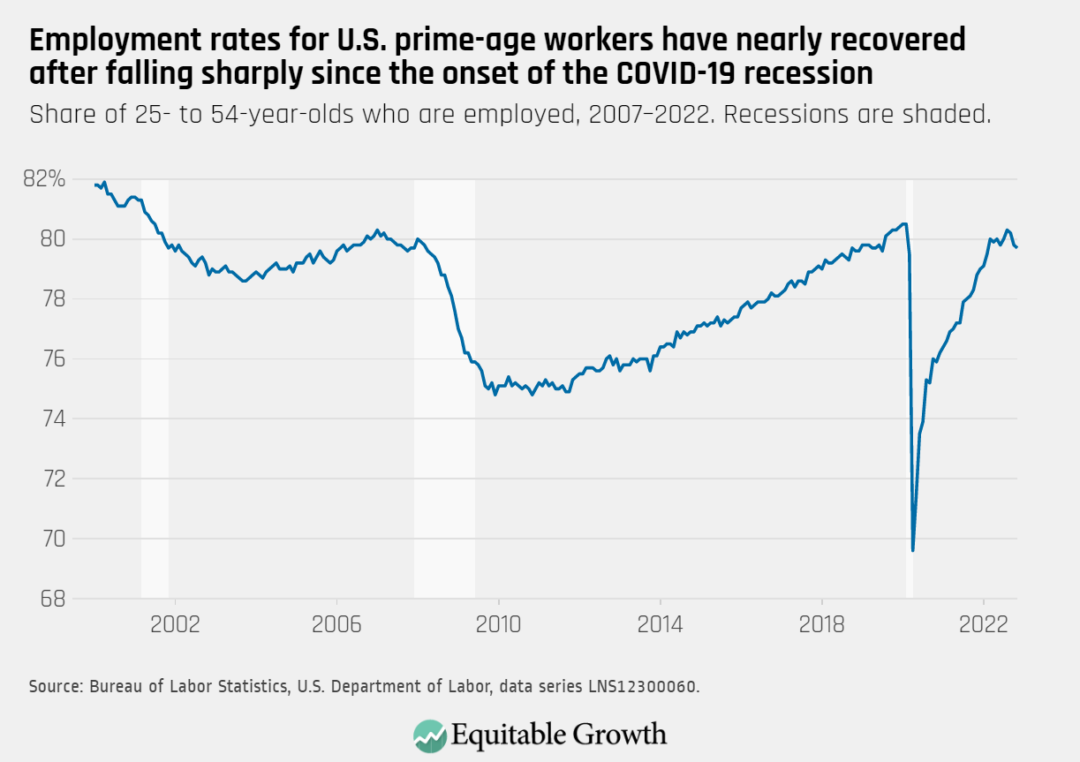
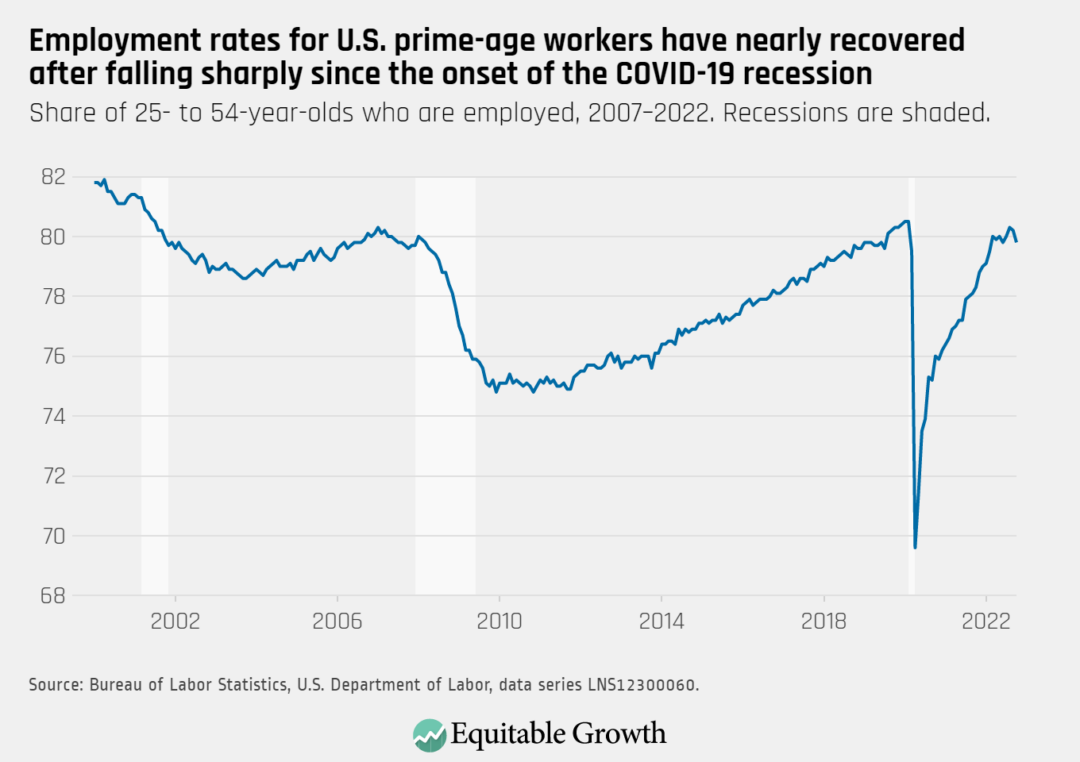
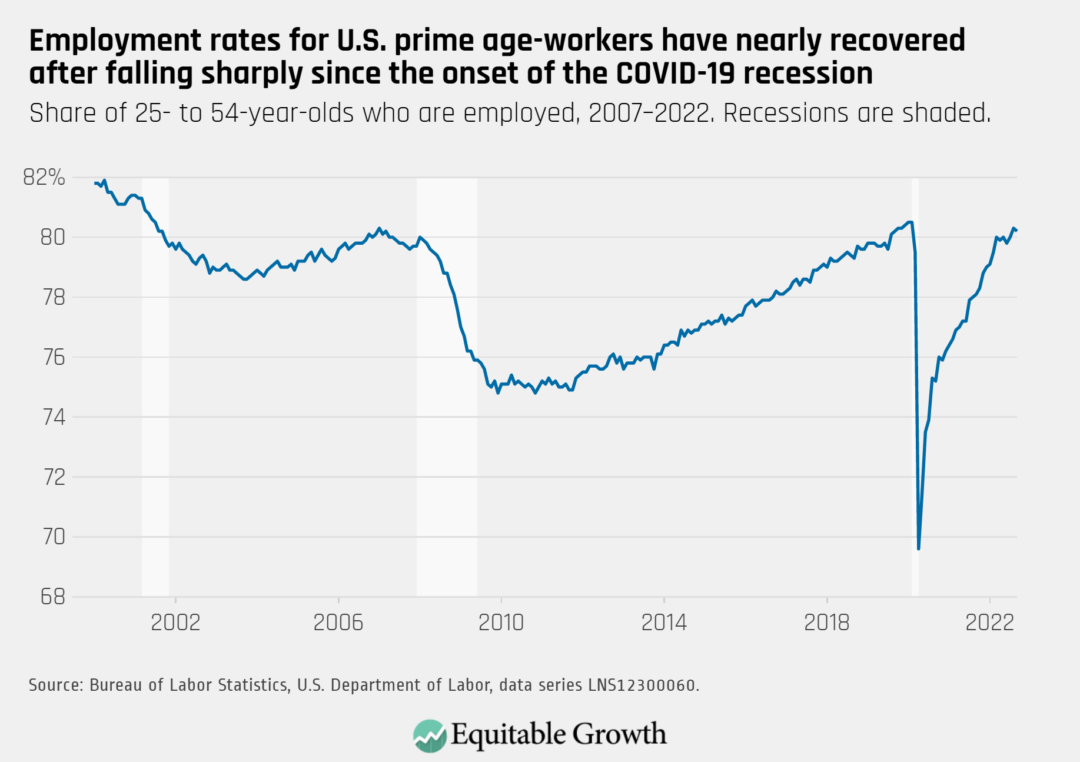
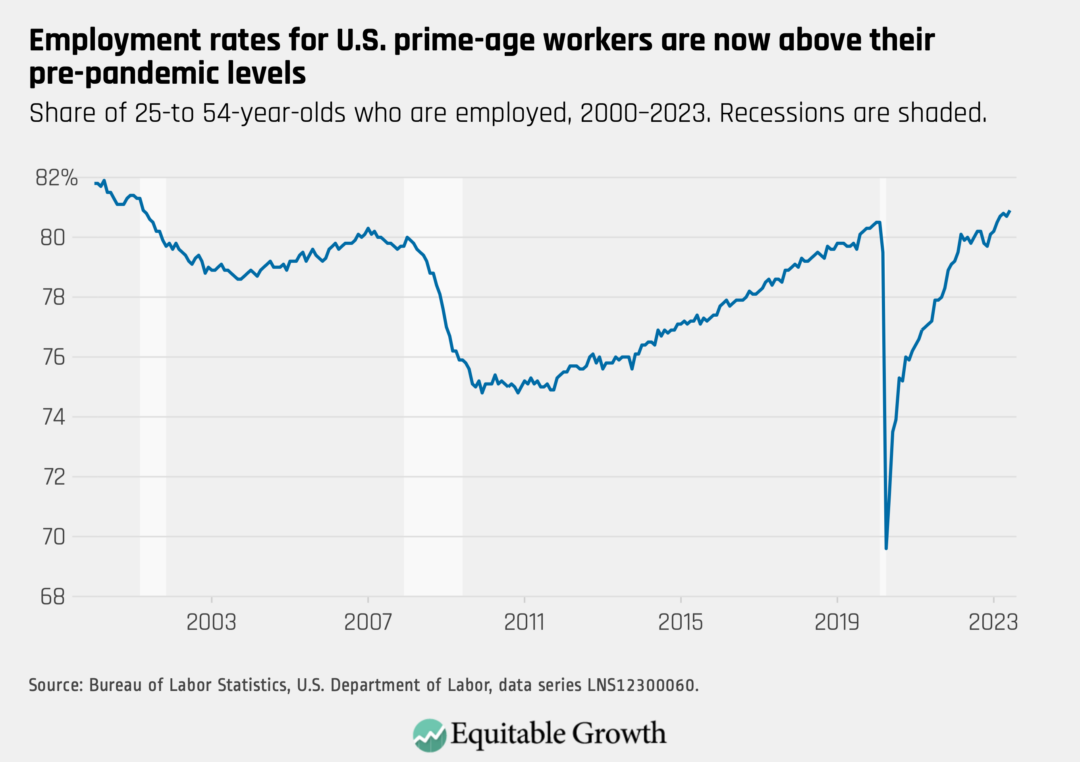
The employment-rate for prime-age workers rose to 80.9 percent in June, it’s highest rate in more than two decades. The U.S. labor market added 209,000 jobs last month.

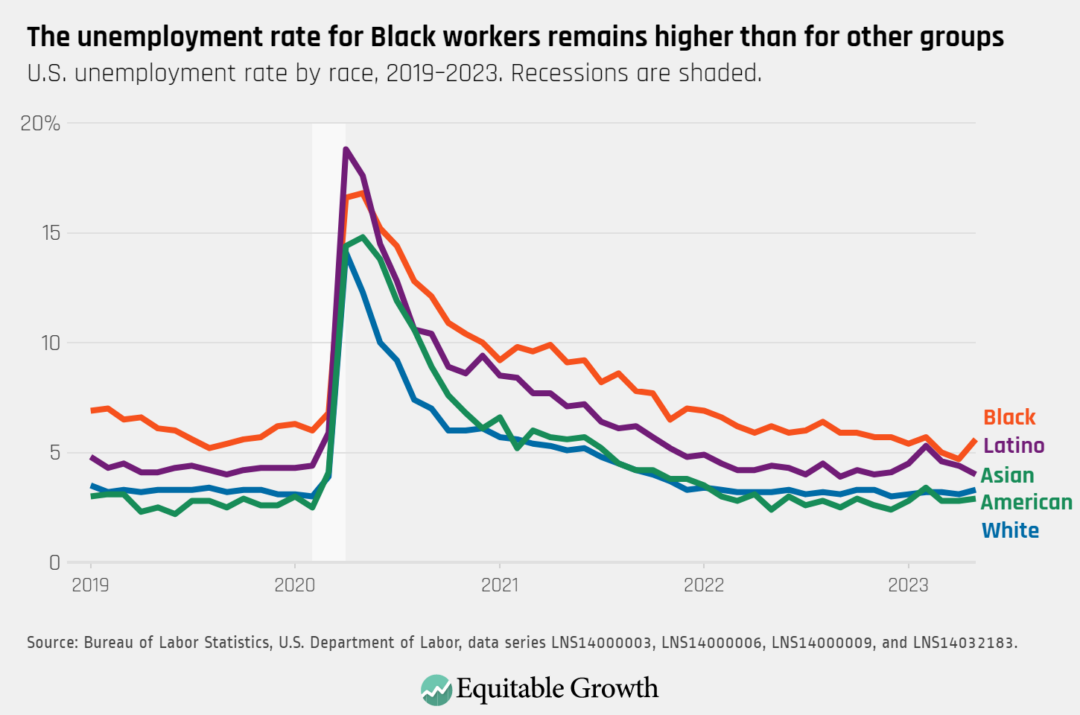
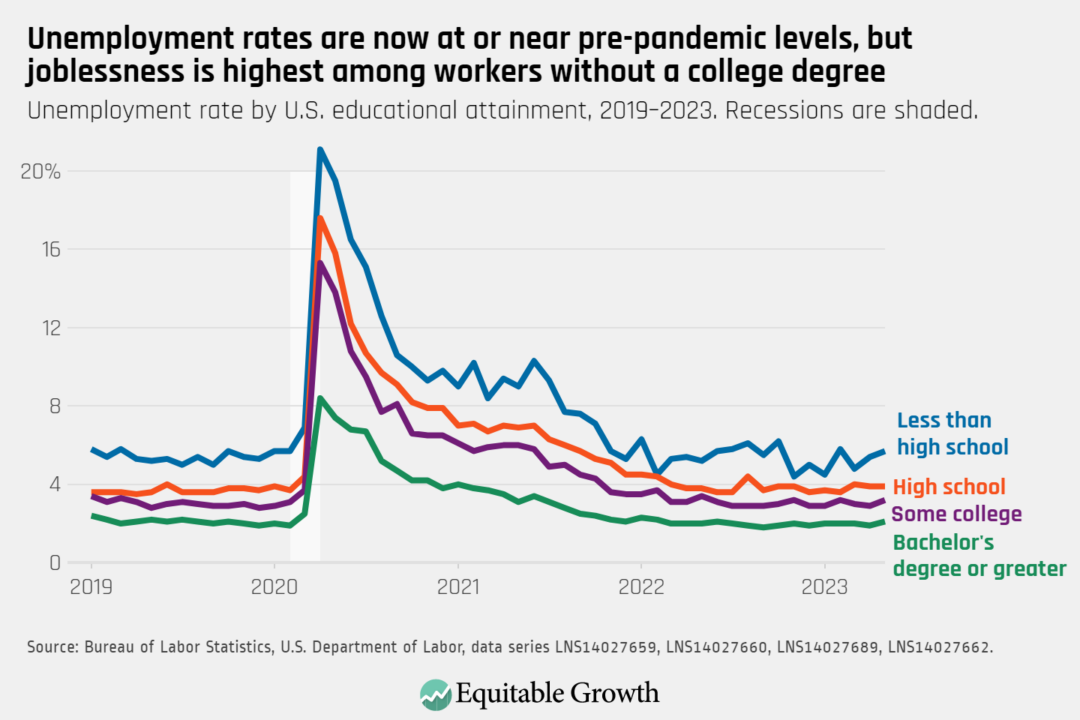
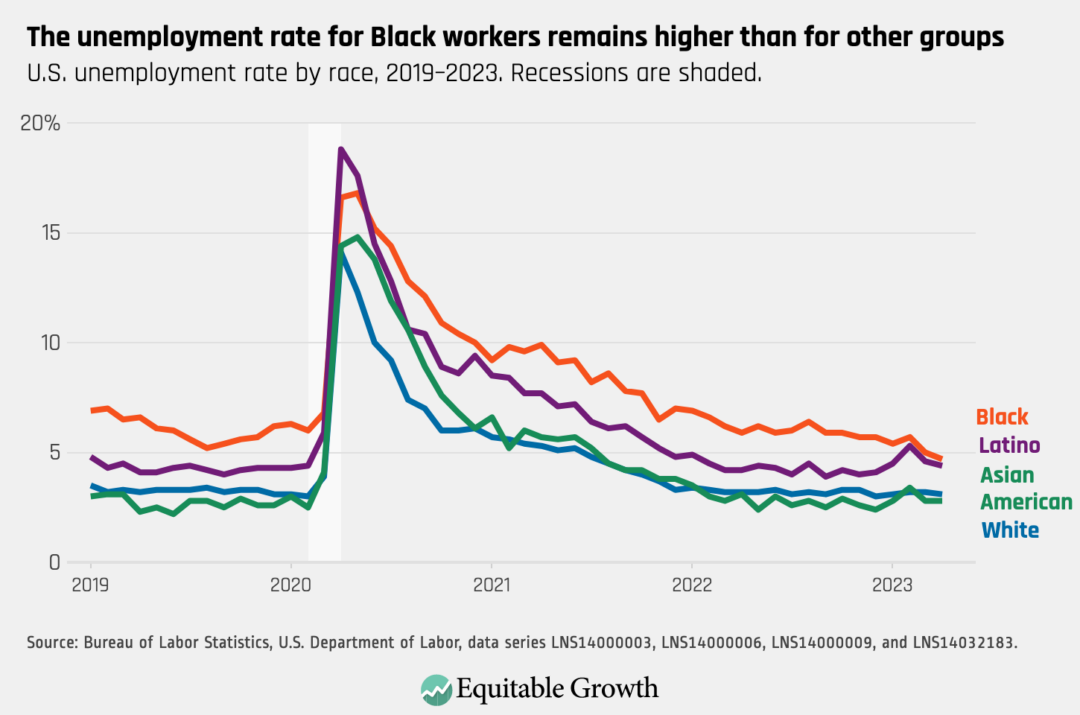
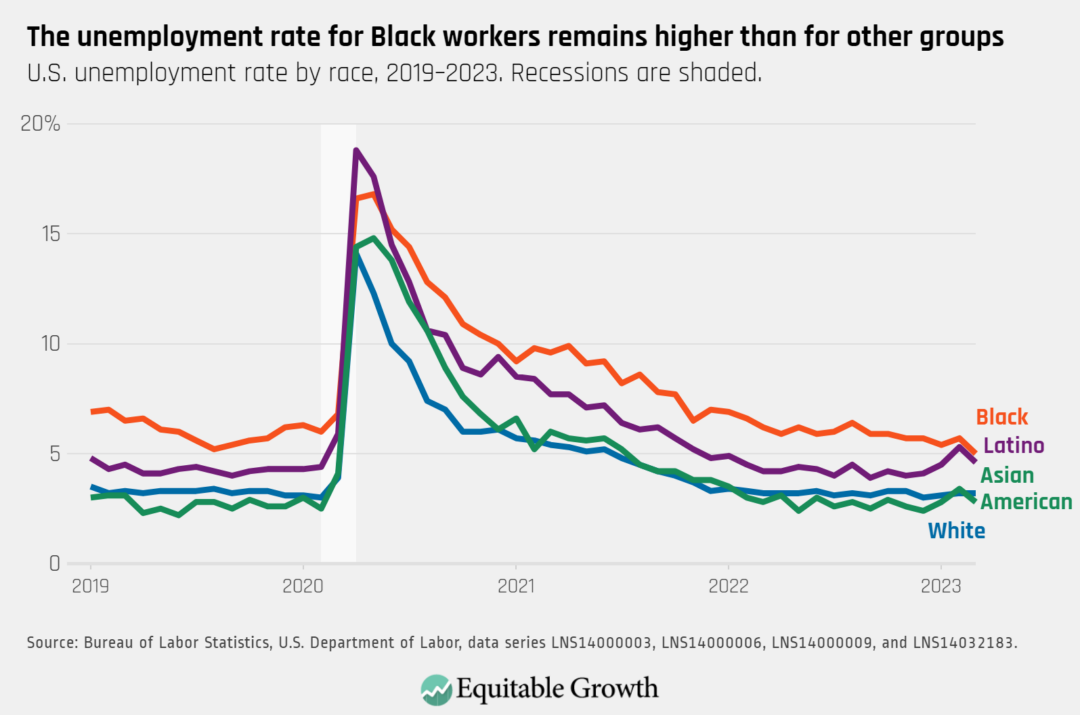
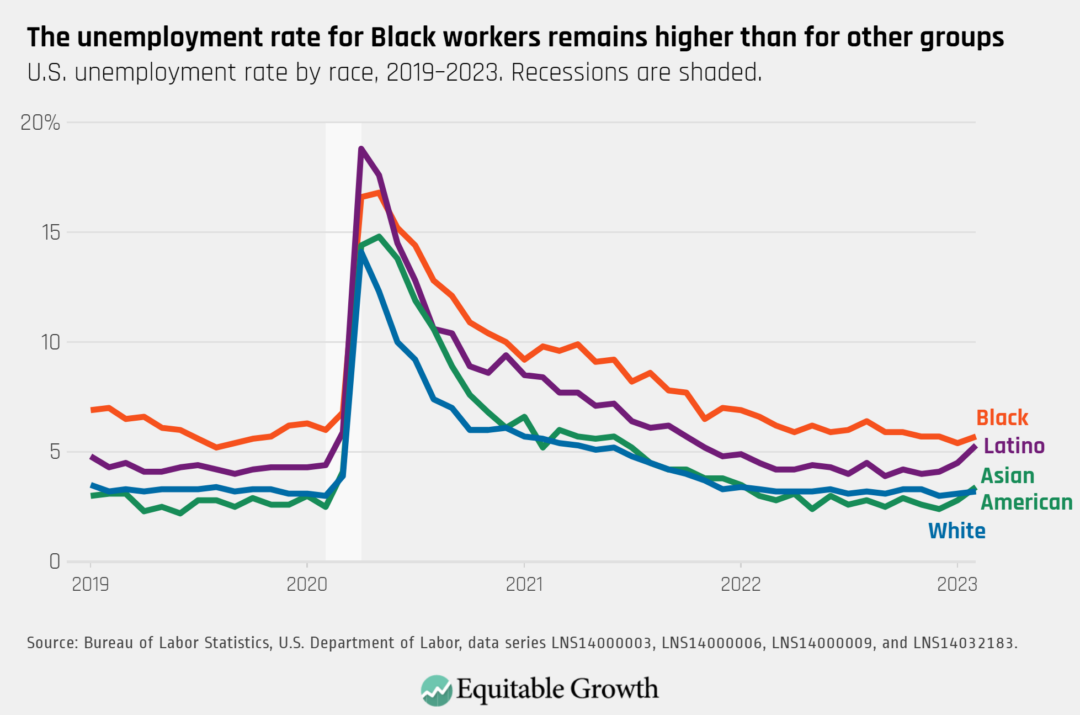
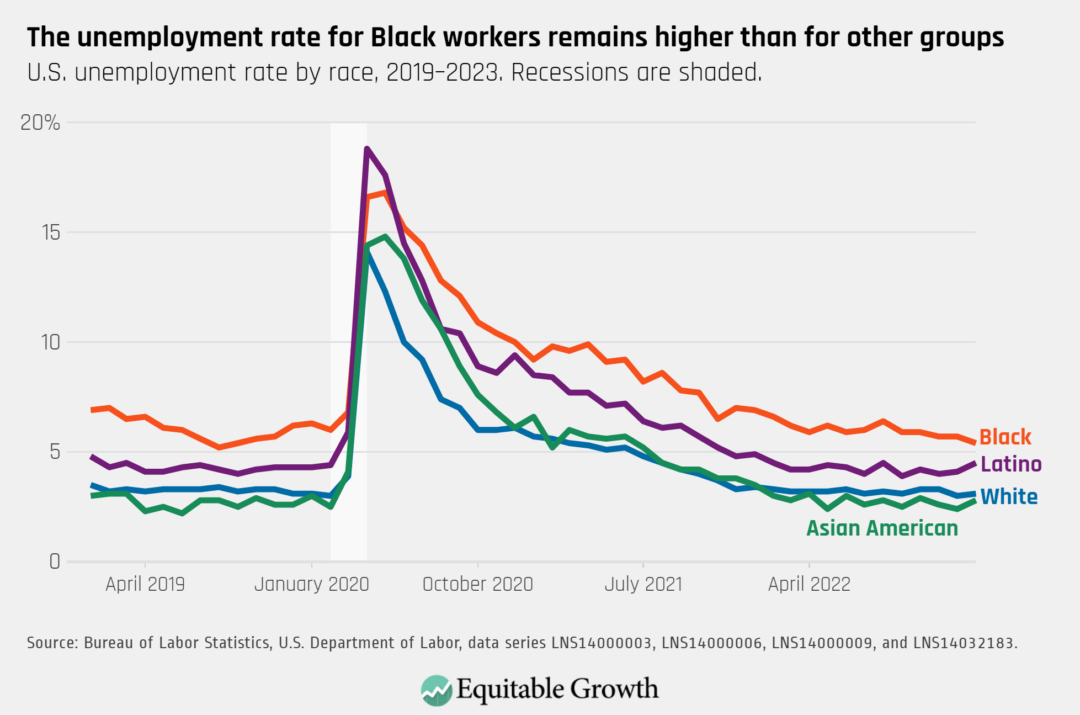
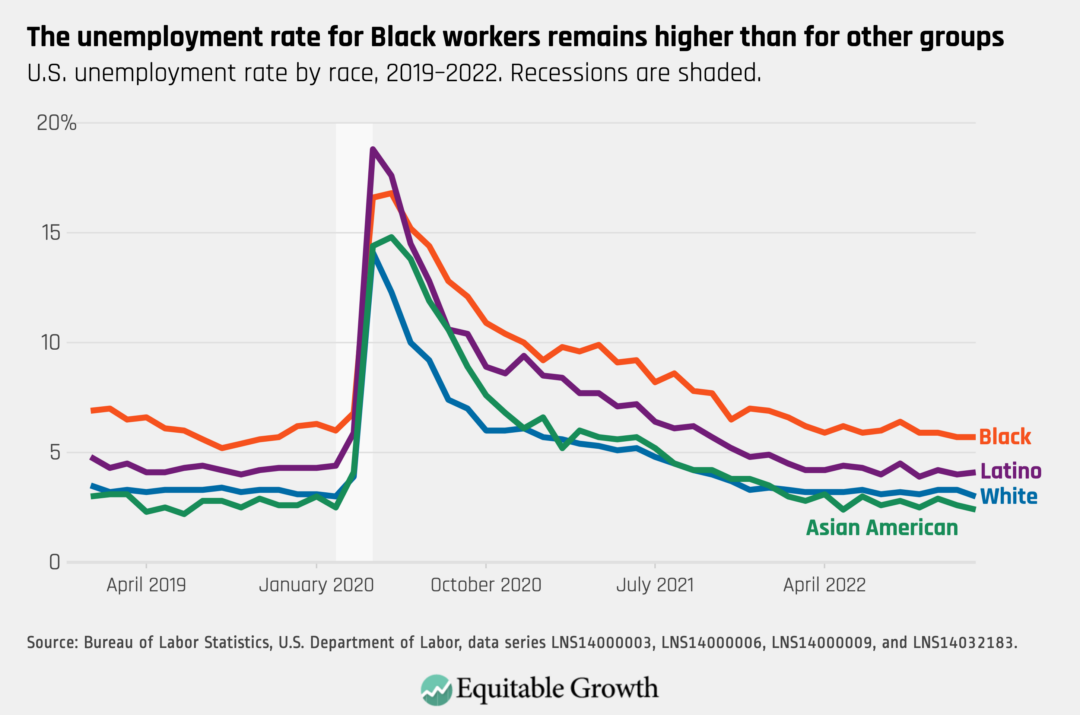
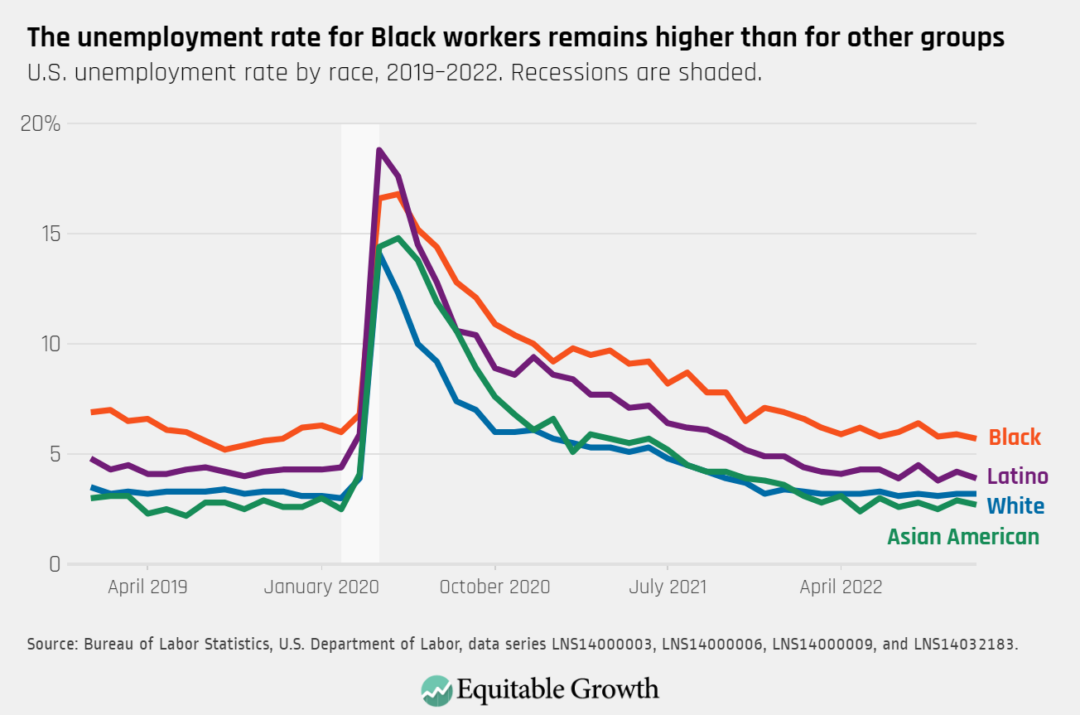
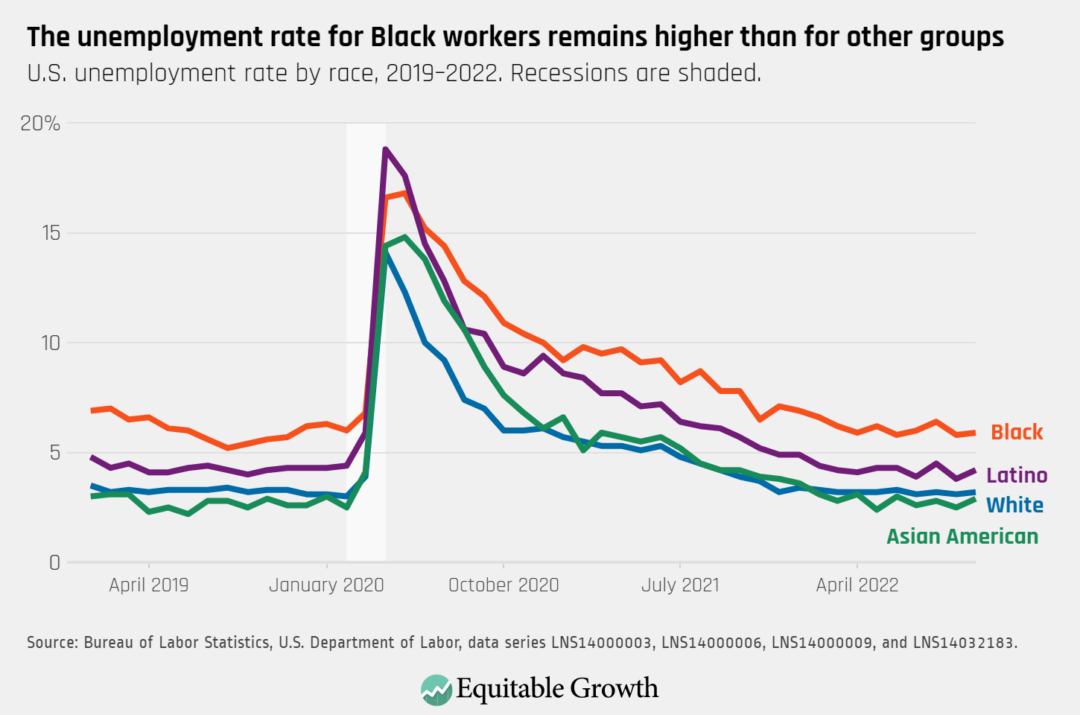
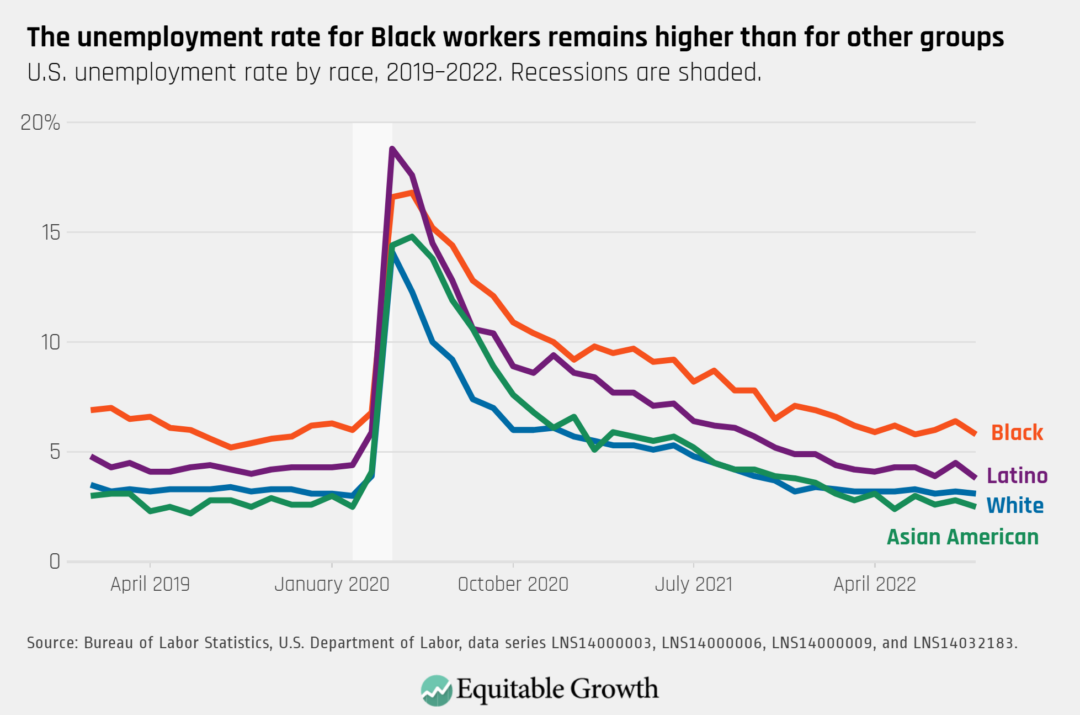
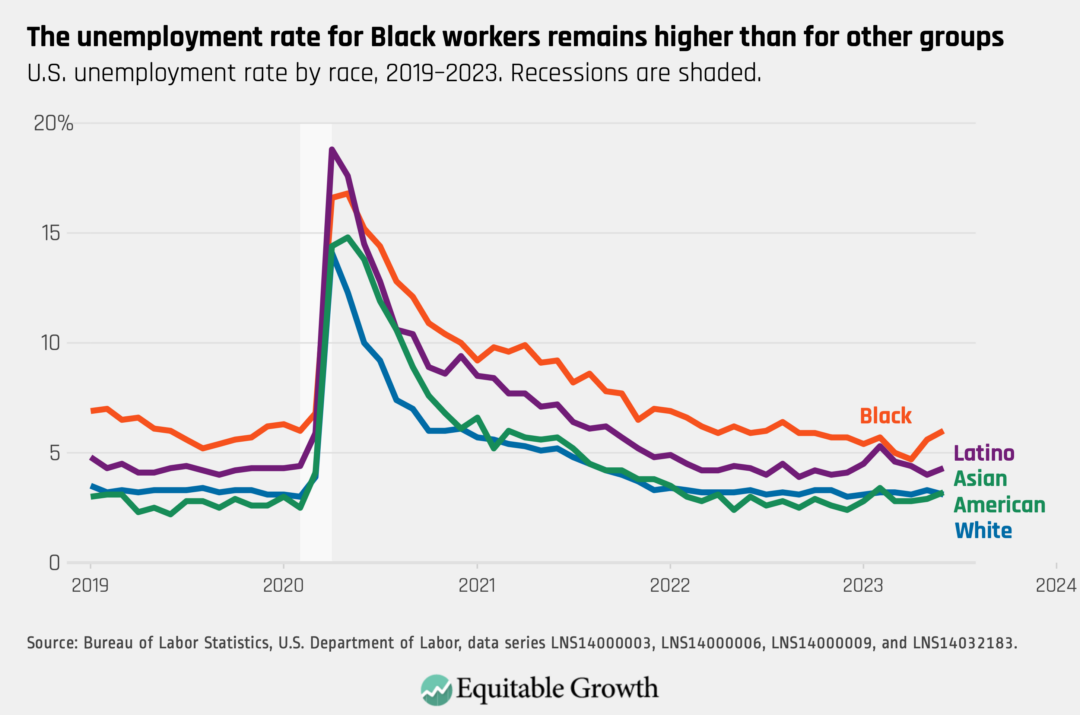
The national unemployment rate fell to 3.6 percent in June, with a decrease for White workers (3.1). Asian American workers (3.2), Black workers (6.0), and Latino workers (4.3) all experienced an uptick in their unemployment rate.

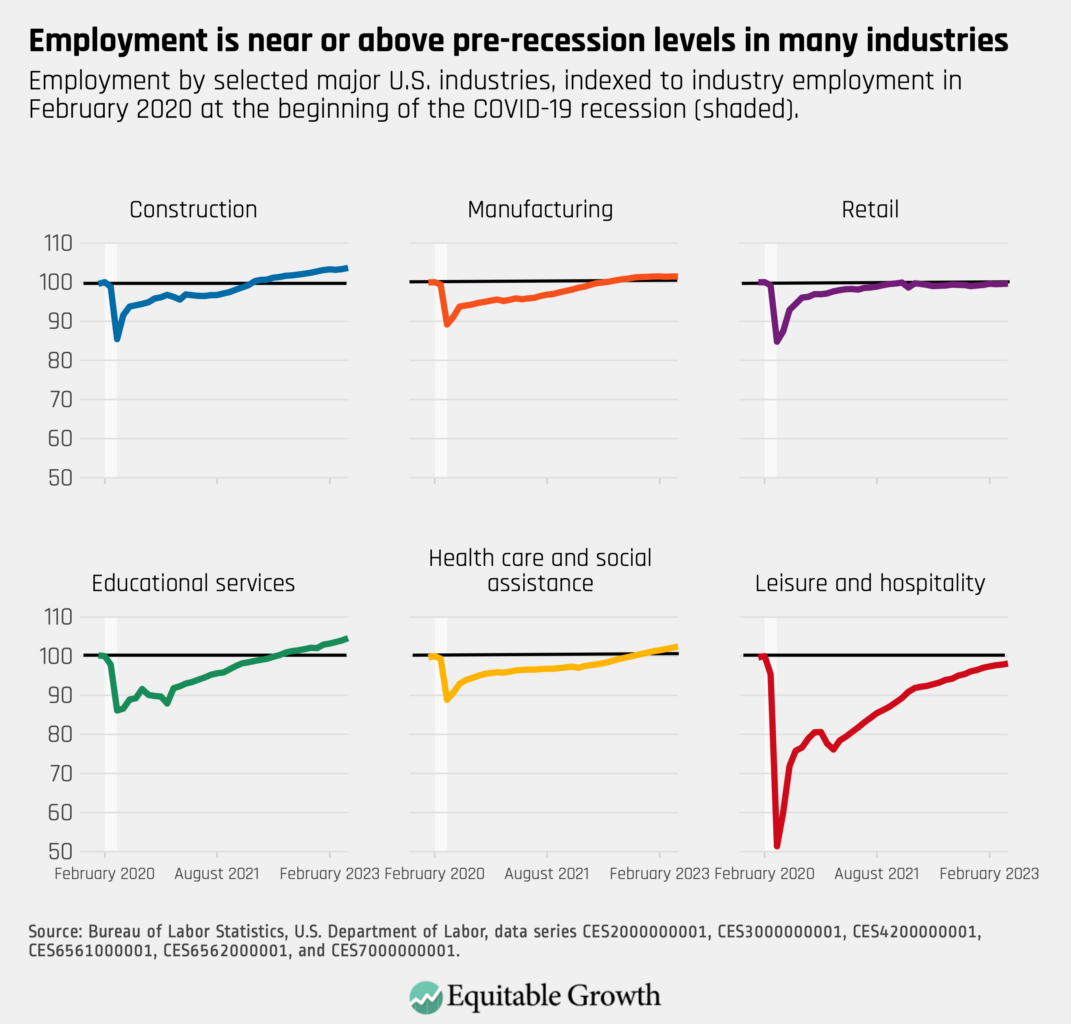
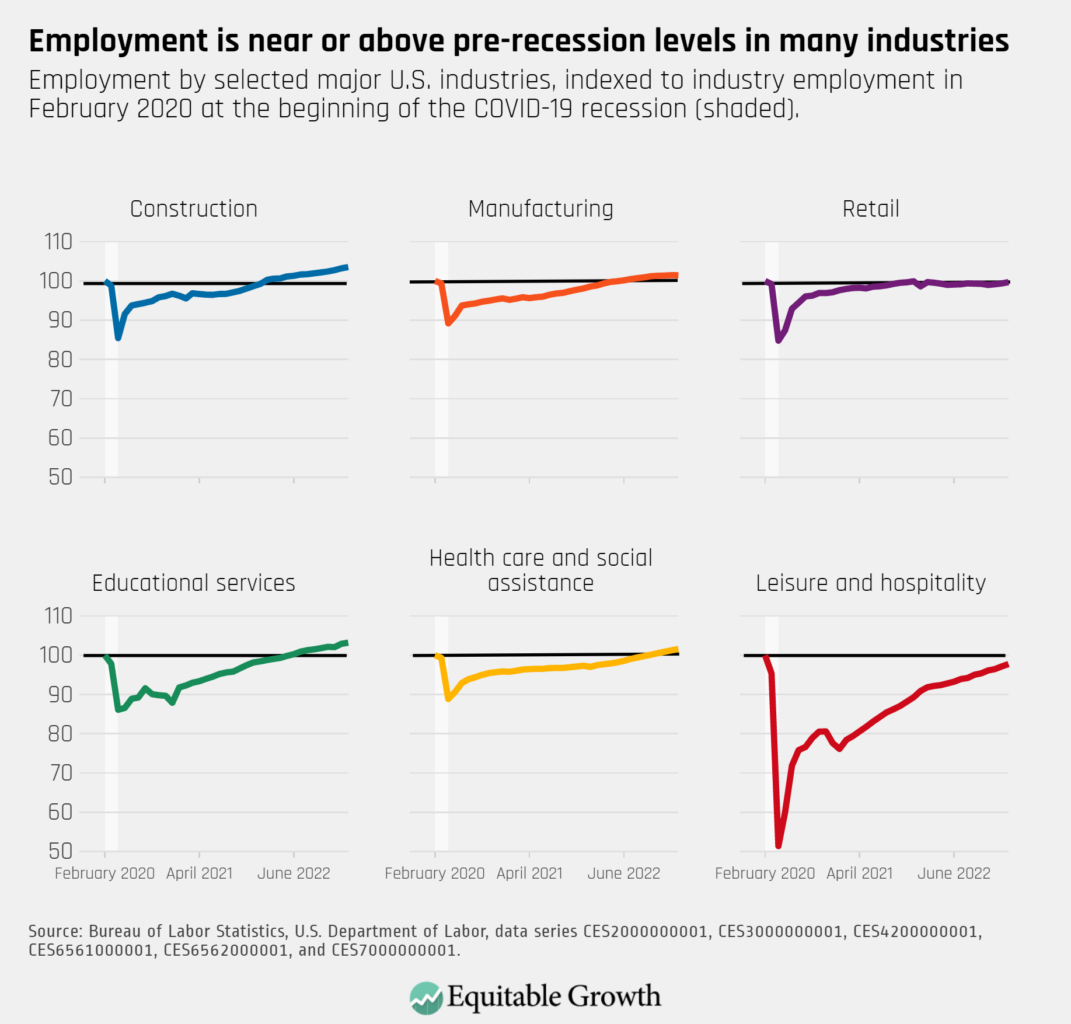
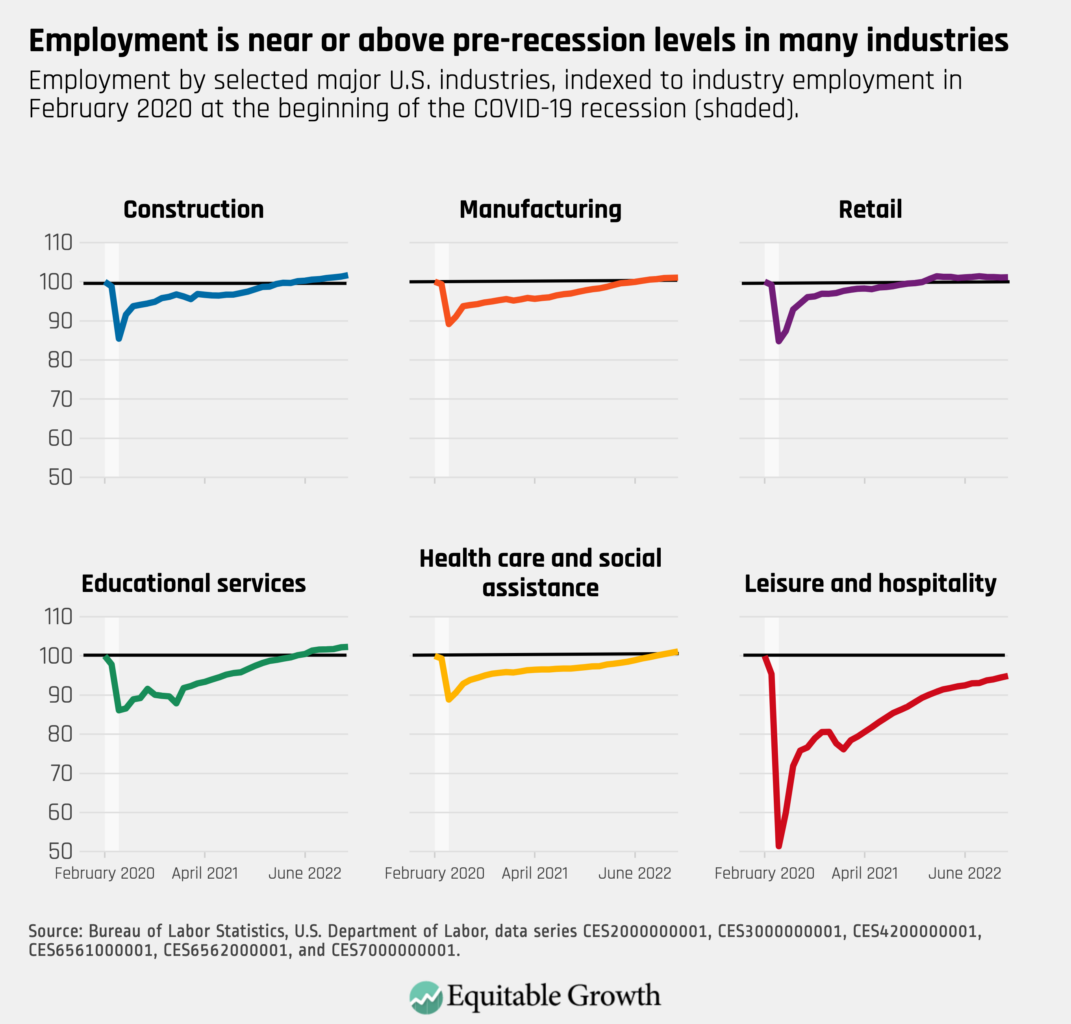
The U.S. economy experienced net employment losses in a few sectors, including retail and transportation and warehousing. Yet those losses were offset by important gains in industries such as construction, and the private education and health services sector, the latter of which added 73,000 jobs last month.

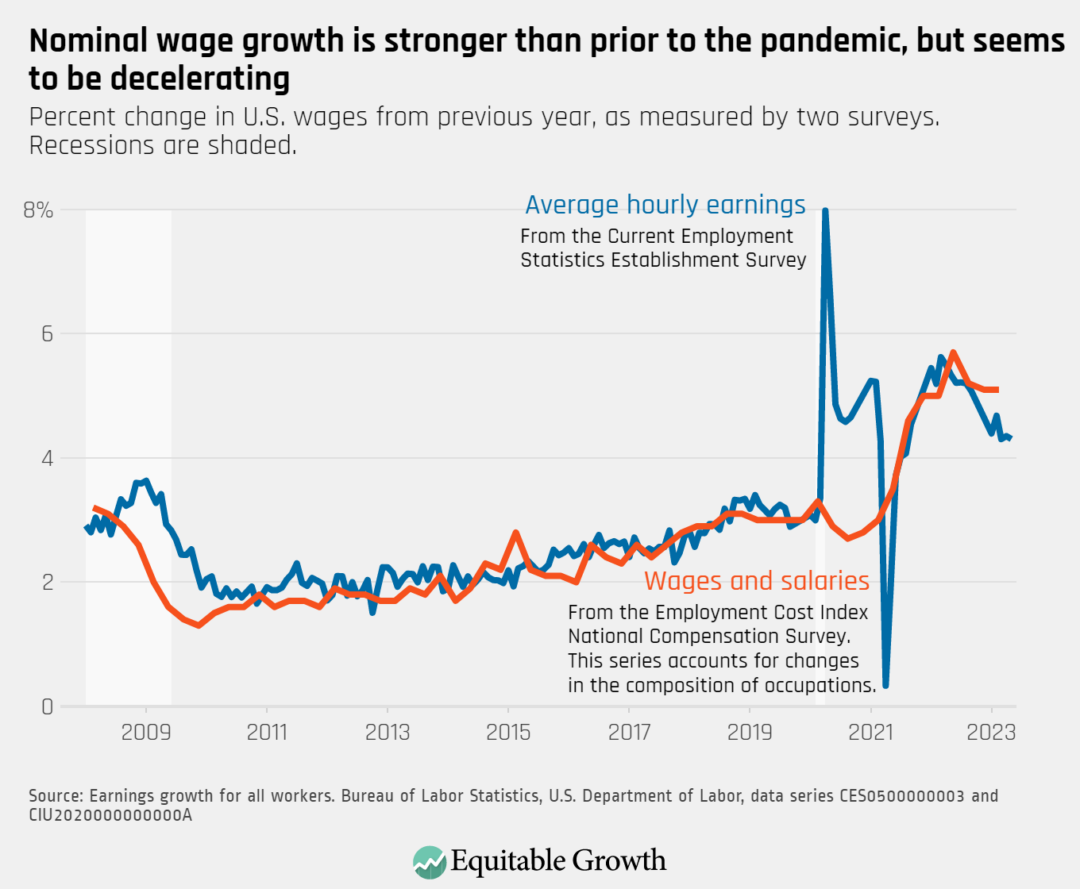
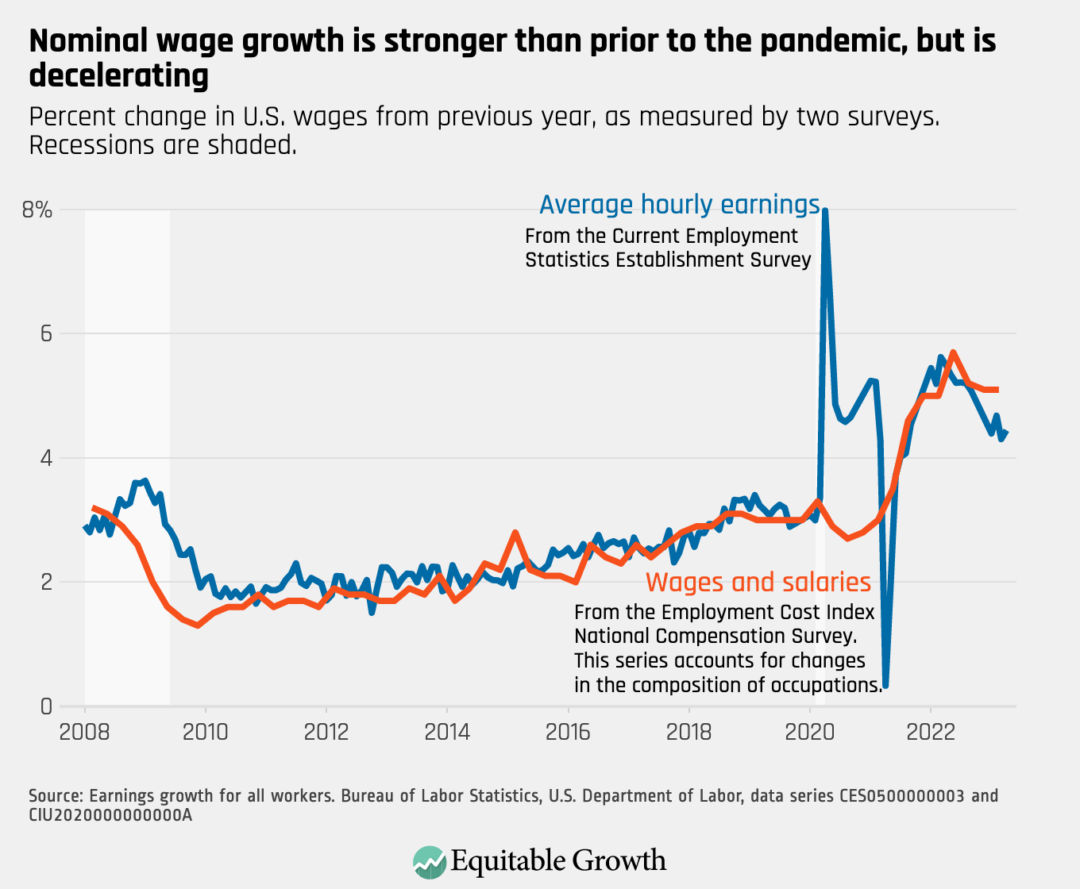
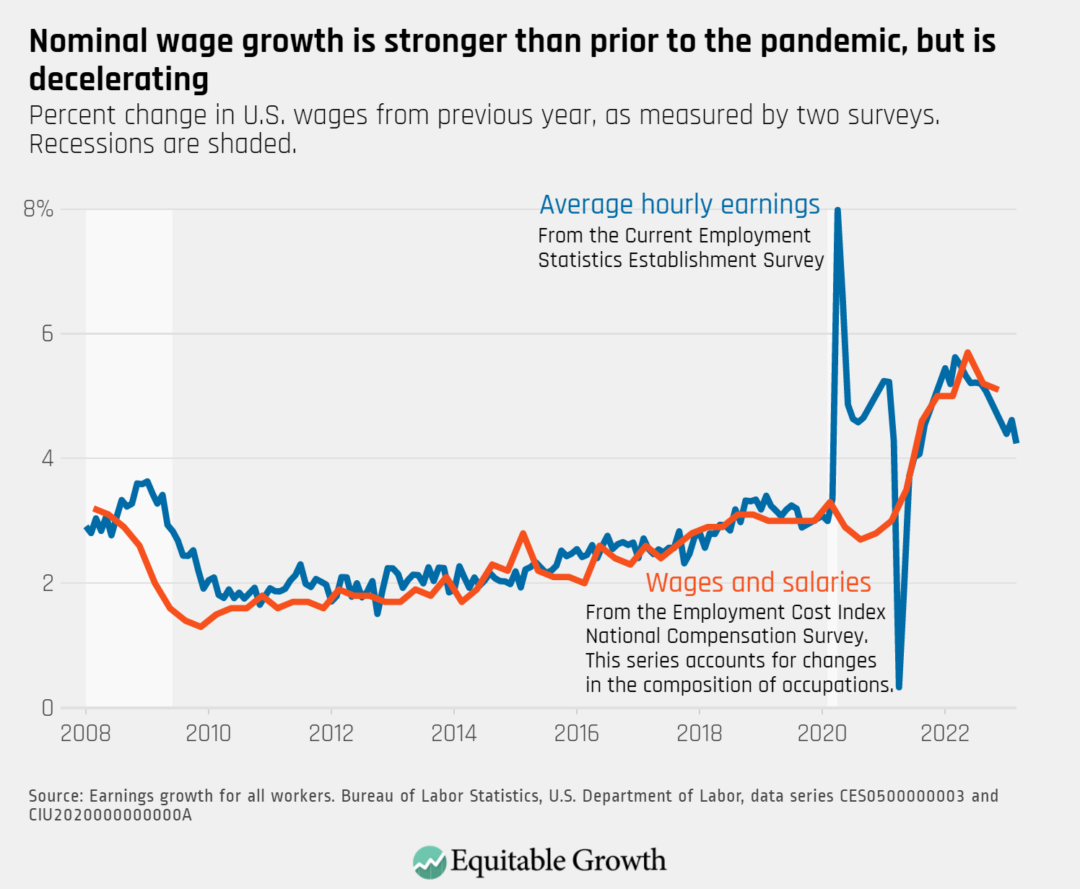
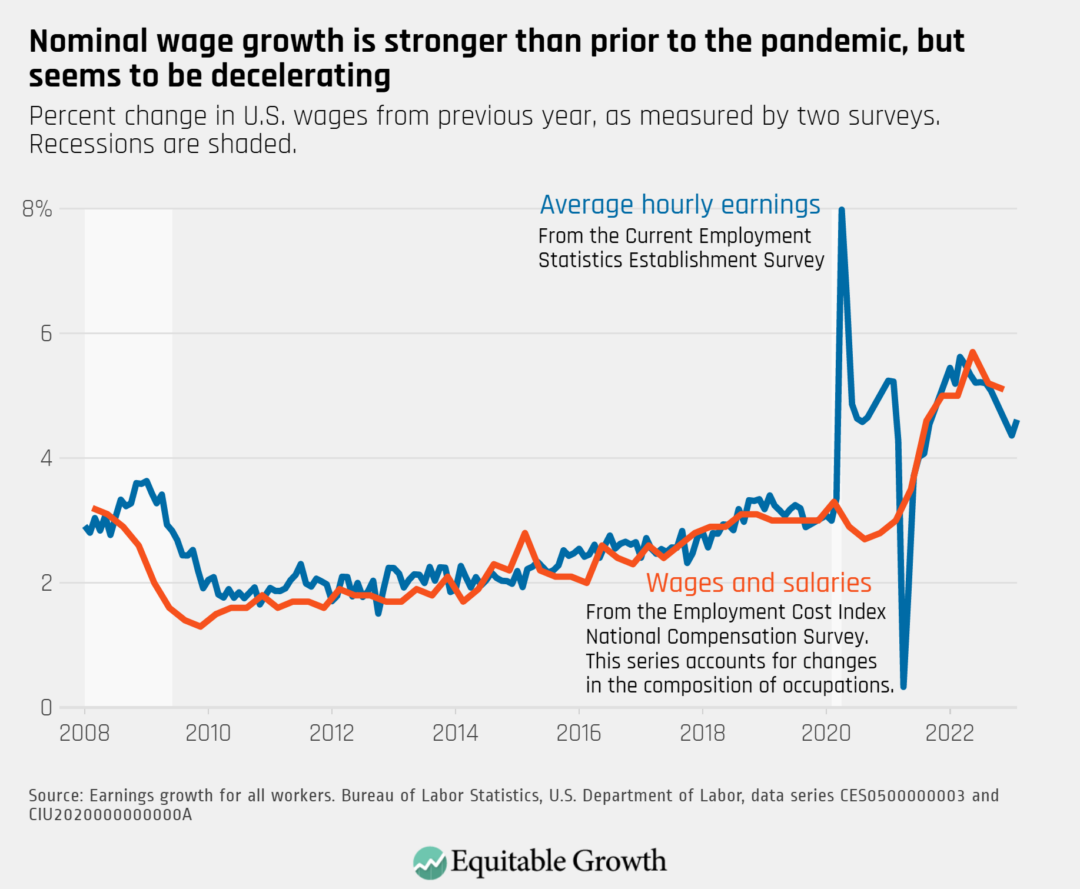
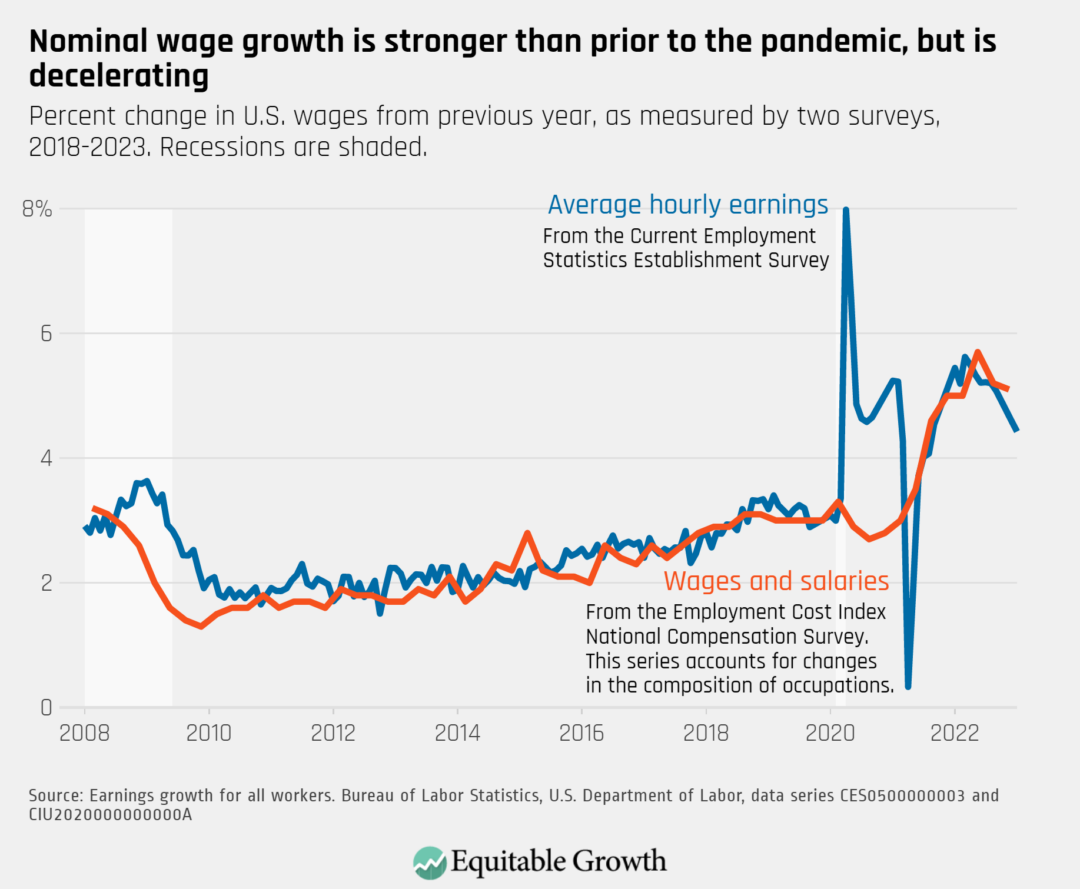
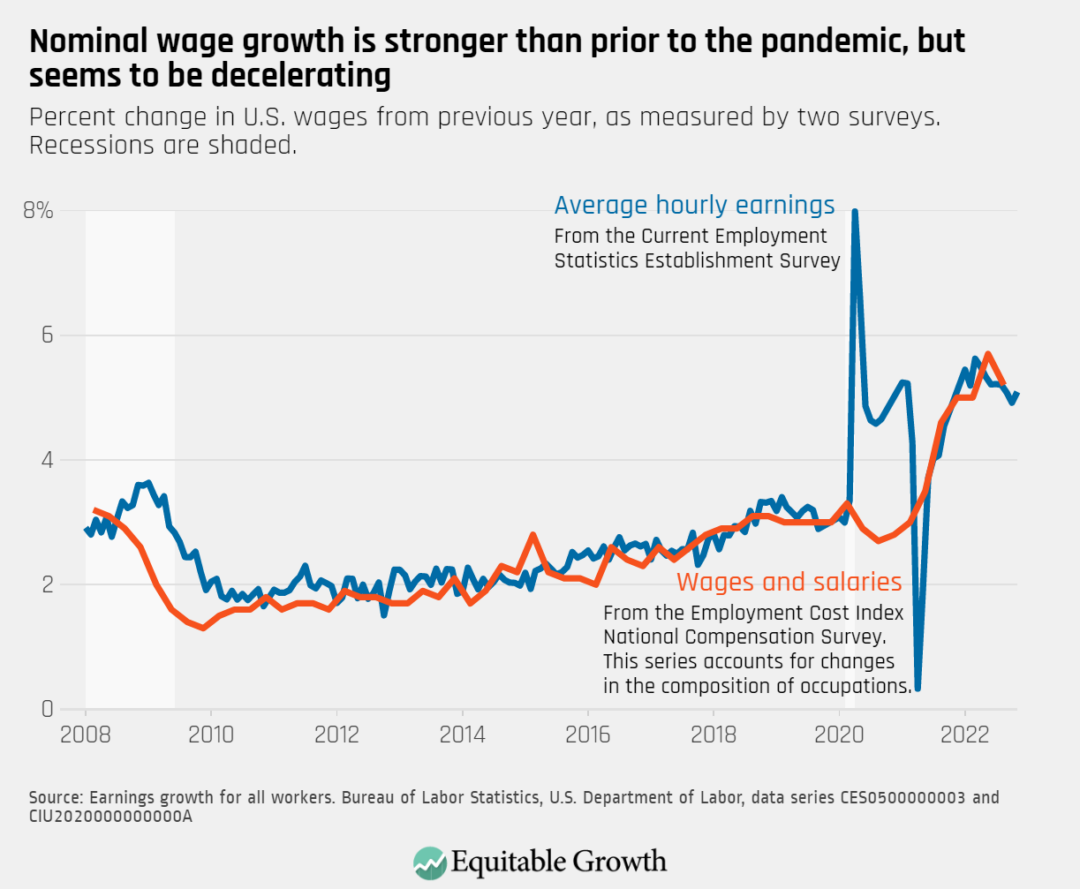
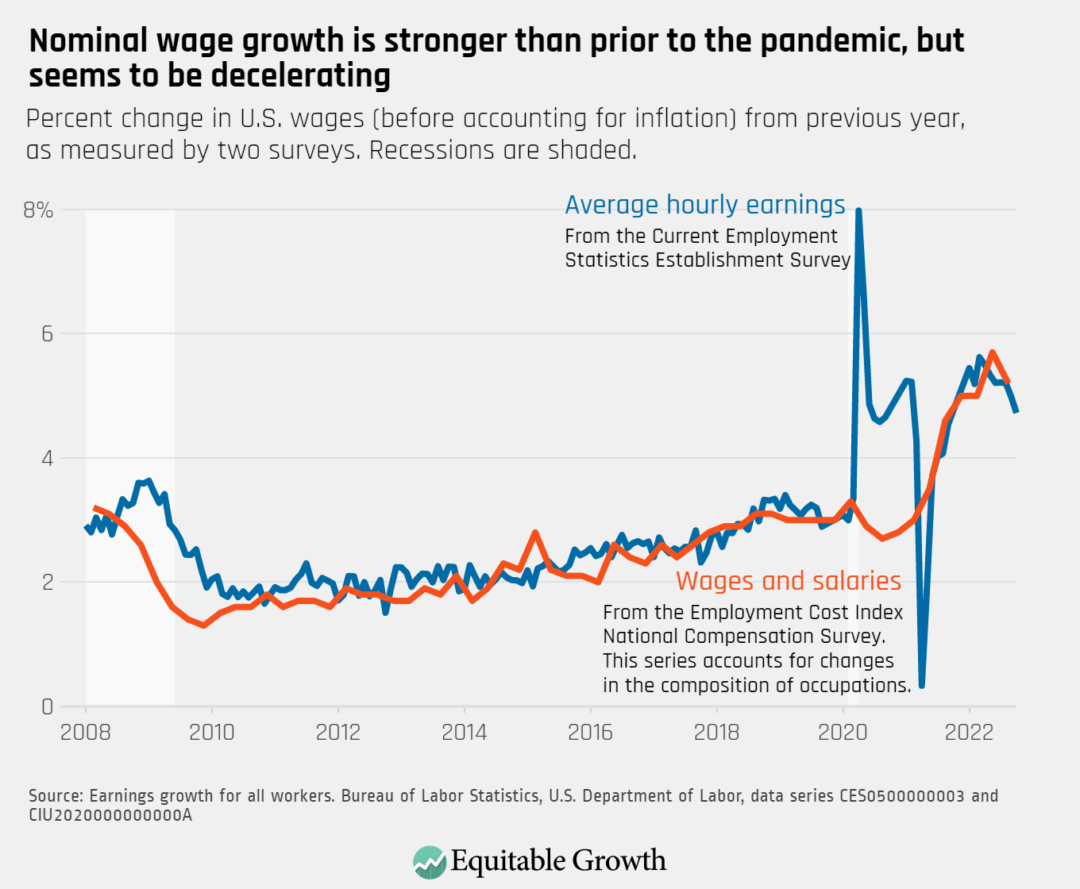
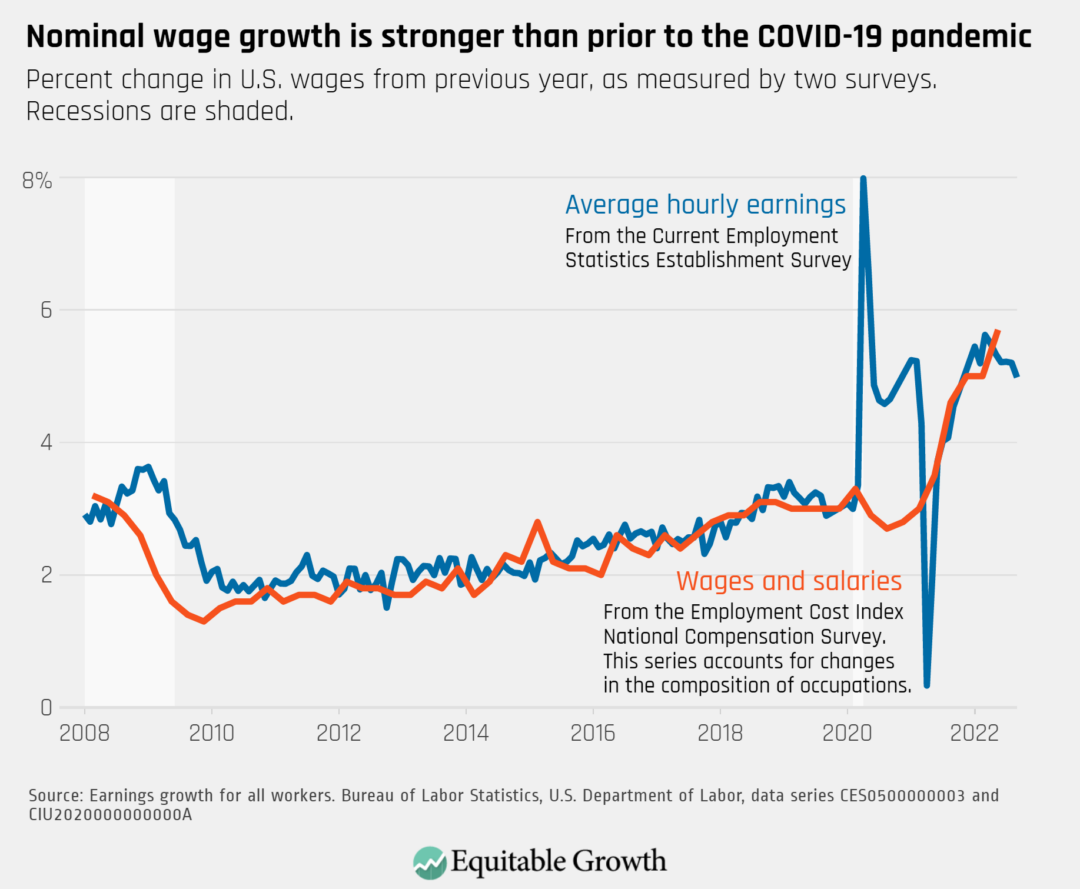
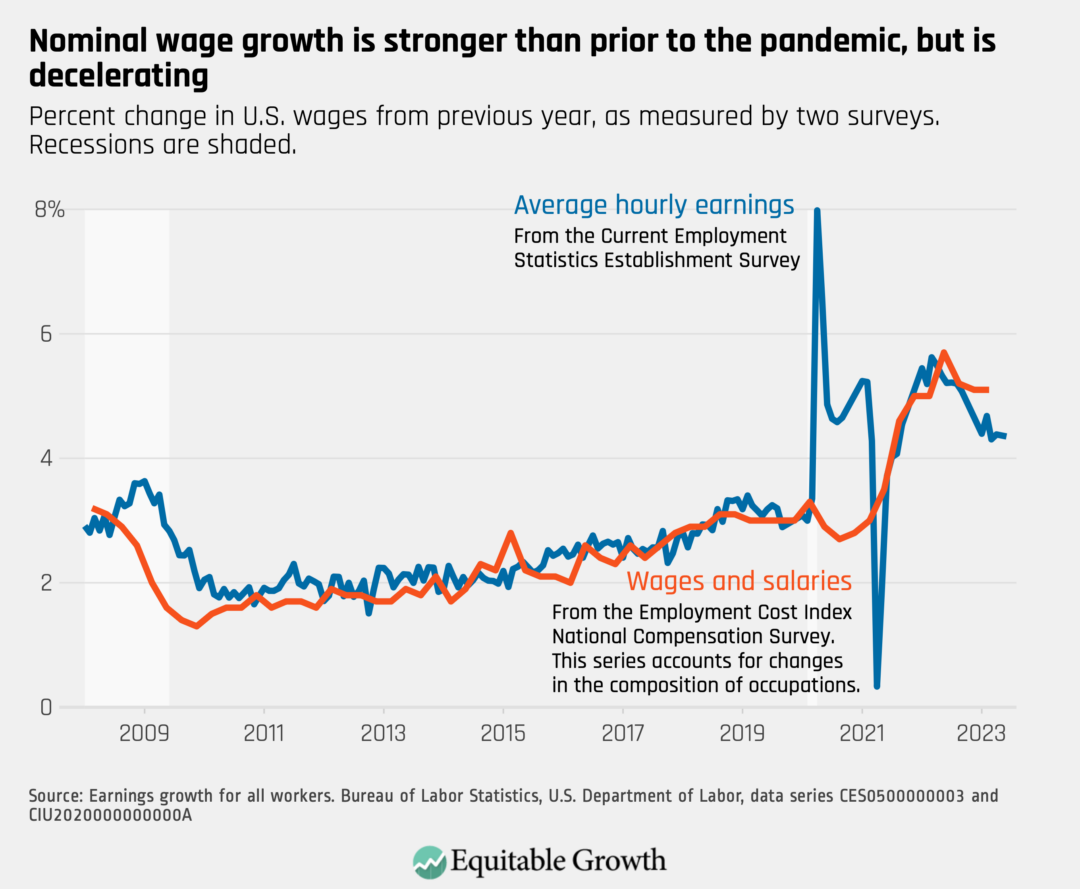
Year-over-year nominal wage growth (not accounting for inflation) remained unchanged in June, with average hourly earnings growth at 4.4 percent over the past 12 months.

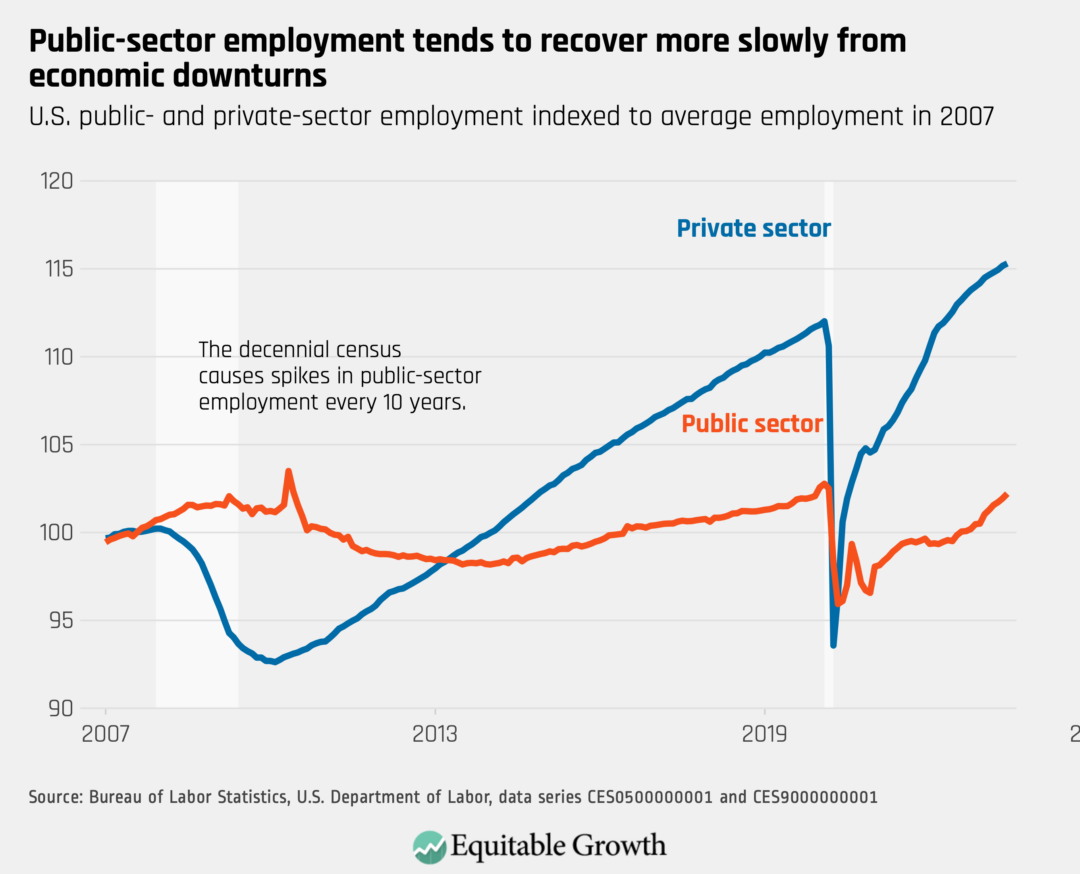
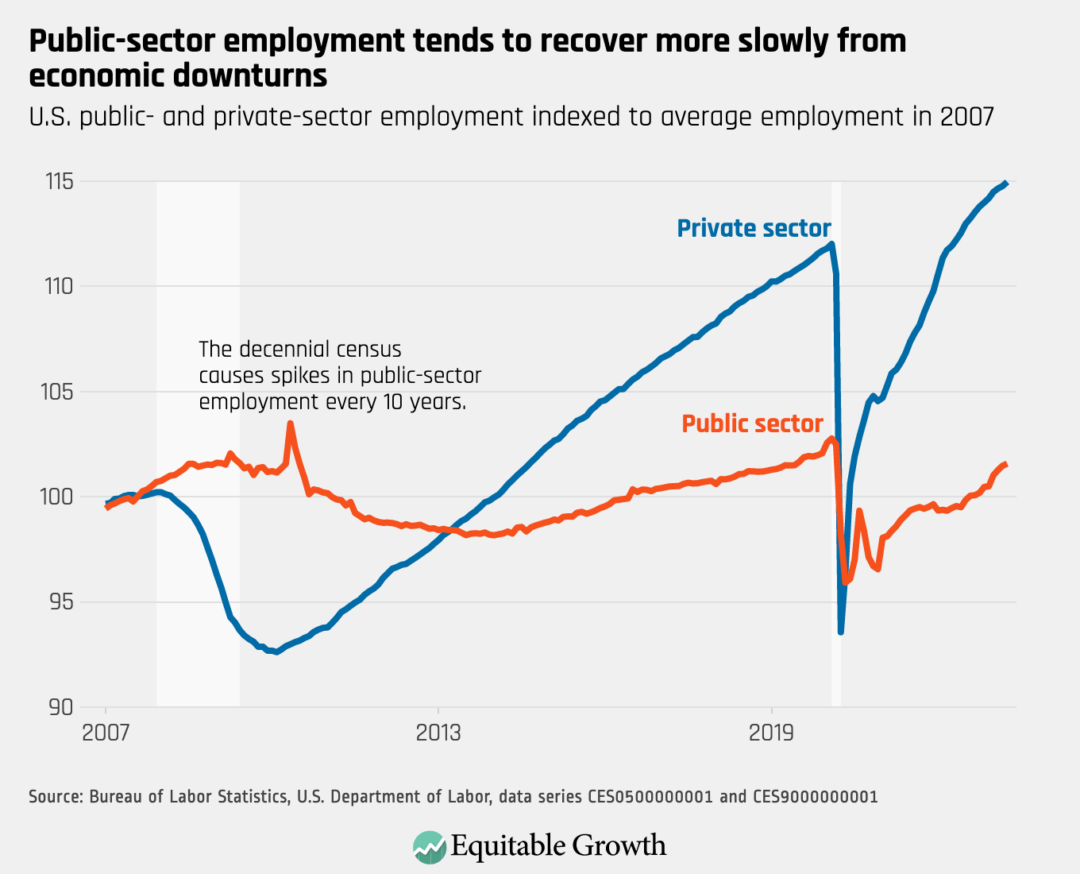
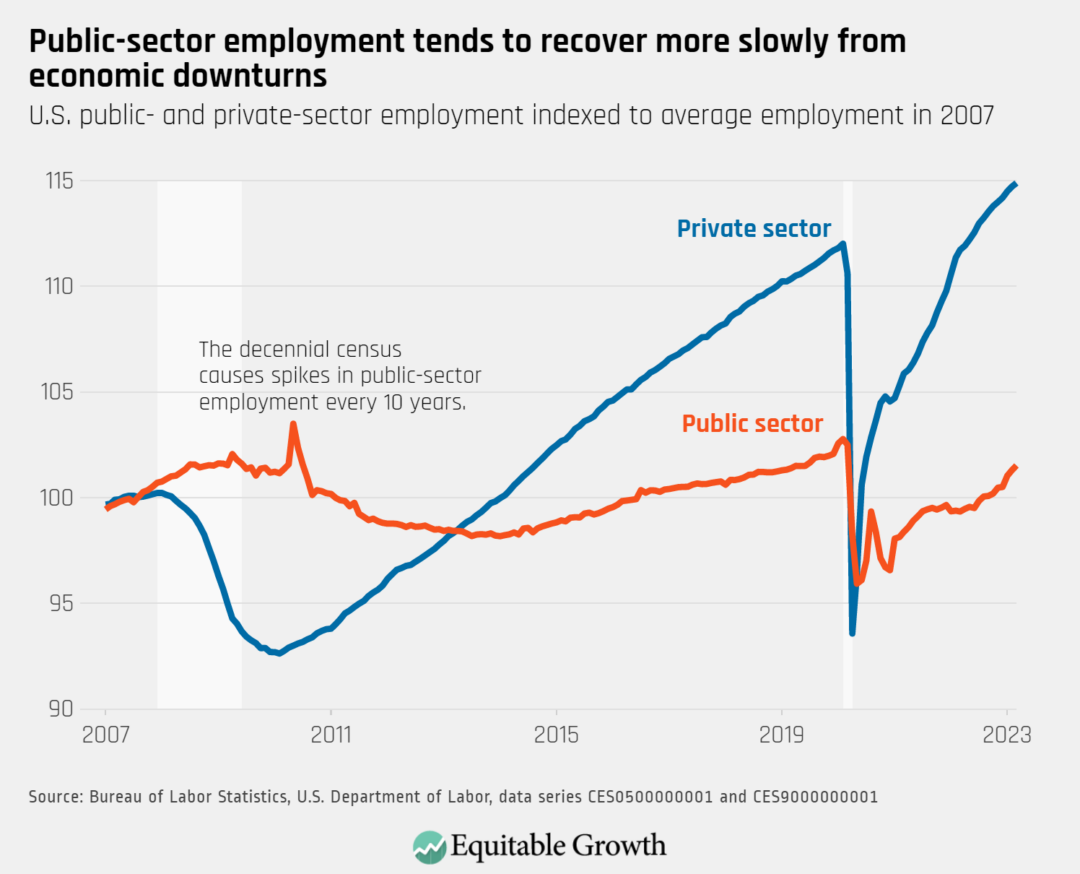
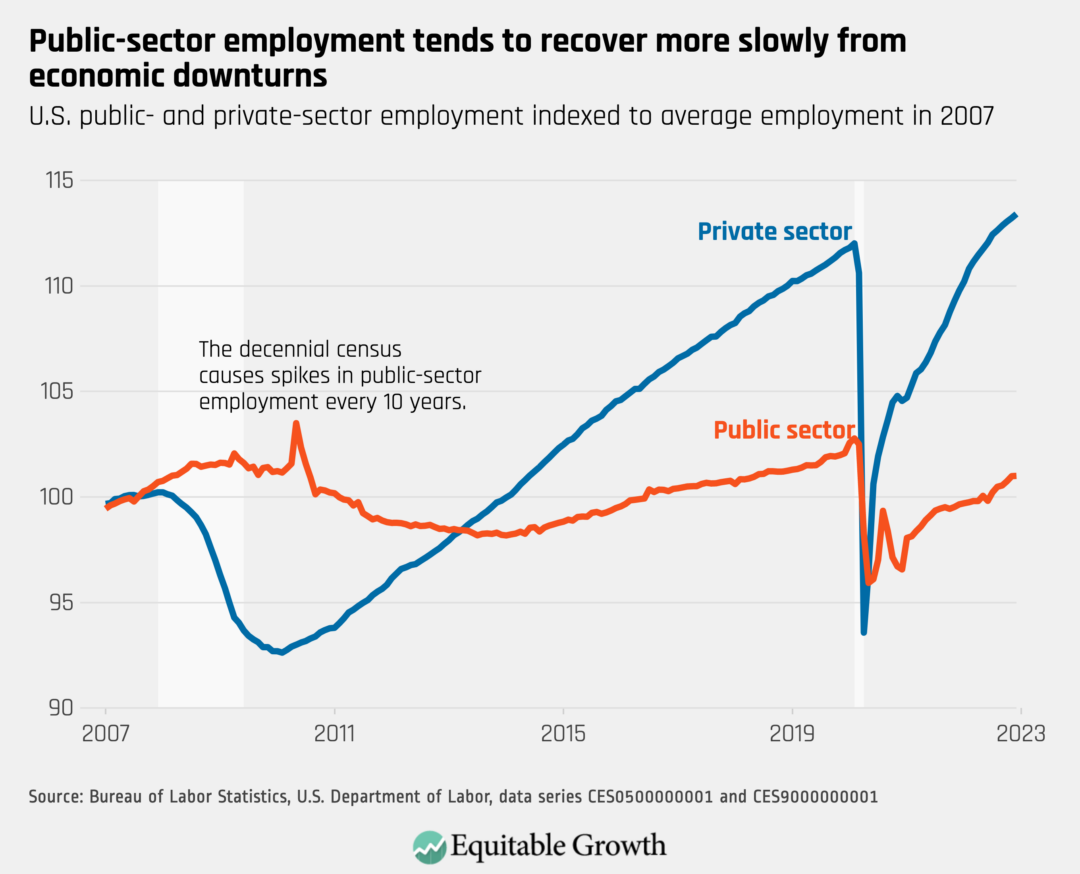
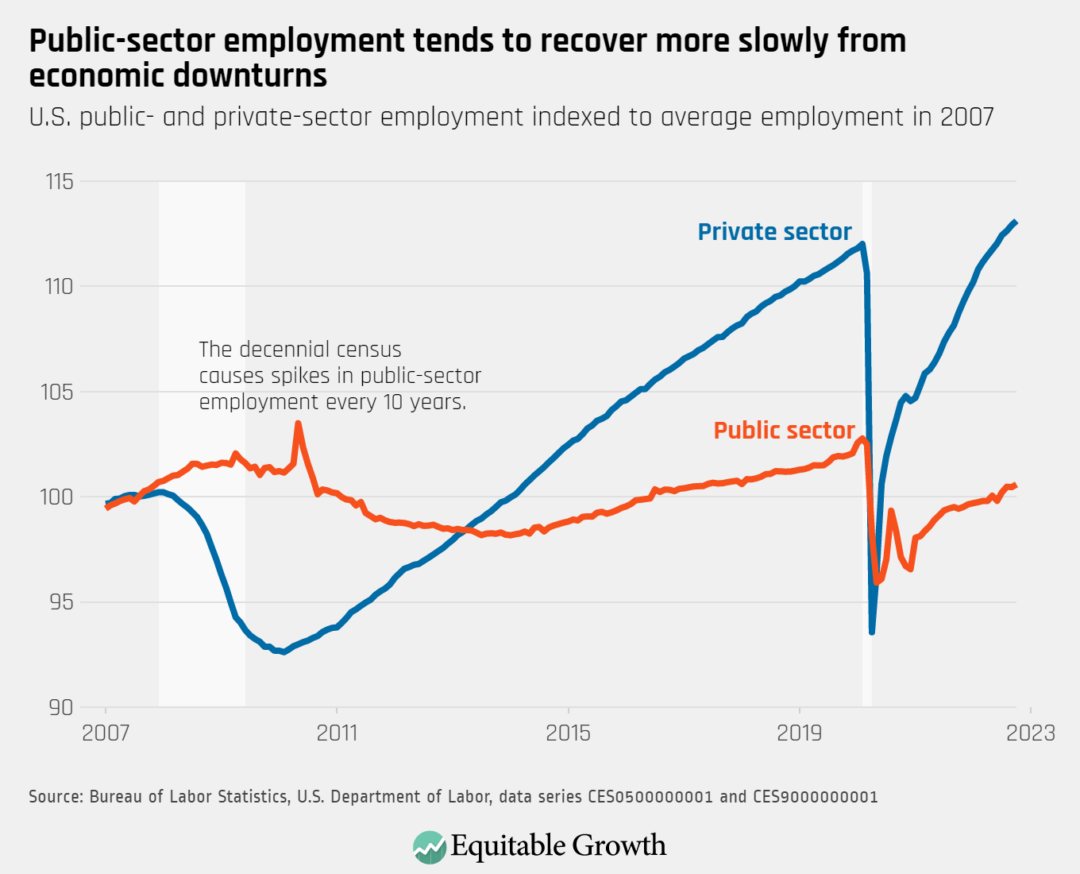
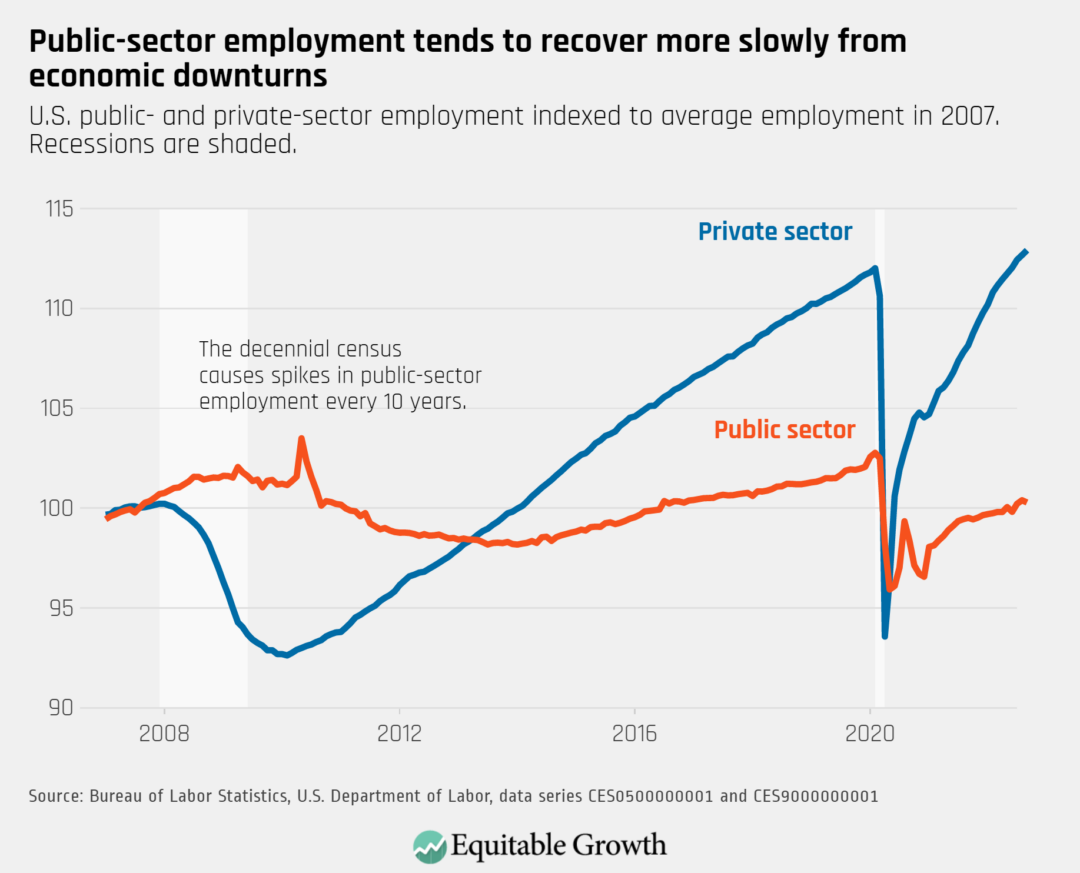
The U.S. public sector added 60,000 jobs last month. Unlike the private sector, however, public-sector employment has yet to fully recover from the COVID-19 recession.

Equitable Growth’s Jobs Day Graphs: May 2023 Report Edition

On June 2nd, the U.S. Bureau of Labor Statistics released new data on the U.S. labor market during the month of May. Below are five graphs compiled by Equitable Growth staff highlighting important trends in the data.

The U.S. labor market added 339,000 jobs last month, but the employment-rate for prime-age workers fell slightly from 80.8 percent in April to 80.7 percent in May.

Share of 25- to 54-year-olds who are employed, 2000-2023.

The national unemployment rate rose to 3.7 percent in May, with increases for White workers (3.3), Asian American workers (2.9), and Black workers (5.6). The jobless rate for Latino workers declined to 4 percent.

U.S. unemployment rate by race, 2019-2023.

Year-over-year nominal wage growth (not accounting for inflation) declined slightly in May, with average hourly earnings growth at 4.3 percent over the past 12 months.

Percent change in U.S. wages from previous year, as measured by two surveys.

Net job gains were particularly strong in private education and health services (+97,000) and professional business services (+64,000). The manufacturing and information industries reported net employment losses in May.

employment by selected major u.s. industries, indexed to industry employment in February 2020 at the beginning of the COVID-19 recession.

The unemployment rate for workers without a high school degree ticked up to 5.7 percent, and is consistently higher than for workers with high school (3.9 percent), some college (3.2), and a bachelor’s degree (2.1).

Unemployment rate by U.S. educational attainment, 2019-2023. Recessions are shaded.

Equitable Growth’s Jobs Day Graphs: April 2023 Report Edition

On May 5, the U.S. Bureau of Labor Statistics released new data on the U.S. labor market during the month of April. Below are five graphs compiled by Equitable Growth staff highlighting important trends in the data.

The employment rate for prime-age workers increased to 80.8 percent in April from 80.7 percent in March, with total nonfarm employment rising by 253,000.

Share of 25- to 54-year-olds who are employed, 2007–2023. Recessions are shaded.

Both public-sector and private-sector employment rose in April, though public-sector employment has recovered more slowly.

U.S. public- and private-sector employment indexed to average employment in 2007

The unemployment rate decreased slightly to 3.4 percent in April, with declines for Black workers (4.7 percent) and Latino workers (4.4 percent). The unemployment rate was 3.1 percent for White workers and 2.8 percent for Asian American workers.

U.S. unemployment rate by race, 2019–2023 Recessions are shaded.

Nominal wage growth (not accounting for inflation) did not change dramatically in April, with average hourly earnings growth at 4.4 percent over the past 12 months.

Percent change in U.S. wages from previous year, as measured by two surveys. Recessions are shaded.

The employment rate among adults age 16 and older decreased in April to 65.7 percent for men, and increased to 55.4 percent for women.

Share of the U.S. population that is employed, by gender, 2007–2023. Recessions are shaded.

Equitable Growth’s Jobs Day Graphs: March 2023 Report Edition

On April 7, the U.S. Bureau of Labor Statistics released new data on the U.S. labor market during the month of March. Below are five graphs compiled by Equitable Growth staff highlighting important trends in the data.

The employment rate for prime-age workers increased from 80.5 percent in February to 80.7 percent in March as total nonfarm employment rose by 236,000.

The unemployment rate declined slightly to 3.5 percent in March, and remains high for Black workers (5.0 percent) and Hispanic workers (4.6 percent) compared to White workers (3.2 percent) and Asian American workers (2.8 percent).

U.S. unemployment rate by race, 2019–2023. Recessions are shaded.

Both public-sector and private-sector employment rose in March, though public-sector employment has recovered more slowly and remains below pre-pandemic levels.

U.S. public- and private-sector employment indexed to average employment in 2007

Nominal wage growth (not accounting for inflation) declined in March, with average hourly earnings growth at 4.2 percent over the past 12 months, down from 4.6 percent in February.

Percent change in U.S. wages from previous year, as measured by two surveys. Recessions are shaded.

Top-line unemployment (known as U-3) and a broader measure of labor underutilization (known as U-6) declined slightly in March, as both overall unemployment and underemployment are around pre-pandemic levels.

U-3 and U-6 U.S. unemployment rates, 2000–2023. Recessions are shaded.

Equitable Growth’s Jobs Day Graphs: February 2023 Report Edition

On March 10, the U.S. Bureau of Labor Statistics released new data on the U.S. labor market during the month of February. Below are five graphs compiled by Equitable Growth staff highlighting important trends in the data.

The employment rate for prime-age workers increased from 80.2 percent in January to 80.5 percent in February as total nonfarm employment rose by 311,000.

Share of 25-to 54-year-olds who are employed, 2007–2023. Recessions are shaded.

The unemployment rate increased to 3.6 percent in February, and is highest for Black workers (5.7 percent) and Latino workers (5.3 percent), compared to White workers (3.2 percent) and Asian American workers (3.4 percent).

U.S. unemployment rate by race, 2019–2023. Recessions are shaded.

Nominal wage growth (not accounting for inflation) did not change dramatically in February, with average hourly earnings growth at 4.62 percent over the past 12 months.

Percent change in U.S. wages from previous year, as measured by two surveys. Recessions are shaded.

Employment in many sectors, including construction, retail, and educational services is now back to or surpassing pre-pandemic levels. Employment in leisure and hospitality has not quite recovered, but added 105,000 jobs in February.

Employment by selected major U.S. industries, indexed to industry employment in February 2020 at the beginning of the COVID-19 recession (shaded).

The share of unemployed workers who are unemployed due to job loss increased to 32.2 percent, and the share on temporary layoffs rose to 13.6 percent; the share who left their jobs (14.8 percent), are reentering the labor force (30.8 percent), or are new entrants (8.6 percent) declined.

Percent of all unemployed workers in the United States by reason for unemployment, 2019–2023

Equitable Growth’s Jobs Day Graphs: January 2023 Report Edition

On February 3, the U.S. Bureau of Labor Statistics released new data on the U.S. labor market during the month of January. Below are five graphs compiled by Equitable Growth staff highlighting important trends in the data.

The employment rate of prime-age workers increased slightly from 80.1 percent in December to 80.2 percent in January.

Share of 25- to 54-year-olds who are employed, 2007–2023. Recessions are shaded.

The unemployment rate of Black workers has been trending downward over the past few months, while the unemployment rates for other groups has been largely unchanged.

U.S. unemployment rate by race, 2019–2023. Recessions are shaded.

Wage growth has continued to decelerate, easing fears that the labor market is overheating.

Percent change in U.S. wages from previous year, as measured by two surveys. Recessions are shaded.

The employment rate for women workers increased at a greater rate then men in January as both hover just below their pre-pandemic levels. 

Share of the U.S. population that is employed, by gender, 2007–2023. Recessions are shaded

An increasing proportion of unemployment workers have voluntarily left their jobs or reentered the labor force in the prior month.

Percent of all unemployed workers in the United States by reason for unemployment, 2019–2023

Equitable Growth’s Jobs Day Graphs: December 2022 Report Edition

On January 6 the U.S. Bureau of Labor Statistics released new data on the U.S. labor market during the month of December. Below are five graphs compiled by Equitable Growth staff highlighting important trends in the data.

The employment rate for prime-age workers increased from 79.7 percent in November to 80.1 percent in December as total nonfarm employment rose by 223,000.

Share of 25- to 54-year-olds who are employed, 2007-2022. Recessions are shaded.

Private-sector employment continued to rise in December, while public-sector employment has recovered more slowly and remains below pre-pandemic levels.

U.S. public- and private-sector employment indexed to average employment in 2007

The unemployment rate decreased to 3.5 percent in December and remains higher for Black workers (5.7 percent) and Latino workers (4.1 percent), compared to White workers (3.0 percent) and Asian American workers (2.4 percent).

U.S. unemployment rate by race, 2019-2022. Recessions are shaded.

Involuntary part-time work, which represents part-time workers who would prefer full-time work, increased in December, but remains low relative to levels over the past five years.

Percent change in voluntary and involuntary part-time U.S. employment compared to January 2018

Employment in many sectors is now back to or surpassing pre-pandemic levels, including construction, retail, and educational services. Employment in leisure and hospitality has yet to recover despite rising by 67,000 jobs in December.

Employment by selected major U.S. industries, indexed to industry employment in February 2020 at the beginning of the COVID-19 recession (shaded).

Equitable Growth’s Jobs Day Graphs: November 2022 Report Edition

On December 2 the U.S. Bureau of Labor Statistics released new data on the U.S. labor market during the month of November. Below are five graphs compiled by Equitable Growth staff highlighting important trends in the data.

The employment rate for prime-age workers decreased slightly from 79.8 percent in October to 79.7 percent in November 2022 as total nonfarm employment rose by 263,000.

Share of 25- to 54-year-olds who are employed, 2007–2022. Recessions are shaded.

The unemployment rate stayed at 3.7 percent in November and remains high for Black workers (5.7 percent), compared to other groups. The unemployment rate is 3.9 percent for Latino workers, 3.2 percent for White workers, and 2.7 percent for Asian American workers.

U.S. unemployment rate by race, 2019–2022. Recessions are shaded.

The unemployment rate fell to 4.4 percent for workers with less than a high school degree and remained near 3.9 percent for high school graduates. Rates increased slightly to 3.2 percent for workers with some college and 2 percent for college graduates.

Unemployment rate by U.S. educational attainment, 2019–2022. Recessions are shaded.

Nominal wage growth (not accounting for inflation) increased slightly in November, with average hourly earnings growth at 5.1 percent over the past 12 months.

Percent change in U.S. wages from previous year, as measured by two surveys. Recessions are shaded.

The share of unemployed workers who are unemployed due to job loss rose to 33 percent, and 13.4 percent are on temporary layoff; the share who left their job (13.9 percent) or are reentering the labor force (30.2 percent) declined, while new entrants rose (9.4 percent).

Equitable Growth’s Jobs Day Graphs: October 2022 Report Edition

On November 4, the U.S. Bureau of Labor Statistics released new data on the U.S. labor market during the month of October. Below are five graphs compiled by Equitable Growth staff highlighting important trends in the data.

Job growth declined in October, with the prime-age employment rate falling to 79.8 percent and below 80 percent for the first time since June.

Share of 25- to 54-year-olds who are employed, 2007–2022. Recessions are shaded.

The unemployment rate increased for almost all major demographic groups, with the biggest increases for women and Hispanic workers.

U.S. unemployment rate by race, 2019–2022. Recessions are shaded.

Public sector employment still lags in the recovery, with private sector employment above its pre-pandemic levels.

U.S. public- and private-sector employment indexed to average employment in 2007

Wage growth decelerated in October, further demonstrating a lack of evidence that wage pressure is a primary cause of continuing inflation

Percent change in U.S. wages from previous year, as measured by two surveys. Recessions are shaded.

Employment rates decreased for women and men in October, but slightly more so for women as unemployment levels increased and almost 200,000 dropped out of the labor force.

Share of the U.S. population that is employed, by gender, 2007–2022. Recessions are shaded.

Equitable Growth’s Jobs Day Graphs: September 2022 Report Edition

On October 7, the U.S. Bureau of Labor Statistics released new data on the U.S. labor market during the month of September. Below are five graphs compiled by Equitable Growth staff highlighting important trends in the data.

The employment rate for prime-age workers declined to 80.2 percent in September 2022 from 80.3 percent in August, with total nonfarm employment rising by 263,000.

Share of 25- to 54-year-olds who are employed, 2007–2022. Recessions are shaded.

The unemployment rate decreased to 3.5 percent in September and remains higher for Black workers (5.8 percent) and Latino workers (3.8 percent), compared to White workers (3.1 percent) and Asian American workers (2.5 percent).

U.S. unemployment rate by race, 2019–2022. Recessions are shaded.

Private-sector employment continued to rise in September, while public-sector employment declined slightly and remains below pre-pandemic levels.

U.S. public- and private-sector employment indexed to average employment in 2007

Nominal wage growth (not accounting for inflation) cooled in September, with average hourly earnings growth at 5 percent over the past 12 months.

Percent change in U.S. wages from previous year, as measured by two surveys. Recessions are shaded.

The number of unemployed workers decreased in September. The share who are unemployed due to job loss fell to 30.5 percent, and 13.3 percent have been temporarily laid off; 15.9 percent left their jobs, 32.4 percent are re-entering the labor force, and 7.9 percent are new entrants.

Percent of all unemployed workers in the United States by reason for unemployment, 2019–2022