Equitable Growth’s Jobs Day Graphs: November 2022 Report Edition
On December 2 the U.S. Bureau of Labor Statistics released new data on the U.S. labor market during the month of November. Below are five graphs compiled by Equitable Growth staff highlighting important trends in the data.
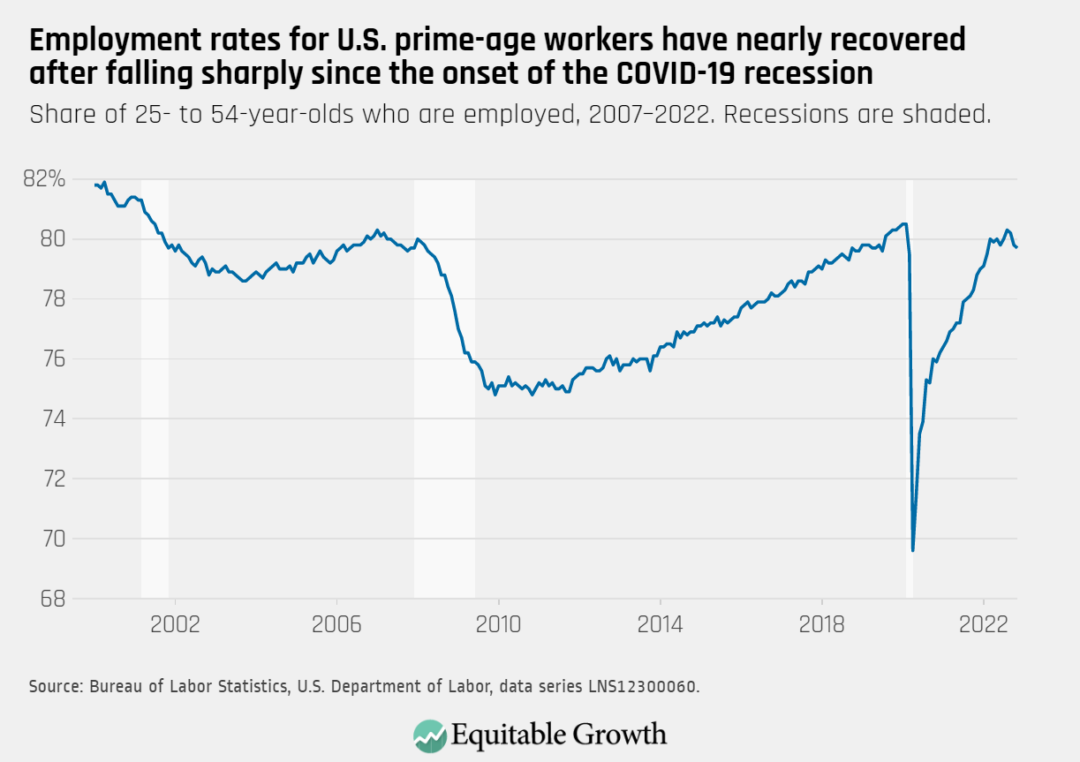
The employment rate for prime-age workers decreased slightly from 79.8 percent in October to 79.7 percent in November 2022 as total nonfarm employment rose by 263,000.
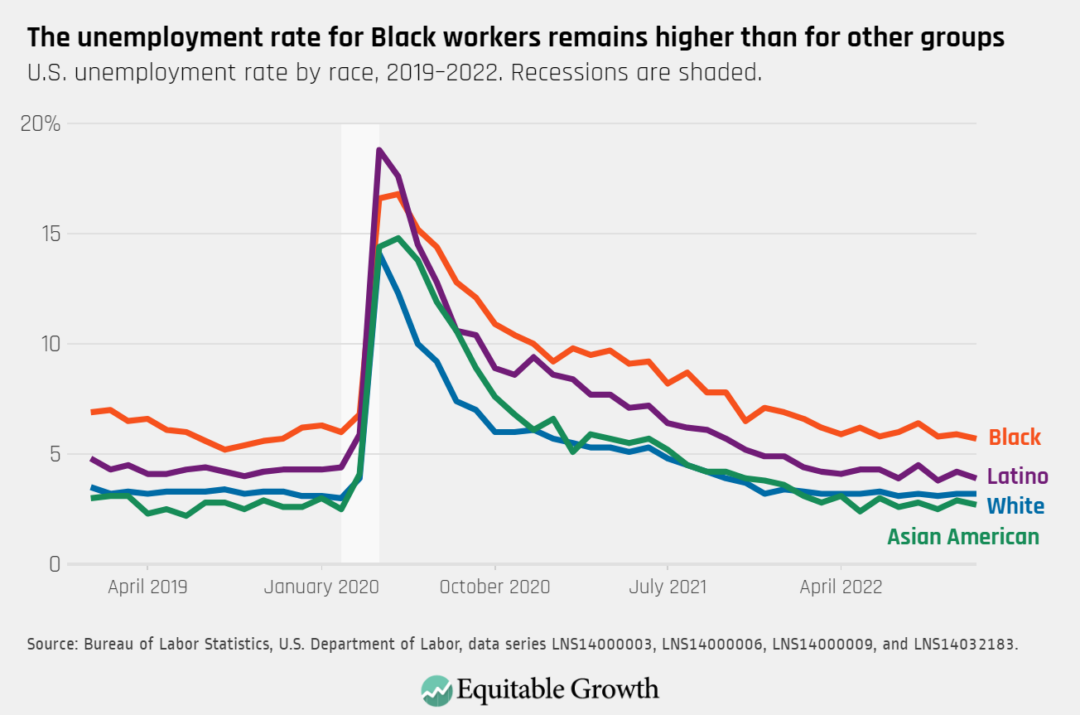
The unemployment rate stayed at 3.7 percent in November and remains high for Black workers (5.7 percent), compared to other groups. The unemployment rate is 3.9 percent for Latino workers, 3.2 percent for White workers, and 2.7 percent for Asian American workers.
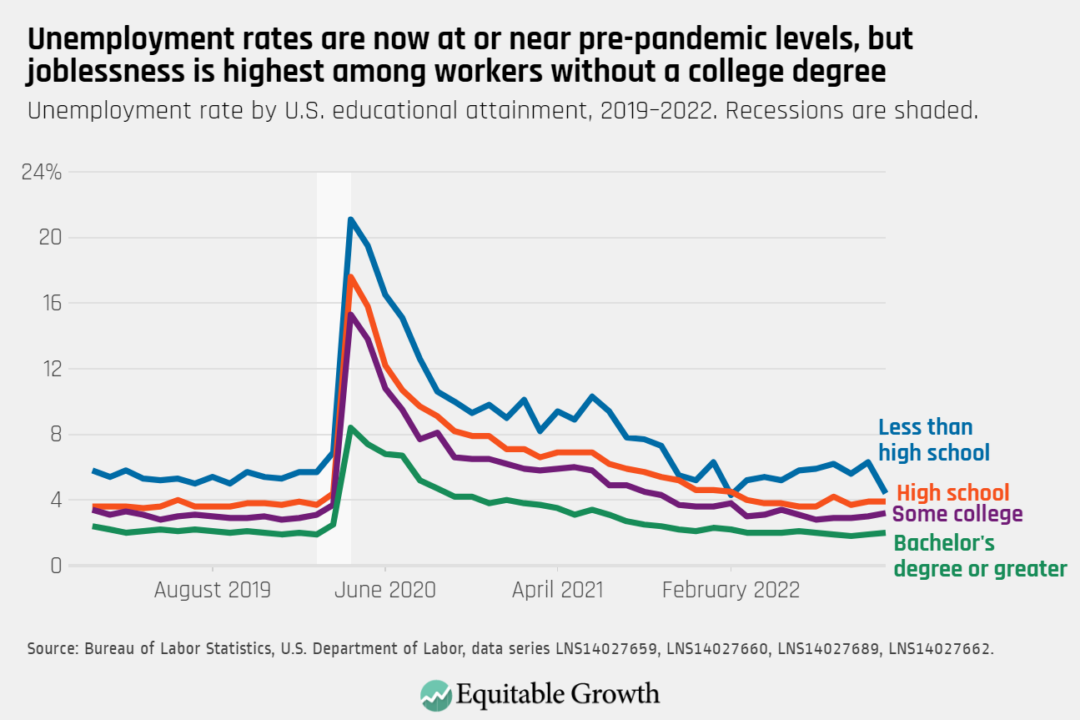
The unemployment rate fell to 4.4 percent for workers with less than a high school degree and remained near 3.9 percent for high school graduates. Rates increased slightly to 3.2 percent for workers with some college and 2 percent for college graduates.
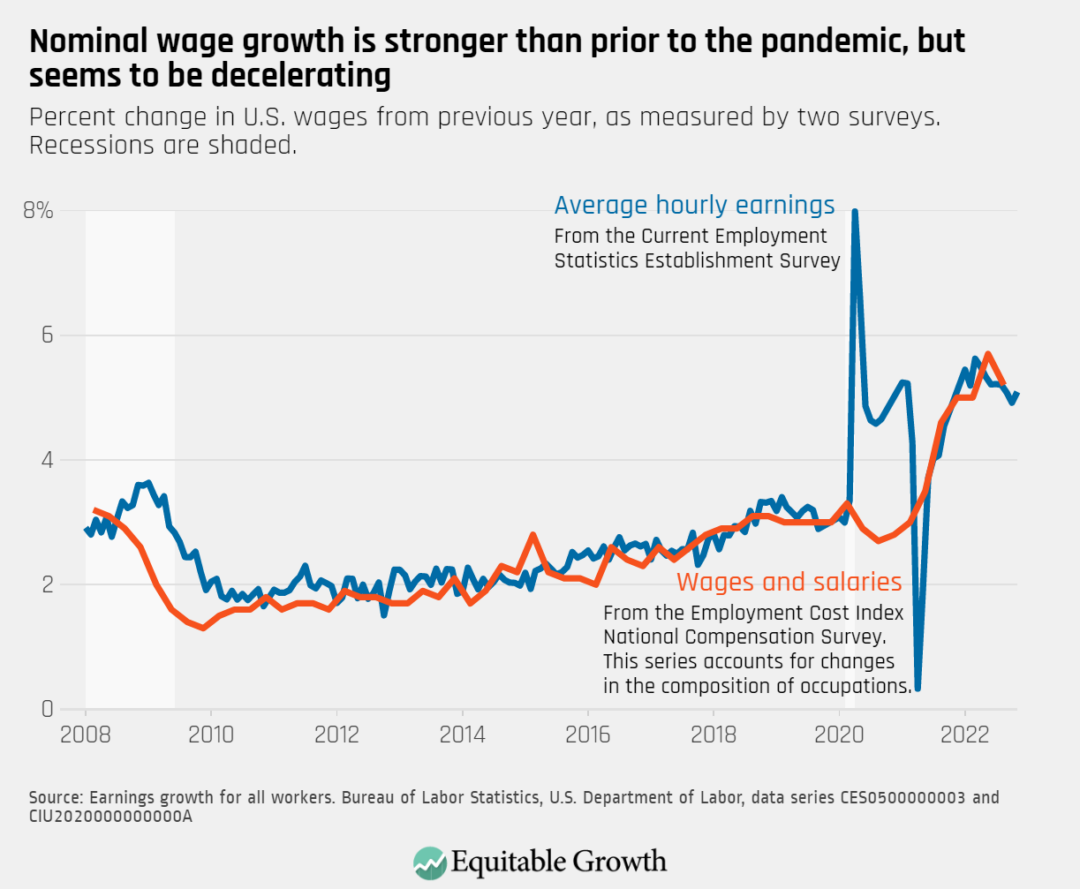
Nominal wage growth (not accounting for inflation) increased slightly in November, with average hourly earnings growth at 5.1 percent over the past 12 months.
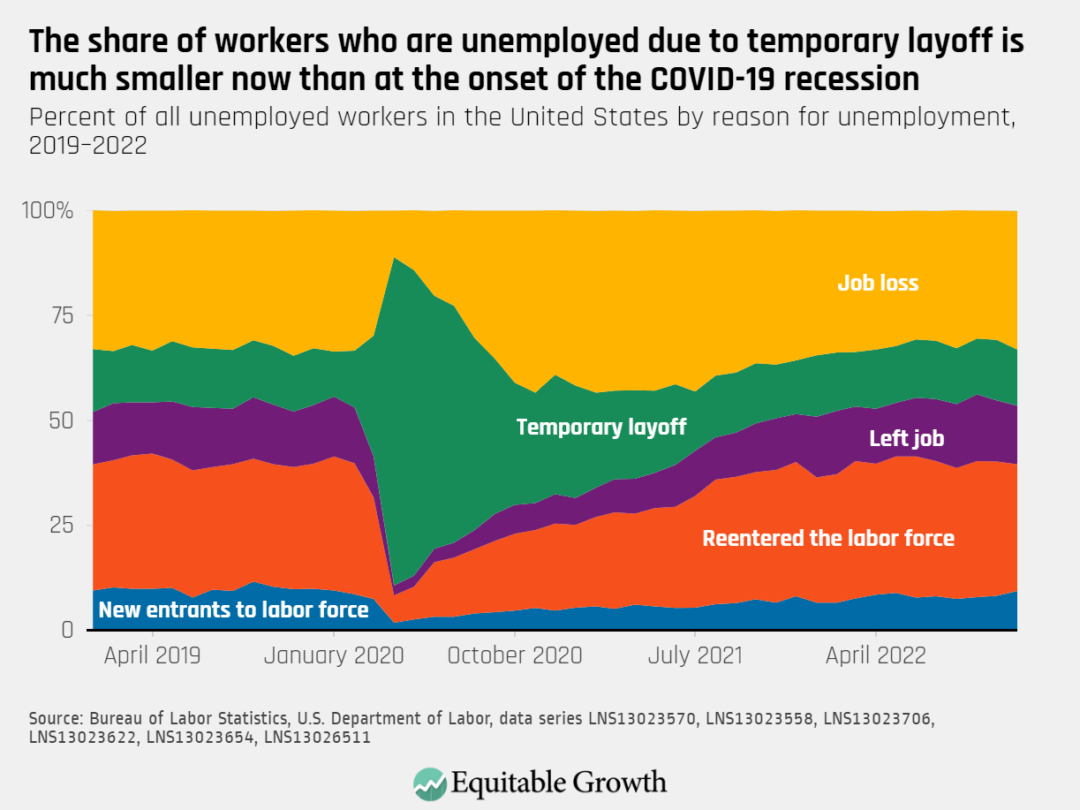
The share of unemployed workers who are unemployed due to job loss rose to 33 percent, and 13.4 percent are on temporary layoff; the share who left their job (13.9 percent) or are reentering the labor force (30.2 percent) declined, while new entrants rose (9.4 percent).