Equitable Growth’s Jobs Day Graphs: December 2022 Report Edition
On January 6 the U.S. Bureau of Labor Statistics released new data on the U.S. labor market during the month of December. Below are five graphs compiled by Equitable Growth staff highlighting important trends in the data.
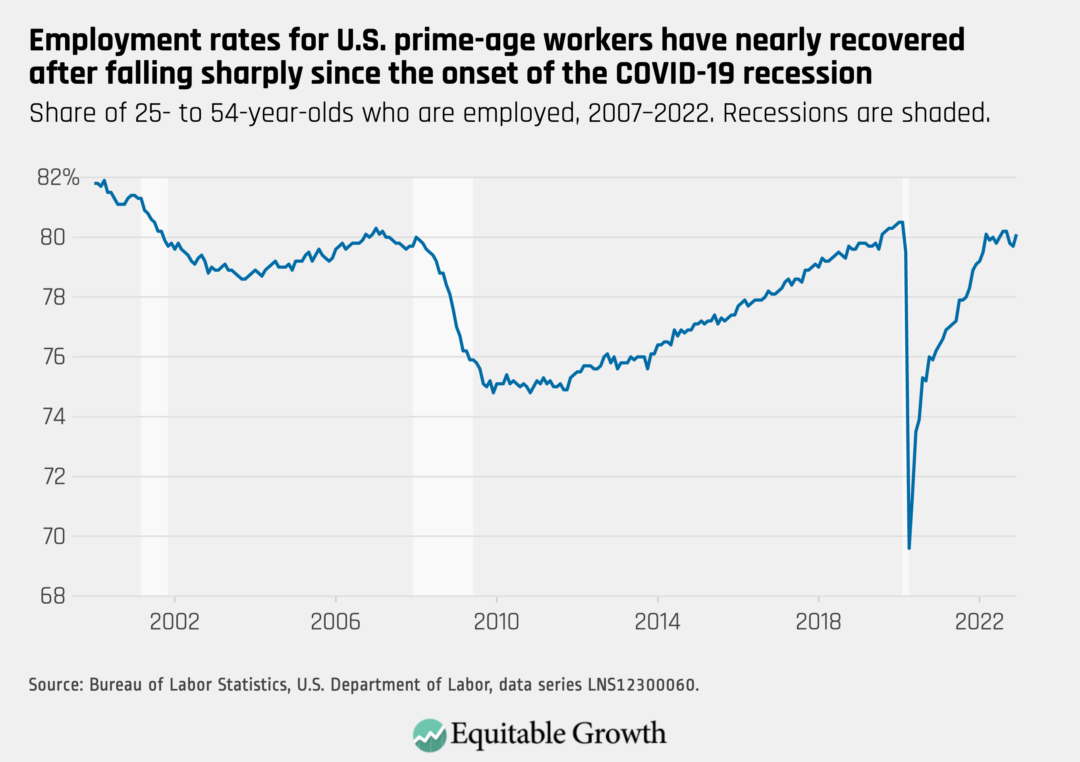
The employment rate for prime-age workers increased from 79.7 percent in November to 80.1 percent in December as total nonfarm employment rose by 223,000.
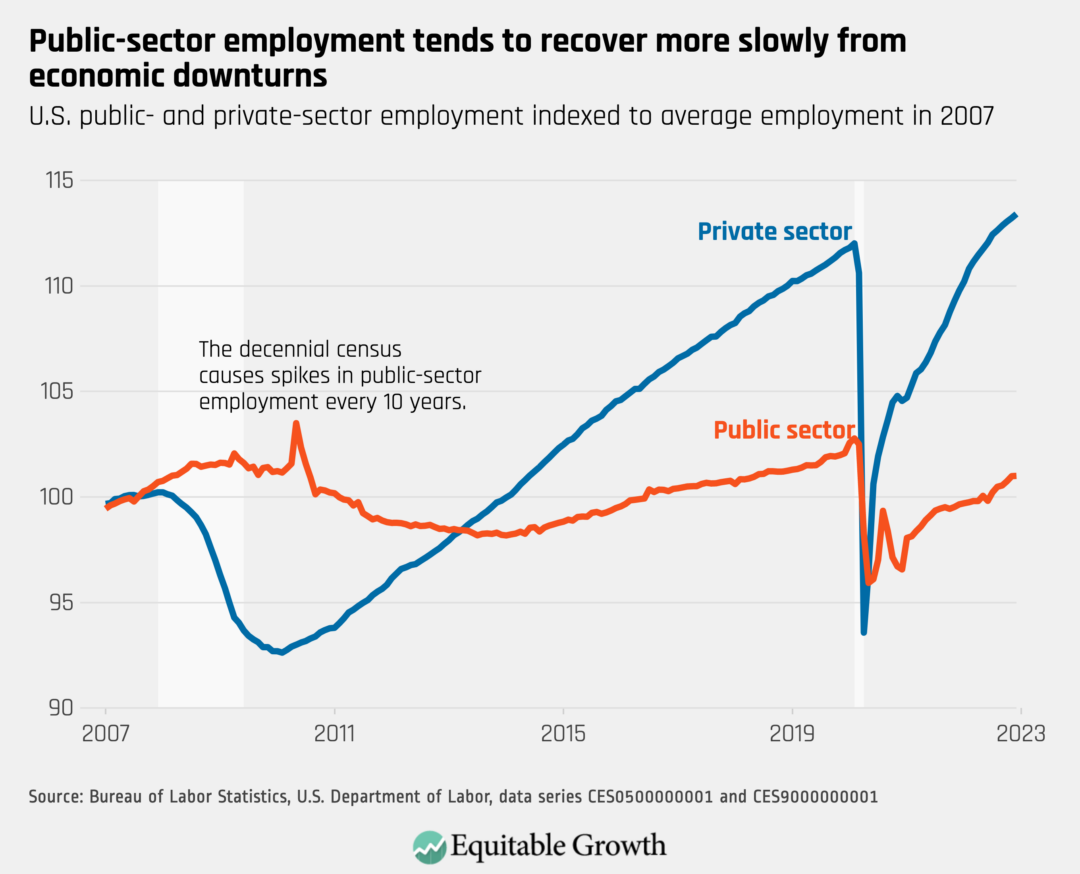
Private-sector employment continued to rise in December, while public-sector employment has recovered more slowly and remains below pre-pandemic levels.
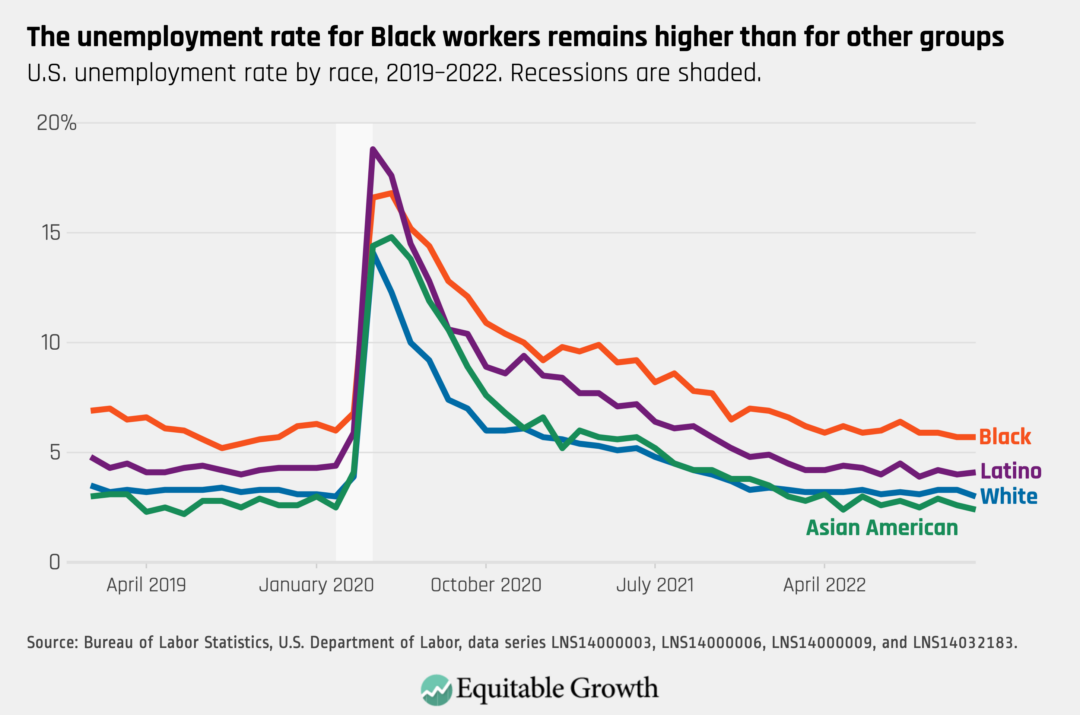
The unemployment rate decreased to 3.5 percent in December and remains higher for Black workers (5.7 percent) and Latino workers (4.1 percent), compared to White workers (3.0 percent) and Asian American workers (2.4 percent).
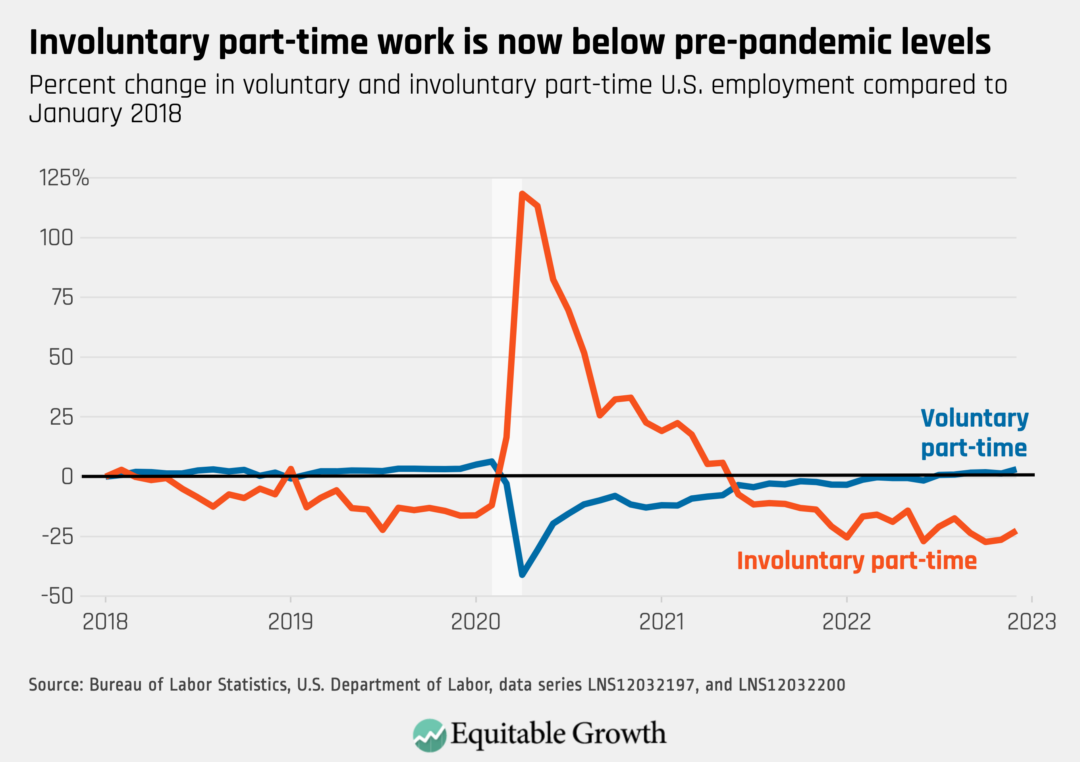
Involuntary part-time work, which represents part-time workers who would prefer full-time work, increased in December, but remains low relative to levels over the past five years.
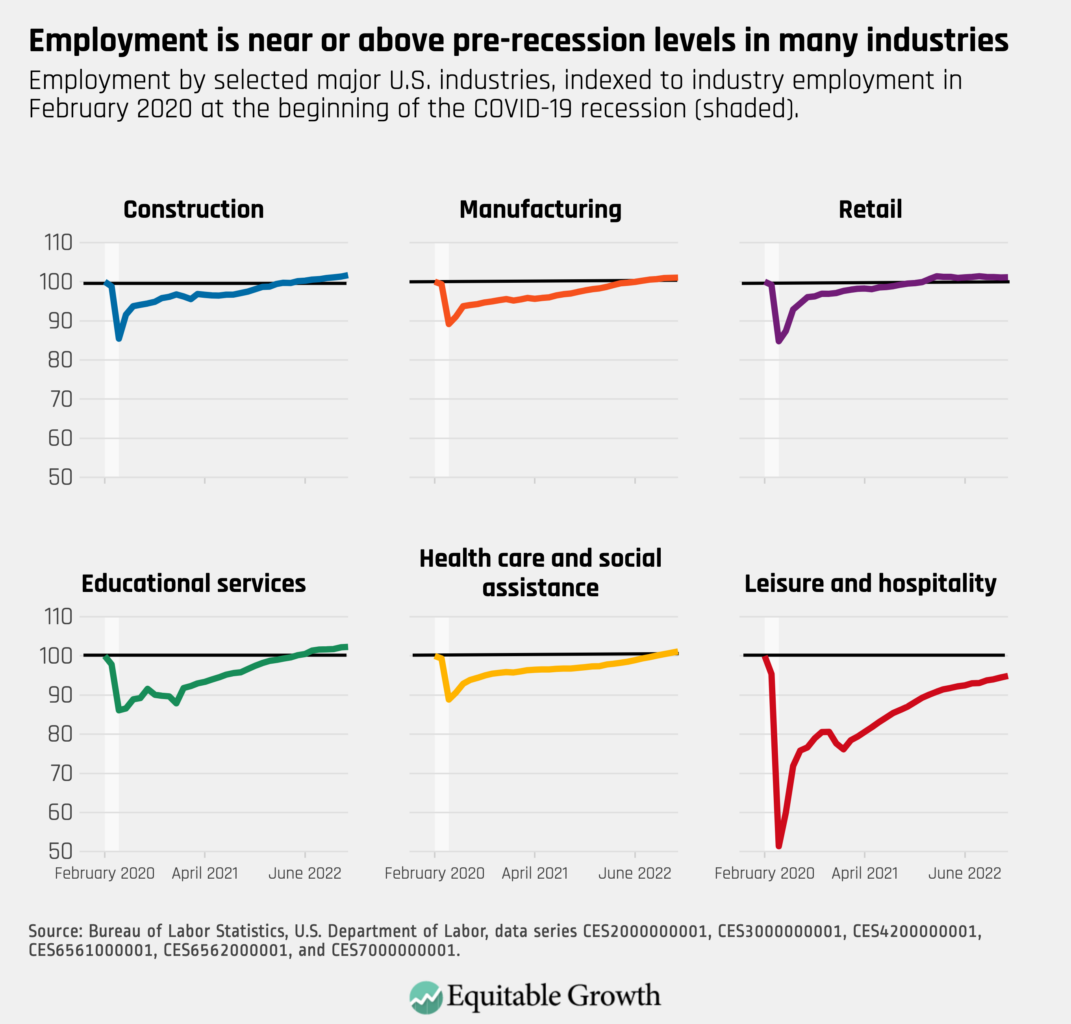
Employment in many sectors is now back to or surpassing pre-pandemic levels, including construction, retail, and educational services. Employment in leisure and hospitality has yet to recover despite rising by 67,000 jobs in December.