Equitable Growth’s Jobs Day Graphs: January 2023 Report Edition
On February 3, the U.S. Bureau of Labor Statistics released new data on the U.S. labor market during the month of January. Below are five graphs compiled by Equitable Growth staff highlighting important trends in the data.
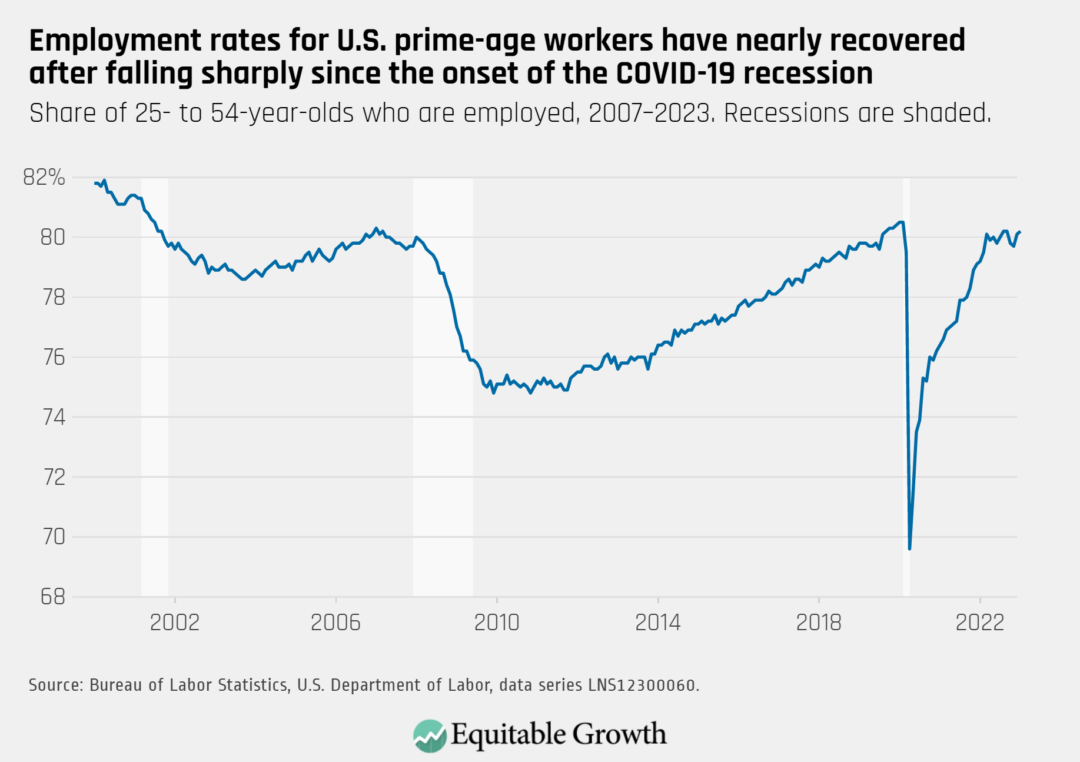
The employment rate of prime-age workers increased slightly from 80.1 percent in December to 80.2 percent in January.
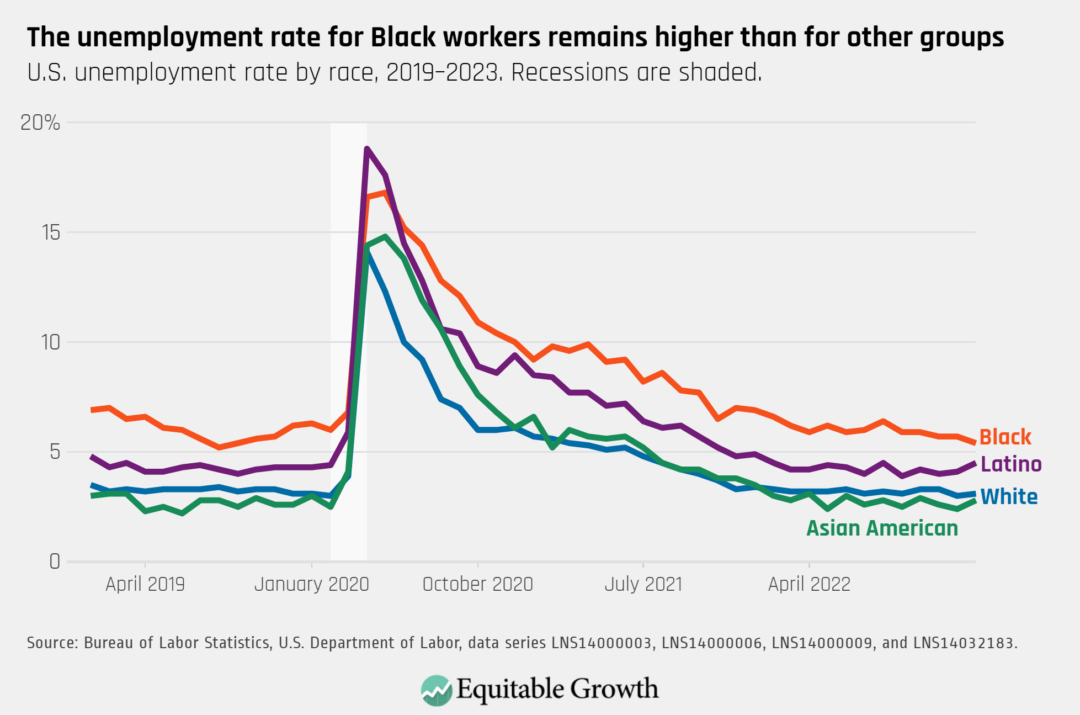
The unemployment rate of Black workers has been trending downward over the past few months, while the unemployment rates for other groups has been largely unchanged.
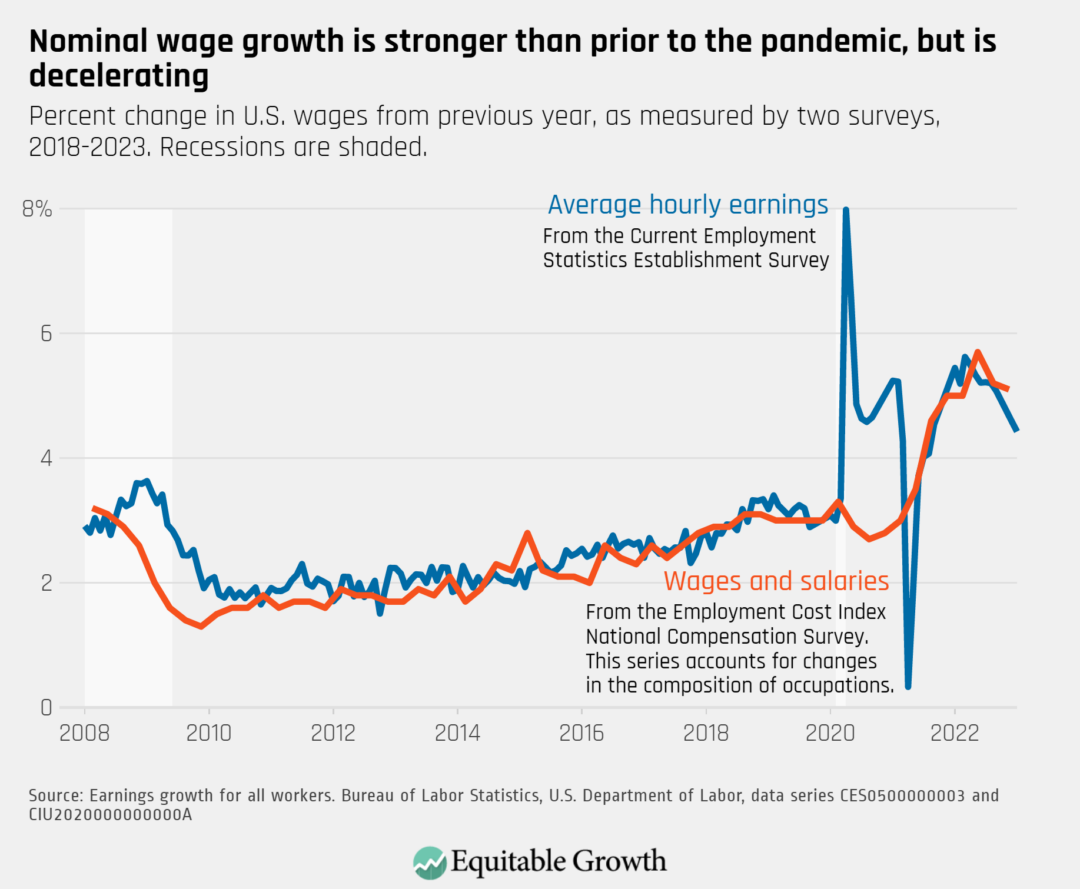
Wage growth has continued to decelerate, easing fears that the labor market is overheating.
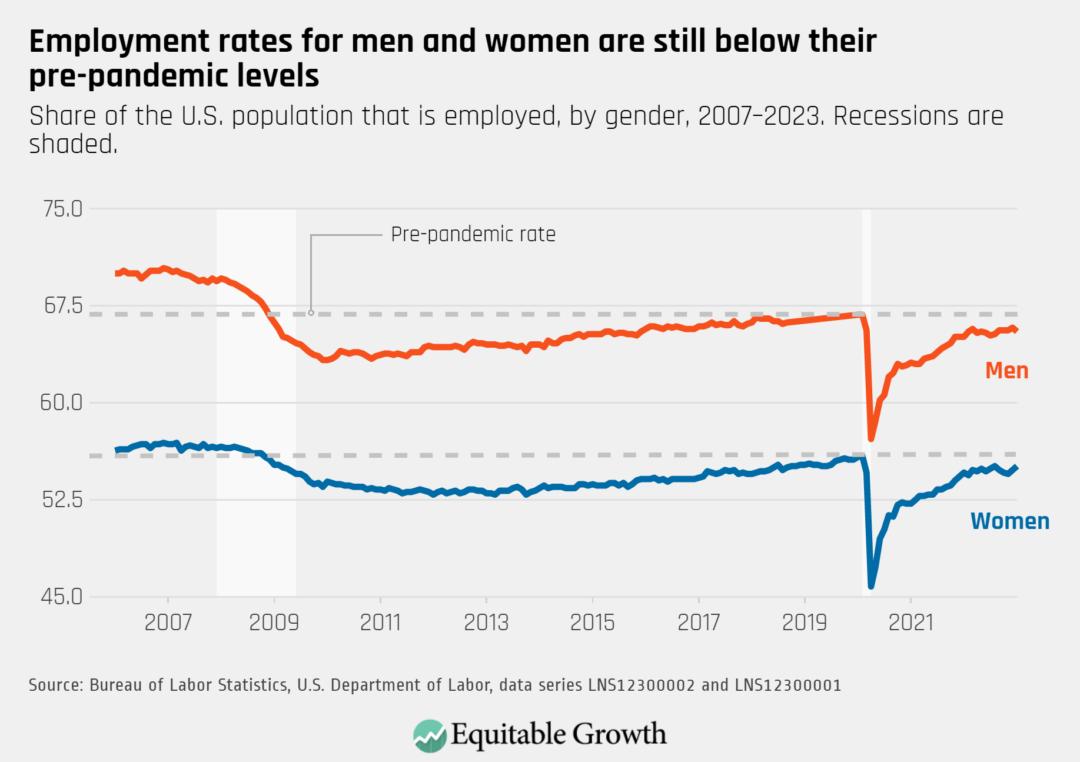
The employment rate for women workers increased at a greater rate then men in January as both hover just below their pre-pandemic levels.
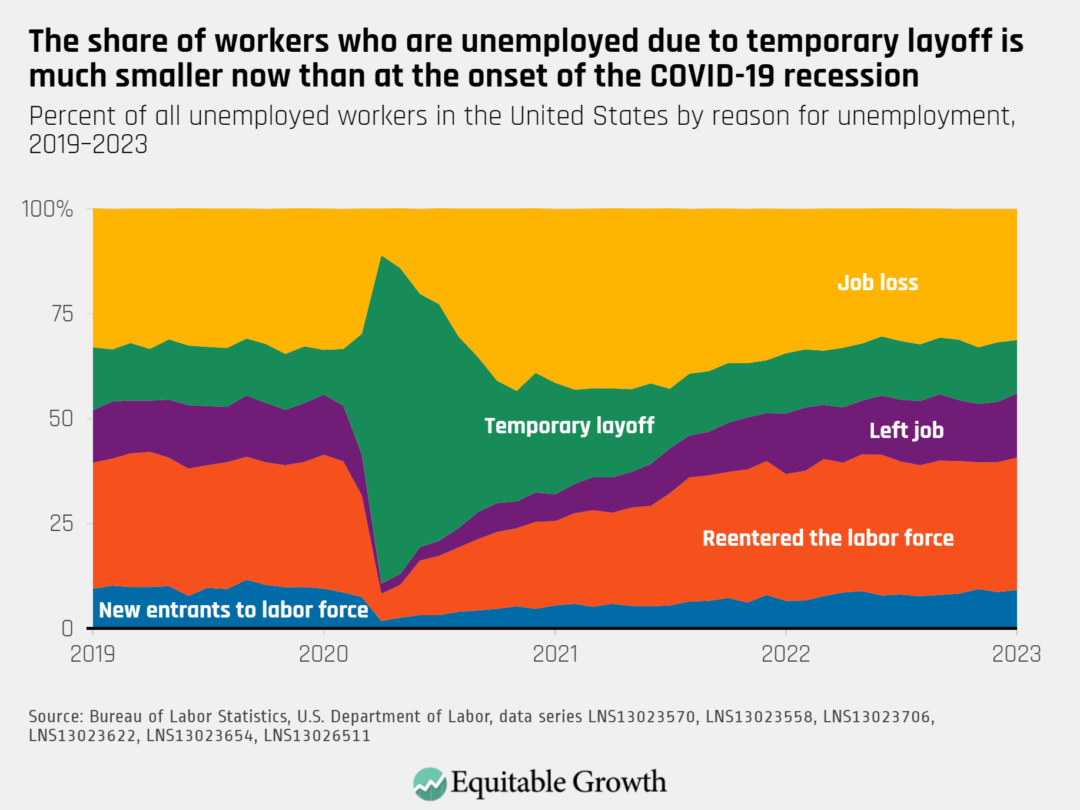
An increasing proportion of unemployment workers have voluntarily left their jobs or reentered the labor force in the prior month.