How tight is the U.S. labor market? And how tight do we want it?

A “Now Hiring” sign hangs in the window of a Dollar General.

Is the U.S. labor market at “full employment”? This question may seem open and shut with the unemployment rate at 4.6 percent, according to the latest Employment Situation report. But some other data show some slack remaining in the labor market, including the employment rate for prime-age workers and wage growth that, while increasing, still has some room to grow. Data released this morning as part of the Job Openings and Labor Turnover Survey might be helpful not only when looking at the health of the labor market, but also predicting when policymakers will decide that the labor market hits “full employment.”

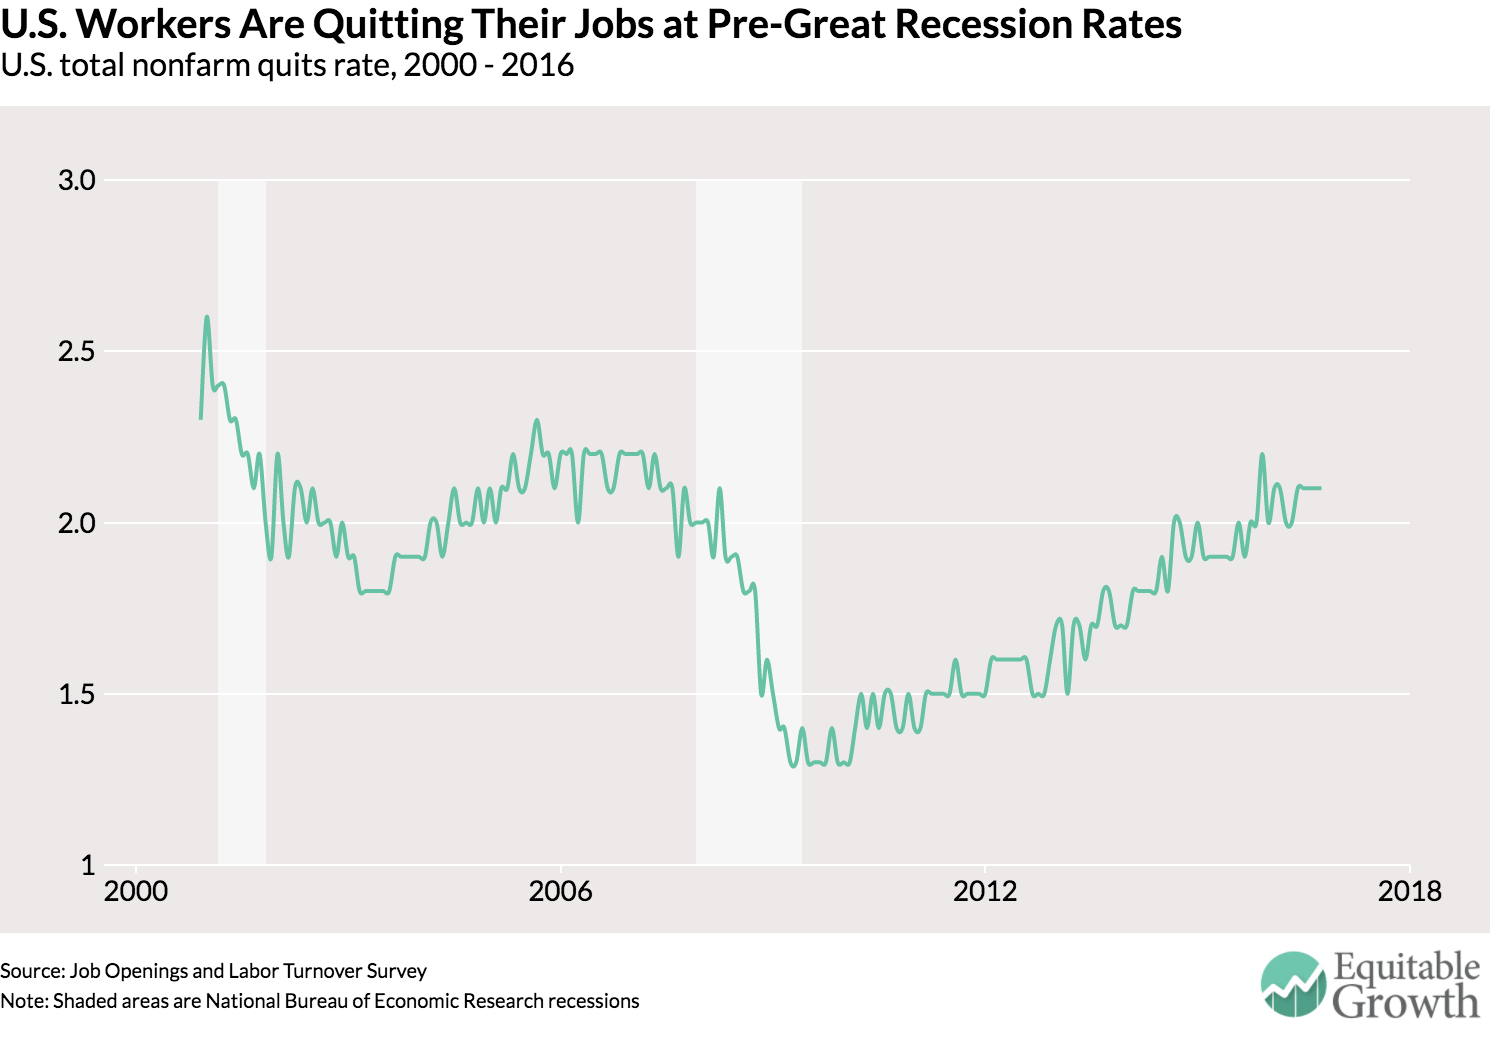
The rate at which workers quit their jobs is a good window into the health of the labor market. Quitting is a sign of worker confidence in their ability to find a new job. Workers will be more likely to quit when they see the labor market improving. Higher rates of quitting also are a sign that companies see the labor market tightening and are poaching more workers from other firms. As today’s Job Openings and Labor Turnover Survey shows, the quits rate is close to pre-recession levels, but data that cover a longer time than JOLTS show the current rates far below levels seen in the 1990s. (See Figure 1.)

Figure 1

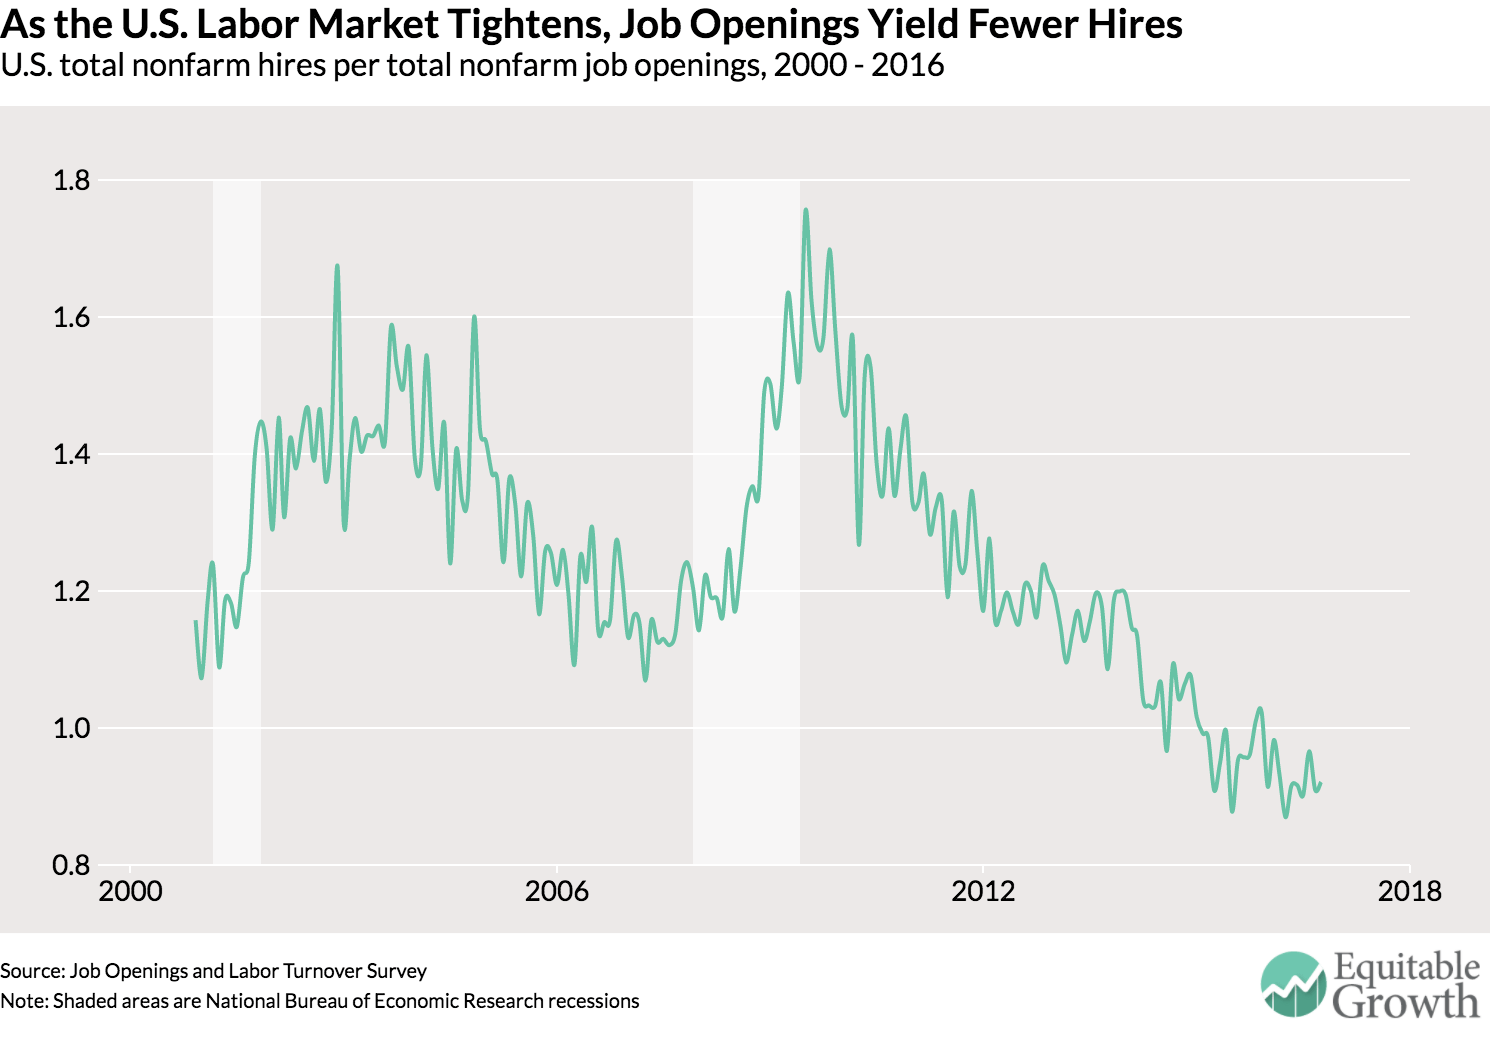
Another metric is the number of hires per job opening, or the rate at which open jobs are being filled. When the labor market is weak, employers will have a relatively easy time filling open jobs. More unemployed workers means employers will have an easy time picking workers they find acceptable. As the labor market improves, job openings will be harder to fill and the number of hires per job opening will decline. Today’s figures show this “vacancy yield” has fallen over the course of the current recovery. (See Figure 2.) By this metric, the U.S. labor market is tighter than its pre-recession levels. But this may be due to a structural change in how easily employers can create jobs. So it may be difficult to look at this graph and know what level of the yield would constitute full employment.

Figure 2

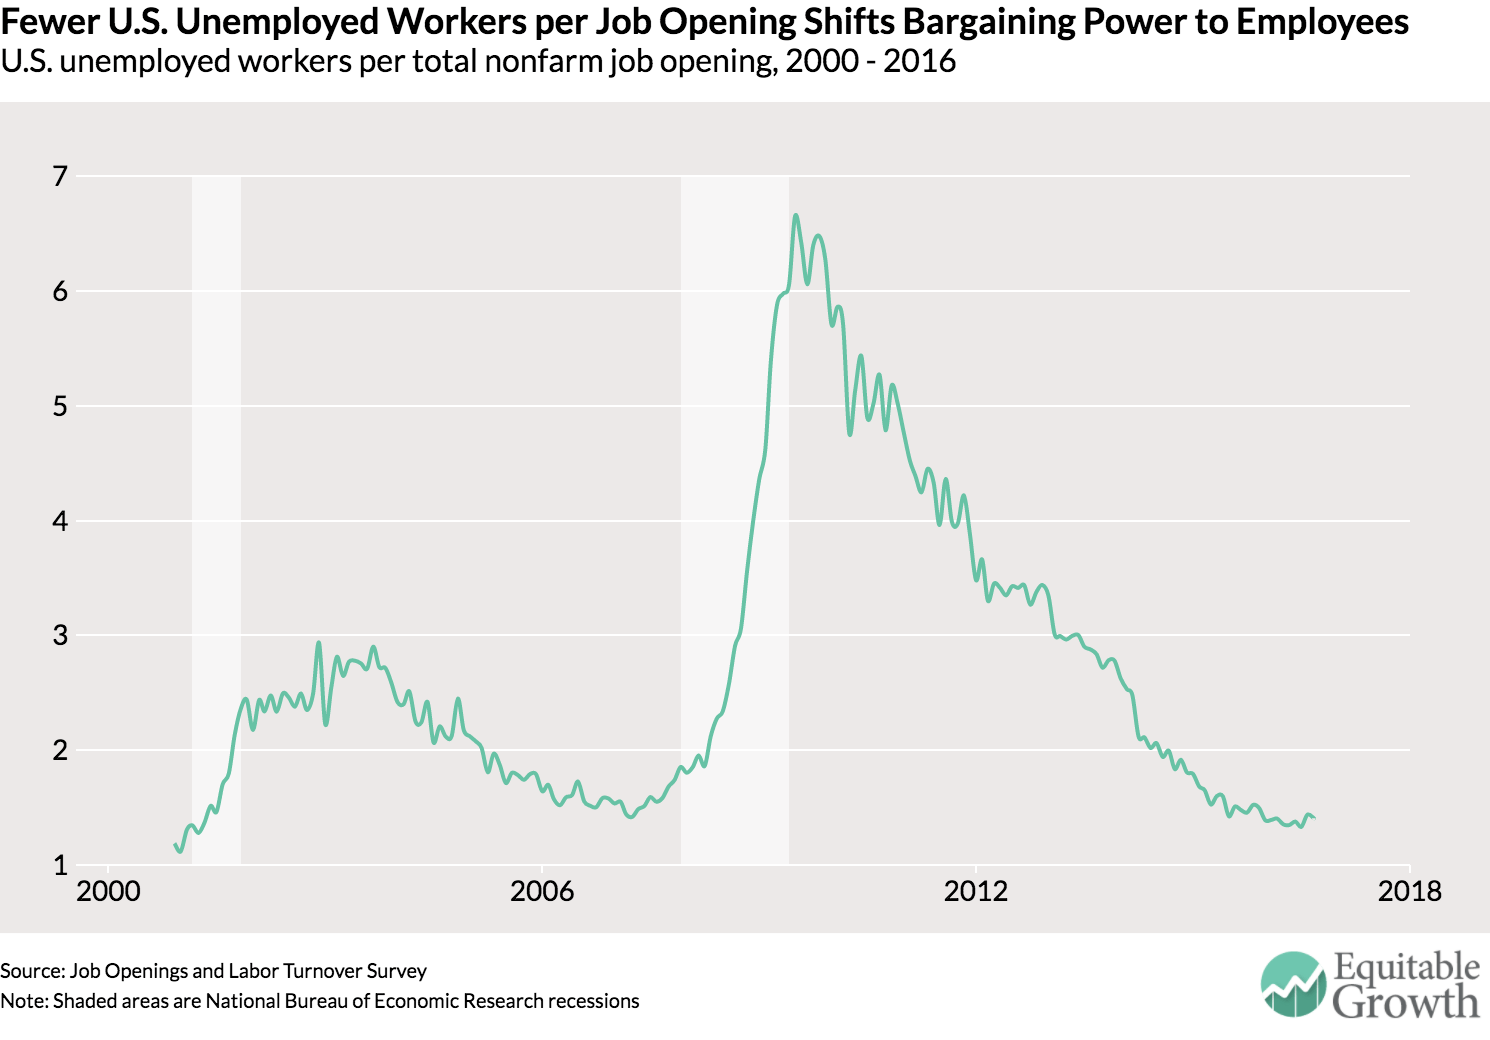
A third and final metric from the JOLTS data is the number of unemployed workers per job opening. A slack or weak labor market will have a high ratio of workers who are laid off and employers who aren’t looking to hire. A higher ratio means employers have relatively more implicit bargaining power as there are more workers competing for a set number of job openings. Workers’ ability to bargain over pay or working conditions starts moving back to workers as the ratio declines. Of course, with so few workers having a union to support them in any negotiations, the ability to bargain with an employer (or potential employer) is based on the individual’s capacity. The current ratio is now at levels slightly lower than pre-recession levels. (See Figure 3.)

Figure 3

This metric also shows that the labor market is back at prerecession levels, but notice again that it was much lower in 2000 (a bit over 1) when the labor market has generally regarded at full employment. This ratio might be a good indicator of full employment—if by it we mean a situation where workers can easily find a job and have strong bargaining power. In his book “Full Employment in a Free Society,” the late British economist Sir William Beveridge wrote that full employment “means always more vacant jobs than unemployed men.” Updating this definition based on today’s JOLTS data, policymakers might want to shoot for an economy where the ratio of unemployed workers to job openings can be below 1 sustainably.

Overall these data show the U.S. labor market to be healthy and continuing its current trajectory toward full employment. How long it’ll take for the labor market to hit full employment is still up for debate.

Must-Reads: December 7, 2016


Interesting Reads:

Distributional National Accounts and measuring 21st century growth

In this June 1, 2016 photo, vacant buildings stand near the Pyramid which houses a Bass Pro Shops megastore that opened in 2015, in Memphis, Tenn. Statistics describe an America that is nearly recovered from the Great Recession, but the national averages don’t give a complete or accurate picture. Wealth is flowing disproportionately to the rich, skewing the data used to measure economic health.

The U.S. Bureau of Economic Analysis late last week released revised data showing that in the third quarter, the U.S. economy grew at an annual rate of 3.2 percent. This was deservedly celebrated as good news—growth was higher than previously reported, which means more economic activity and, with that, presumably, more jobs and better incomes. Yet that same data revealed nothing about how the economy is performing for people across the income spectrum.

New data released this week from economists Thomas Piketty, Emmanuel Saez, and Gabriel Zucman addresses this knowledge gap. Based on careful research that matches data on aggregate economic growth to individual incomes, the researchers show that between 1980 and 2014, on average, pre-tax income grew by 61 percent over that period, yet most of the U.S. population did not benefit from this growth. The bottom 50 percent of the population saw only a 1 percent growth in their pre-tax incomes (after adjusting for inflation) while those in the top 1 percent saw their incomes rise by 205 percent.

These Distributional National Accounts—developed by the three economists and co-collaborators working at the Paris School of Economics, the University of California-Berkeley, Oxford University, and Harvard University—provide policymakers and economists alike with a better way of understanding economic growth—one that directly connects the analysis of aggregate economic data with the real-life circumstances of individuals.

For generations, economists relied on very broad national income and product accounts to report on economic activity. These data—the National Income and Product Accounts—aggregate information from all the businesses, households, and governments across the economy to discern the total value of goods and services sold, the total incomes received, and what share comes from various sources, such as earnings, interest, rent, or government payments. The data also show how much the United States sells to other countries and buys from abroad.

This data is central to understanding how the U.S. economy works, but it is important to remember that policymakers more than a half-century ago made a choice about how to discern what was happening in the economy—one that did not take into consideration the consequences of economic growth on individuals but which suited the economic issues of the era. In the 1930s, in the wake of the Great Depression, the U.S. Commerce Department commissioned Nobel laureate Simon Kuznets to develop a set of national economic accounts. This was a time when promoting growth (and the jobs that come with it) was the nation’s priority. Prior to this, policymakers, business leaders, and families had to rely on a hodgepodge of data to infer what was going on in the economy.

Make no mistake, Kuznets’ National Income and Product Accounts have served their purpose over time and are among the most significant data developments of the 20th century. The data remain one of the most important tools that the Federal Reserve Board and other policymakers have to understand and manage the U.S. economy toward full employment. Historians credit the implementation of these accounts as one of the key reasons the United States so effectively marshaled economic resources to fight in World War II.

Today, there is a new data frontier—understanding what growth looks like for individuals and families throughout the U.S. economy amid growing income inequality. The data that underpins the new Distributional National Accounts can help policymakers understand why, even though the economy grew by 16 percent in the wake of the Great Recession, millions of Americans report that the economy is not working for them any better than it was amid the worst economic downturn since the Great Depression. Those millions of individual Americans and their families get it—most have not benefitted from more than seven years of growth. Distributional National Accounts enable policymakers to understand whether and how income inequality affects economic growth.

Must-Read: Martin Wolf: More Perils for the Eurozone

Must-Read: Never bet on an inside straight. Never eat at a place called “Mom’s”. Never go up against a Sicilian when death is on the line. And never construct a currency union vastly larger than any conceivable optimal currency area:

More perils lie in wait for the eurozone

Martin Wolf: More Perils for the Eurozone: “Divergence in the performance of members of the single currency is a real challenge…

The combination of weak aggregate demand with huge post-crisis divergences in economic performance has turned the eurozone into an accident waiting to happen. True, it is quite possible that the situation will stabilise. But the interactions between economic and financial events and political stresses are unpredictable and dangerous.

What the eurozone needs most is a shift away from the politics of austerity. In its most recent Economic Outlook, the OECD, a club of mostly rich nations, makes a cogent (albeit belated) plea for a combination of growth-supporting fiscal expansion with relevant structural reforms. This is most relevant to the eurozone because that is where demand has been weakest and the fetish over fiscal deficits most exaggerated. In the big eurozone economies, net public investment is near zero. This is folly.

Alas, little chance of change exists. Those who matter — the German government, above all — view public borrowing as a sin, regardless of its cost. The political and economic impact of breaking up the eurozone is so great that the single currency may well soldier on forever. But it has by now become identified with prolonged stagnation. Those member countries with the power to change this approach should ask themselves whether it really makes sense. It is time for the eurozone to stop living dangerously and start living sensibly, instead.

Should-Read: Simon Wren-Lewis: The OBR and the Impact of Brexit

Should-Read: I want the opinion of Sherman Robinson of IFPRI and PIIE on this: Sherman?

Simon Wren-Lewis: The OBR and the Impact of Brexit: “The debate about whether the OBR is being too pessimistic about the impact of Brexit…

…lower immigration from the EU and lower productivity. The two are linked…. The OBR also assumes that Brexit will reduce the trade intensity of the UK: less exports and imports. This is pretty obvious to anyone who has looked at international trade: transport costs may not be as high as they once were, but gravity equations tell us that geographical distance is still a key factor in influencing whether trade takes place, which means that reduced trade with the EU will not be matched by new trade outside the EU. The Treasury analysis of Brexit assumed that this lower trade intensity would also reduce productivity. The OBR do not include this effect, calling it too uncertain. This is a slightly surprising judgement….

None of these transmission mechanisms from greater trade to higher productivity are particularly fanciful: they all make common sense (at least as seen by an economist). They are all one directional, which means assuming an effect of zero is an extreme point in every case. In this sense, the OBR is being rather optimistic about the impact of Brexit on the UK economy.

Economic growth in the United States: A tale of two countries

Overview

The rise of economic inequality is one of the most hotly debated issues today in the United States and indeed in the world. Yet economists and policymakers alike face important limitations when trying to measure and understand the rise of inequality.

One major problem is the disconnect between macroeconomics and the study of economic inequality. Macroeconomics relies on national accounts data to study the growth of national income while the study of inequality relies on individual or household income, survey and tax data. Ideally all three sets of data should be consistent, but they are not. The total flow of income reported by households in survey or tax data adds up to barely 60 percent of the national income recorded in the national accounts, with this gap increasing over the past several decades.1

This disconnect between the different data sets makes it hard to address important economic and policy questions, such as:

  • What fraction of economic growth accrues to those in the bottom 50 percent, the middle 40 percent, and the top 10 percent of the income distribution?
  • What part of the rise in inequality is due to to changes in the share of national income that goes to workers (labor income) and owners (capital income) versus changes in how these labor and capital incomes are distributed among individuals?

A second major issue is that economists and policymakers do not have a comprehensive view of how government programs designed to ameliorate the worst effects of economic inequality actually affect inequality. Americans share almost one-third of the fruits of economic output (via taxes that help pay for an array of social services) through their federal, state, and local governments. These taxes collectively add up to about 30 percent of national income, and are used to fund transfers and public goods that ultimately benefit all U.S. families. Yet we do not have a clear measure of how the distribution of pre-tax income differs from the distribution of income after taxes are levied and after government spending is taken into account. This makes it hard to assess the extent to which governments make income growth more equal.2

In a recent paper, the three authors of this issue brief attempt to create inequality statistics for the United States that overcome the limitations of existing data by creating distributional national accounts.3 We combine tax, survey, and national accounts data to build a new series on the distribution of national income. National income is the broadest measure of income published in the national accounts and is conceptually close to gross domestic product, the broadest measure of economic growth.4 Our distributional national accounts enable us to provide decompositions of growth by income groups consistent with macroeconomic growth.

Related

How to deliver equitable growth: 14 strategies for the next administration

In our paper, we calculate the distribution of both pre-tax and post-tax income. The post-tax series deducts all taxes and then adds back all transfers and public spending so that both pre-tax and post-tax incomes add up to national income. This allows us to provide the first comprehensive view of how government redistribution in the United States affects inequality. Our benchmark series use the adult individual as the unit of observation and split income equally among spouses in married couples. But we also produce series where each spouse is assigned their own labor income, allowing us to study gender inequality and its impact on overall income inequality. In this short summary, we would like to highlight three striking findings.

Our first finding—a surge in income inequality

First, our data show that the bottom half of the income distribution in the United States has been completely shut off from economic growth since the 1970s. From 1980 to 2014, average national income per adult grew by 61 percent in the United States, yet the average pre-tax income of the bottom 50 percent of individual income earners stagnated at about $16,000 per adult after adjusting for inflation.5 In contrast, income skyrocketed at the top of the income distribution, rising 121 percent for the top 10 percent, 205 percent for the top 1 percent, and 636 percent for the top 0.001 percent. (See Figures 1 and 2.)

Figure 1
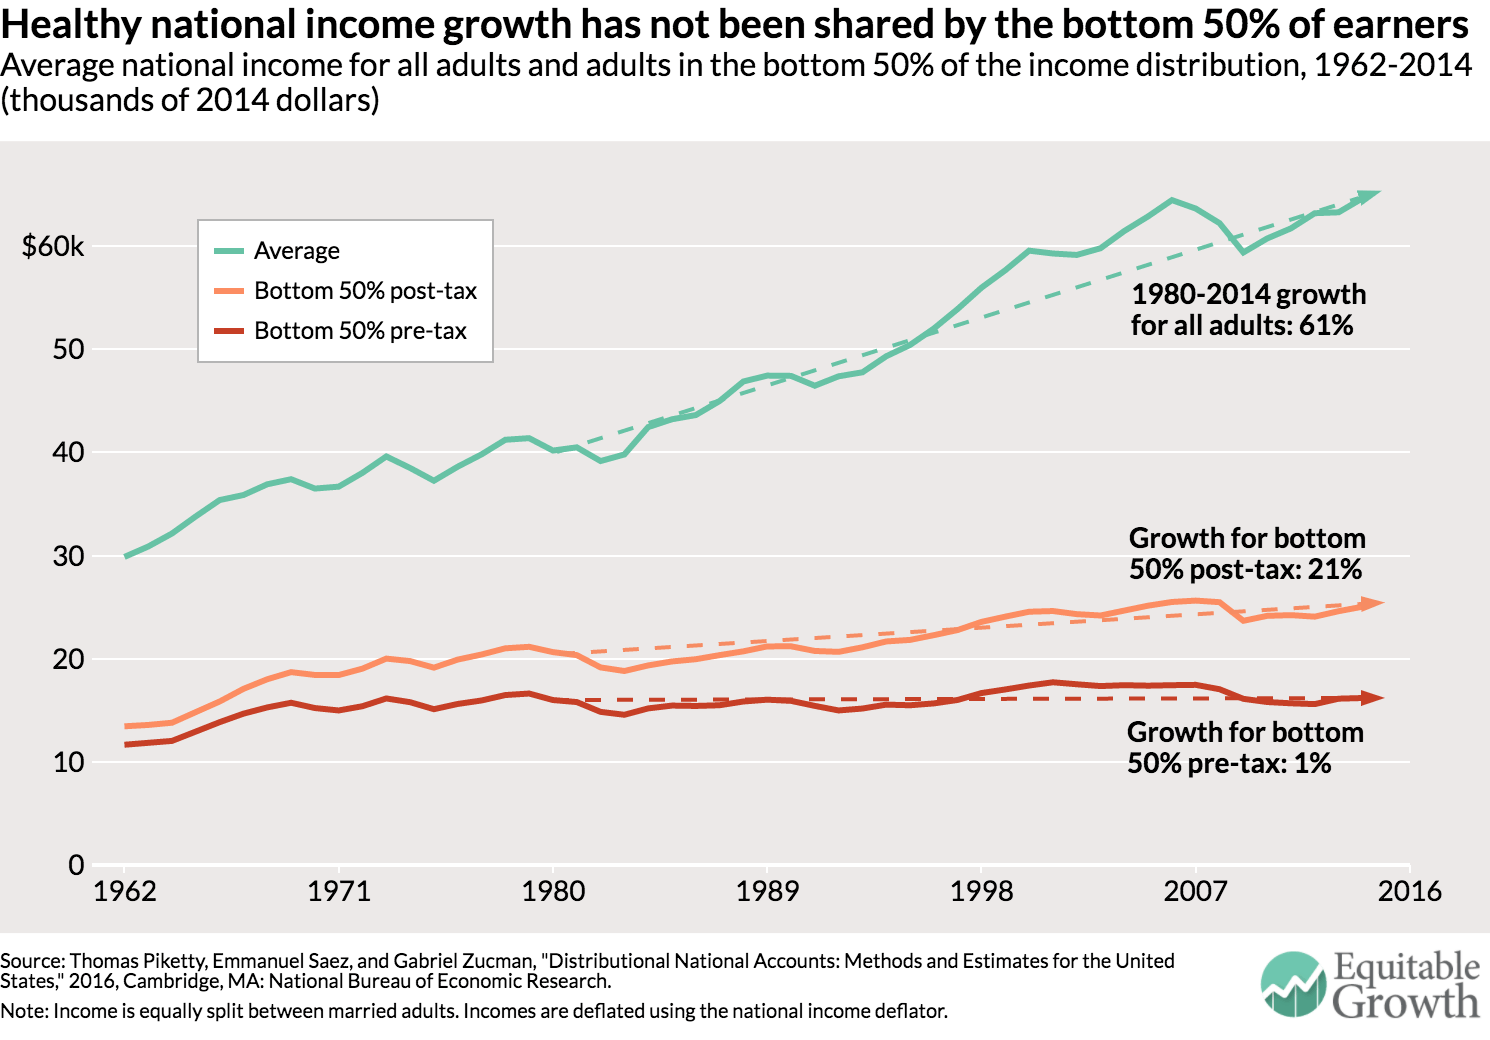
Figure 2
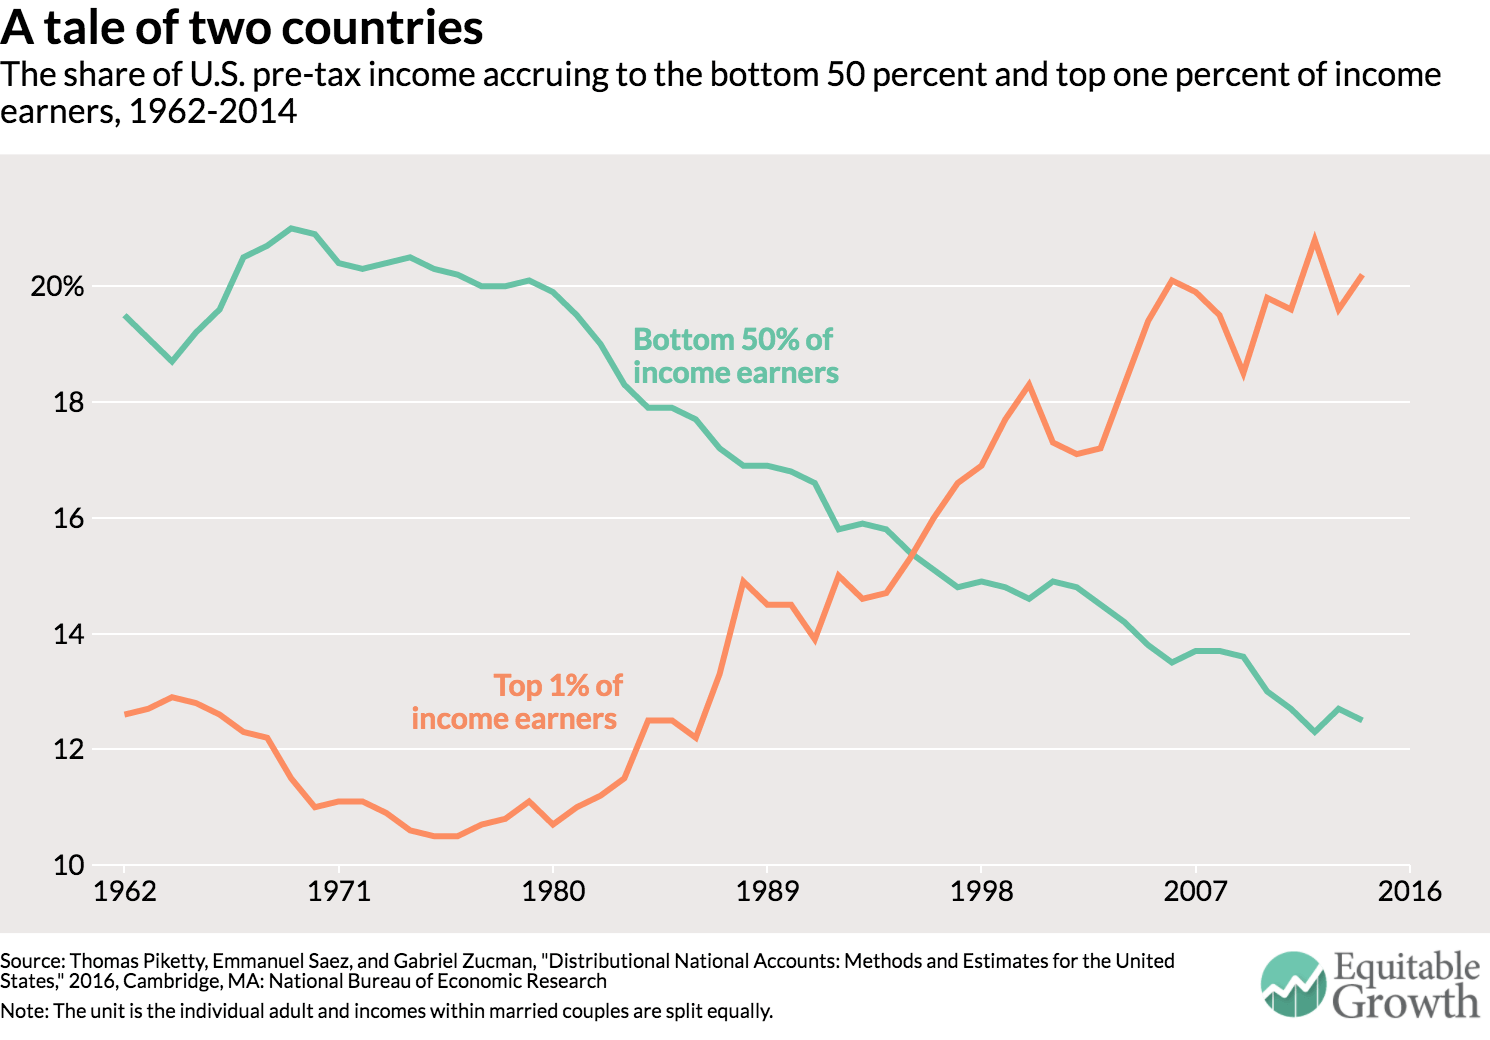
It’s a tale of two countries. For the 117 million U.S. adults in the bottom half of the income distribution, growth has been non-existent for a generation while at the top of the ladder it has been extraordinarily strong. And this stagnation of national income accruing at the bottom is not due to population aging. Quite the contrary: For the bottom half of the working-age population (adults below 65), income has actually fallen. In the bottom half of the distribution, only the income of the elderly is rising.6 From 1980 to 2014, for example, none of the growth in per-adult national income went to the bottom 50 percent, while 32 percent went to the middle class (defined as adults between the median and the 90th percentile), 68 percent to the top 10 percent, and 36 percent to the top 1 percent. An economy that fails to deliver growth for half of its people for an entire generation is bound to generate discontent with the status quo and a rejection of establishment politics.

Because the pre-tax incomes of the bottom 50 percent stagnated while average national income per adult grew, the share of national income earned by the bottom 50 percent collapsed from 20 percent in 1980 to 12.5 percent in 2014. Over the same period, the share of incomes going to the top 1 percent surged from 10.7 percent in 1980 to 20.2 percent in 2014.7 As shown in Figure 2, these two income groups basically switched their income shares, with about 8 points of national income transferred from the bottom 50 percent to the top 1 percent. The gains made by the 1 percent would be large enough to fully compensate for the loss of the bottom 50 percent, a group 50 times larger.

To understand how unequal the United States is today, consider the following fact. In 1980, adults in the top 1 percent earned on average 27 times more than bottom 50 percent of adults. Today they earn 81 times more. This ratio of 1 to 81 is similar to the gap between the average income in the United States and the average income in the world’s poorest countries, among them the war-torn Democratic Republic of Congo, Central African Republic, and Burundi. Another alarming trend evident in this data is that the increase in income concentration at the top in the United States over the past 15 years is due to a boom in capital income. It looks like the working rich who drove the upsurge in income concentration in the 1980s and 1990s are either retiring to live off their capital income or passing their fortunes onto heirs.

Our second finding—policies to ameliorate income inequality fall woefully short

Our second main finding is that government redistribution has offset only a small fraction of the increase in pre-tax inequality. As shown in Figure 1, the average post-tax income of the bottom 50 percent of adults increased by only 21 percent between 1980 and 2014, much less than average national income. This meager increase comes with two important limits.

First, there was almost no growth in real (inflation-adjusted) incomes after taxes and transfers for the bottom 50 percent of working-age adults over this period because even as government transfers increased overall, they went largely to the elderly and the middle class. Second, the small rise of the average post-tax income of the bottom 50 percent of income earners comes entirely from in-kind health transfers and public goods spending. The disposable post-tax income—including only cash transfers—of the bottom 50 percent stagnated at about $16,000. For the bottom 50 percent, post-tax disposable income and pre-tax income are similar—this group pays roughly as much in taxes as it receives in cash transfers.

Our third finding—comparing income inequality among countries is enlightening

Third, an advantage of our new series is that it allows us to directly compare income across countries. Our long-term goal is to create distributional national accounts for as many countries as possible; all the results will be made available online on the World Wealth and Income Database. One example of the value of these efforts is to compare the average bottom 50 percent pre-tax incomes in the United States and France.8 In sharp contrast with the United States, in France the bottom 50 percent of real (inflation-adjusted) pre-tax incomes grew by 32 percent from 1980 to 2014, at approximately the same rate as national income per adult. While the bottom 50 percent of  incomes were 11 percent lower in France than in the United States in 1980, they are now 16 percent higher. (See Figure 3.)

Figure 3
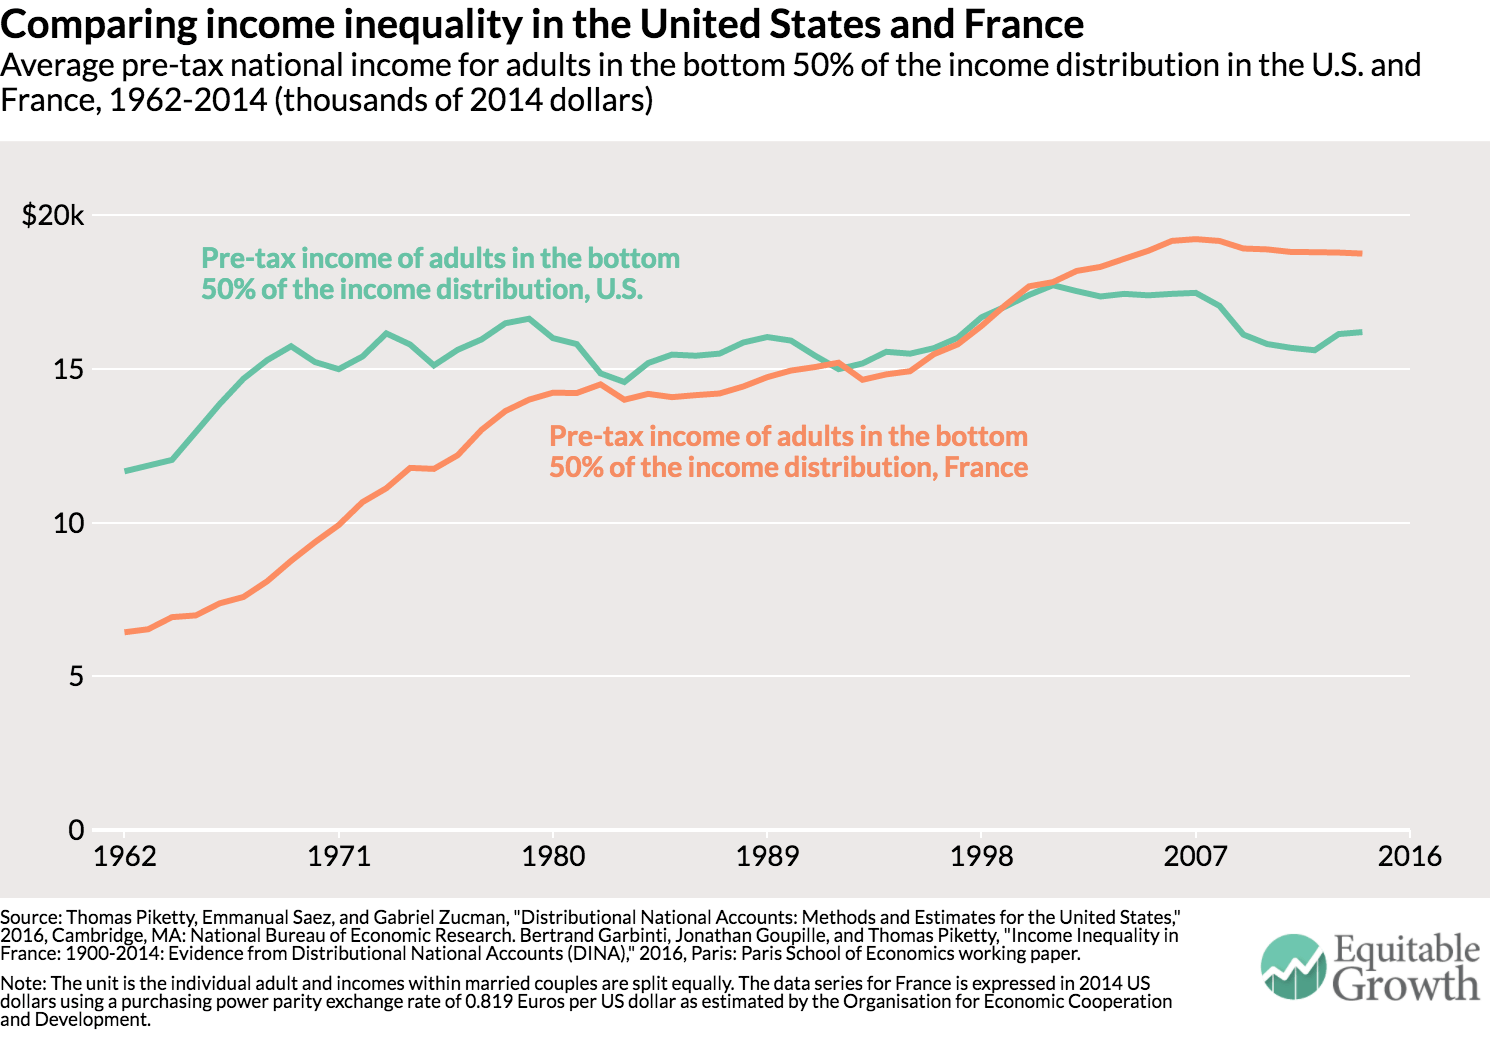
The bottom 50 percent of income earners makes more in France than in the United States even though average income per adult is still 35 percent lower in France than in the United States (partly due to differences in standard working hours in the two countries).9 Since the welfare state is more generous in France, the gap between the bottom 50 percent of income earners in France and the United States would be even greater after taxes and transfers.

The diverging trends in the distribution of pre-tax income across France and the United States—two advanced economies subject to the same forces of technological progress and globalization—show that working-class incomes are not bound to stagnate in Western countries. In the United States, the stagnation of bottom 50 percent of incomes and the upsurge in the top 1 percent coincided with drastically reduced progressive taxation, widespread deregulation of industries and services, particularly the financial services industry, weakened unions, and an eroding minimum wage.

Conclusion

Given the generation-long stagnation of the pre-tax incomes among the bottom 50 percent of wage earners in the United States, we feel that the policy discussion at the federal, state, and local levels should focus on how to equalize the distribution of human capital, financial capital, and bargaining power rather than merely the redistribution of national income after taxes. Policies that could raise the pre-tax incomes of the bottom 50 percent of income earners could include:

  • Improved education and access to skills, which may require major changes in the system of education finance and admission
  • Reforms of labor market institutions to boost workers’ bargaining power and including a higher minimum wage
  • Corporate governance reforms and worker co-determination of the distribution of profits
  • Steeply progressive taxation that affects the determination of pay and salaries and the pre-tax distribution of income, particularly at the top end

The different levels of government in the United States today obviously have the power to make income distribution more unequal, but they also have the power to make economic growth in America more equitable again. Potentially pro-growth economic policies should always be discussed alongside their consequences for the distribution of national income and concrete ways to mitigate their unequalizing effects. We hope that the distributional national accounts we present today can prove to be useful for such policy evaluations.

We will post online our complete distributional national accounts micro-data. These micro-files make it possible for researchers, journalists, policymakers, and any interested user to compute a wide array of distributional statistics—income, wealth, taxes paid and transfers received by age, gender, marital status, and other measures—and to simulate the distributional consequences of tax and transfer reforms in the United States.

Thomas Piketty is a professor of economics at the Paris School of Economics. Emmanuel Saez is a professor of economics and director of the Center for Equitable Growth at the University of California-Berkeley. Gabriel Zucman is an assistant professor of economics at the University of California-Berkeley. They are co-directors of the World Wealth and Income Database, together with economists Facundo Alvaredo at the Paris School of Economics and Anthony Atkinson at Oxford University.
Should-Read: Kevin Drum: Obamacare Repeal Is Doomed

Should-Read: Kevin Drum: Obamacare Repeal Is Doomed: “Republicans. Can’t. Repeal. Obamacare…

…Democrats [need to]… focus on… the provision of Obamacare that bans insurers from turning down customers or charging them extra for coverage…. Republicans say they favor keeping it. Donald Trump says he favors keeping it. It’s not a minor regulation. It is absolutely essential to any health care plan…. Repealing Obamacare but leaving in place the pre-existing conditions ban would destroy the individual insurance market and leave tens of millions of people with no way to buy insurance….

Take me. I’m currently being kept alive by about $100,000 worth of prescriptions drugs each year. If I can go to any insurer and demand that they cover me for $10,000, that’s a certain loss of $90,000. If millions of people like me do this, insurance companies will lose billions. In the employer market… this is workable because insurers have lots and lots of healthy, profitable people at each company to make up these losses. In the individual market—after you’ve repealed the individual mandate and the subsidies—they don’t….

Every insurance company in America would simply stop selling individual policies. It would be political suicide to make this happen, and this means that Democrats have tremendous leverage if they’re willing to use it. It all depends on how well they play their hand. The current Republican hope is that they can repeal parts of Obamacare, and then hold Democrats hostage: vote for our replacement plan or else the individual insurance market dies. There’s no reason Democrats should do anything but laugh at this…. Pre-existing conditions is the hammer Democrats can use to either save Obamacare or else demand that any replacement be equally generous. They just have to use it.

Note: Our Stabilization Policy Dilemma

Note to Self: If we want to have a better world, we either need to change the politics to restore the stabilization policy mission to fiscal authorities–and somehow provide them with the technocratic competence to carry out that mission–or give additional powers to central banks, powers that we classify or used to classify as being to a degree “fiscal”.

See: http://www.bradford-delong.com/2016/11/imf-panel-fiscal-policy-in-the-new-normal-partial-transcript.html

Should-Read: Wolfgang Munchau: The Elite’s Marie Antoinette Moment

Should-Read: The swipe at Tony Blair is, I think, undeserved. If the Athenian demos can vote to reverse its previous-day’s massacre decree before upon being convinced by Diodotos son of Eukrates that that vote was a mistake, the sovereign Queen-in-Parliament of the United Kingdom can–and I believe should–reject the narrow majority for BREXIT produced by the advisory vote. And the swipe at the OBR for simply doing its job is definitely undeserved, and unfair. The possibility that BREXIT will in the end be seen as having accelerated British economic growth is definitely a possibility out in the tail of the probability distribution.

If I were Wolfgang, I would tear up this current column of his and write another one, starting from the end of the current column. Start by saying that the first and most important economic-policy job of the elected leaders of a democracy is to maintain a high-pressure low-unemployment economy. Continue by saying that the second but subsidiary task is then to manage finances so that that high-pressure low-unemployment economy does not produced either undue inflation or unmanageable structural imbalances. Then note that economists’ first job is to remind the elected leaders of what their tasks are. Then note that economists’ second job is to give the elected leaders policy options that will (a) maintain a high-pressure low-unemployment economy economy, and (b) manage finances to prevent either undue inflation or unmanageable structural imbalances.

Conclude by saying that the economics profession has failed to do its job–but be sure to include a coda listing honorable exceptions.

Wolfgang Munchau: The Elite’s Marie Antoinette Moment: “The Bourbons were hard to beat as the quintessential out-of-touch establishment. They have competition now…

…We–the gatekeepers of the global liberal order–keep on doubling down. The campaign by Tony Blair, former UK prime minister, to undo Brexit is probably the quaintest example of all…. The truth about the impact of Brexit is that it is uncertain, beyond the ability of any human being to forecast and almost entirely dependent on how the process will be managed. “Don’t know” is the technically correct answer….

The correct course of action would be to stop insulting voters and, more importantly, to solve the problems of an out-of-control financial sector, uncontrolled flows of people and capital, and unequal income distribution…. Imagine what would have been possible if Chancellor Angela Merkel had spent her even larger political capital on finding a solution to the eurozone’s multiple crises, or on reducing Germany’s excessive current account surpluses. If you want to fight extremism, solve the problem.

But it is not happening for the same reason it did not happen in revolutionary France. The gatekeepers of western capitalism, like the Bourbons before them, have learnt nothing and forgotten nothing.

Must-Read: Simon Wren-Lewis: Hitting Back

Must-Read: Whether Britain’s BREXIT vote would bring on a more-or-less immediate recession depended on whether markets and the Bank of England could and would drop the value of the pound far enough to boost exports enough to offset the shock to investment in Britain. There was a risk that they would or could not–enough of a risk that I thought that avoiding a post-vote recession was a tail possibility. But a more than 20% fall in the value of the pound turns out to have been enough to do the job:

U S U K Foreign Exchange Rate FRED St Louis Fed

However, is there any other high card in the hole that can make use forecast that British economic growth in the five years post-vote will be as fast as or faster than in the counterfactual in which the BREXIT vote went the other way? Yes–if Britain reverses itself and abandons the BREXIT project. Otherwise? I cannot see any. Untangling value chains is expensive. And the untangling will end with less productive value chains than Britain has now. You can argue–and I do–for a less financialized Britain in which government does much more to nurture and support communities of engineering practice and excellence. But BREXIT looks to me like a uniquely stupid and destructive way to set about such a policy shift. And I cannot imagine the clowns who run Britain’s Conservative and Unionist Party today having any clue as to how to accomplish such.

So put me on record as strongly supporting Britain’s Office of Budgetary Responsibility against all of its enemies and critics–including the extremely sharp [William Munchau[]:

Simon Wren-Lewis: Hitting Back: “A reaction to reading this [by Wolfgang Munchau][]…

…A more serious incident was the forecast by the Office for Budget Responsibility in the UK, which said last week that Brexit would have severe economic consequences. Coming only a few months after the economics profession discredited itself with a doomy forecast about the consequences of Brexit, this is an astonishing reminder of the inadequacy of economic forecasting models. The truth about the impact of Brexit is that it is… beyond the ability of any human being to forecast and almost entirely dependent on how the process will be managed…

Shrug your shoulders and move on? If it had appeared in the partisan press that would be a sensible reaction, but this was written by a widely respected journalist in the UK’s internationally renown financial newspaper… written by someone whose knowledge on the Eurozone is beyond dispute and whose views I often agree with.

Well, on this occasion, this particular member of a discredited profession who is no longer apparently considered an expert on macroeconomics is not prepared to take this kind of stuff anymore, whoever it may come from…. No journalist has any excuse nowadays for misunderstanding the probabilistic nature of forecasts (Bank of England fan charts)…. Macro forecasts… exist because it is worth being slightly better than guesswork when the stakes are so high….

In the Brexit campaign… our collective knowledge about the impact of trade restrictions was treated as just one more opinion, or described as Project Fear…. To have the nerve to blame economists for the Brexit result, to suggest that using their knowledge was a ‘tactical mistake’, to imply that the OBR should pretend they know nothing about Brexit, all that is itself amazing malevolent chutzpah. But it goes beyond audacity to criticise a profession and subject matter you appear not to understand when it is this lack of understanding that has contributed so much to the damage over the last few years.