When I was working in the Treasury in 1993, I was struck by how much it was the case that President Bill Clinton was still the ex-Governor of Arkansas, and that arguments that would have been powerful and important when directed at a Governor of Arkansas still resonated in his mind much more strongly than they perhaps should have if they were evaluated purely on technocratic grounds.
Arkansas, remember, was a small, poor state, heavily dependent on coupon-clipping from the Walton family and on the ability of Tyson Chicken to export to other states as its engines of economic growth. Those put constraints on Arkansas and make certain factors salient for Arkansas in ways that do not apply to the country as a whole.
Donald Trump has been a real estate developer–and a failed casino manager. The same where-he-comes-from-determine-which-arguments-resonate should apply here.
There thus ought to be an elective affinity between Donald Trump and proper technocratic fiscal policy: he ought to be very responsive to the very strong case for a real and substantial infrastructure construction-led fiscal expansion–and remember that investing in the human capital of twelve year olds is a very durable piece of infrastructure indeed. The math that shows that at current interest rates borrow-and-build is indeed a no-brainer for the economy is math that ought to be very familiar to Donald Trump.
And he ought to be very responsive to the Yellen caucus in the Federal Reserve. Very much like Reagan in 1980, Donald Trump has been told and from personal experience knows very different things about the Federal Reserve. by some that we need rigid Taylor Rules and has been told by others that we need a Gold Standard, but he also knows that high interest rates kill real estate values, real estate deals, and the solvency of real estate developers. Reagan’s goldbug and loose-money staffers fought each other to a standstill, and Volcker was left alone to manage the economy as best he could. There is a potential fight between the Donald Trump who develops real estate and the Donald Trump who wants to be a good Republican fighting for Republican causes he doesn’t really resonate with. My bet is that, if the issue can be properly framed, the valid technocratic arguments for loose money will prevail inside Donald Trump’s head, given the natural elective affinity with his past career.
And there is much to be done here…
One of my proudest moments was when, back in 1992, Larry Summers and I egged each other on to tell the Federal Reserve at Jackson Hole that, given the magnitude of recessionary shocks and the vulnerability of an economy to the zero lower bound, it was too hazardous to try to push the average inflation rate much below 5%/year. Great call. Completely correct. Totally ignored. One that I am very proud of.
But a 2%/year inflation target was set in stone for the U.S. by Alan Greenspan in the 1990s. Thereafter the Federal Reserve system fell in line and coalesced around finding reasons why that target was a good thing–not analyzing whether it was in fact a good thing.
It is now clear that it is not a good thing: shocks are too large. Perhaps the 2%/year target was appropriate if the Great Moderation was permanent. It wasn’t. We have radical uncertainty of many kinds, and a 2%/year target will have us slam into the zero lower bound appallingly often. The target inflation rate should be raised to 4%/year.
The only argument for keeping the 2%/year inflation target is that it helps build the Federal Reserve’s credibility. But the credibility that comes from doing stupid things consistently and persistently is not the kind of credibility you want to build or have, is it? It is important that people trust your promises. But the promises that you want to make and that you want credibility for are promises that you will do the right and smart thing–not the wrong and dumb thing–and thus that you will correct policies that turn out to have been clearly mistaken.
Germany does not have the rise of the overclass. And Germany does have the wage stagnation–even though it is done everything right to preserve manufacturing employment and nurture communities of engineering practicing excellence.
Can I take the Germany-U.S. comparison as strong evidence against the “globalization has driven wage stagnation” hypothesis?
Hmong Americans are less likely than the average American to have a household income over $50,000, be employed, or be a college graduate. But the livelihoods of these families, which originally hail from Southeast Asia and mostly migrated to the United States at the end of the Vietnam War, get lost in the aggregated data provided by local, state, and federal agencies. The reason: More than 17 million members of nearly 50 different races and ethnicities are generally categorized as a monolithic group—Asian Americans and Pacific Islanders.
When it comes to economic success in the United States, Asian Americans and Pacific Islanders are often pointed to as the exemplary achievers, or more stereotypically, the “model minorities.” But the rosy narrative that all the members of this group are relatively homogenous and successful puts many of these communities, such as Hmong Americans, at substantial risk of being underserved by their local, state, and federal governments.
Aggregated data for all Asian Americans and Pacific Islanders’ socioeconomic indicators, such as median income, employment rate, and educational attainment, helps to preserve ethnic-based inequities among many sub-groups in this catch-all category. Taking a closer look at the data through detailed race and ethnicity categories provided by the U.S. Census Bureau’s American Community Survey, we find a different story: Asian Americans and Pacific Islanders in the United States are richly diverse, and so too are their socioeconomic experiences. Through a series of four chart-based examples, this brief details how data disaggregation matters for Asian American and Pacific Islander communities.
1.
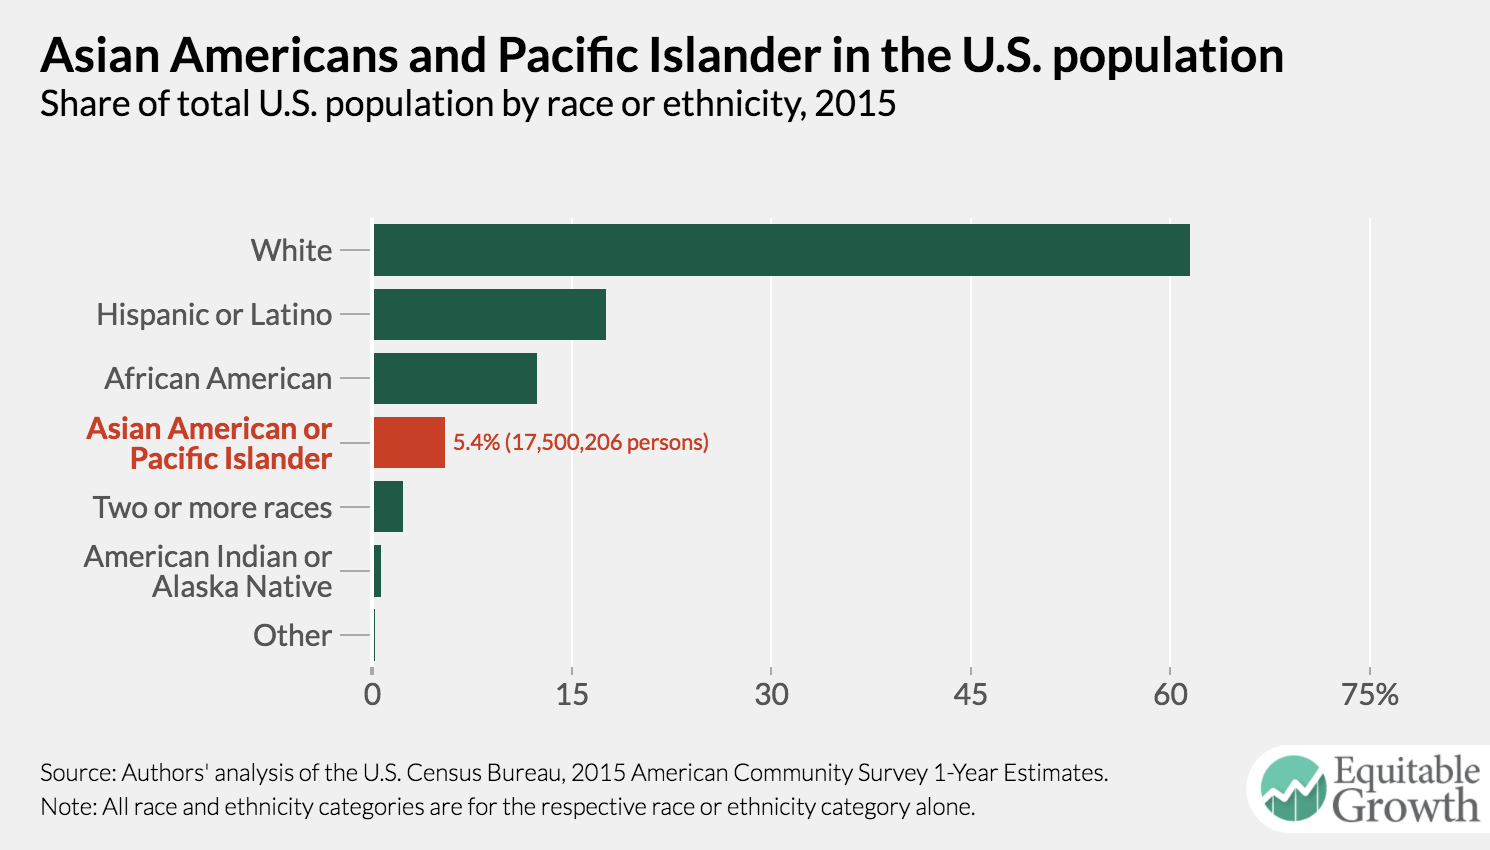
Asian Americans and Pacific Islanders are a small but diverse part of the U.S. population
Currently, there are more than 17 million Asians and over 500,000 Pacific Islanders in the United States. Although they make up only 5.4 percent of the U.S. population—a number that is projected to grow to 9.3 percent by 2060—they are composed of more than 50 different ethnic groups, speaking hundreds of different languages.
Though we don’t necessarily have data on every single ethnicity among all Asian Americans and Pacific Islanders in the United States, a cursory breakdown of their population by ethnic group or national origin reveals how diverse, and complex, the term actually is.
Breaking down the Asian American and Pacific Islander population in the United States
Use this interactive to explore the diversity of the share of the population in the United States comprised of Asian Americans and Pacific Islanders. Start by hovering over each circle.
disaggregating asian/PI
Unpacking Asian Americans and Pacific Islanders by detailed ethnicity or region of national origin yields at least four groups of Asians (East, Southeast, South, and other Asians) and four groups of Pacific Islanders (Melanesians, Micronesians, Polynesians, and other Pacific Islanders). These regional categorizations can be broken down even further. East Asians, for example, include people of Chinese, Japanese, Korean, Mongolian, Okinawan (not featured), and Taiwanese descent. East Asians also happen to be the largest population group within the category of Asian Americans as measured by the American Community Survey (about 1.96 percent of the U.S. population), driven by a large share of people of Chinese ethnicity (approximately 1.23 percent of the U.S. population). Polynesians (which include Native Hawaiians, Samoans, Tongans, and other smaller groups that aren’t captured in the American Community Survey data) are the largest group of Pacific Islanders but only make up about 0.09 percent of the U.S. population.
Disaggregating the race and ethnicity of Asian Americans and Pacific Islanders cuts an already small minority group into even smaller factions. Yet it simultaneously reveals the extent of cultural heterogeneity within the group. This diversity has significant implications for the lived experiences of different members of these many communities, which is why aggregate statistics on their socioeconomic health—and other indicators, for that matter—often mask more than they reveal.
2.
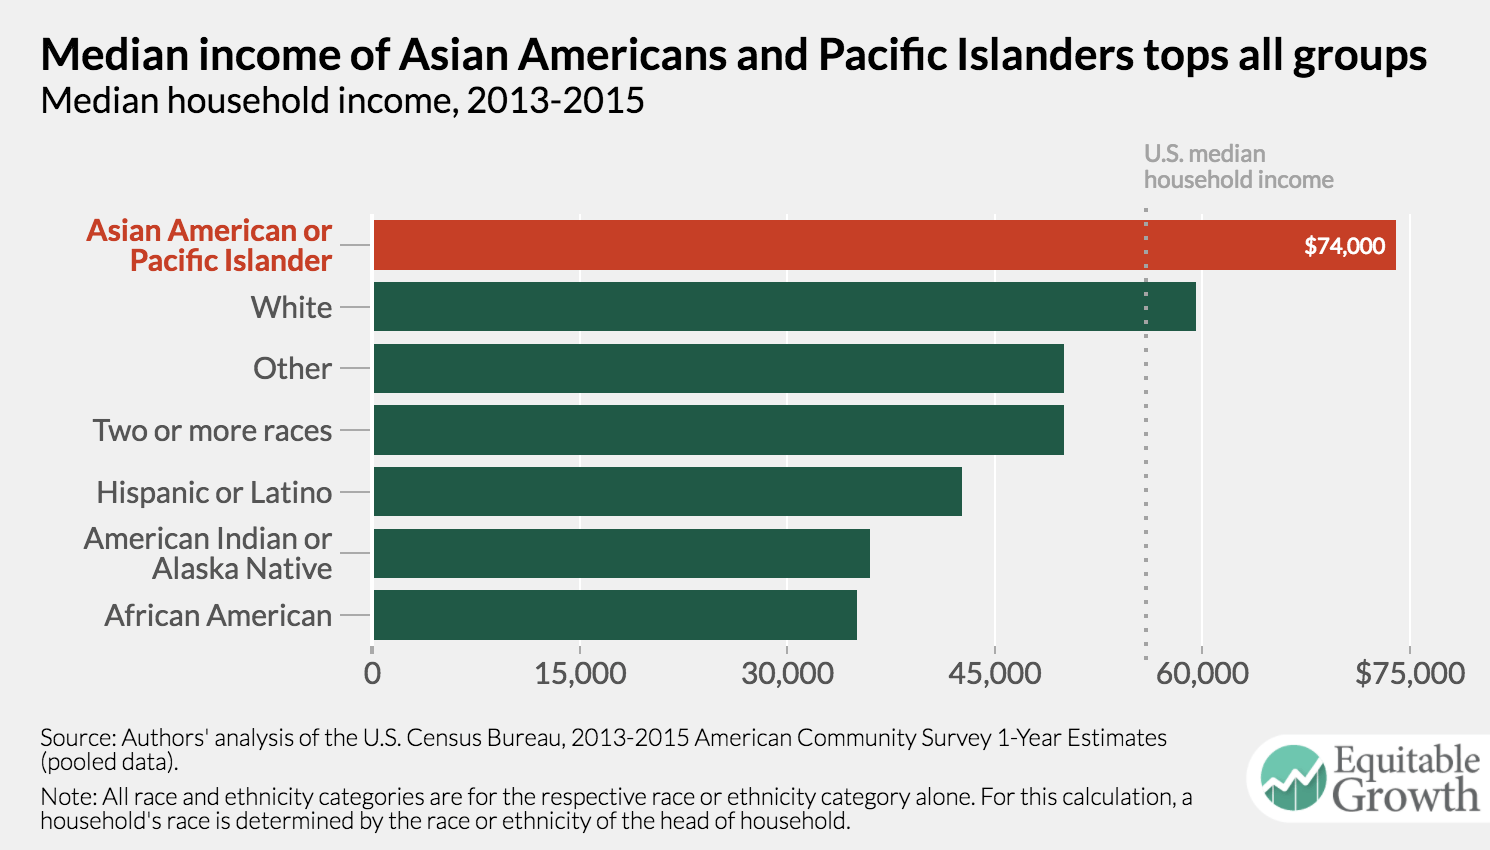
Asian Americans and Pacific Islanders boast highly variable income levels that are invisible in aggregated data
Household income is perhaps the most frequently used barometer of socioeconomic health. In 2015, the national median household income was $55,775. By comparison, Asian American and Pacific Islander households had median household incomes of $74,000.
When aggregated, these households earned $14,000 more than even the typical white family and appear to have more than double the median income of the two lowest-earning groups, American Indians and Alaska Natives and African Americans. It’s also important to note that Asian Americans and Pacific Islanders are the most likely group to have three or more working individuals per household, meaning that the aggregate data may be skewed to suggest these households are wealthier than they are.
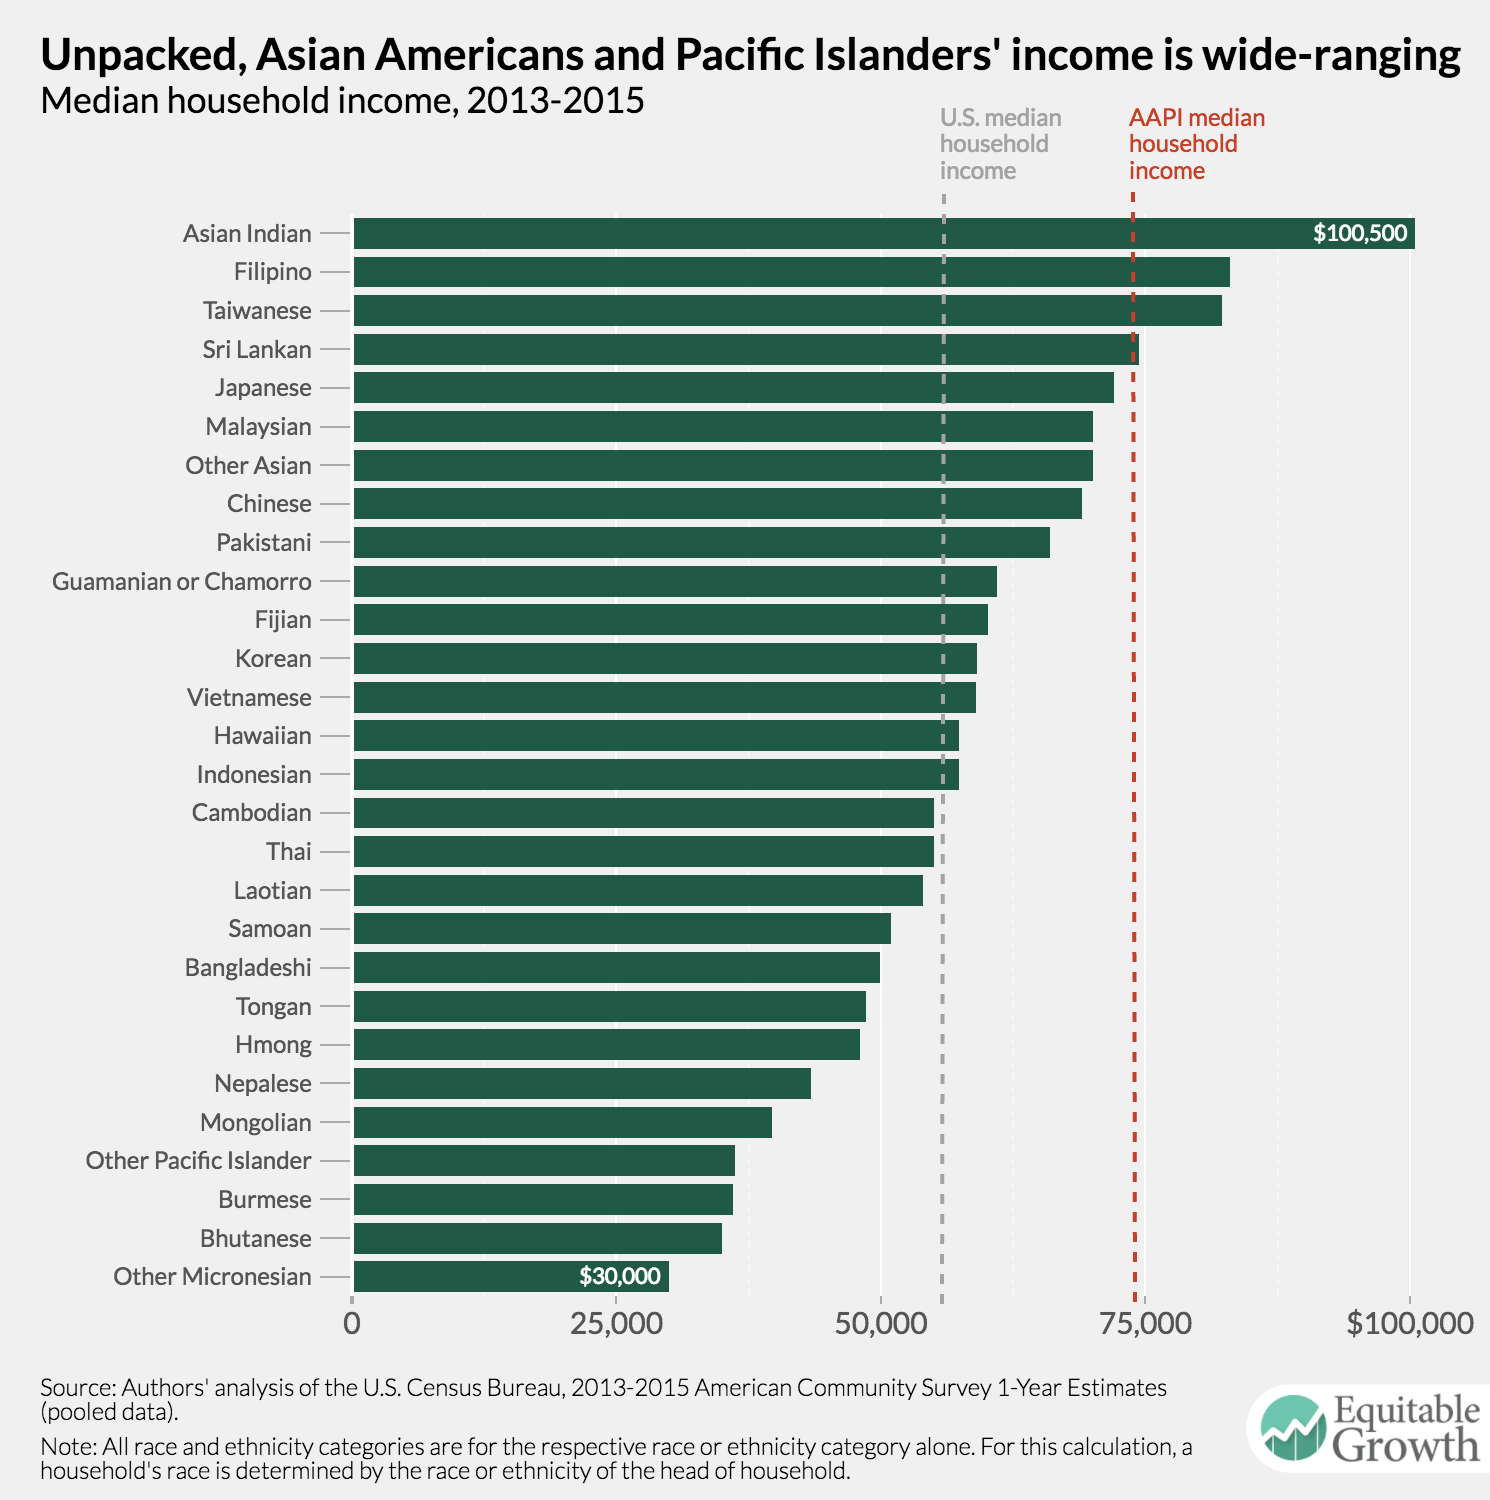
Data for different ethnic groups within this broad category, however, show that income differences are as big as they are between Asian Americans and Pacific Islanders and other broad racial and ethnic groups. In fact, the median household income for Asian Americans and Pacific Islanders spans a range of $70,000, with the typical Asian Indian household bringing in $100,500 at the top and the typical unspecified Micronesian household earning $30,000. A little under half of the detailed Asian Americans and Pacific Islander groups have a smaller median household income than the U.S. median, and only four groups (Sri Lankans, Taiwanese, Filipinos, and Asian Indians) have a median income above that of all Asian Americans and Pacific Islanders.
The sizable variance in income across different households within the broader community of Asian Americans and Pacific Islanders makes it challenging to discern any meaningful patterns in the data, but it is important to note that a majority of the East Asian and South Asian ethnic groups in the United States have relatively high median household incomes. Among those with the lowest median household incomes are groups with large refugee populations that have been recently resettled in the United States.
3.
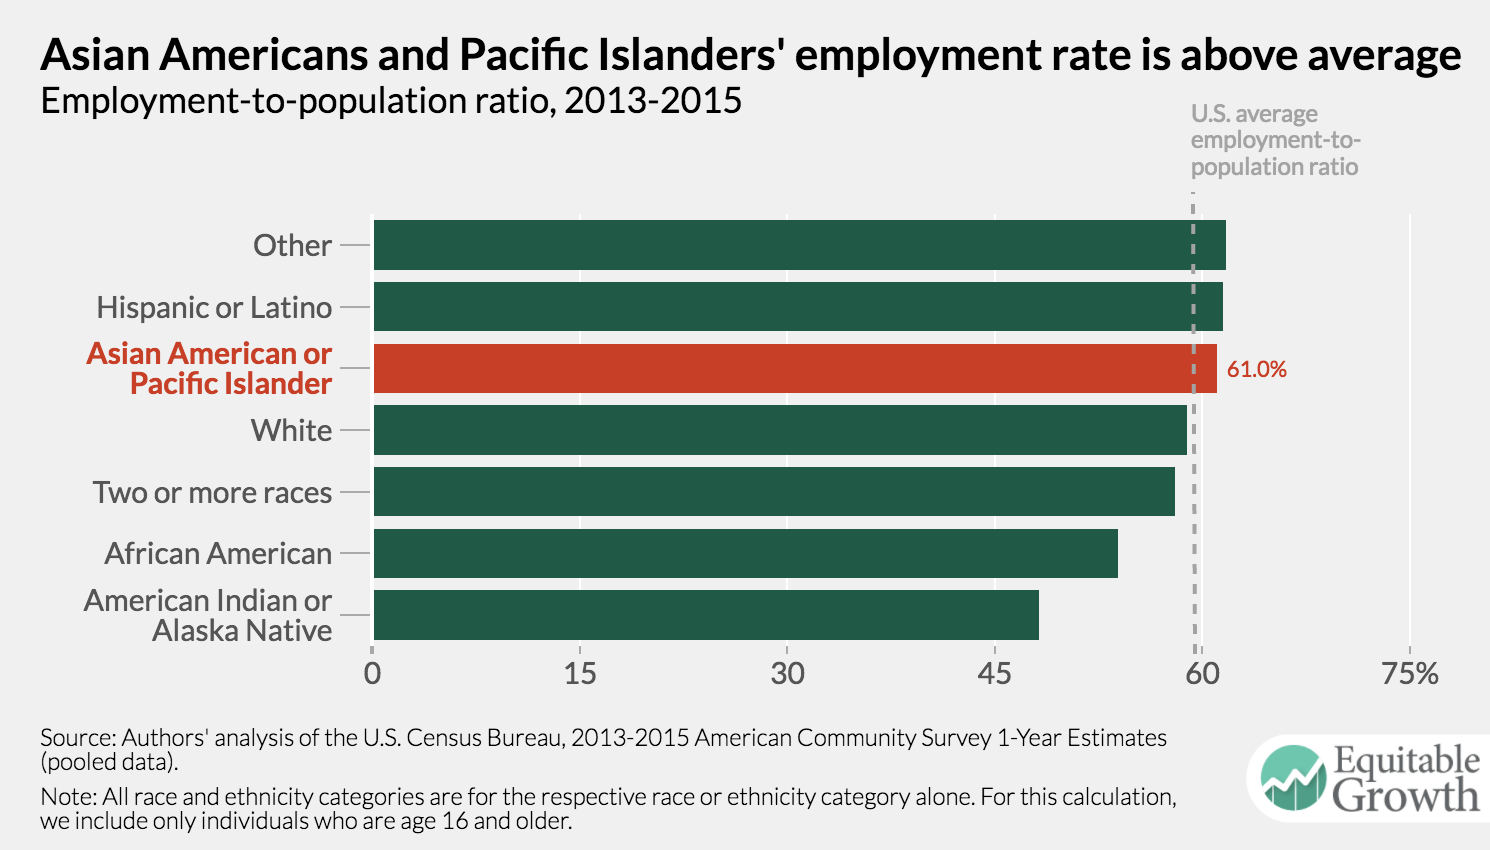
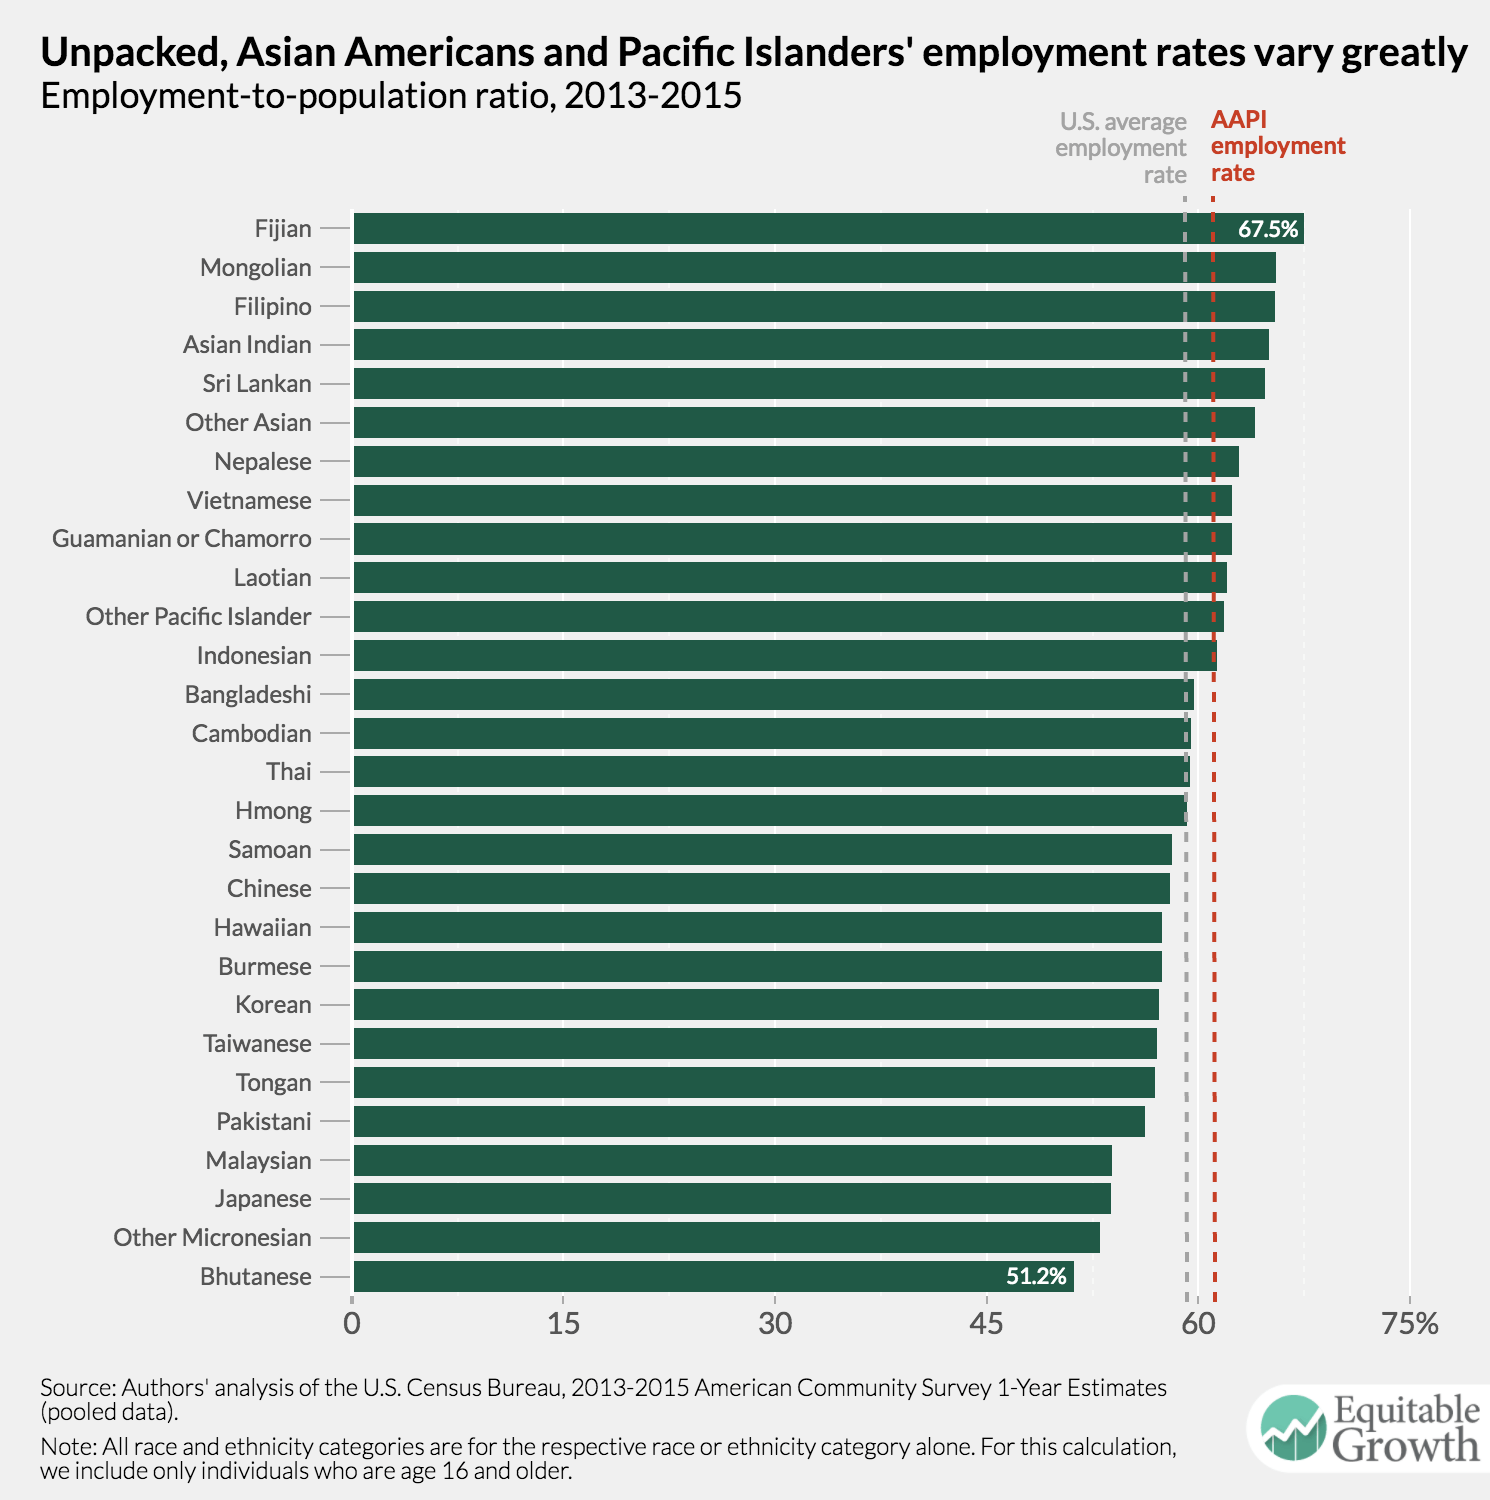
Employment rates for Asian Americans and Pacific Islanders range from 51.2 percent to 67.5 percent
Another way to measure socioeconomic wellbeing is whether a person has a job. In the United States, on average, about 59.0 percent of the population age 16 and above is employed. For Asian Americans and Pacific Islanders, the employment-to-population ratio is slightly better, averaging to 61.0 percent between 2013 and 2015.
While the “other” race category (comprised of a variety of respondents to this survey who choose the “other” category for an equally varied array of reasons) and Latinos have the highest employment rates—61.7 and 61.5 percent, respectively—Asian Americans and Pacific Islanders still have a higher employment-to-population ratio than whites (58.9 percent), multiracial people (58.0 percent), African Americans (53.9 percent), and American Indians and Alaska Natives (48.1 percent).
Yet a more detailed look at the employment rate of Asian Americans and Pacific Islanders demonstrates that the employment-to-population ratio greatly varies within this broader community. Fijians (67.5 percent), Mongolians (65.5), Filipinos (65.4), Asian Indians (65.0), and Sri Lankans (64.7) have the largest employment rates. Pakistanis (56.2), Malaysians (53.9), Japanese (53.8), unspecified Micronesians (53.0), and Bhutanese (51.2) have the lowest employment rates.
It is difficult to pinpoint what mechanisms drive these differences in employment-to-population ratios among these Asian American and Pacific Islander communities. Some factors that may influence the variation include high rates of linguistic isolation among certain sub-groups, differences in immigration history, the average age of immigration, and gender norms. Yet with about half of all Asian American and Pacific Islander groups registering an employment-to-population ratio below the national average suggests that the aggregated data makes invisible the socioeconomic realities of many these families.
4.
Aggregated Asian American and Pacific Islander provides a skewed story about educational attainment
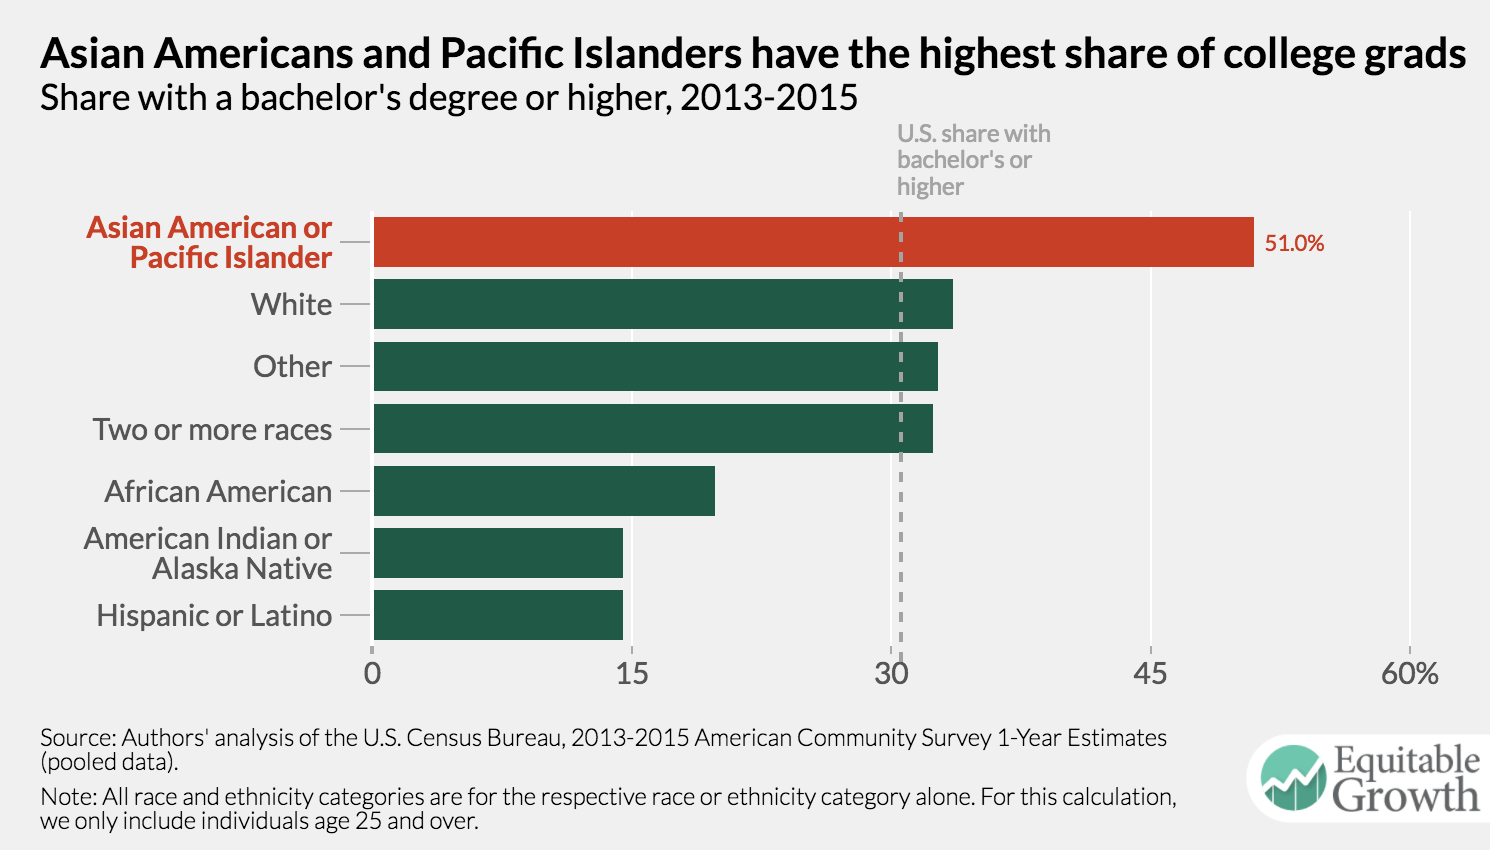
Varying levels of educational attainment can in part explain varied household incomes and employment rates among Asian Americans and Pacific Islanders. Nationally, about 30.6 percent of the U.S. population has a bachelor’s degree or more. In contrast, 51.0 percent of Asian Americans and Pacific Islanders hold a bachelor’s degree or higher.
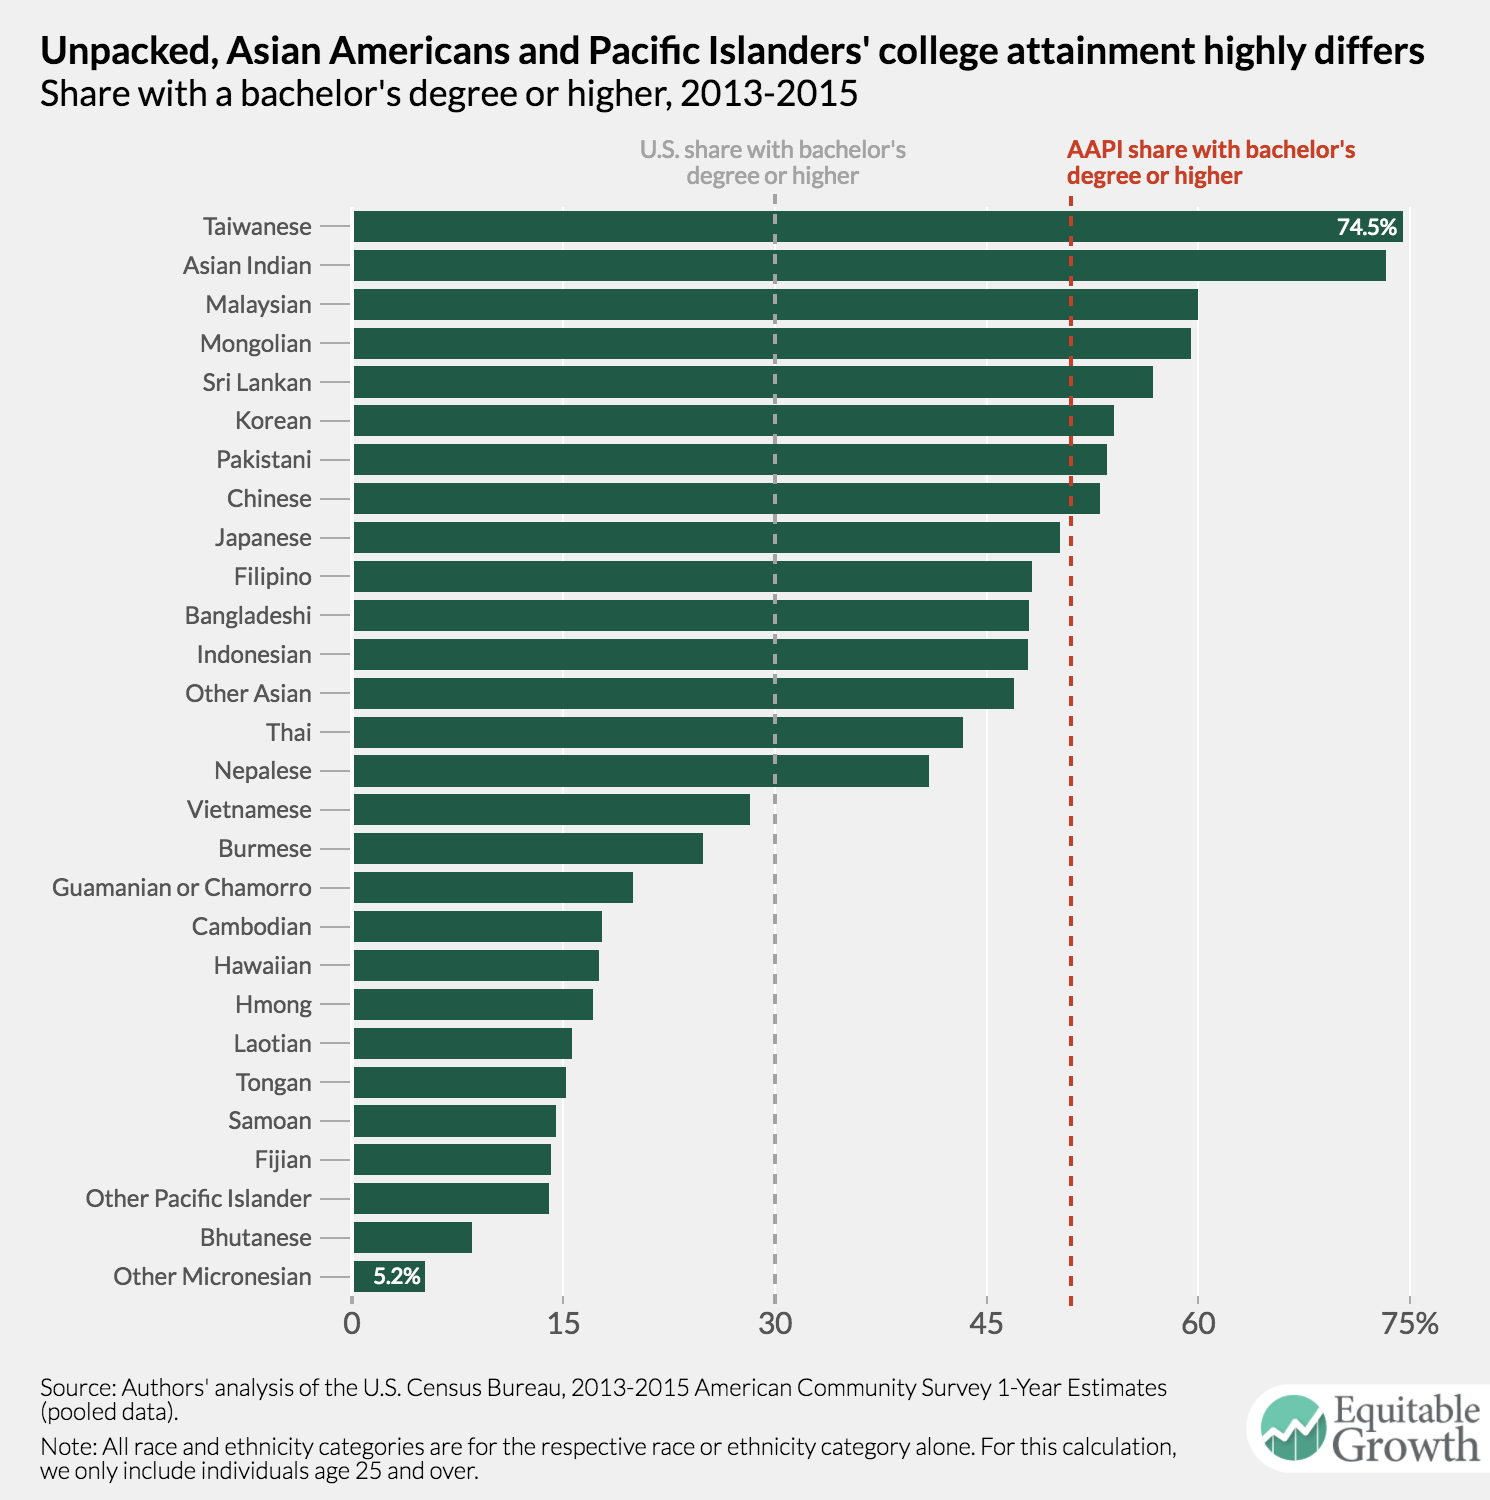
On the whole, Asian Americans and Pacific Islanders have outstanding educational attainment, surpassing every other racial or ethnic group by wide margins. On average, they have 3.5 times the educational attainment of Latinos and American Indians and Alaska Natives, 2.5 times the educational attainment of African Americans, and about 1.5 times the educational attainment of whites. But this high level of educational attainment is attributed to only a select group of Asian Americans and Pacific Islanders. A detailed look at educational attainment by race and ethnicity subcategories shows that rates of college completion range over 69.4 percentage points within the broader Asian American and Pacific Islander group.
Taiwanese have the greatest share of people with a bachelor’s degree or more (74.5 percent). Asian Indians are a close second, with 73.3 percent of the 25 and over population holding a bachelor’s degree or more. Aside from these two groups, Americans of Malaysian, Mongolian, Sri Lankan, Korean, Pakistani, and Chinese descent all have higher college completion rates than the average among Asian Americans and Pacific Islanders.
At the same time, about 13 of these U.S. ethnic and racial sub-groups have lower educational attainment rates than the U.S. average. Unspecified Micronesians have the lowest share of people with a college degree or greater (5.2 percent). This population, along with Bhutanese, other Pacific Islanders, and Fijians, has lower educational attainment levels than Latinos, who, among the major race and ethnic groups, have on average the lowest share of people with a college degree or more. Vietnamese, Burmese, Guamanians (also known as Chamorros), Cambodians, Hawaiians, Hmong, Laotians, Tongans, and Samoans are also on the lower-end of college educational attainment.
The patterns in disaggregated educational attainment among Asian Americans and Pacific Islanders display a clearer story than those found in household income and the employment rate. Generally, immigrants who come to the United States for employment—such as East and South Asians—have better educational attainment outcomes than their counterparts from Southeast Asia. And Pacific Islanders have levels of education much more comparable to African Americans, American Indians and Alaska Natives, and Latinos. Aggregated educational attainment data significantly distorts this picture.
Data disaggregation matters for Asian Americans and Pacific Islanders
Household income, employment rates, and educational attainment make up only a small part of broader socioeconomic state of Asian Americans and Pacific Islanders, yet these three measures help identify an important theme: Regardless of what socioeconomic variables we dissect, across the board, Asian Americans and Pacific Islanders from different groups have notably different experiences. Research increasingly shows that this theme is evident across other dimensions, too, such as social, physical, and mental health as well as civic participation.
In order to further this research, however, disaggregated categories need to be made available in U.S. administrative data. In fact, a proposed revision of the Standards for Maintaining, Collecting, and Presenting Federal Data on Race and Ethnicity by the federal Office of Management and Budget could certainly improve the quality and granularity of all data collected on Asian Americans and Pacific Islanders. Although there are valid concerns about what a disaggregation revision means for privacy in data and sample sizes for analysis, refined ethnicity categories can ensure that the data don’t obscure what they are meant to enlighten. It may even be possible to address some of these concerns about disaggregation by using national origin regions for Asian Americans and Pacific Islanders if more detailed categories compromise the data’s integrity. It’s valuable to note, though, that data collected at highly disaggregated levels can always, if necessary, be aggregated after refined collection to protect privacy.
Ultimately, having disaggregated data about Asian Americans and Pacific Islanders is the most effective way to form evidence-based policy around the distinct needs of these diverse communities and identify unique barriers to access of services and resources at the local, state, and federal level. Using disaggregated data can also help policymakers develop substantial quantitative stories about the challenges these communities face as they continue to become a larger part of the broad U.S. social fabric. More detailed data that highlights this diversity can better guide the creation of inclusive and equitable policies for all Americans.
American Community Survey data used in this post is from IPUMS-USA, University of Minnesota, www.ipums.org.
Should-Read: I would note that Simon Wren-Lewis endorses 95% of what Ann Pettifor says–as long as the target is not “mainstream macroeconomics” but rather what Simon calls “media macro”…
Simon Wren-Lewis: Ann Pettifor on Mainstream Economics: “Unfortunately her piece is spoilt by a final section that is a tirade against mainstream economists which goes way over the top…
…Let me just go through the factual errors.
Economists dictated the terms for austerity that has so harmed the British economy and society over the past ten years.
The only support she gives for this statement is the 20 economists who signed a letter to the Times on 14th February 2010. She neglects to mention that 58 equally notable economists signed a response in the Financial Times on 18th February arguing the 20 were wrong. Austerity has always been a minority view among academic economists, a minority that has got smaller over time.
Of course those that signed the first letter, and in particular Ken Rogoff, turned out to be a more prominent voice in the subsequent debate, but that is because he supported what policymakers were doing. He was mostly useful rather than influential.
As the policies have failed, the vast majority of economists have refused to concede wrongdoing, nor have societies been offered alternatives.
In the case of the 20 economists who signed that letter, nearly half did revise their views just two years later. More importantly, for the last few years pretty well every macroeconomist of note, including Ken Rogoff, has advocated a substantial increase in public investment. So this sentence, in so far as it relates to austerity, is almost as wrong as it could be
[On Brexit] All the heavyweights of the economics profession… were wheeled out to warn the British people of economic facts known, and understood apparently, only to ‘experts’… But the ‘experts’ and the economic stories they tell have been well and truly walloped by the result of this referendum. And rightly so, because while there is truth in the story that international and in particular European cooperation and coordination are vital to economic activity and stability, there is no sound basis to the widely espoused economic ‘religion’ that markets—in money, trade, and labour—must be unfettered, detached from democratic regulatory oversight, and must be left to ‘govern’ whole countries, regions, and continents.
Where did these heavyweights talk about “economic facts known, and understood apparently, only to experts”? When they were given the chance, they explained the common sense idea that trade would suffer if we left the EU because it is easier to trade with your neighbours, and the easy to understand empirical findings that more trade increases productivity and therefore economic growth. There is no religion involved at all, but rather statistical evidence. If you are looking for religion, you need to focus on the handful of economists supporting Brexit, who really did believe that it could usher in a neoliberal nirvana….
When Ann talks about the failings of economists related to the financial crisis she has a point, but it is one that she grossly exaggerates. Economists hardly “led the way to the re-regulation and ‘liberalization’ of the finance sector over the past 40 years”. The way was led by the financial sector itself. If more economists had backed up rather than dismissed Rajan’s warnings in 2005, I doubt if anything would have changed…. I think the same point applies to globalisation. Most economists have certainly encouraged the idea that globalisation would increase overall prosperity, and they have been proved right….
There is a regrettable (but understandable) tendency by heterodox economists on the left to try and pretend that economics and neoliberalism are somehow inextricably entwined. The reality is that neoliberal advocates do use some economic ideas as justification, but they ignore others which go in the opposite direction. As I often point out, many more academic economists spend their time analysing market imperfections than trying to show markets always work on their own. They get Nobel prizes for this work. I find attempts to suggest that economics somehow helped create austerity particularly annoying, as I (and many others) have spent many blog posts showing that economic theory and evidence demonstrates that austerity was a huge mistake.
…It sounded like great news when Carrier said last week that it would invest millions in the Indiana plant it decided to keep in the U.S… a $16 million investment in the facility. But… most of that money will be invested in automation…. “We’re going to…automate to drive the cost down so that we can continue to be competitive,” he said on an interview on CNBC earlier this week. “Is it as cheap as moving to Mexico with lower cost labor? No. But we will make that plant competitive just because we’ll make the capital investments there. But what that ultimately means is there will be fewer jobs.”
The decision to keep Carrier’s furnace manufacturing operations in the U.S. instead of moving them to Mexico will save about 800 jobs out of the 1,400 at the plant, at least in the near term. The company declined to say how many of the plants 800 remaining jobs could be lost to automation, or when…
The worst possible “structural reform” program is one that moves a worker from a low productivity job into unemployment, where they then lose their weak tie social network that allows them to get new jobs. They then get used to sitting in their sisters’ basement splaying video games and surfing the internet all day. “Structural reforms” are extremely dangerous unless you have a high-pressure economy to pull resources out of low productivity into high productivity sectors.
The view in the high councils of Europe is that, when there is a high-pressure economy, politicians will not press for “structural reform”: there is no obvious need, and so why rock the boat? Politicians kick every can they can down the road, and you can only try “structural reform” when unemployment is high–and thus when it is likely to be ineffective if not destructive.
I don’t think this view is correct. But this is the view–in Europe. This creates a very difficult political economy puzzle for Europe. I really do not have any sort of solution.
Quite possibly we should simply drop “structural reform”. Most of the time, “structural reform” means policies that reduce the size of unproductive sectors and in the process create significant numbers of substantial losers. That is why people call it “structural reform” rather than some other, more properly descriptive phase.
We can (almost) all get behind “reduce product market monopoly power”. We can (almost) all get behind “reduce NIMBYist constraints on land development”–provided, that is, we can agree which restraints are and which are not NIMBYist. Calling those part of the suspicious portmanteau of “structural reform” does not materially aid their cause. We should drop the phrase “structural reform” in the interest of clarity about just what we are planning to do.
Should-Read: Where a high Tobin’s Q–ratio of stock market value to replacement cost–is driven by market power, we would not expect high Q to carry high investment with it. But how much has market power increased? And how much shadow market power is driven by common ownership by financiers of all the firms in any particular industry? Or do financiers simply prefer low-investment firms because they are high-payout firms, and thus firms’ cash flows are of relatively short duration?
Nick Bunker: What Could Boost U.S. Business Investment?: “German Gutierrez and Thomas Philippon… why business investment… has been so lackluster since the turn of the 21st century…
…The Q [ratio of stock market value to replacement cost] for overall business investment in the United States is, on average, signaling that business investment should be much higher…. They don’t find any evidence that firms lack… financing…. The biggest explanatory factors… is the increasing concentration of companies within industries and increased “common ownership” of companies by large investment firms. These “commonly owned” companies… use these their funds to finance share buybacks and other shareholder payouts… http://www.nber.org/papers/w22897.pdf
Should-Read: Brad DeLong (2009): Who Are the Foes of Expansionary Fiscal Policy? And Why?: “I am finding it difficult to make progress because it is not clear to me who the audience… who we should be trying to convince of what…
…So let me… spend tonight telling you… what I think others think… [for] I am having trouble in wrapping my mind around the thinking of the intellectual adversaries of my little band, my Light Brigade of believers that fiscal policy right now is not expansionary enough. I am having a hard time figuring out not who our intellectual adversaries are–we know who they are–but how and why they think. What is the case they want to make against the aggressive use of expansionary fiscal policy right now, given the very sad state that the OECD economies are in?…
Paul Samuelson (1962): On Karl Marx: “Marx, like any man of keen intellect, liked a good problem; but he did not labor over a labor theory of value in order to give us moderns scope to use matrix theory on the “transformation” problem…
Noah Smith: A Job Is More Than a Paycheck: “I’ve believed that what mattered most for economic well-being was money…
Should-Read: Noah Smith: A Job Is More Than a Paycheck: “I’ve believed that what mattered most for economic well-being was money…
…I’ve supported lots of policies aimed at boosting the amount of money in the average person’s pocket. I’ve called for Japan to liberalize its markets, and for the U.S. to encourage workers to move to places with better opportunities. And I’ve often assumed that a dollar of government redistribution is just as good as a dollar of wages. I’m starting to think I… ignore[d] a big, important source of economic well-being: jobs…. Most people probably care not just about the amount of money they get, but how they get it. If they see themselves as having earned their daily bread, they feel better about themselves than if they got a handout. A job also probably has an important symbolic value–it sends a message that society cares about you and has a place for you….
What kind of concrete plans would address Americans’ hunger for jobs? An easy step is to promote demand-based policies that keep employment high, like fiscal stimulus. A more drastic measure would be a federal job guarantee…. It’s probably better to have unemployed people doing something marginally useful…. Perhaps the deepest change would be to tweak U.S. corporate culture, restoring the value of long-term employment…. Tax incentives for long-term labor contracts, or for labor hoarding during recessions, could put the government’s thumb on the scale in favor of employment over pure dollars. Whatever policies are appropriate, it’s clear that economics pundits and policy wonks need to shift our thinking a bit…