Discussions today are pervasive among economists and policymakers about the increasing rise of firms’ market power and the potential negative effects of that power on the U.S. economy. Of particular concern is the rise of new technologies and the dominance of platform giants—such as Amazon.com Inc., Alphabet Inc.’s Google unit, Apple Inc., and Uber Technologies Inc., among others—which are not improving the U.S. socioeconomic landscape by reaping gains from potential economies of scale, but rather are throwing around their weight to suppress wages, raise prices on consumers, and enter the political arena to ensure the federal government allows the U.S. economy to continue on the path of market consolidation.
Many economists point to this disconcerting rise in market power as leading to a simultaneous rise in monopsony power—the ability of the firm to have an influence over the determination of workers’ wages—which may contribute to the persistence of stagnant wages despite relatively low headline unemployment numbers in recent times. This is in stark contrast to decades of research and modeling in economics following the so-called marginalist revolution in the discipline, which resulted in most economists simply treating monopsony power as a special case only existing in the now long-gone company towns of Homestead, Pennsylvania, and Pullman, Illinois, of the 19th century or in highly concentrated island economies of introductory economics textbooks.
Recent empirical investigations into U.S. labor markets no longer allow reasonable economists to bury their heads in the sand about market power and assume that workers’ wages are simply equal to the value of their marginal product or service. There’s now insurmountable evidence that monopsony power is prevalent throughout the U.S. economy, though the degree to which it may contribute to widening income inequality and underemployment remains an open question. These findings imply that employers can siphon off “rents”—economic parlance for excessive profits beyond the cost of production—from workers through the exercise of monopsony power. These findings are the complete opposite of the dynamic formulated in most current labor market models.
In our new Washington Center for Equitable Growth working paper, “Monopsony and Collective Action in an Institutional Context,” we seek to better understand the theoretical implications of this new and growing empirical literature on monopsony power and the resulting lower wages for workers. We construct a monopsony-wage model that integrates the strategic interaction between workers and employers in the wage-setting process into an institutional context where we consider the support, or lack thereof, of institutions such as the government and the courts for workers, as opposed to firms.
To better understand these ideas, we construct a labor market model with monopsony power as the starting point and workers’ collective action as a form of countervailing power. Borrowing the term countervailing power from the late economist John Kenneth Galbraith, we use it to represent the fact that workers’ collective action can act as an alternative to the regulation of labor markets to improve socioal efficiency, though the two should certainly be thought of as complements.
By taking monopsony power as the starting point, we paint a very different picture than the traditional Econ 101 understanding of labor markets. Our model leads to a reconceptualization of some of the important dynamics within labor markets, with significant implications for how economists understand many important outcomes such as the current rise in income inequality, the trajectory of strike activity, and in clarifying the role of unions with regard to the overall social efficiency of labor markets.
One of the main findings of our work is that unions, and collective labor action in general, are rent-reducing and efficiency-enhancing when monopsony power is present. Essentially, collective action neutralizes, to some degree, the wage-setting power of firms by reducing the rent that firms siphon from workers via their wage-setting power. Increases in wages may reduce profits but will decrease rents. This is completely contradictory to how most economists conceive of workers’ collective action, which they see as costly and rent-seeking. But this misplaced view is contingent on the starting point of whether monopsony power exists.
Recent empirical work that shows firms have wage-setting power led us to use monopsony power as the starting point, completely re-centering the role of collective action from one of rent-seeking to rent-reducing. A natural conclusion from this starting point and our subsequent findings is that the U.S. economy needs more unions, and we certainly do. But unions don’t exist in a vacuum. Understanding the potential effects of the institutional setting in which they operate, including the government and the courts, how workers collective action takes place is critical to understanding how to build a more equitable and just labor market.
Institutional support for workers in the United States used to range from judicial backing of unions in the early 19th century to statute legislation that protects workers collective bargaining activity such as the National Labor Relations Act, and including social norms that prescribe, at least to a degree, certain anti-union activities such as the usage of permanent replacement workers during economic strikes in the mid-20th century. Today, more recent court rulings and government regulatory action do not support workers. A recent example of a major rollback of institutional support of unions can be seen in the Janus v. American Federation of State, County, and Municipal Employees case, where the U.S. Supreme Court devastated public-sector unions by ruling that these unions may not charge nonmembers “agency fees” for contract negotiation and other services that affect all employees in the same workplace.
Of course, there are other examples reaching beyond unions such as the courts and policymakers allowing the proliferation of noncompete clauses to further hamstring workers. But when we built institutional support into our model, we found that when the government is more supportive toward laborers, then workers will engage in more collective action. This is because greater levels of support from government or the courts increases the probability of labor winning from collective action, which then leads to more collective action taking place. As a result, firms have a greater catalyst to raise wages as they seek to reduce workers’ wage-setting activities.
In contrast, we also find that a lack of institutional support will devastate unions’ ability to function as a balance to firms’ monopsony power, potentially with major consequences. And as things stand today, the balance of power between workers and their employers pertaining to institutional support rests with big business rather than workers. In turn, we find that labor market outcomes will be less socially efficient, and a portion of the current rise in income inequality in the United States over the past four decades partially stems from the wages of many workers being pushed below the value of the marginal product. In other words, firms are pushing wages to artificially low levels by leveraging their power over their workers.
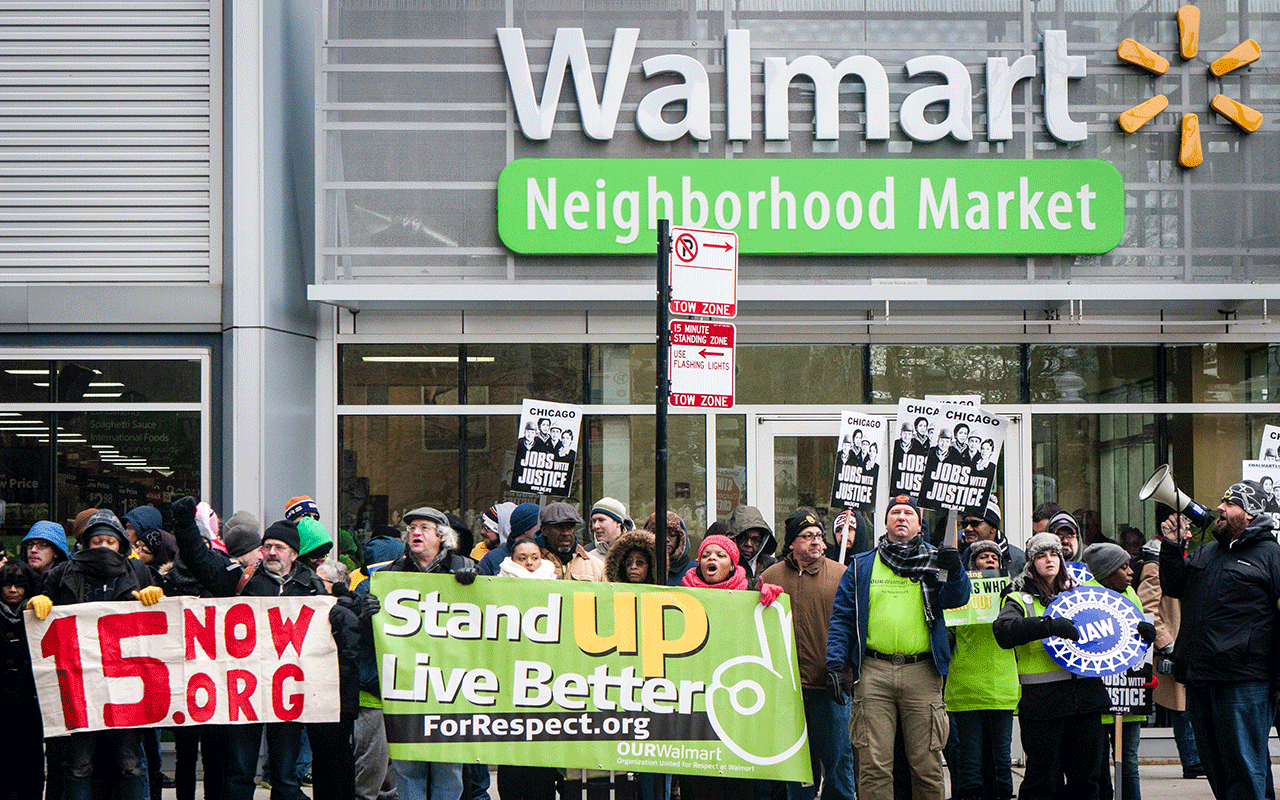
Indeed, the largest employer in the United States today is Walmart Inc., which is famously opposed to any type of collective worker activities. Several studies demonstrate that a Walmart store moving into a community decreases wages. In the mid-20th century, General Motors Co. helped build the U.S. middle class through compromises between the nation’s giant firms and unions. Today, the Walmart model defines much of current labor market interactions across firms but without unions to balance the power of firms.
The path ahead for U.S. workers remains precarious. Despite a relatively tight labor market, nonmanagerial workers have been unable to make much progress in terms of real wage gains. Our new working paper highlights the role of monopsony power in suppressing workers’ wages when it is unchecked by countervailing power from both unions and our public institutions at large. Further, we demonstrate that building worker power without also building public power will be unlikely to rebalance the seesaw between workers and capitalists.
It’s time for economists and policymakers alike to face up to this market-power problem. We cannot allow firms to set all the terms in an unbridled labor market. Rebalancing the power of workers vis-à-vis their employers can only be achieved through rebuilding a progressive and inclusive labor movement in the United States, while simultaneously pressing our increasingly conservative courts to protect workers.
As Adam Smith once wrote, “We rarely hear, it is said, of the combination of masters [to obtain power over the wage], though frequently of those of workmen. But whoever imagines, upon this account, that masters rarely combine, is as ignorant of the world as of this subject. Masters are always and everywhere in a sort of tacit and uniform combination, not to raise the wages of labor above their actual rate.”
—Mark Paul is an assistant professor of economics at New College of Florida and a fellow at the Roosevelt Institute. Mark Stelzner is an assistant professor of economics at Connecticut College.