JOLTS Day Graphs: August 2018 Report Edition
Every month the U.S. Bureau of Labor Statistics releases data on hiring, firing, and other labor market flows from the Job Openings and Labor Turnover Survey, better known as JOLTS. Today, the BLS released the latest data for August 2018. This report doesn’t get as much attention as the monthly Employment Situation Report, but it contains useful information about the state of the U.S. labor market. Below are a few key graphs using data from the report.
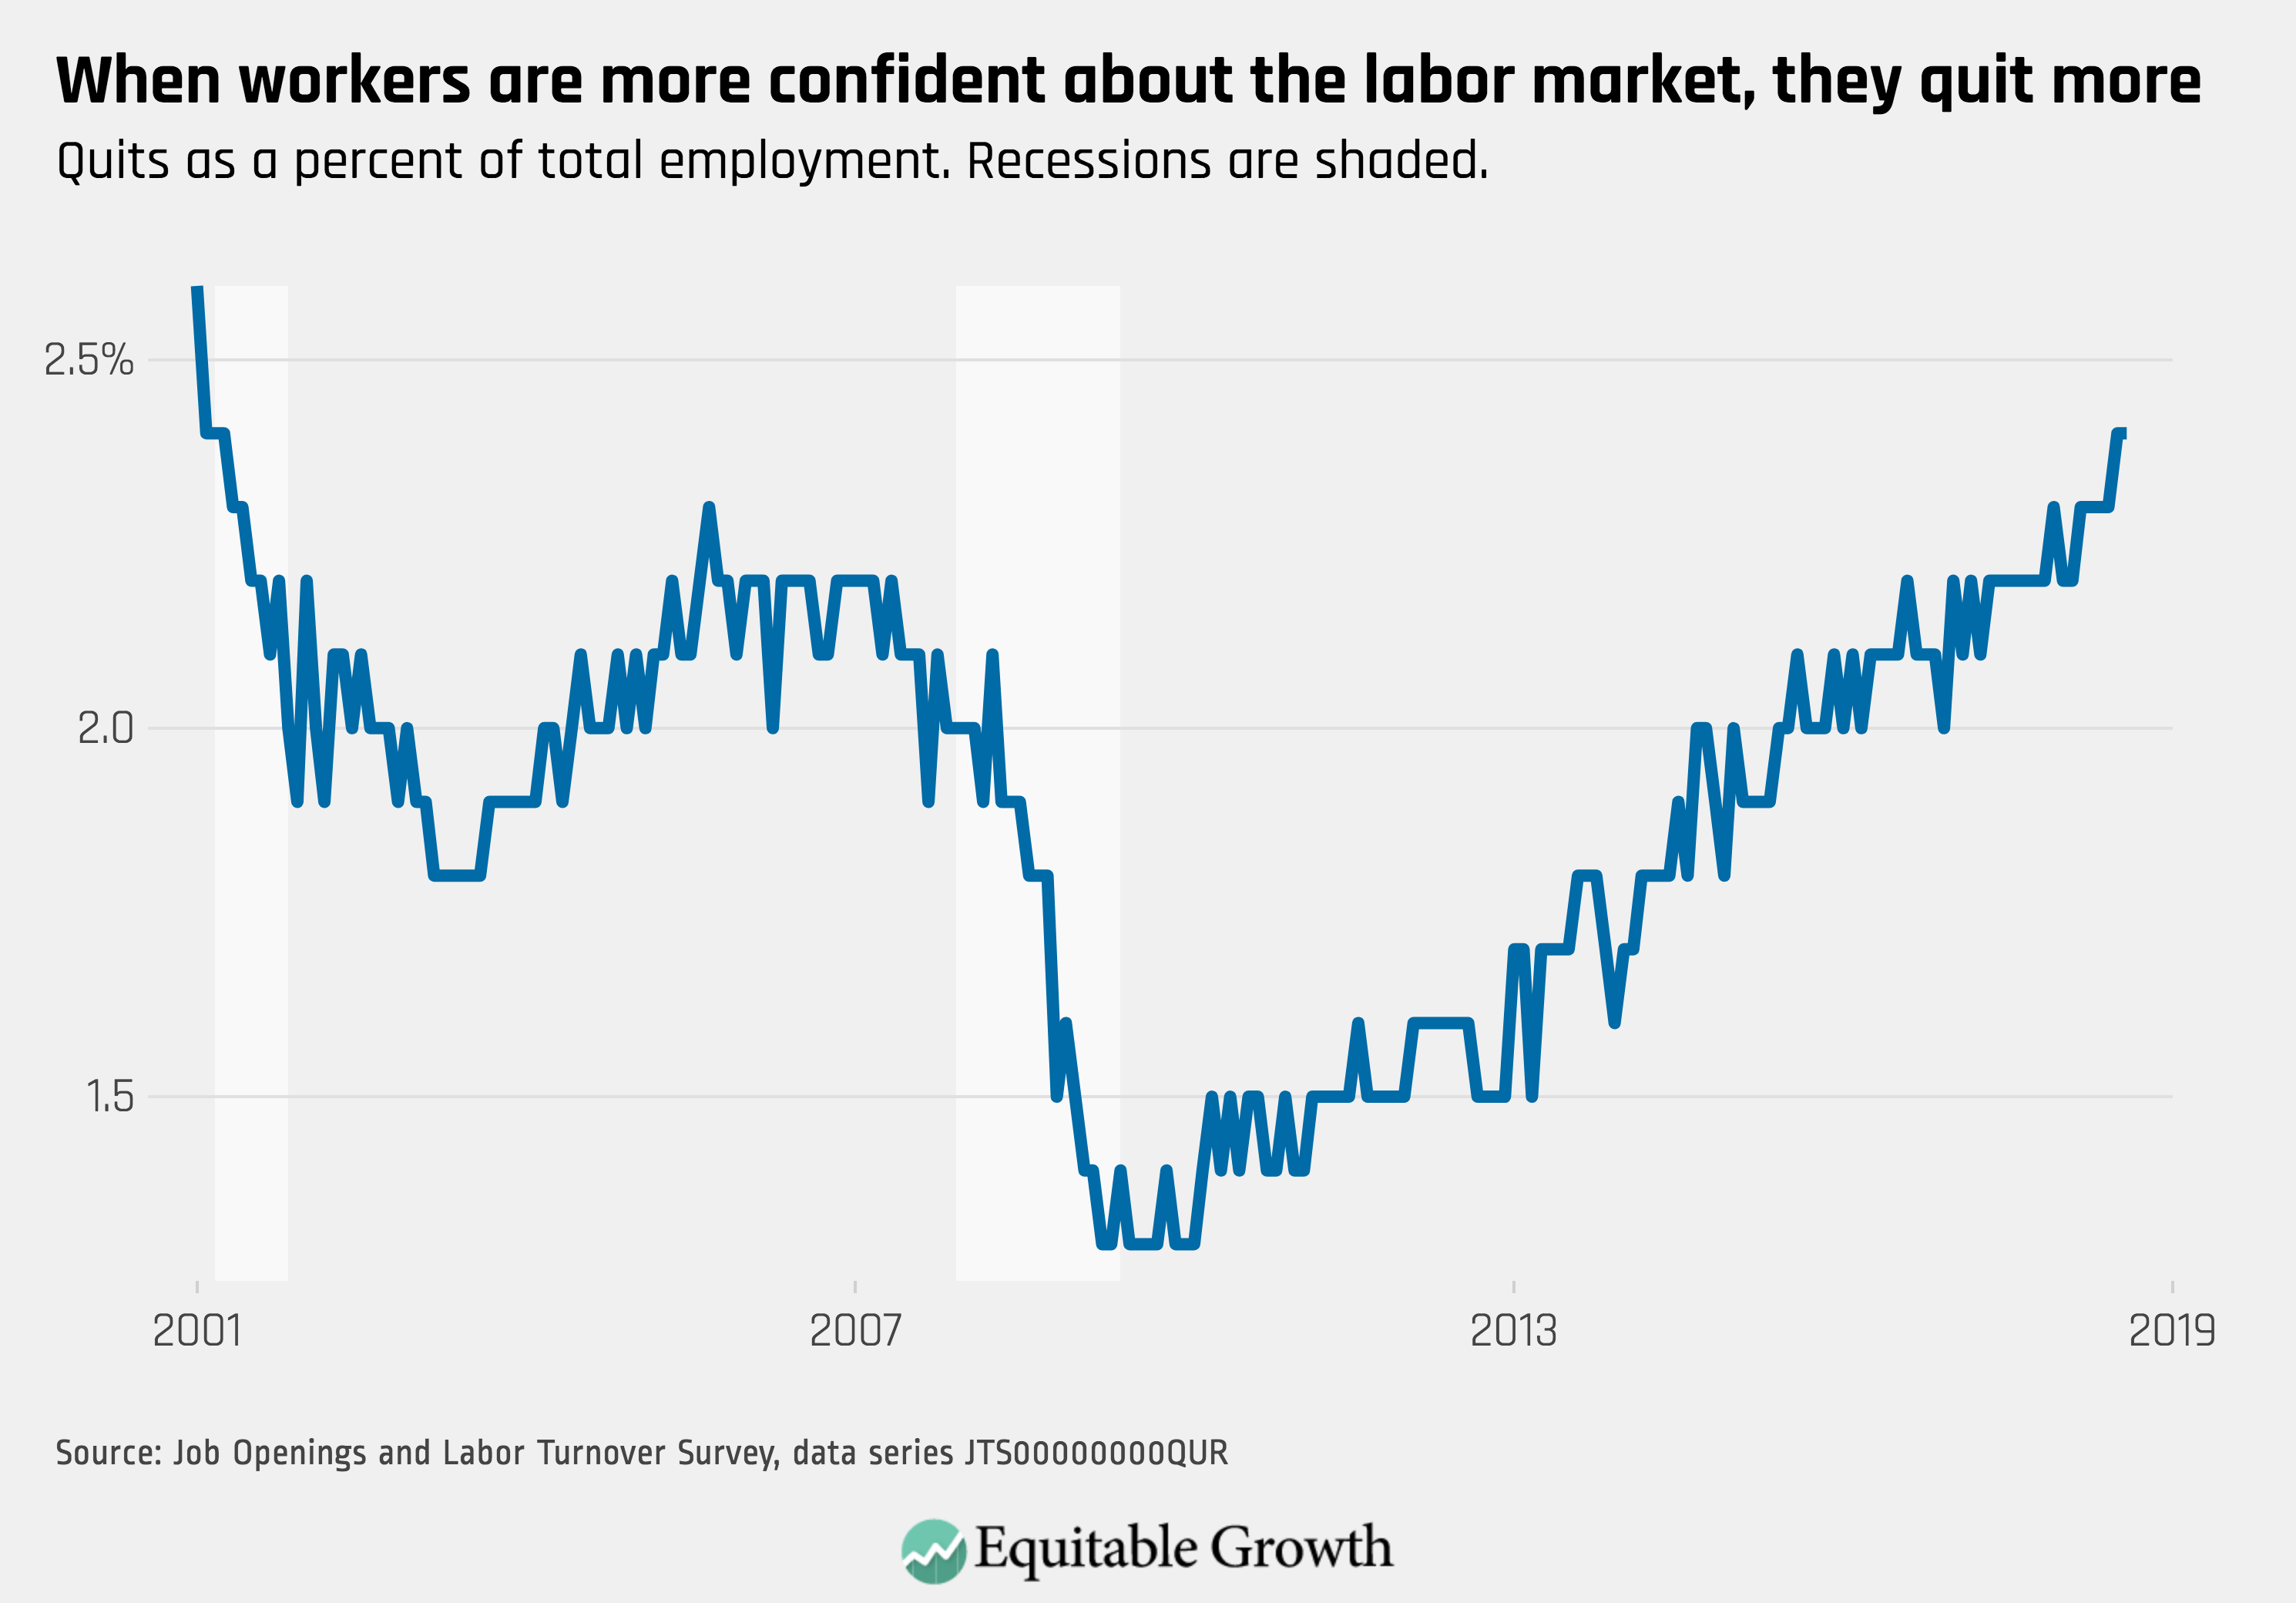
1.
The quit rate stayed the same in August, at a high level of 2.4 percent, reflecting continued worker confidence in the labor market.
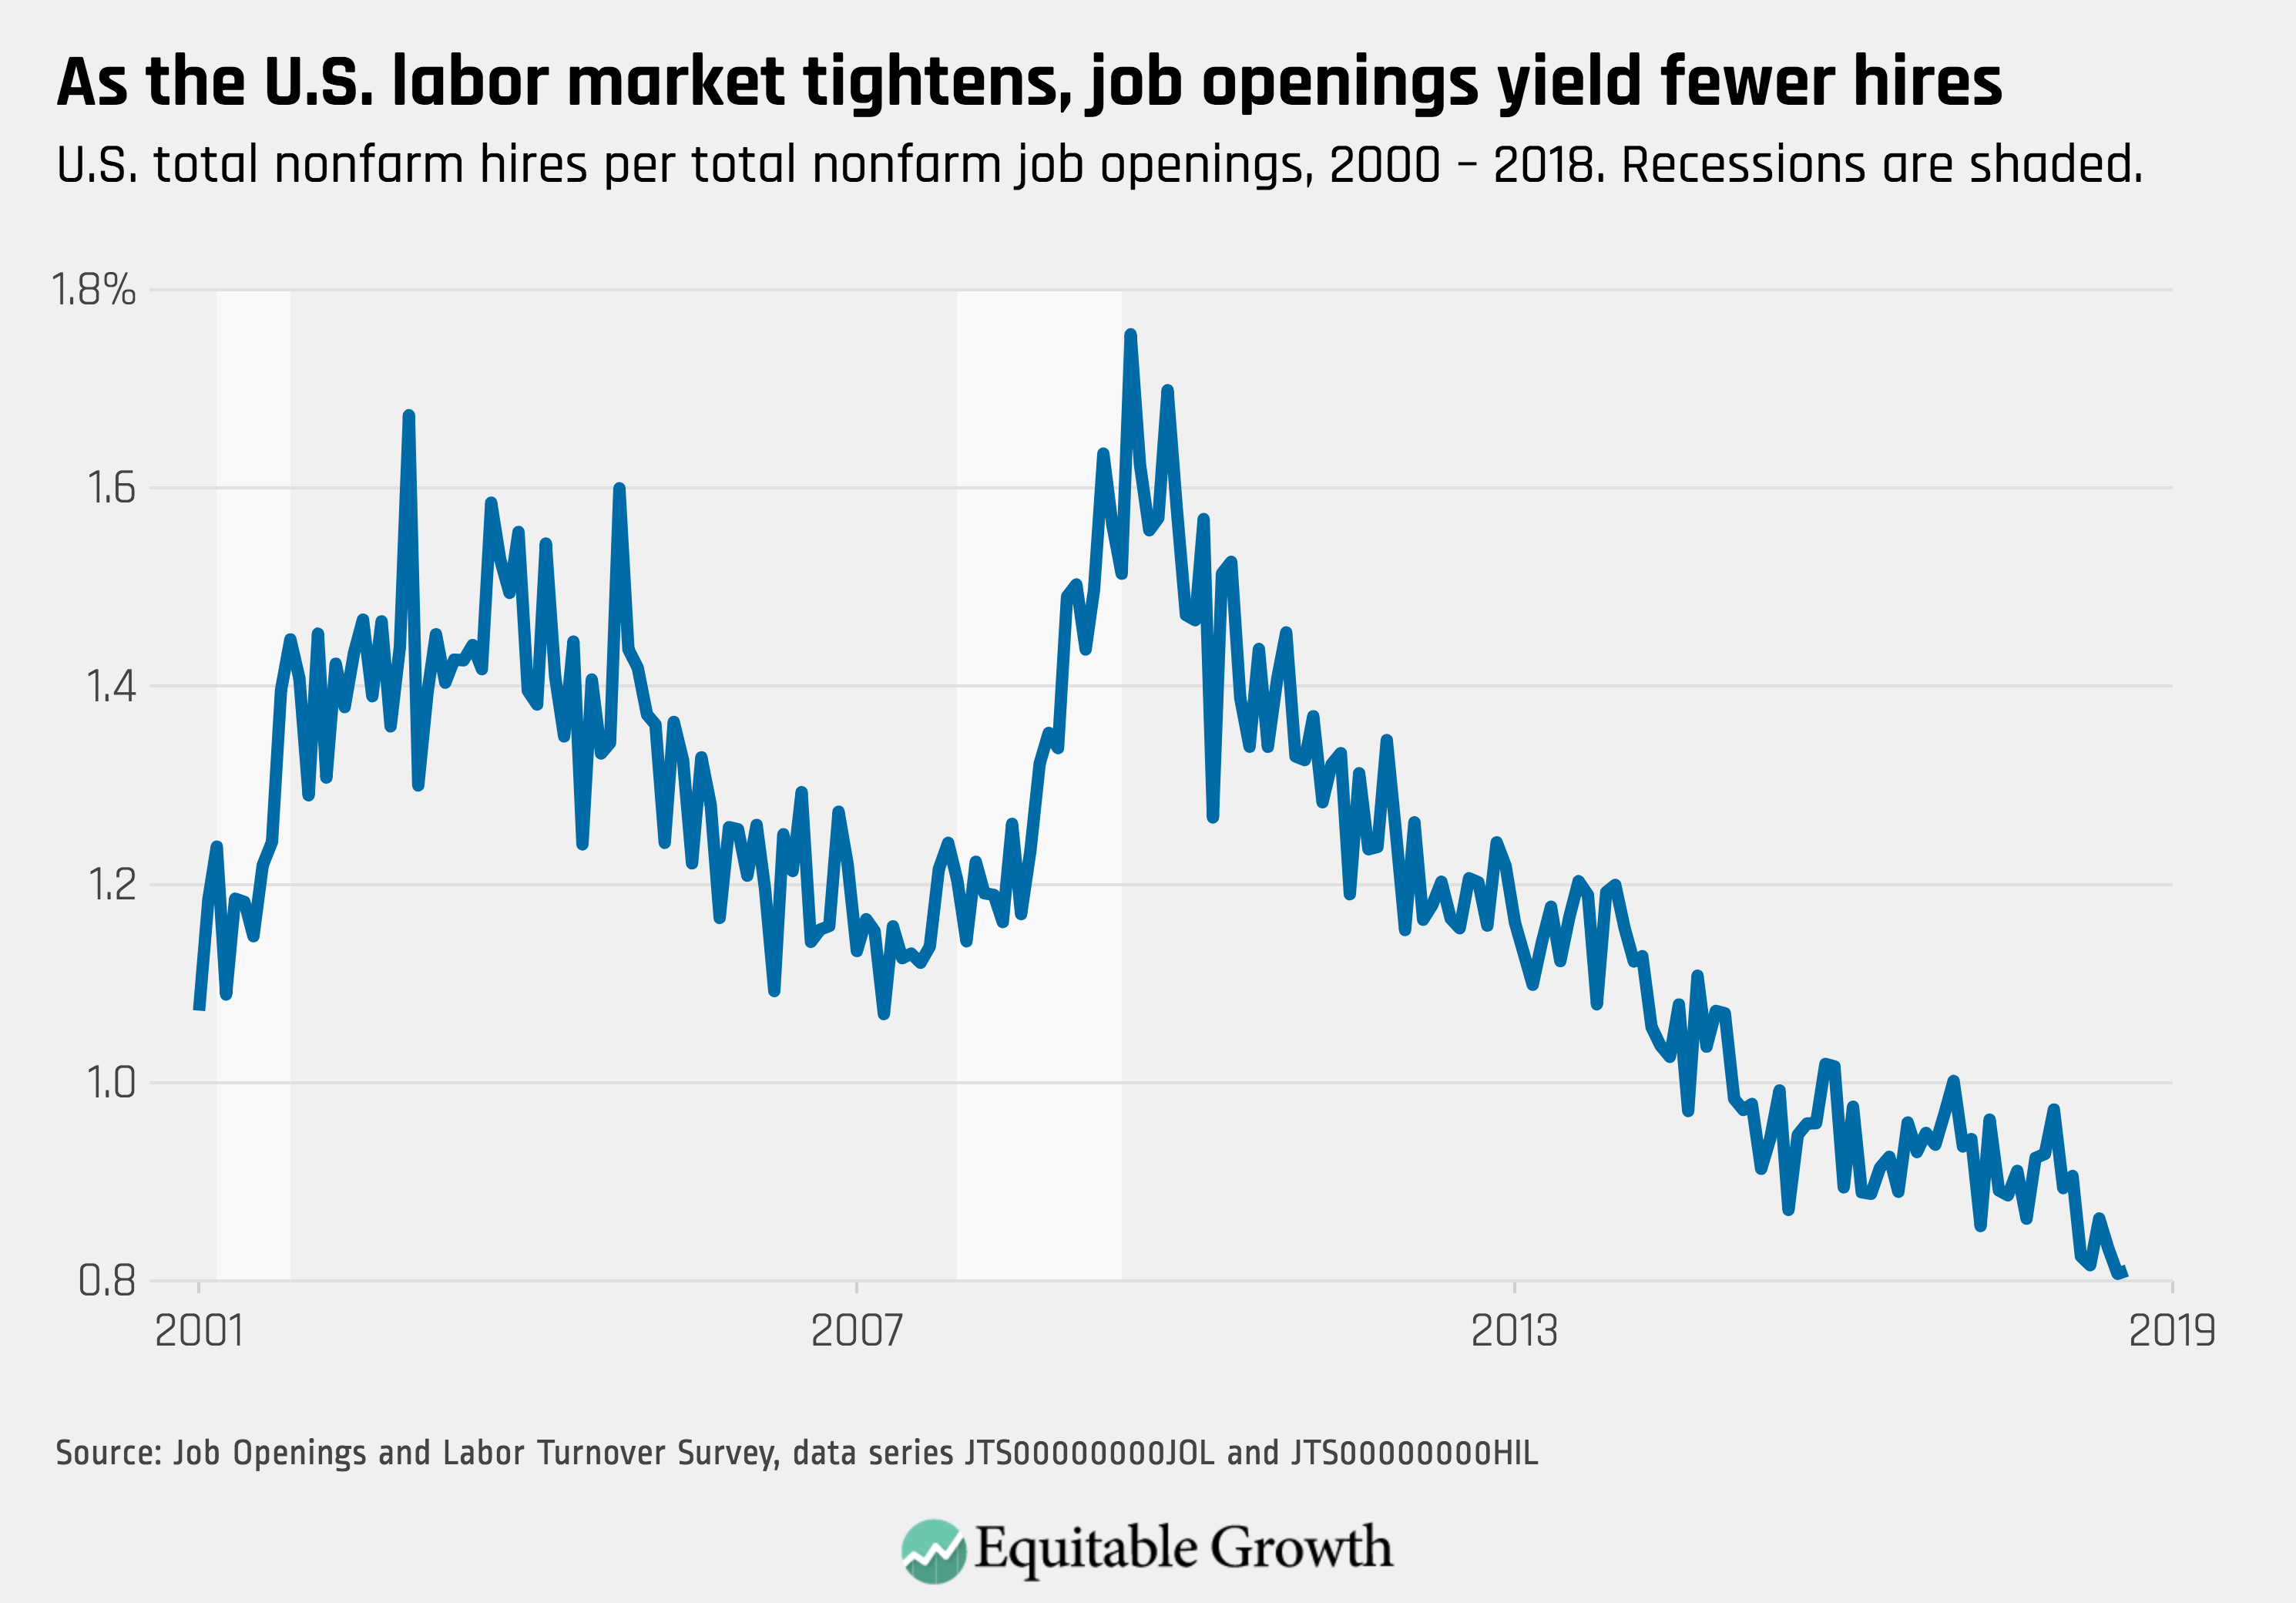
2.
The vacancy yield continued its trend downward, to the historical low of 0.81.
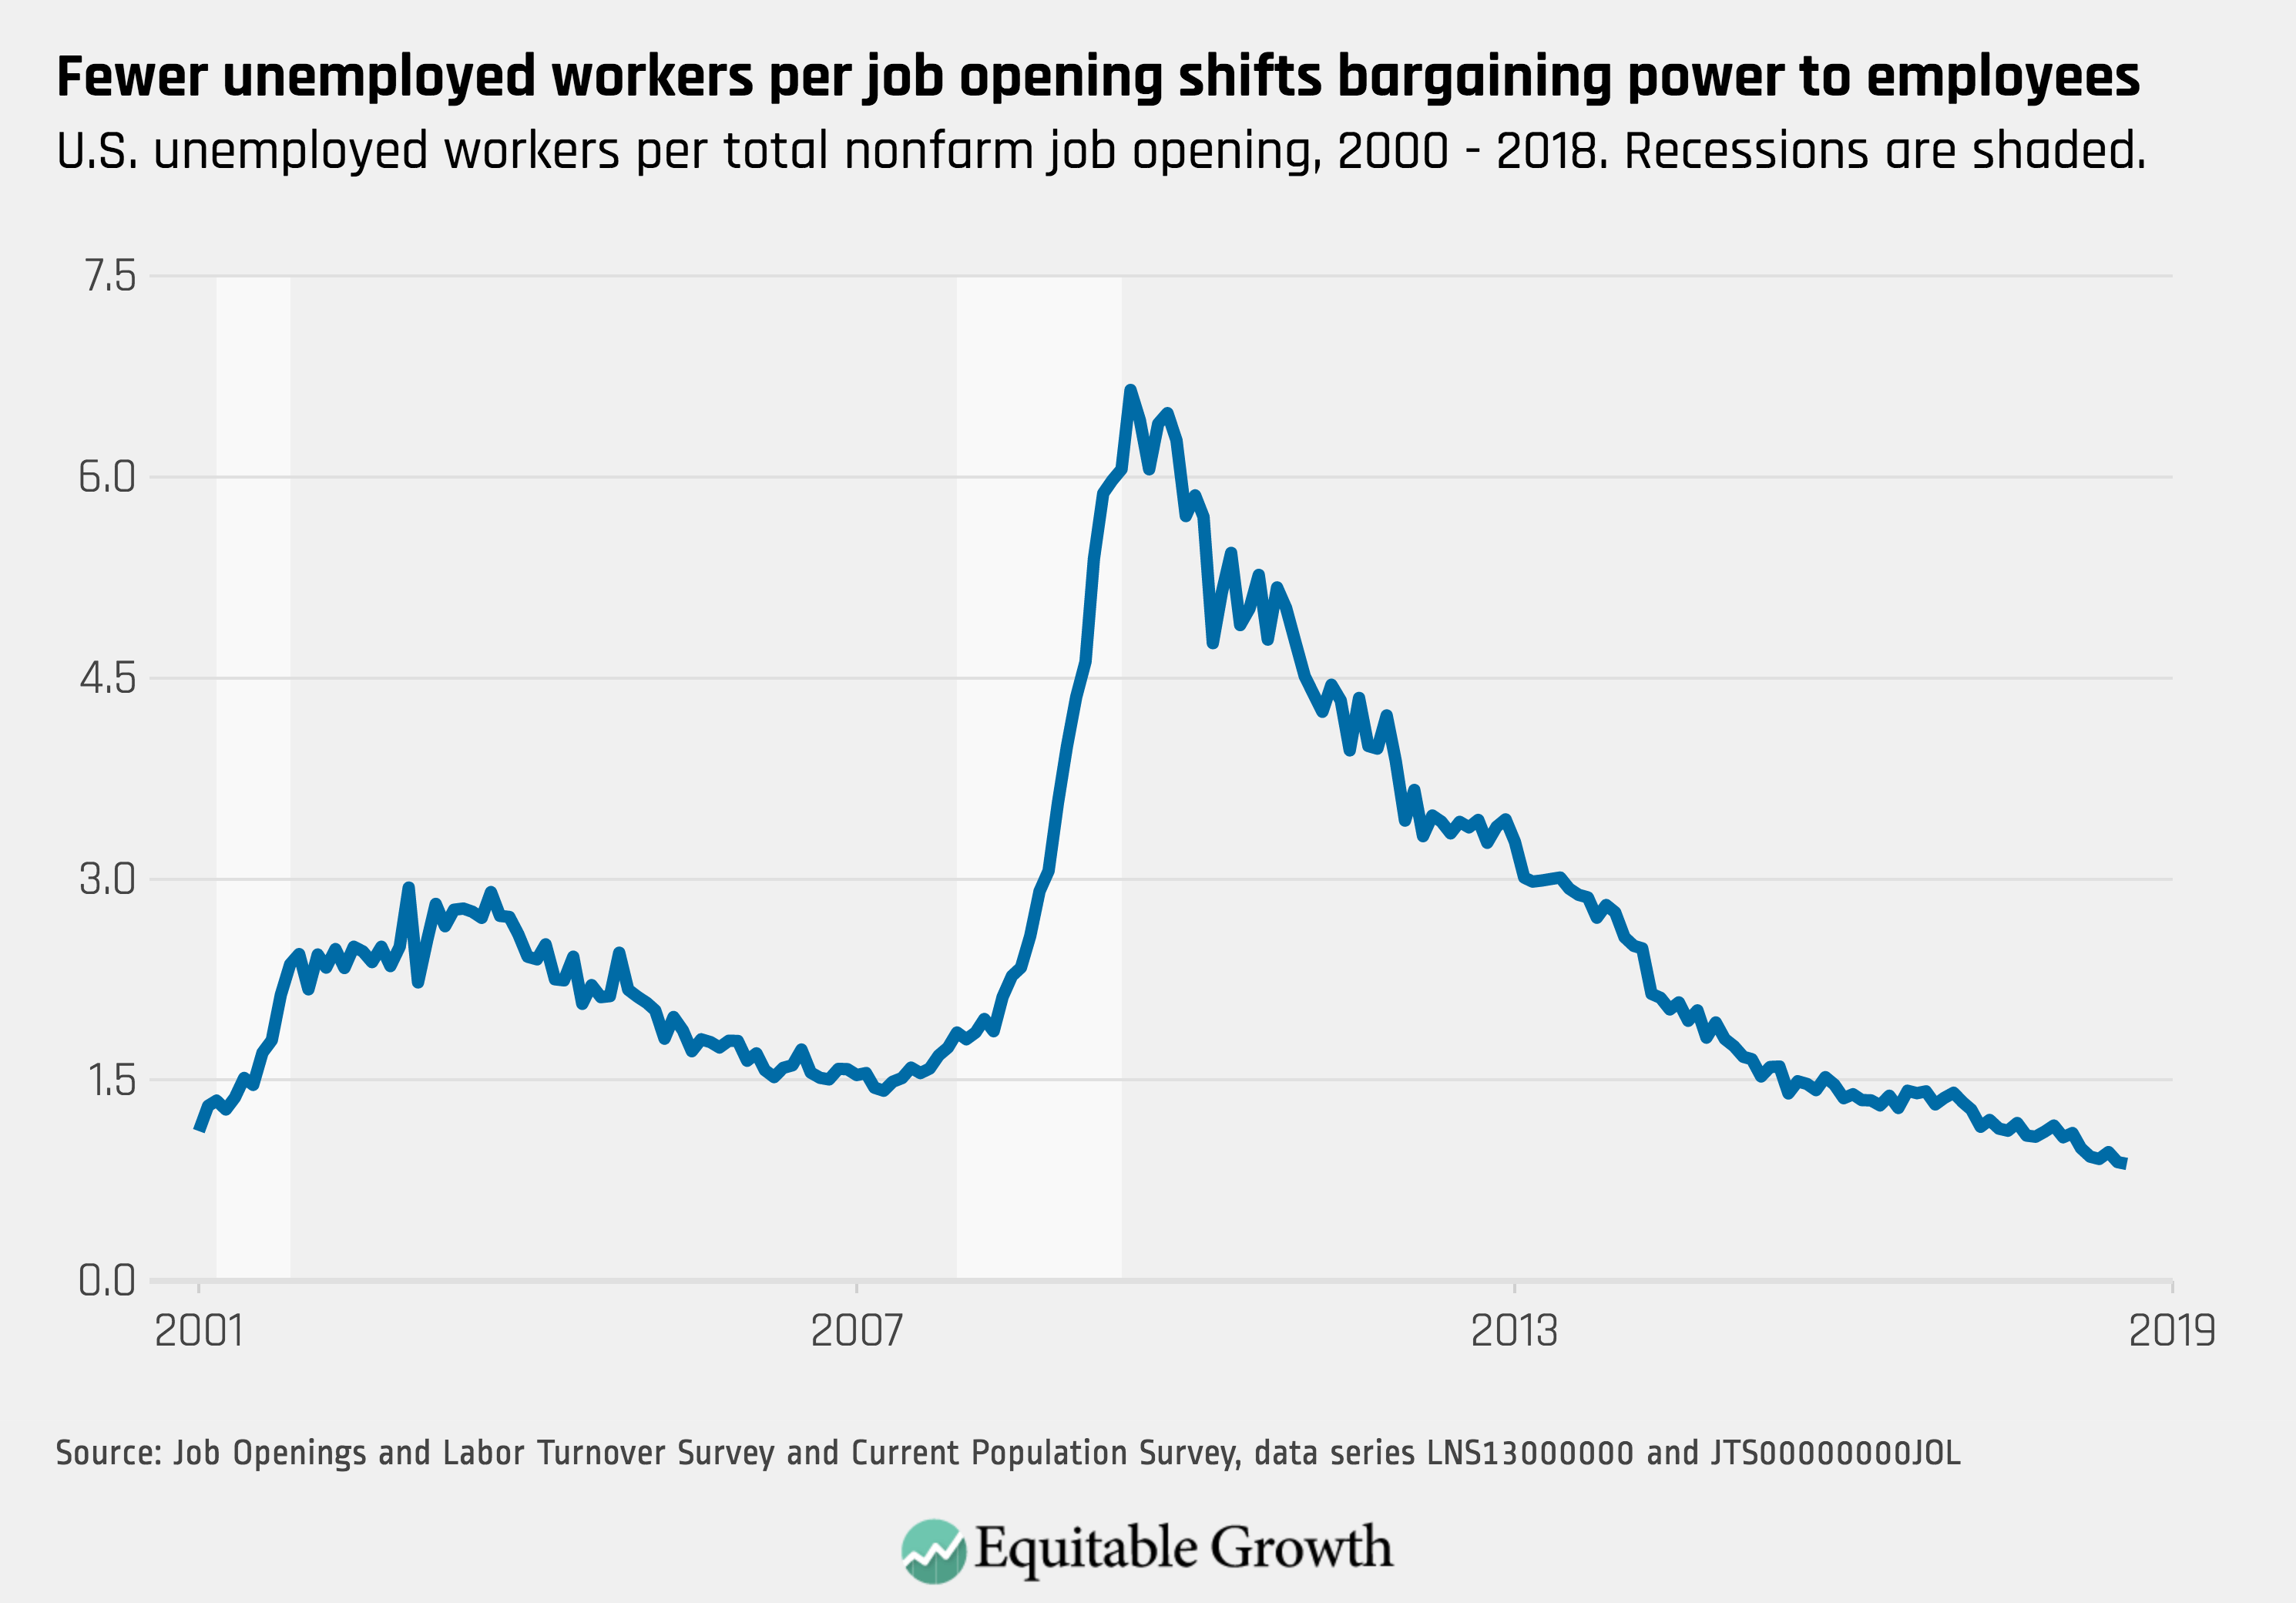
3.
The unemployment-to-job-openings ratio was little changed at 0.87 for August, still below one unemployed worker per opening.
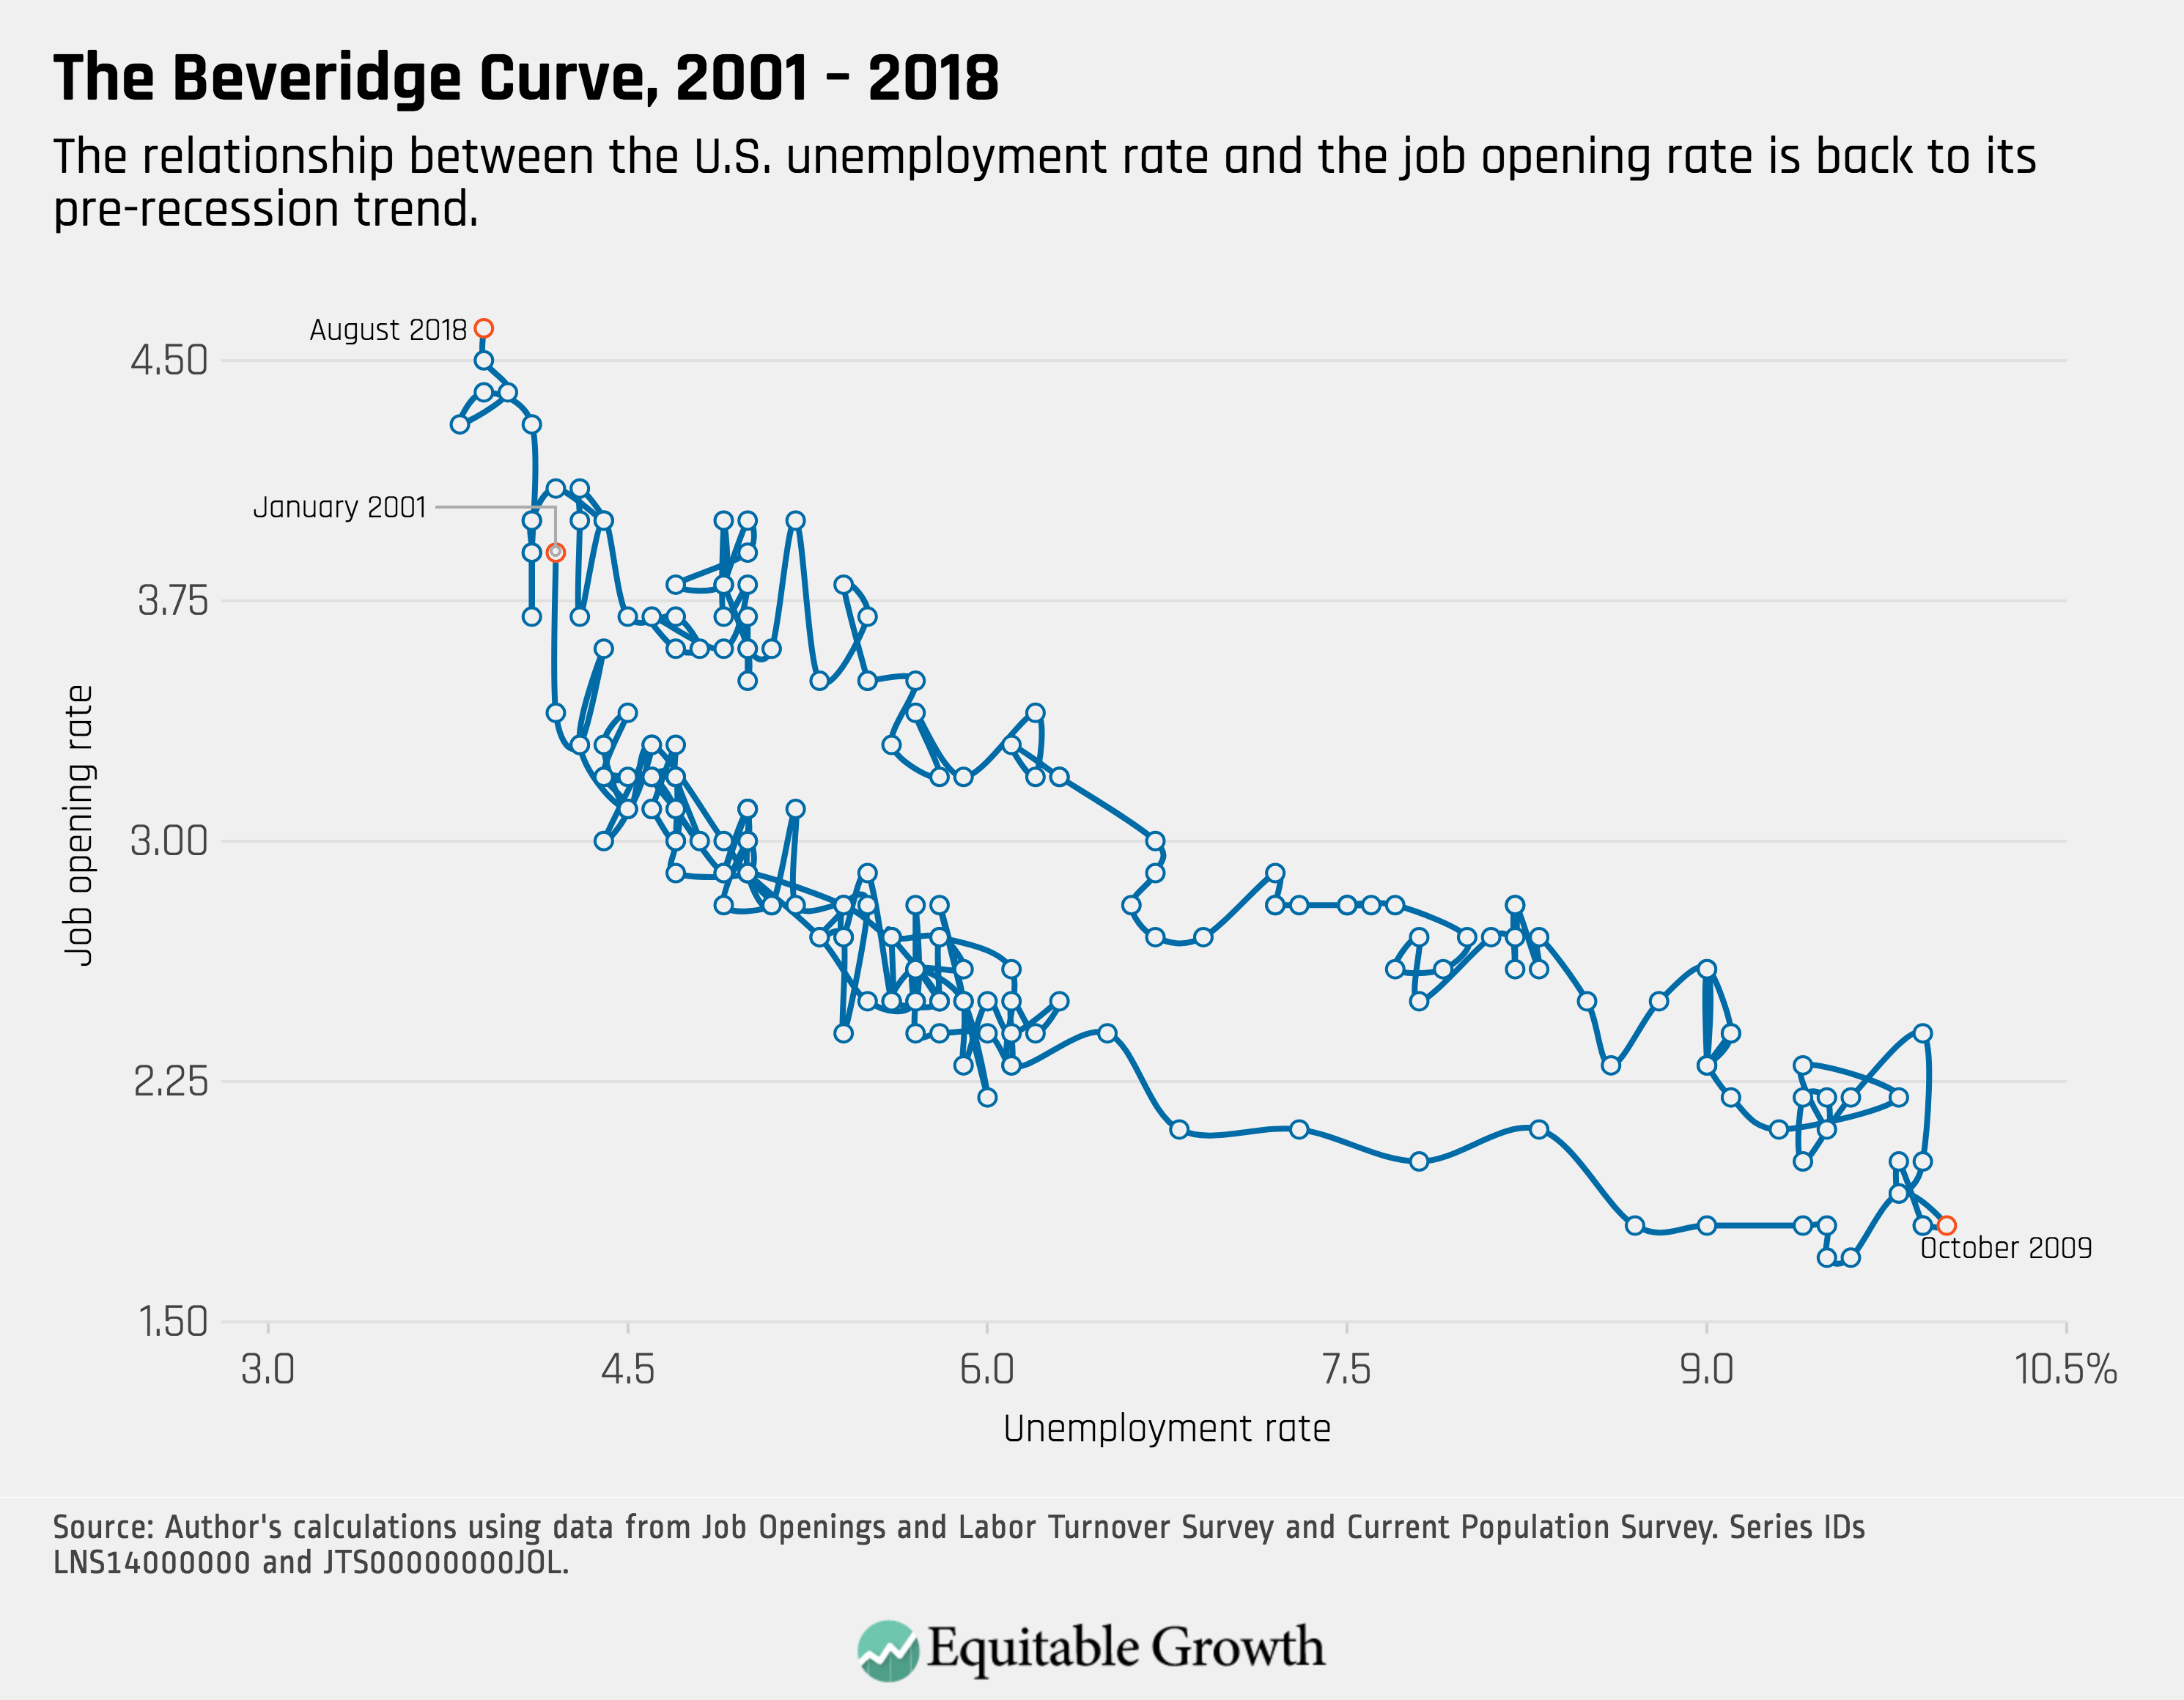
4.
As the job openings rate trends upward and the unemployment rate stays steady, the Beveridge Curve reflects a recovered labor market similar to its pre-recession trend.