Being classified as either an employee or an independent contractor can determine whether workers in the United States have access to reliable pay, benefits, and protection from discrimination. Intense fights are cropping up across the country as companies try to argue that their workers are just “independent contractors” and do not qualify for many protections under U.S. labor law, while workers and some courts say the opposite, that some workers are actually employees. Many “gig economy” companies, such as Uber Technologies Inc., base their business models around misclassifying their workers as self-employed. Billions of dollars in worker pay is at stake.
Download File
How U.S. companies harm workers by making them independent contractors
Economists and policymakers alike rightfully praise individual entrepreneurs who strike out on their own, and they encourage companies to embrace innovation. However, the vast majority of self-employed independent contractors are nothing like the legendary small businessperson engaged in launching a newfangled product or service. Instead, large companies have found that they can use independent contracting or self-employment status in U.S. labor law to lower workers’ pay and benefits, while maintaining significant control over how those workers perform their jobs.
This issue brief delves into how independent contractors are defined by law and understood by economists, while demonstrating why it’s rarely a good thing for most workers to be forced to work as independent contractors due to lack of good pay, lack of basic benefits, and lack of work-time independence.
Who is an independent contractor?
Traditionally, independent contractors are paid a commission per task they complete for clients, maintain significant control over how and when they perform their tasks, and are not integral to the business of the companies or people for whom they work. They can also be referred to as freelance workers. Traditional examples of independent contractors include plumbers, wedding photographers, and some lawyers and consultants. They run their own professional operations, contract with many different families or businesses, negotiate mutually agreeable contract terms, are free to complete their work without control by their customers outside of those contracts, and are not integral to their customers’ business models.
Independent contractors are a subset of people who are “self-employed,” which includes independent contractors, small business owners, and part-time hobby or craft merchants. The terms have slightly different meanings for economists, tax professionals, and lawyers, which are not relevant here.
A recent study by the U.S. Bureau of Labor Statistics and academic research by Lawrence Katz of Harvard University and the late Alan Krueger of Princeton University, show that between 6.9 percent and 9.6 percent of all workers are independent contractors, or 10.5 million to 15 million workers.
It is largely impossible to tell how many of these workers are traditional independent contractors and how many are misclassified low-wage workers, though Katz and Kruger do find that from 2005 to 2015, low-wage workers experienced a larger rise in independent contracting than high-wage workers. Katz and Kruger believe that employment in independent contracting rose by about 30 percent from 2005 to 2015 and this increase occurred while the rate of true entrepreneurial activity remained mostly stagnant. U.S. Department of the Treasury economists Emilie Jackson, Adam Looney, and Shanthi Ramnath corroborate this finding using tax data. They find that self-employment has risen by about 30 percent since 2001 and nearly all of that increase is due to a growing number of independent contractors and misclassified workers. The Bureau of Labor Statistics believes the increase has been smaller.
Why is it bad to be an independent contractor?
First, sometimes it isn’t bad. Plumbers, independent lawyers and consultants, and even wedding photographers can earn a good living as independent contractors while retaining freedom over how they operate their business. But there are many reasons why being an independent contractor might not be advantageous for most workers, specifically when:
- They are not earning as much money as traditional employees would
- They are denied crucial workplace rights such as 40-hour work weeks, the right to organize, protection from discrimination, and employer-provided health benefits
- They are not actually independent and are not really able to determine where, how, and for whom they work
Overall, too many workers fit that description. These kinds of workers suffer from lack of good pay, lack of decent benefits, and lack of meaningful work-time independence, compared to plumbers, real estate agents, and other professional independent contractors.
Lack of good pay
Recent data-driven research shows that low pay is a serious issue for most independent contractors. Treasury economists Jackson, Looney, and Ramnath found that the universe of self-employed people and independent contractors is divided between a very prosperous upper crust and a large body of workers who are not very well-off. At one extreme, the average person who is a partner at a firm earned $243,000, while a gig economy worker made only $37,000 at the other. (Tax data is generally the best source for research on income. But there are still issues with under-reporting of income, especially among the self-employed, which can affect results.)
And it is not just that low-skill workers select into low-paying jobs. My research on the tax returns of Washington, D.C. residents shows that self-employment exacerbates existing income inequality in the local labor market. Low- and middle-wage workers who become self-employed see lower take-home pay than they could have expected if they remained just as wage earners. People in the bottom 75 percent of income-earning Washington residents (making less than about $83,000 annually), earned $3,450 less in 2014 than their counterparts who remained just wage-earners. (See Figure 1.)
Figure 1
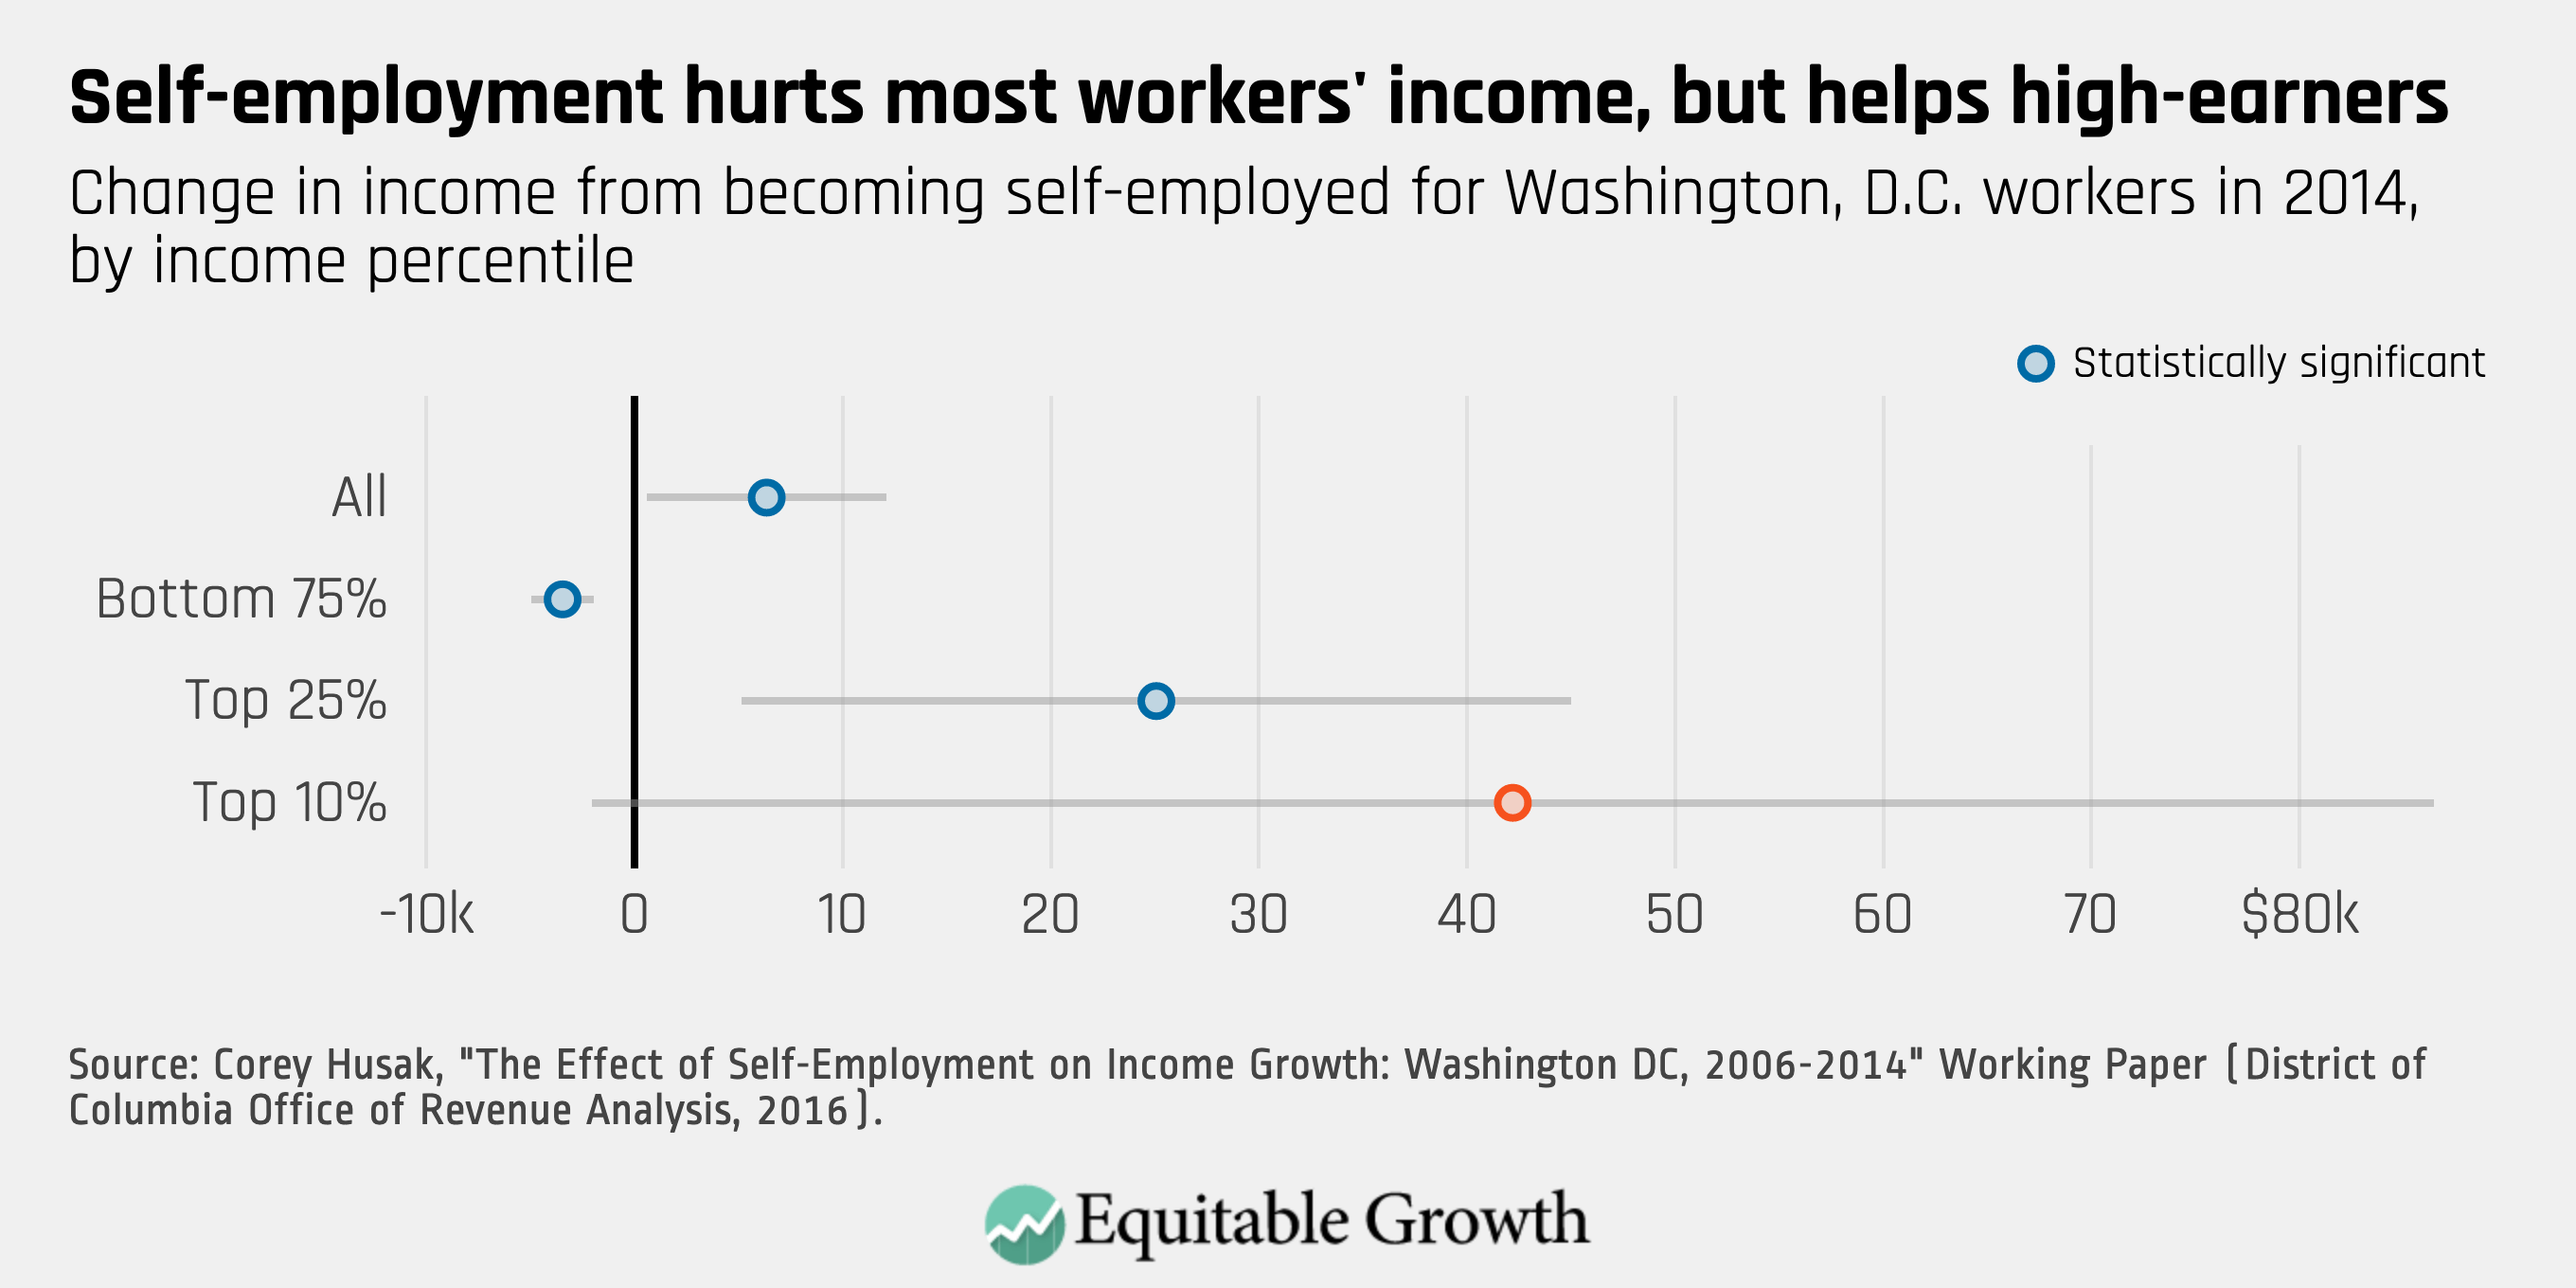
In contrast, the city’s high earners see a wide range of earnings outcomes when they become self-employed relative to what they could have otherwise expected. They generally see a large increase in income, but a small minority see very large initial declines as their businesses get off the ground. On average in 2014, those who were already high earners and became self-employed increased their incomes by $25,000 above what they would otherwise have expected after 2 years.
This divide occurs because high-income self-employed workers are much more likely to be consultants, professionals, or traditional entrepreneurs, and thus have the corresponding human capital, social networks, and existing wealth to successfully strike out on their own. Being already wealthy predisposes them to reap great benefits on average from going into business for themselves. Further illustrating this divergence, the overall average income of self-employed people in Washington, D.C. in 2014 was $109,000, versus a median income of just $49,000. These very successful people should not be thought of as representative of the entire population of independent contractors.
Uber drivers are a good example of this phenomena. Uber’s business model is built on using independent-contractor status to lower workers’ pay and shift the costs and risks of doing business onto drivers. While big-city taxi drivers earn between $12 and $17 per hour and taxi drivers industrywide earn $12.49 per hour, a recent study by Larry Mishel of the Economic Policy Institute finds that Uber driver take-home pay averages $10.87 an hour. But after factoring in that Uber drivers must provide for their own benefits, Mishel finds that their hourly wage equivalent is only $9.21 on average.
Mishel points out that those average wages are “below the mandated minimum wage in nine of 20 major markets, including the three largest (Chicago, Los Angeles, and New York),” all of which have minimum wages above $10 per hour. This means Uber would have to immediately raise driver pay if drivers were considered employees. And because these are averages, many drivers make even less.
As Uber and many of its defenders will respond, Uber drivers are usually employed outside of the company and only rely on driving for part of their income. But in no case does U.S. labor law allow part-time workers to be paid less than the minimum wage simply because they are part-time. No matter how many hours someone works, all workers are entitled to a baseline minimum wage per hour of work. That is, unless they are mischaracterized as independent contractors.
In short: like many companies who rely on low-wage independent contractors, Uber uses the independent contracting status to rob drivers of the pay they would be entitled to as employees, or indeed as traditional taxi drivers.
Lack of benefits
Independent contractors are treated under U.S. labor law as self-employed. This means they:
Workers are forced to give up nearly all the rights that U.S. law entitles them to when they work as independent contractors. Uber and the other prominent “ride-services” company, Lyft Inc., claim that restoring those rights by converting their independent contractors into employees would pose a serious risk to their operations. In trying to fend off a new proposed California state law that would require companies to hire independent contractors as full-time employees, the two firms argue instead for vague rules and regulations that would enable their drivers to somehow provide these employee-benefits to themselves. They tout the importance of their drivers’ flexible schedules, but there is no legal reason drivers can’t have both flexible schedules and the benefits of being an employee.
Lack of meaningful work independence
In return for giving up the entire suite of employee protections and benefits in U.S. labor law, all that most independent contractors receive from a company such as Uber and Lyft is mostly imaginary work independence. Companies must give workers some amount of freedom for them to qualify as independent contractors, but it is in companies’ interest to keep as much control as possible. For instance, companies routinely discipline their contractors, control how they perform their job, unilaterally change pay structures, and forbid negotiation over pay. It is hard to imagine plumbers or lawyers operating under similar restrictions.
While “worker freedom” remains the primary justification given by companies and their allies for the independent contractor classification, the actual amount of freedom workers have is a subject of ongoing legal disputes.
In a blow to employers that rely on classifying their workers as independent contractors to avoid labor costs and juice profits, California’s Supreme Court ruled in 2018 that workers must be truly independent in order to qualify as self-employed. The court said that “businesses must show that the worker is free from the control and direction of the employer; performs work that is outside the hirer’s core business; and customarily engages in an independently established trade, occupation or business.” This so-called ABC test would describe most traditionally self-employed people, but clearly not contractors for companies such as Uber. This ruling applies in California only, and so far Uber and similar companies are not complying with the ruling. California’s legislature is currently debating a bill that will codify all or parts of the ABC test into law, which will force the companies to comply without further lengthy litigation.
In contrast, the National Labor Relations Board recently ruled in a case similar to the California Supreme Court case and reversed the Board’s prior position on independent contractors. The NLRB held that drivers for SuperShuttle DFW Inc. are contractors despite being considered employees until 2005. Additionally, those drivers are “completely integrated into SuperShuttle’s transportation system and its infrastructure,” they can not negotiate the terms of their work, and “are prohibited from working for any SuperShuttle competitor.” In her dissent, member Lauren McFerran sums up how misguided the decision was by saying “SuperShuttle’s drivers are not independent in any meaningful way, and they have little meaningful ‘entrepreneurial opportunity.’”
Crucially, worker freedom is not something that companies can only give to independent contractors. Nothing stops SuperShuttle, Uber, or any other business from giving workers both the status and protections of being an employee and a flexible schedule.
Conclusion
High-income professionals enter self-employment under vastly different circumstances than low-wage workers, and this drives different outcomes in terms of earnings, benefits, and work-time flexibility. Professionals really can act as entrepreneurs and greatly improve their incomes while gaining greater work freedom. U.S. labor laws were designed to enable these types of professional workers to declare themselves self-employed. In contrast, low-wage workers are more likely to see wages and benefits stripped away when they become independent contractors, with little or no corresponding increase in autonomy.
U.S. labor history has been defined by conflicts among workers, employers, and the government over workers’ rights to pay and benefits for over a century. As new technologies and business models are developed in the future of work, these fights will shift and policy needs to keep up. The federal government and other states should follow the lead of California’s Supreme Court and recognize the fundamental power imbalance between contractors and firms. Strict rules on who can qualify as an independent contractor would restore pay and benefits to misclassified workers or else give them true freedom to pursue entrepreneurial activity.