Ahead of the November jobs report, here’s what recent disaggregated data say about the state of the U.S. labor market and economic growth

Ahead of the release of November’s Employment Situation Summary on December 2, an examination of the past few months of U.S. Bureau of Labor Statistics employment data shows some signs that the U.S. labor market is cooling down. After nonfarm payrolls recovered to pre-pandemic levels late in the summer—and as the U.S. Federal Reserve Bank continues increasing interest rates to cool the economy in an effort to manage inflation—employment growth, hires, and job openings are all now below their 2022 peaks and trending down, BLS data show.
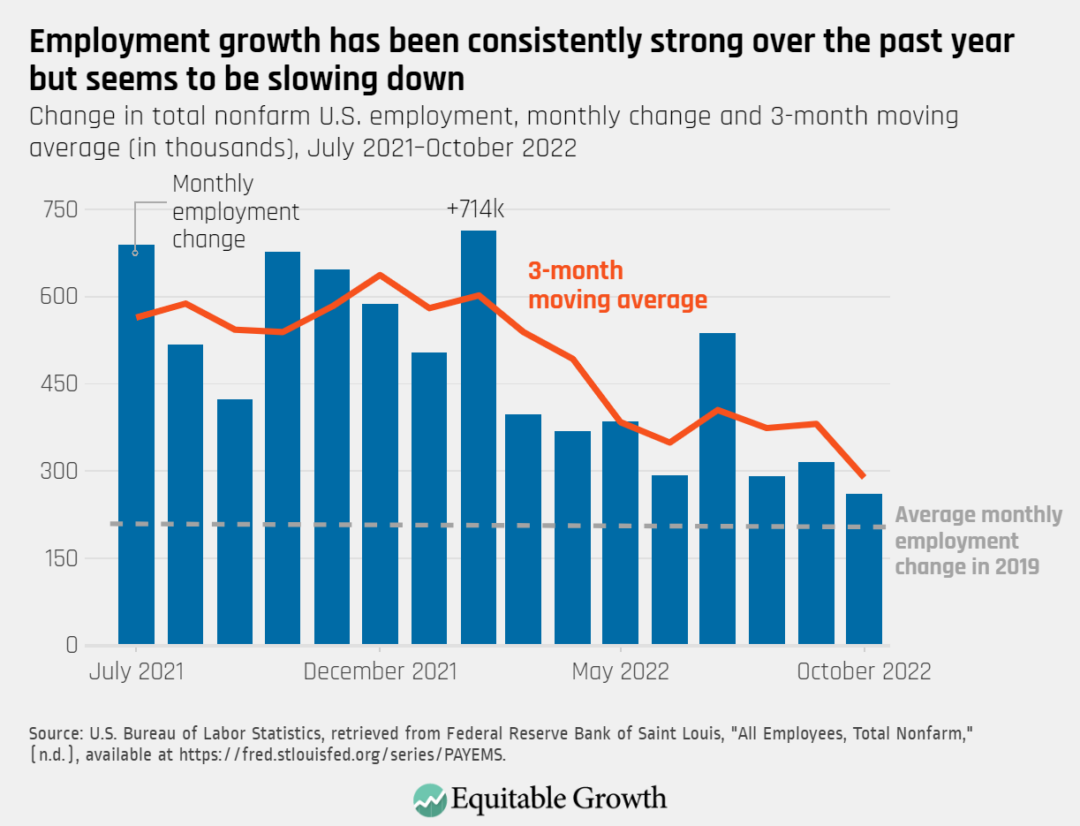
One example of these dynamics at play is net monthly job gains. While employment growth remained strong as the U.S. economy added an average of 289,000 jobs in the 3 months of August, September, and October, these gains represent a substantial deceleration, compared to the previous 3-month moving average of 381,000 jobs added. (See Figure 1.)
Figure 1
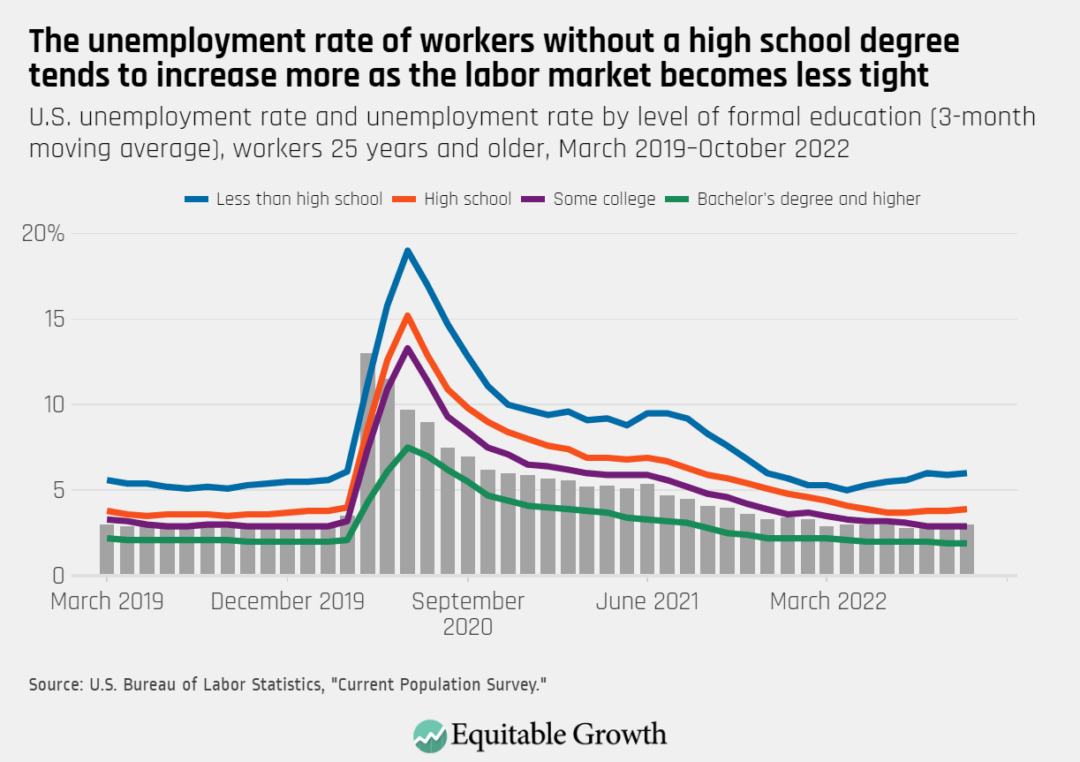
As the U.S. labor market loses steam, disparities faced by some vulnerable groups of workers remain—and may be reverting to previous unequal trends prior to the recent downturn. For instance, the employment-to-population ratio of workers between the ages of 20 and 24 who are not in school has dropped substantially since the beginning of the year. Workers with a high school degree or more are still experiencing historically low unemployment rates, but the joblessness rate of those without a high school diploma has been trending up since early 2022. That joblessness rate went from a series low of 4.3 percent in February 2022 to 6.3 percent in October—a rate that is about three times higher than the unemployment rate for workers with a bachelor’s degree or more. (See Figure 2.)
Figure 2
If these trends continue, a weaker U.S. labor market is also likely to be felt most by workers of color in general, and Black workers in particular—many of whom are especially exposed to joblessness because of the interplay of occupational segregation and discrimination in employment. The effects of discrimination and Black workers’ vulnerability across business cycles can also be seen in what researchers call the “first fired” phenomenon, in which Black workers are more likely to be laid off than their White counterparts—a finding that holds even when comparing workers of the same age, with the same level of formal education, and working in the same job and industry.
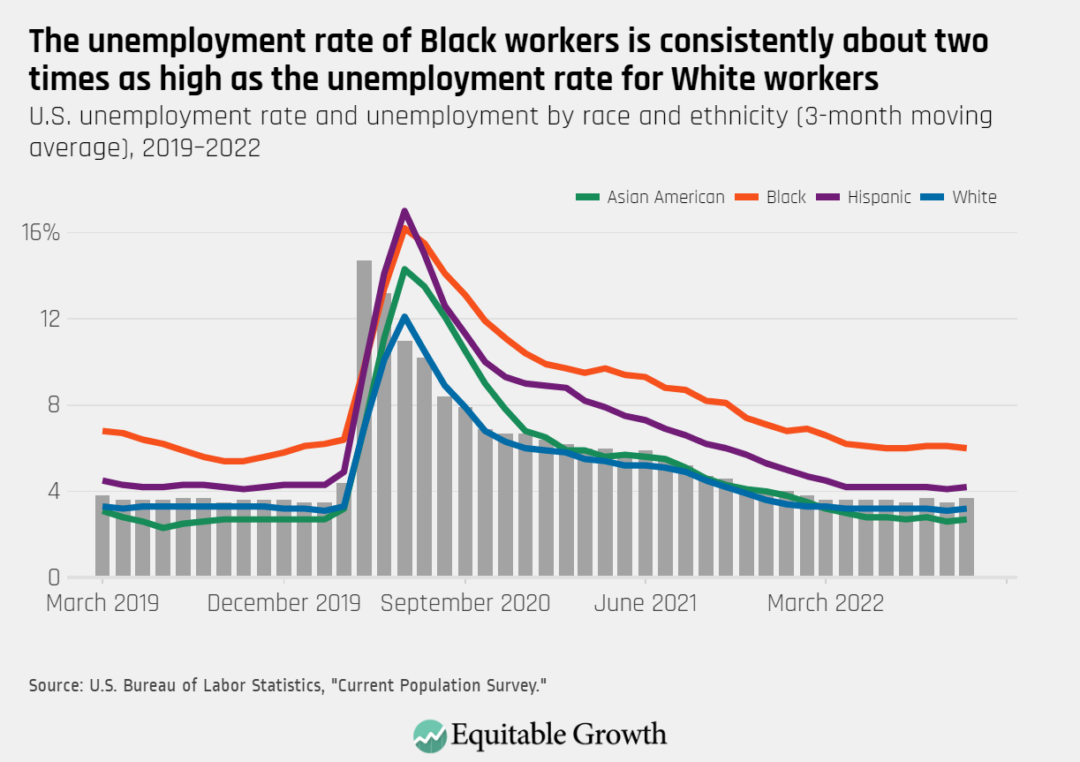
Data from the current economic recovery show the persistence of these structurally racist barriers, providing further evidence that market dynamics, such as business cycles, cannot fully account for or resolve the longstanding employment divides between Black and White workers. Not even the robust U.S. labor market of late 2021 and early 2022—a labor market some analysts called “red hot”—was enough to substantially narrow racial divides in economic outcomes. Throughout 2021 and 2020, for instance, the unemployment rate of Black workers consistently doubled the unemployment rate of their White counterparts. (See Figure 3.)
Figure 3
New data shed light on the experiences of Indigenous Americans and Native Hawaiians and Pacific Islanders during the COVID-19 recession and current recovery
In addition to releasing monthly data on the U.S. labor market outcomes of Asian American, Black, Latino, and White workers, earlier this year, the Bureau of Labor Statistics began publishing monthly data for two groups of workers: American Indians and Alaska Natives and Native Hawaiians and Pacific Islanders. These newly available data series are not seasonally adjusted, meaning that BLS has not performed statistical procedures to account for seasonal variations in the labor market, such as retailers’ hiring of temporary workers ahead of the December holiday season.
That these data are not seasonally adjusted and are composed of small sample sizes—American Indian and Alaska Native workers make up slightly less than 2 percent of the U.S. workforce, while about 0.5 percent of U.S. workers are Native Hawaiian or Pacific Islander workers—make month-to-month comparisons difficult, since the series are volatile and generally not statistically significant. Yet they still offer a timely snapshot of the experiences of these workers in the labor market, contributing to our understanding of how race and ethnicity shape the economic outcomes of U.S. workers.
American Indian and Alaska Native workers
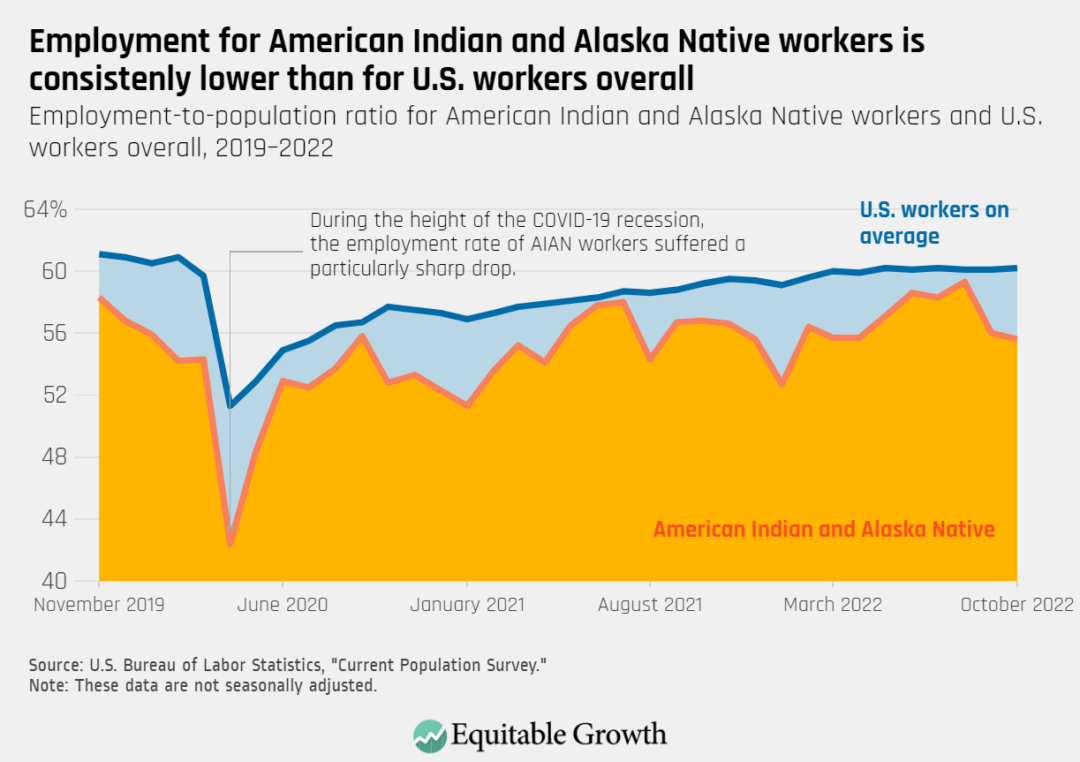
In the case of American Indian and Alaska Native workers, the data series show that this group faced particularly sharp economic pain due to the COVID-19 recession, suffering a massive increase in unemployment and a commensurate drop in employment as the pandemic hit service-providing industries especially hard.
In April 2020—the height of the recession—the American Indian and Alaska Native employment-to-population ratio dropped to 42.4 percent, an almost 15 percentage point fall compared to April of the previous year. While the aggregate U.S. employment rate also fell, the decline was much more moderate for the country’s overall workforce. (See Figure 4.)
Figure 4
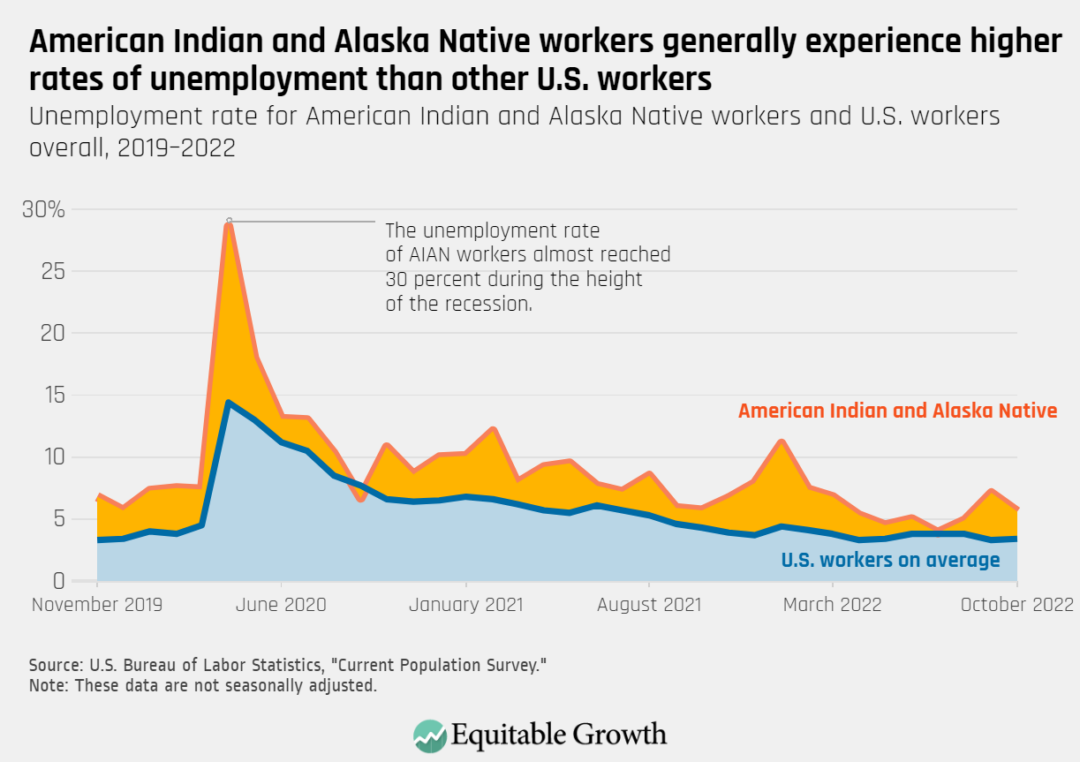
At the same time, the unemployment rate of AIAN workers reached a recession high of more than 28 percent, a rate that was more than double the national unemployment rate at the height of the recession. (See Figure 5.)
Figure 5
But American Indian and Alaska Native workers faced barriers in the U.S. labor market long before the onset of the pandemic. Research by Equitable Growth grantee Blythe George (now an assistant professor at the University of California, Merced) finds that the decline of industries that have been important sources of employment for certain tribal communities led to weak labor force attachment for male workers there. Research on Native American women in the labor market is limited and more data are needed, but existing empirical findings demonstrates that the intersection of gender for this marginalized group creates further barriers and has resulted in stagnant wage growth, compared to those facing fewer intersecting barriers.
Structural barriers also shape the experiences of Indigenous American workers amid the ongoing pandemic and economic recovery. A recent analysis by Matthew Gregg, senior economist at the Federal Reserve Bank of Minneapolis, and Robert Maxim, senior research associate at The Brookings Institution, explains that while the unemployment rate for Native American workers has improved, these workers still have lower access to remote work. This is probably due to occupational differences, infrastructure issues in housing and broadband access, discrimination, and other factors.
The Bureau of Labor Statistics began separately reporting monthly data on American Indian and Alaska Native unemployment earlier this year, but more comprehensive and granular data are needed to fully understand the current employment situation for these workers to inform future policy. In addition to improving data collection, Randall Akee, a senior economist at the Council of Economic Advisers (on leave from the University of California, Los Angeles) and an Equitable Growth grantee, has written about the importance of supporting tribal sovereignty and industry innovation, as well as reducing barriers to economic development, in order to improve economic and labor conditions of American Indian workers and their families.
Native Hawaiian and Pacific Islander workers
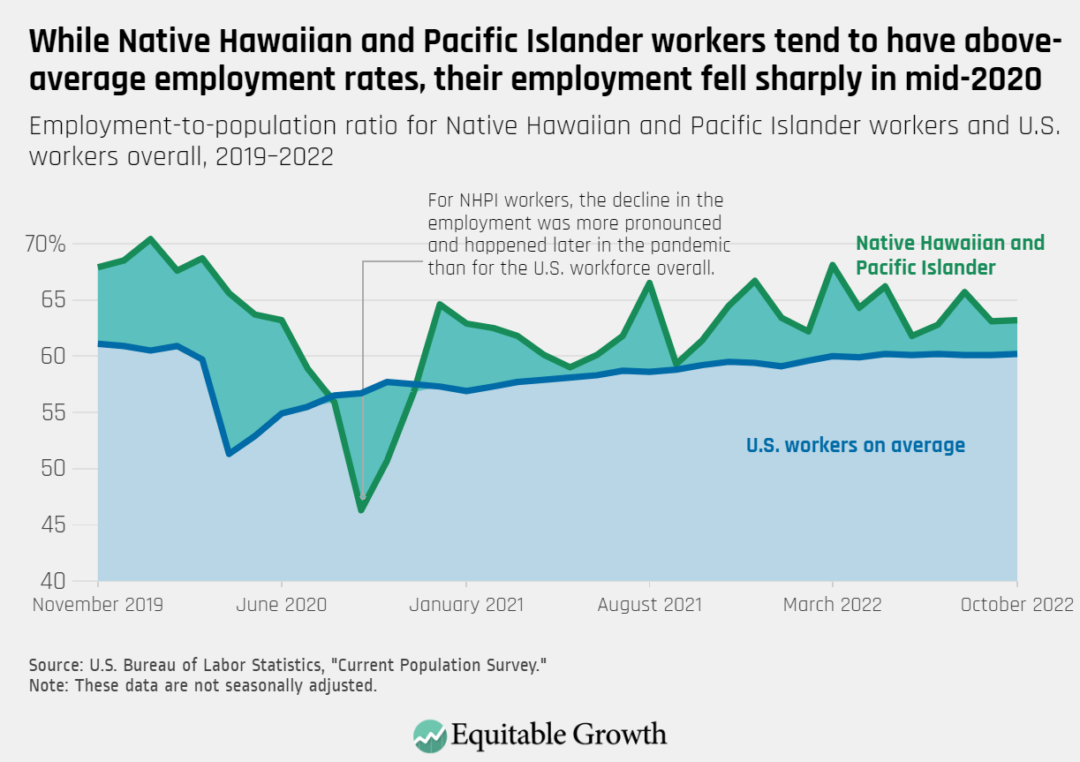
Native Hawaiian and Pacific Islander workers, BLS data show, generally experience higher employment rates and similar unemployment rates as U.S. workers on average. Part of the reason is that this group of workers is more likely to be between the ages of 25 and 54, the range that economists consider to be the “prime-age” working population. In mid-2020, however, Native Hawaiian and Pacific Islander workers experienced a deeper—and later—decline in employment than U.S. workers overall. (See Figure 6.)
Figure 6
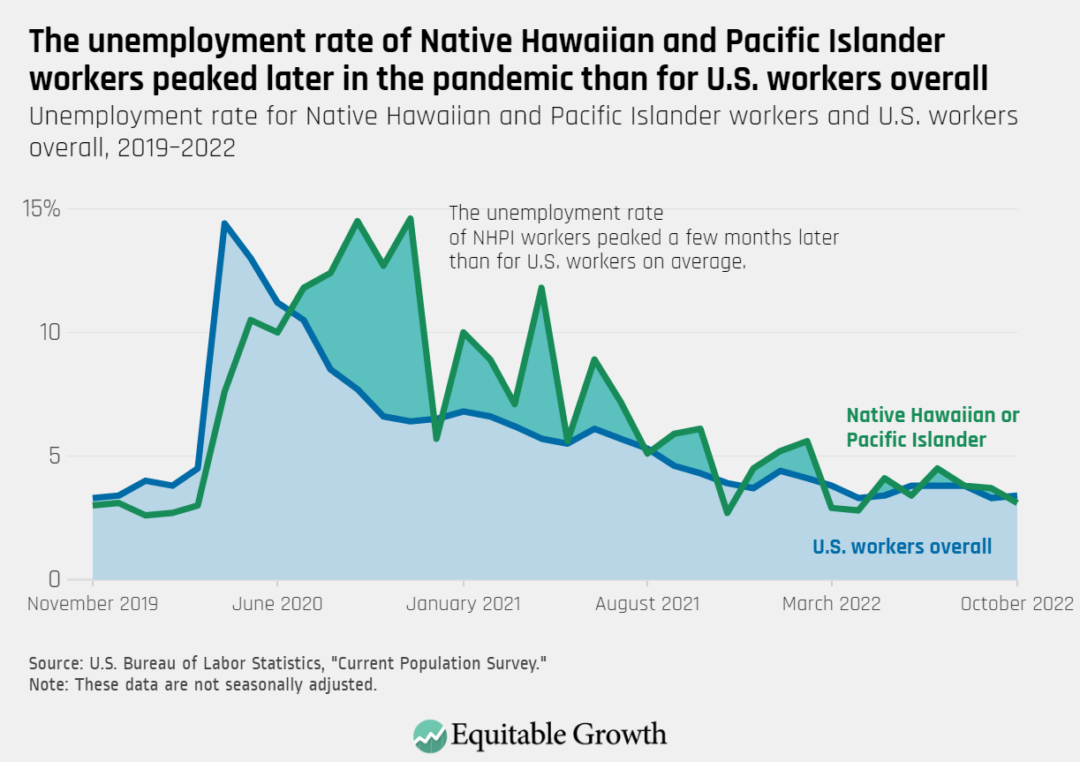
The NHPI unemployment rate saw a similar increase as the national unemployment rate. Like the decline in employment, however, these workers experienced the highest joblessness rate in the fall of 2020, rather than in the spring of that year. (See Figure 7.)
Figure 7
What explains this lag? Research by Julie Cai at the Center for Economic Policy Research finds that in 2021 and early 2022, Asian American workers and NHPI workers were less likely than other groups of workers to find a job if they became unemployed. This lower probability of reemployment held, Cai finds, even when accounting for levels of formal education, state of residence, and age, and was especially true for Asian American and NHPI women.
There is not much empirical evidence yet on what drove these lower unemployment-to-employment transition rates, but recent data do show that the pandemic affected service-providing occupations in which NHPI workers are overrepresented, which likely played a role. In addition, there is evidence that the surge in discrimination against Asian American communities and NHPI communities hurt the economic outcomes of these workers and business owners.
Determining fiscal and monetary policies in a ‘tight’ labor market that is now also cooling
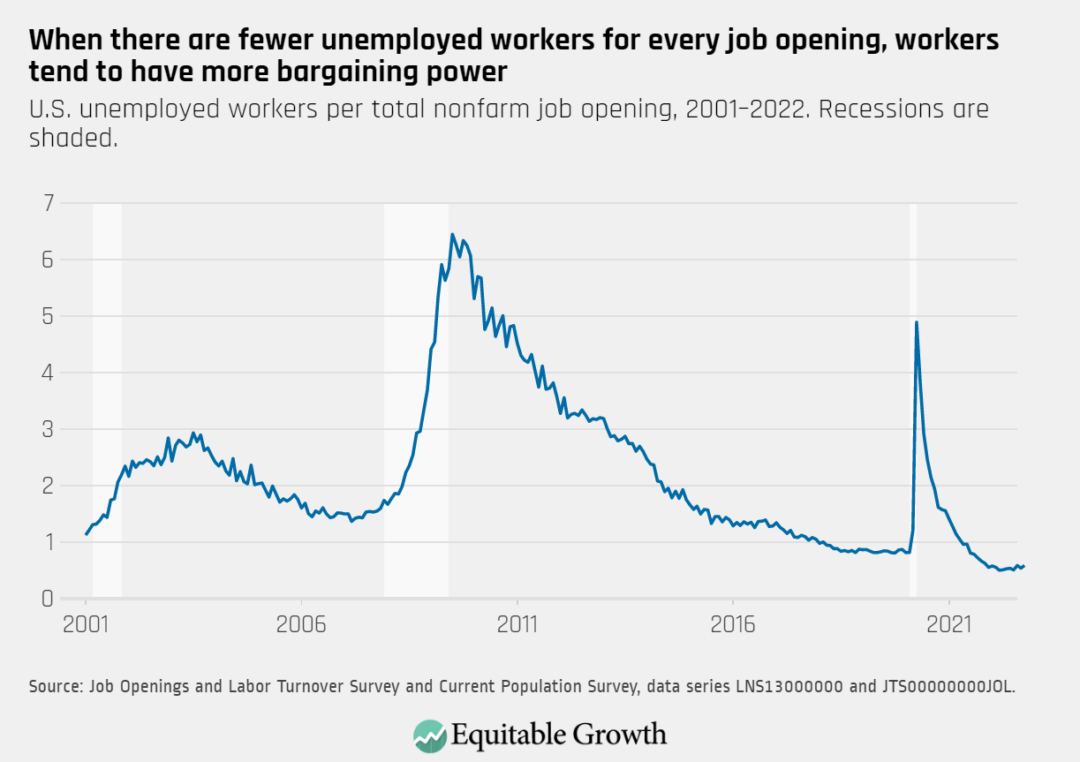
Broadly, a tight labor market is one in which demand for workers is strong, most people who can and want to work are able to find a job, and workers are in a good position to bargain for better wages. One important metric that economists use to determine the degree of “tightness” or “slack” in the labor market is the ratio of unemployed workers per job opening. In a hot or tight labor market, there will be few unemployed workers for every job vacancy. Conversely, when there is a lot of slack or the labor market is loose, there are many unemployed workers for every job opening.
By this metric, the labor market is currently extremely tight. During the height of the recession, there were about five unemployed workers for every job opening. In the past year or so, however, there have been about two job openings for every unemployed worker. (See Figure 8.)
Figure 8
But there are other ways to measure labor market tightness. The unemployment rate, wage growth, and the share of workers who quit their jobs in a given month also capture information on the degree to which employers are looking and competing for workers.
In addition, research by Katherine Abraham, John Haltiwanger, and Lea Rendell at the University of Maryland, College Park proposes that the standard measures of labor market tightness can fail to accurately capture how difficult it is for workers to get a job and for employers to hire workers. This is because economists and policymakers alike do not normally account for job switchers, for workers who are not actively participating in the labor force, and for the effort employers are making to hire workers.
Abraham, Haltiwanger, and Rendell propose that during economic downturns, the intensity with which firms hire workers declines since there is a larger pool of both employed and unemployed workers competing for job opportunities. During booms, firms have to ramp up their efforts to hire by paying higher wages, offering more or better benefits, lowering the amount of experience or educational attainment required of candidates, or investing in their recruitment processes.
Currently, there is some evidence that U.S. employers’ hiring intensity is declining. Not only is wage and employment growth tempering, but less traditional indicators suggest that businesses are having an easier time filling their job openings, too. LinkedIn data show, for instance, that firms’ willingness to offer remote positions is lower now than it was early in 2022, when about 20 percent of job listings offered remote work. As such, even though 50 percent of all job applications went to remote positions, as of October of this year, only 15 percent of all job postings offered remote work.
An analysis by Burning Glass Institute, a think tank that advances research on the future of workers, is equally telling. It shows that while the share of job postings that require a bachelor’s degree declined substantially in 2020—evidence that employers are willing to ask for fewer credentials in order to fill their open positions—in 2022, this number started to increase again.
A cooling labor market means policymakers should consider how that affects different groups of workers and boost institutional support for worker power for a robust recovery
It is important for policymakers to understand the causes and consequences of persistent disparities by race, ethnicity, and gender within the context of relative labor market tightness. As the Federal Reserve Board of Governor’s Federal Open Market Committee continues to address elevated inflation with monetary policy and other policymakers reinforce these efforts through fiscal policy, the data discussed above demonstrate that an economic expansion is not sufficient to ensure convergence in labor market outcomes across groups of U.S. workers.
Furthermore, there is limited evidence that wage gains are a significant cause of current inflation. Designing economic policy for the current moment without attention to these details risks further entrenching disparities that limit U.S. economic growth by holding back the potential and economic security of groups with lower levels of educational attainment and those that have been historically marginalized and excluded from economic opportunities due to structural racism and sexism.
Though wages have been rising for workers at the bottom of the wage distribution, and many gaps narrowed during the rapid labor market recovery, the policies and institutions that fostered the rapid rise in economic inequality over the past four decades remain without a sufficient countervailing force. Inequality continues to be a drag on U.S. economic growth.
As monthly gains in the U.S. labor market naturally temper over the coming months, fundamental policies to improve worker outcomes are still lacking, including a sufficient minimum wage, the ability to unionize workplaces, and protection against discrimination. Workers of color remain vulnerable to outsized impacts from future downturns—perhaps even more so now, after the stresses of the pandemic, including family health shocks and caregiving needs, and a higher likelihood of job displacement and unemployment scarring.
The upshot? A focus on topline labor market indicators by policymakers from the Monthly Jobs Report as part of the effort to mitigate inflation will ultimately reduce the effectiveness of economic policy tools that foster robust and inclusive U.S. economic growth. Understanding the disaggregated nuances of the U.S. labor market is key to effective monetary and fiscal policymaking.