Seven graphs to consider while watching the State of the Union address

During his State of the Union Address, now scheduled for February 5, President Donald Trump will no doubt discuss the condition of the U.S. economy, the impact of the Tax Cut and Jobs Act of 2017, and related issues. The Washington Center for Equitable Growth has compiled seven graphs that provide useful context for the speech. They suggest that while the economy may be growing, the benefits of that growth have not been widely shared. Similarly, the benefits of the president’s tax cuts have gone largely to the wealthy. The United States has become a far less economically mobile society, and the jobs of too many workers do not provide real security. These and other facts laid out in these graphs are worth considering when Congress gathers to hear the president.
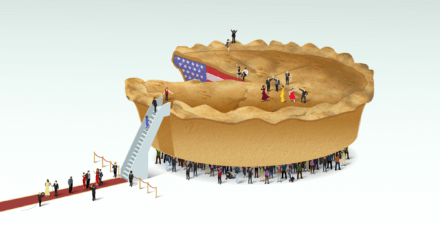
Perhaps the starkest trend in the United States in recent decades is increasing income inequality. The latest published data gives policymakers the best look yet at levels of income inequality, and confirms the high levels other studies have shown. (See Figure 1.)
Figure 1

In the 1960’s and ’70s, the income of low-income earners rose more rapidly than the average and most Americans saw their incomes grow at about the average. But since 1980 the average has become a poor indicator of progress, with most Americans experiencing worse growth than average while a small number at the very top experience very high growth. (See Figure 2.)
Figure 2
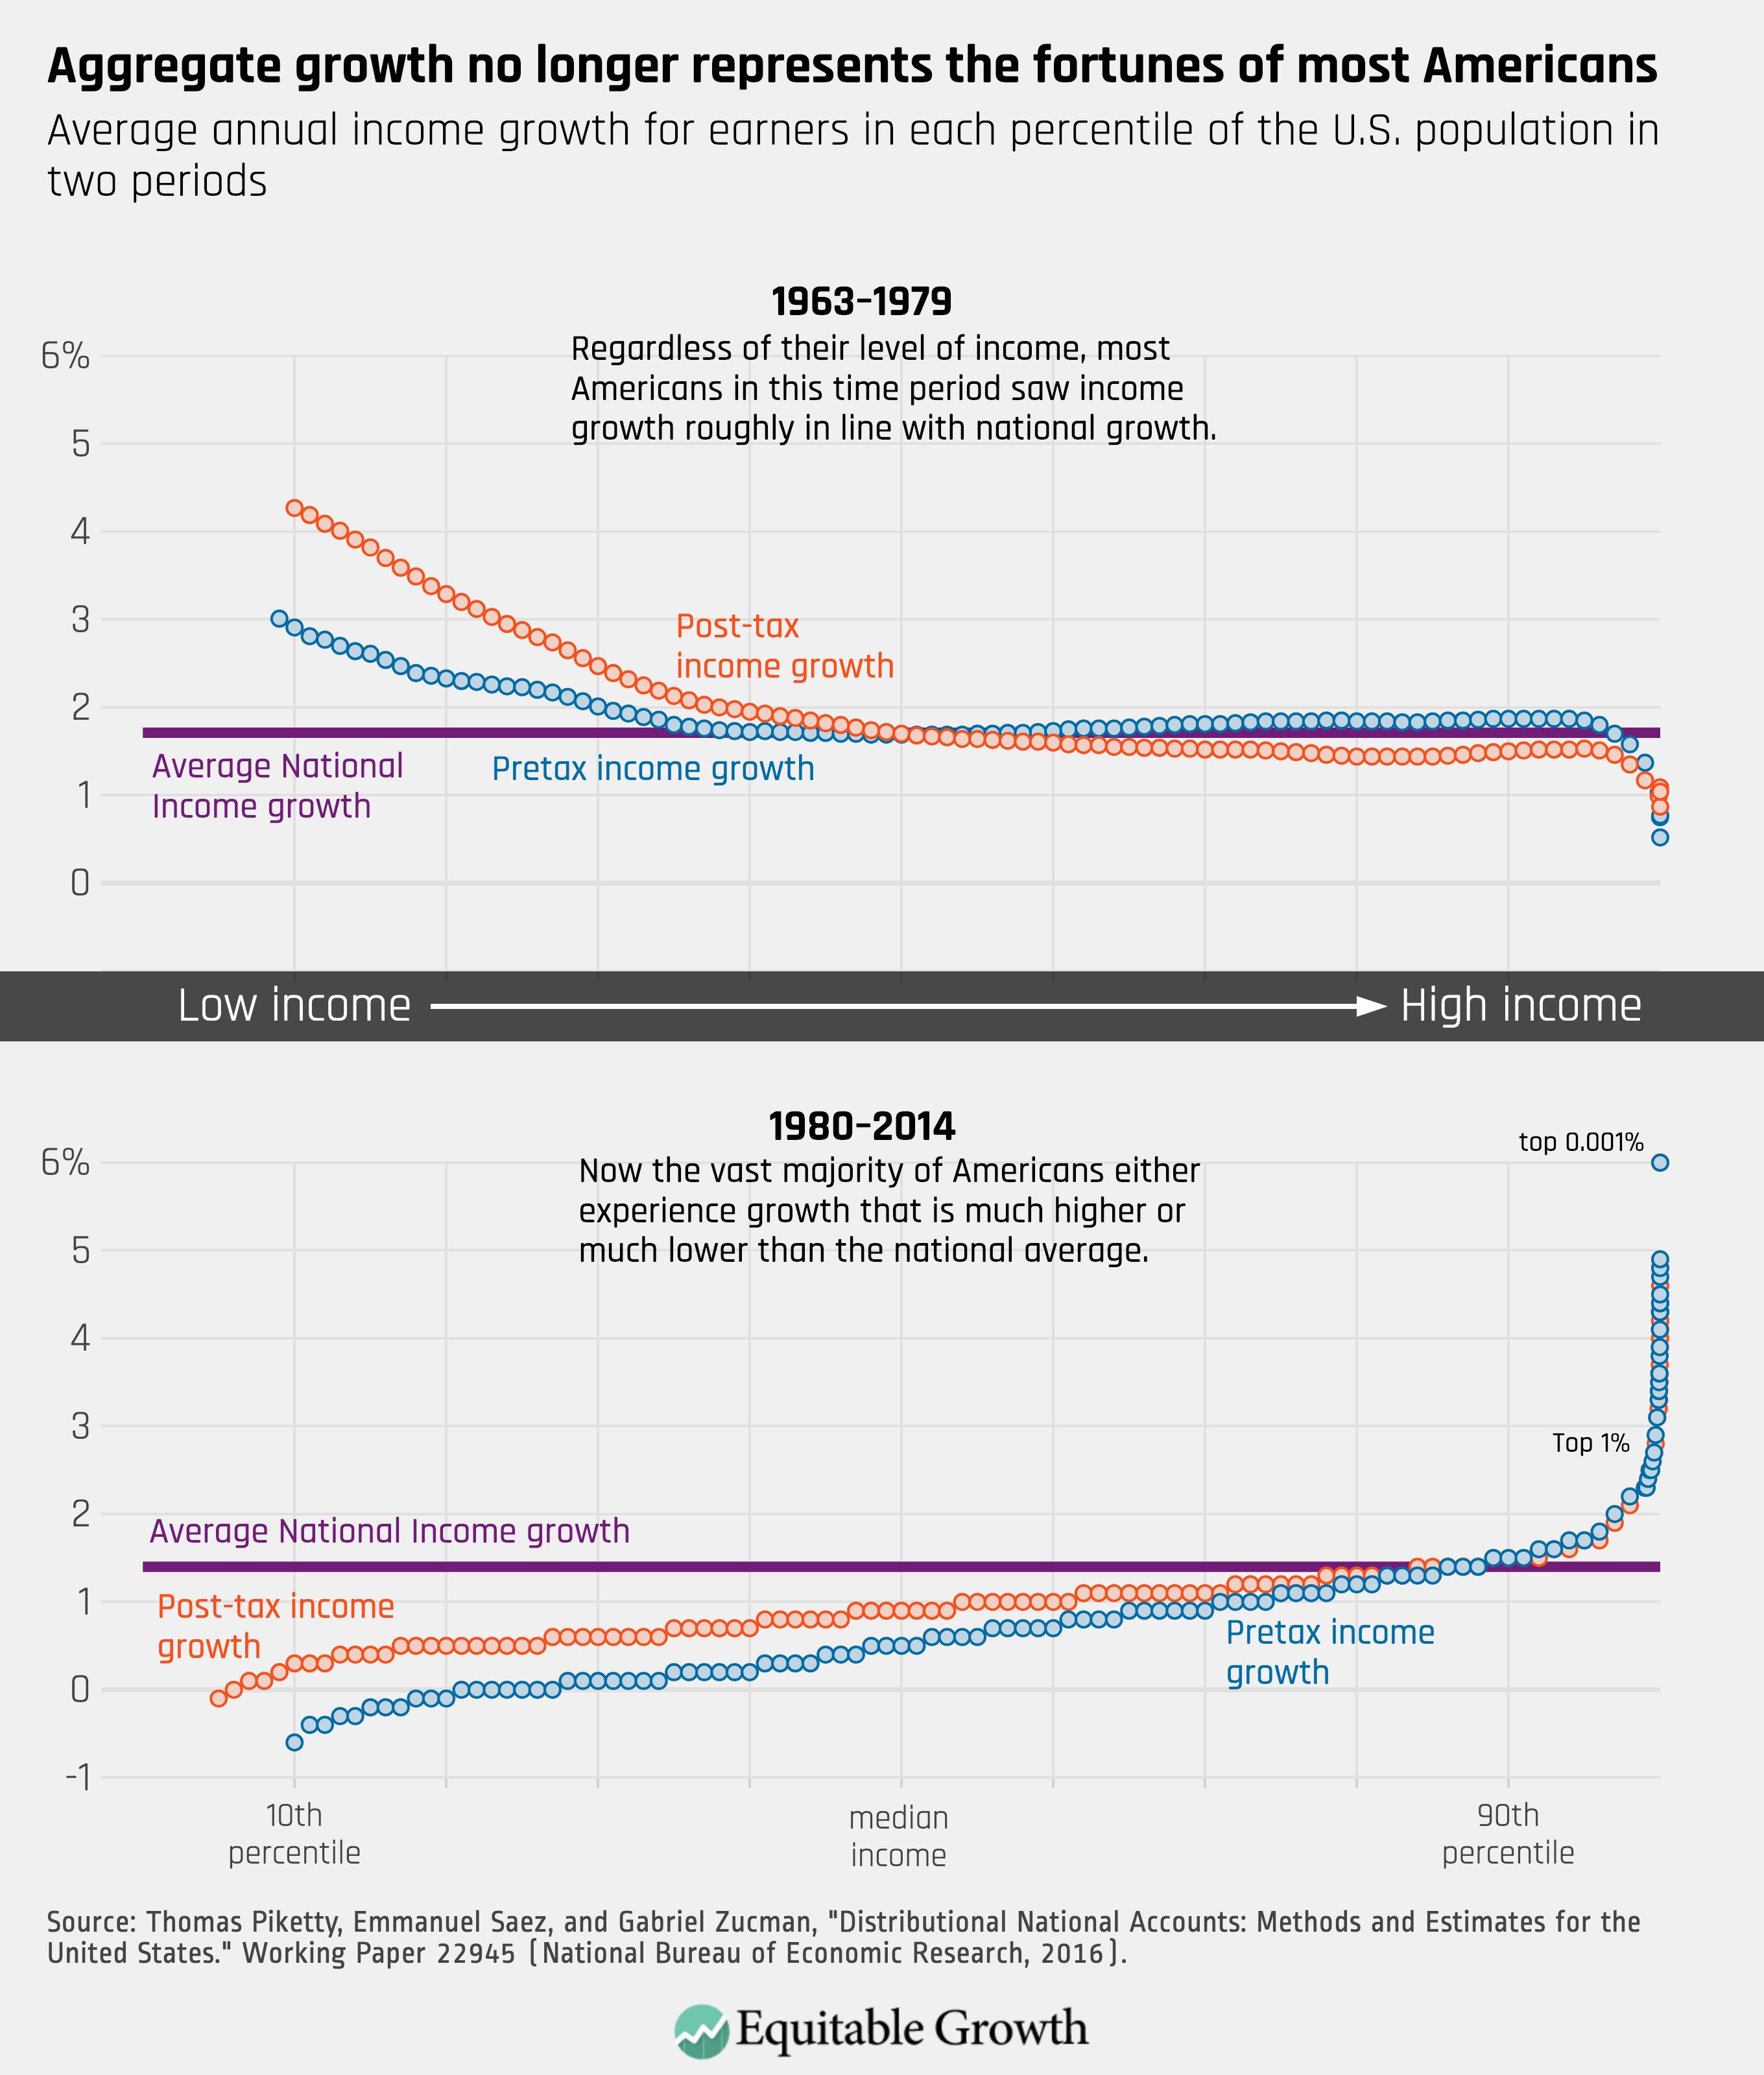
Indeed, Figure 2 shows that aggregate measures such as Gross Domestic Product and National Income don’t distinguish among income groups. The disconnect shown in this graphic demonstrates the need for new measures of economic progress that disaggregate growth and tell us which groups are benefitting from economic prosperity and which are not.
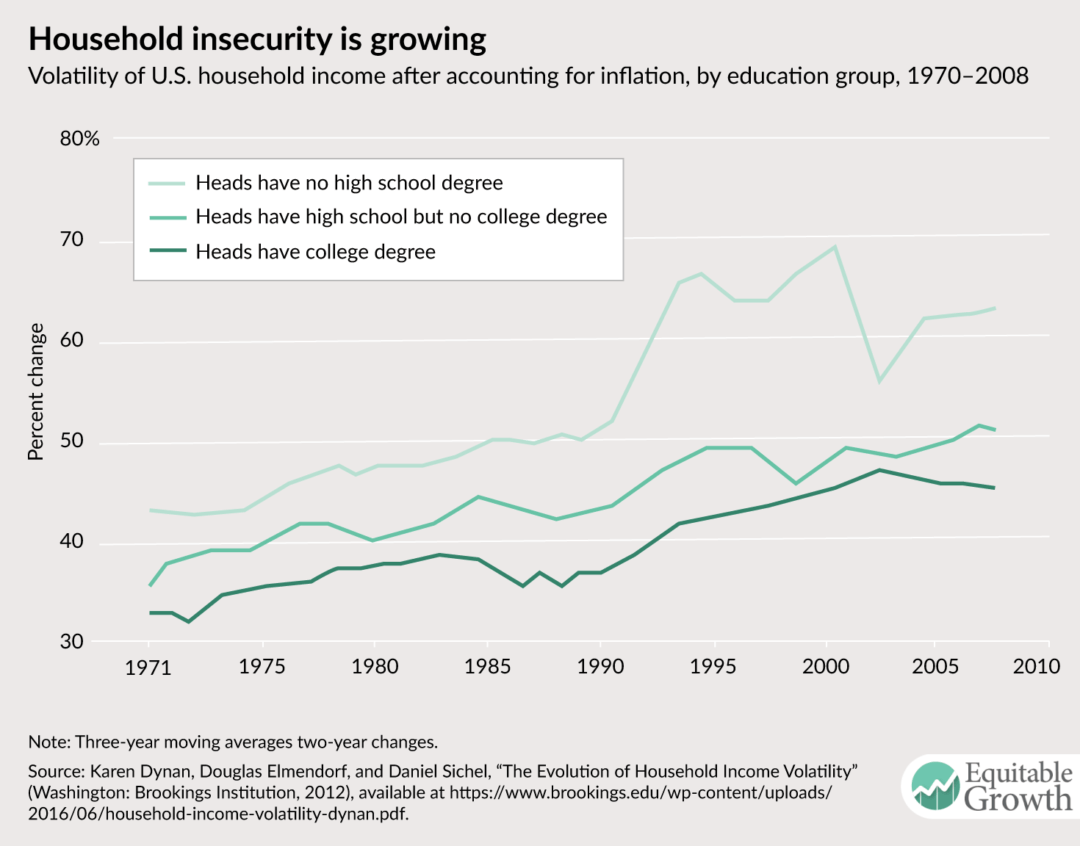
Volatility of household income—meaning the degree to which a family’s income is not dependable or predictable from year to year—is a key measure of household economic security. For the period most recently measured, volatility rose significantly, especially for families whose head lacked a high school degree. (See Figure 3.)
Figure 3
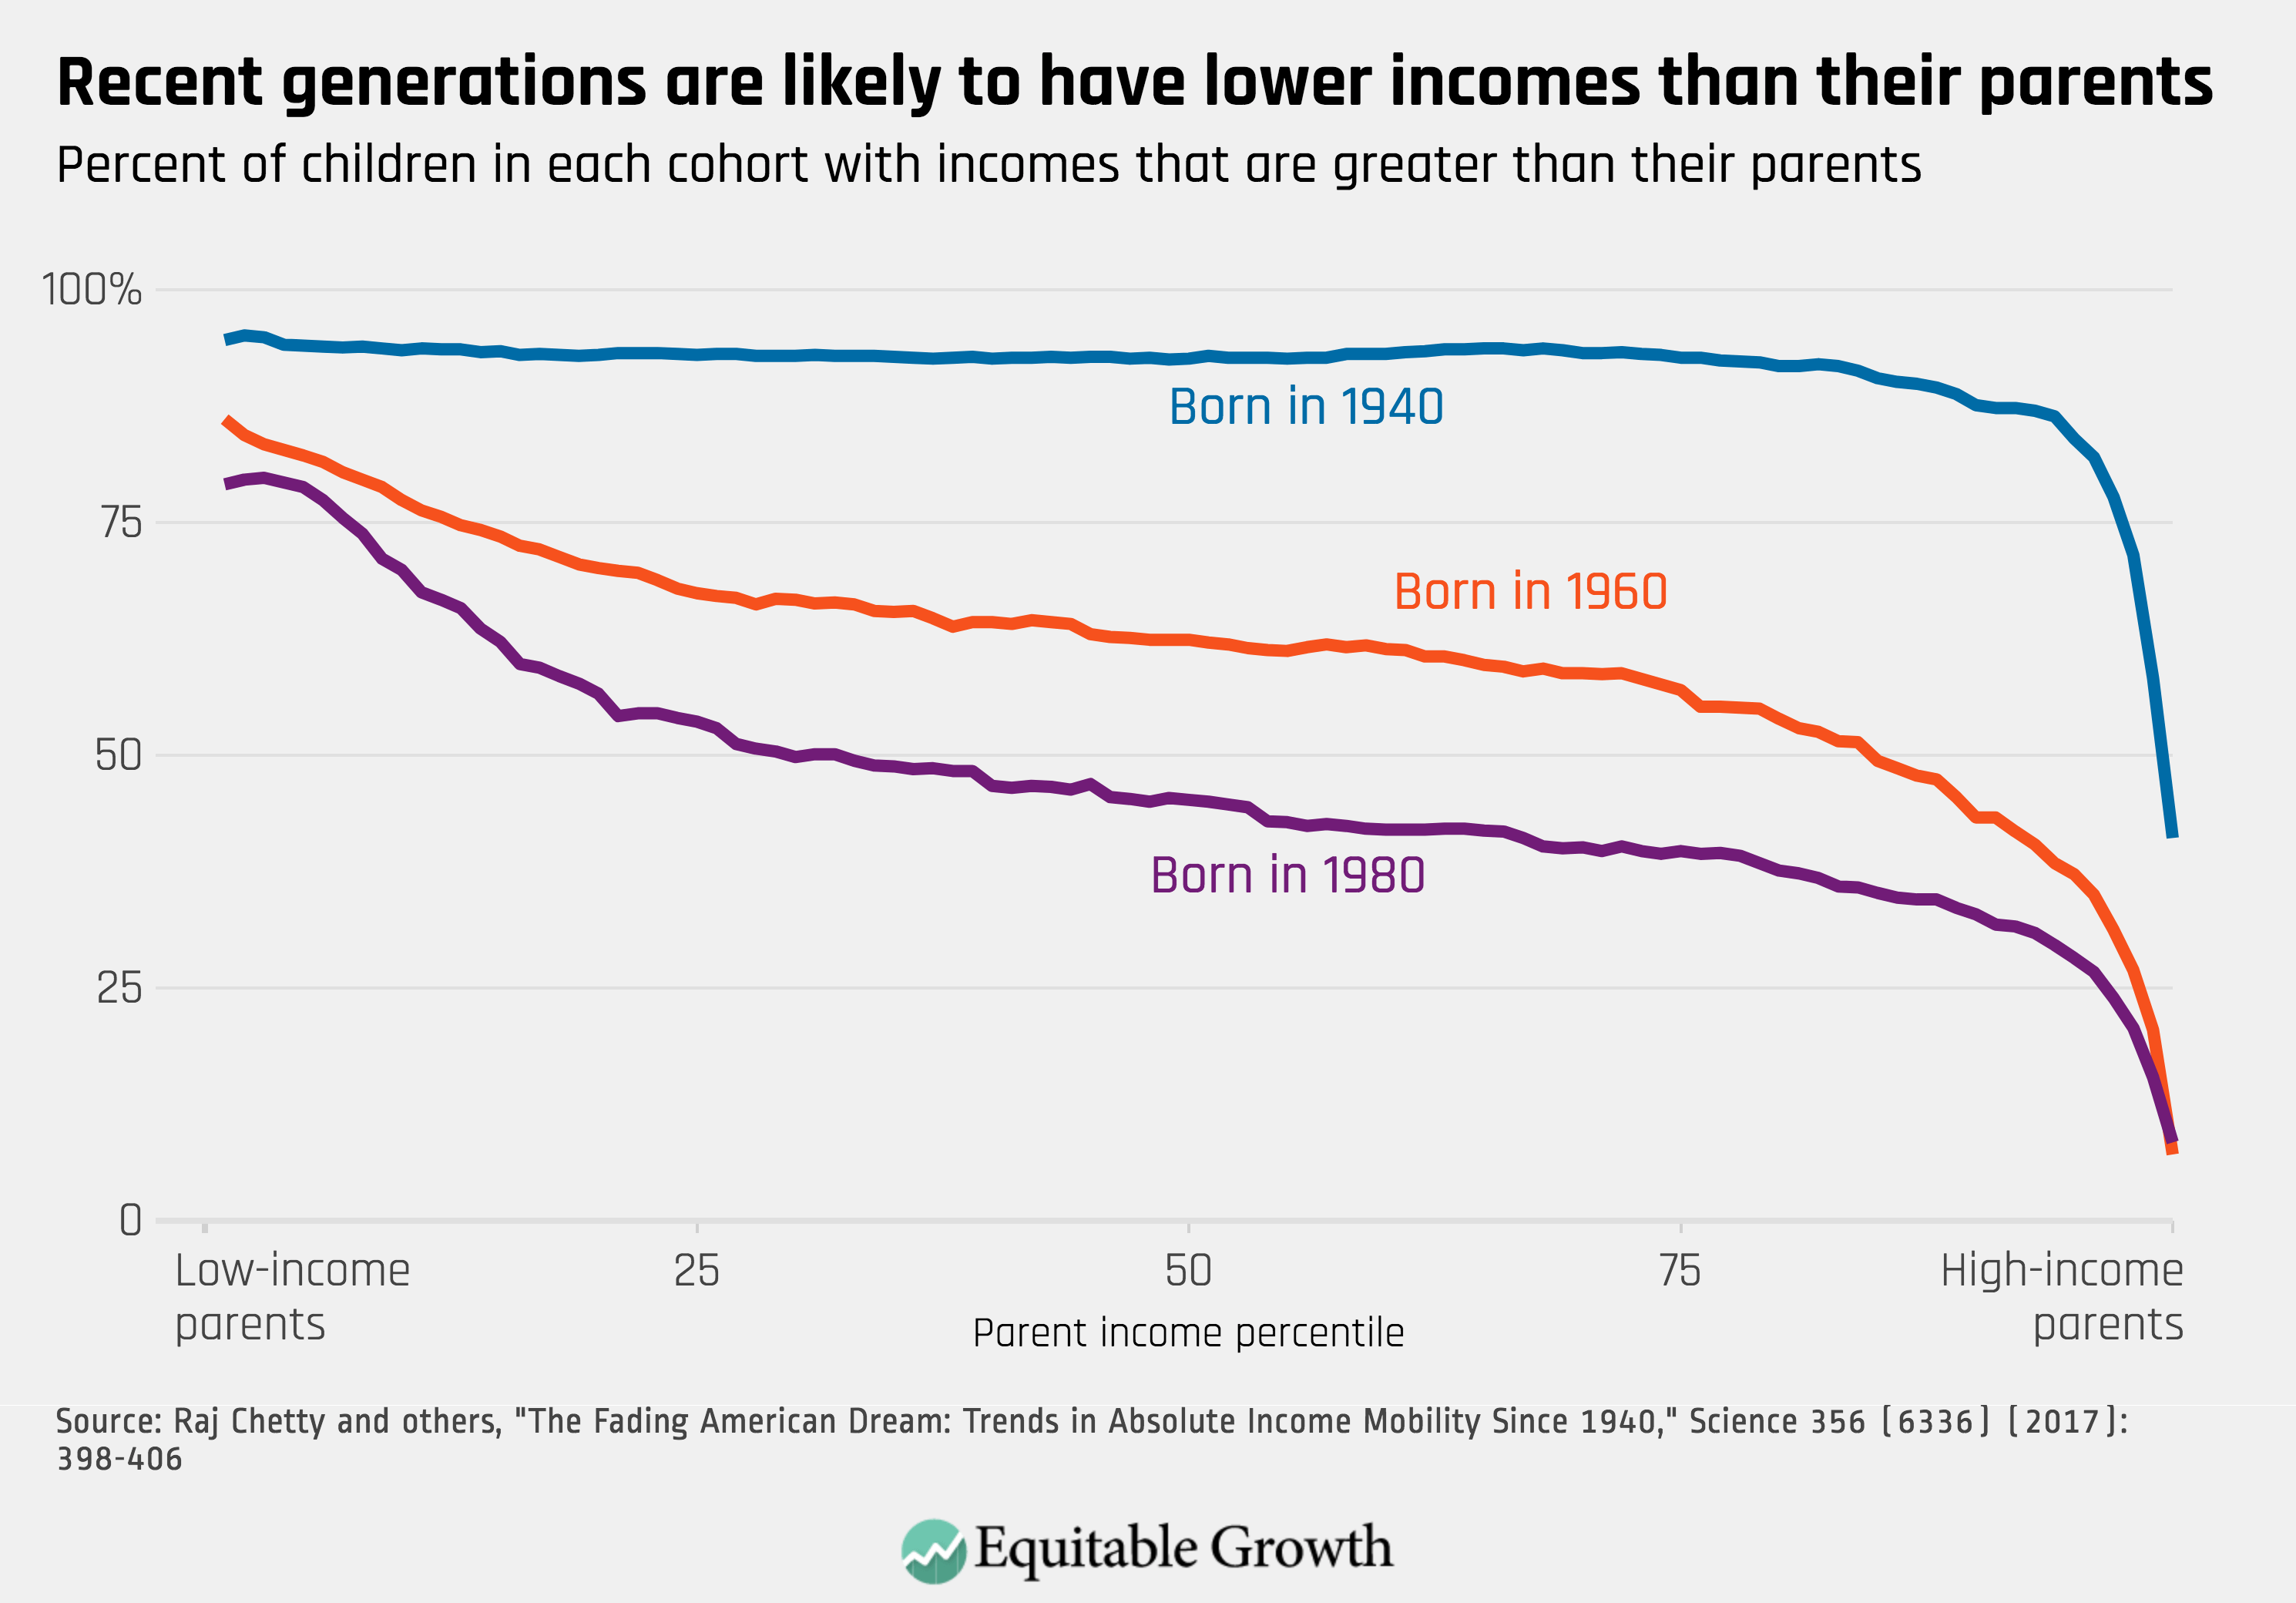
Our society has prided itself on its mobility—the American Dream has been that children would earn more than their parents. But absolute mobility has declined dramatically. More than 90 percent of children born in 1940 earned more than their parents at age 30. Only 50 percent of children born in 1980 did so. (See Figure 4.)
Figure 4
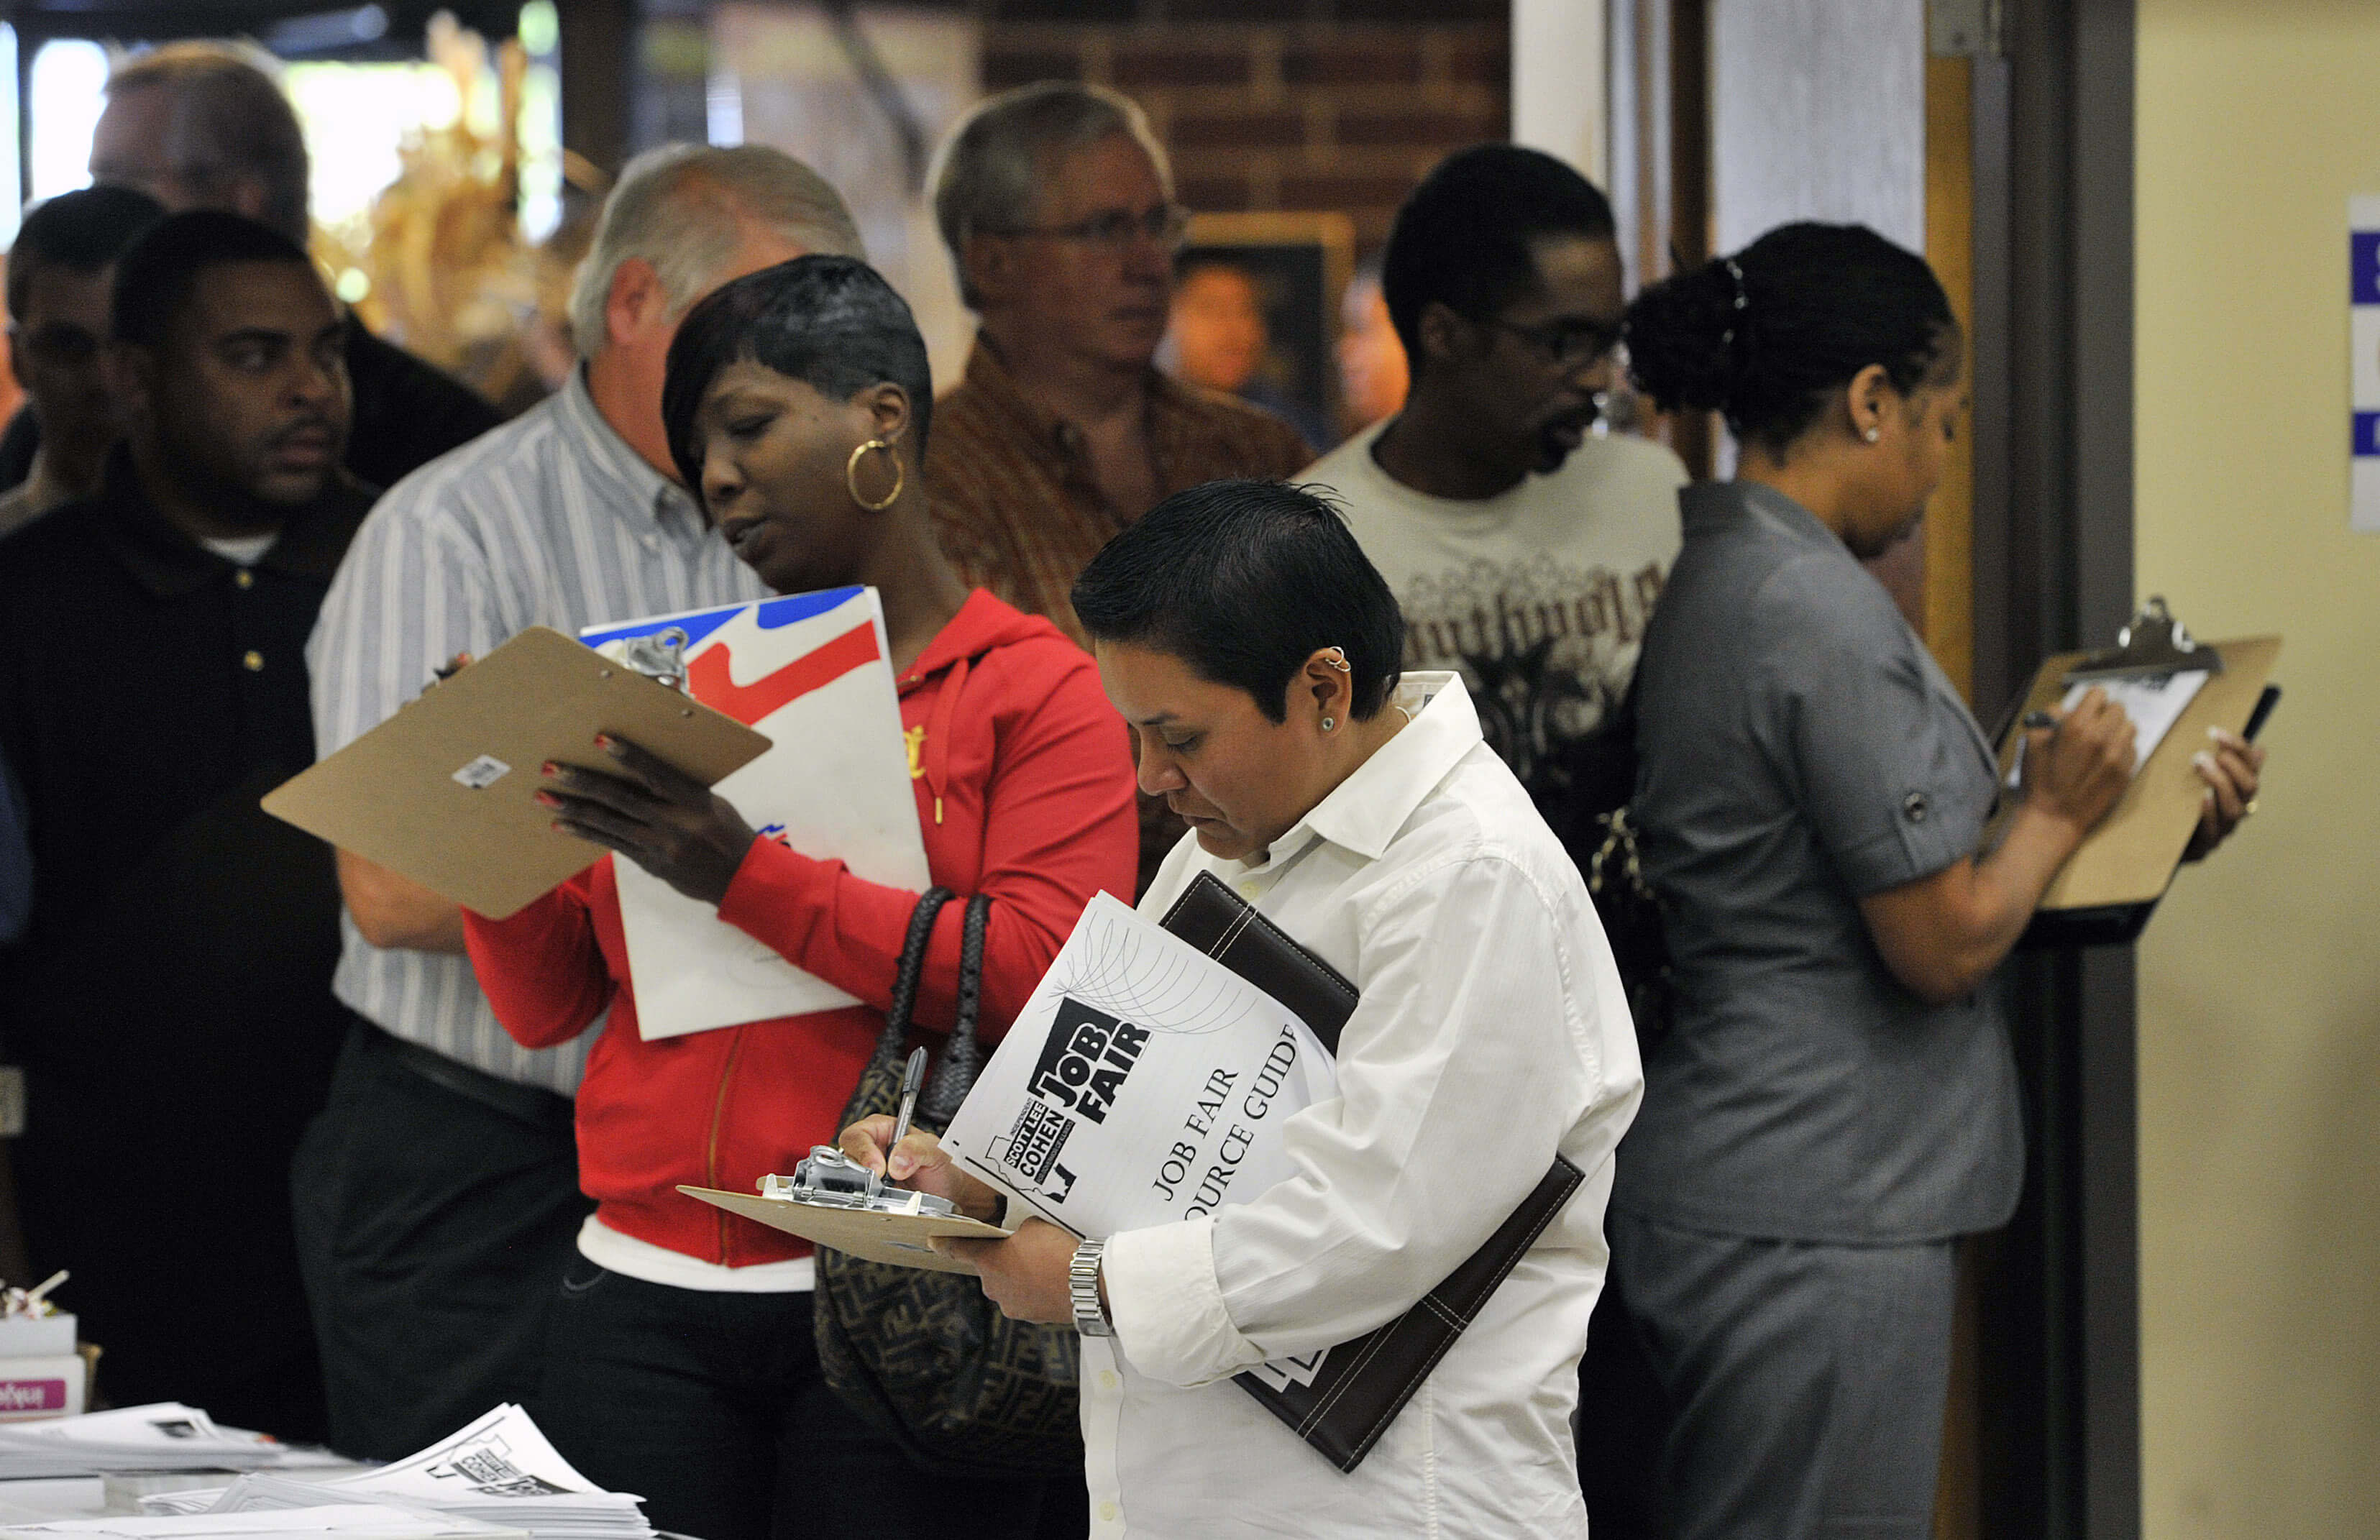
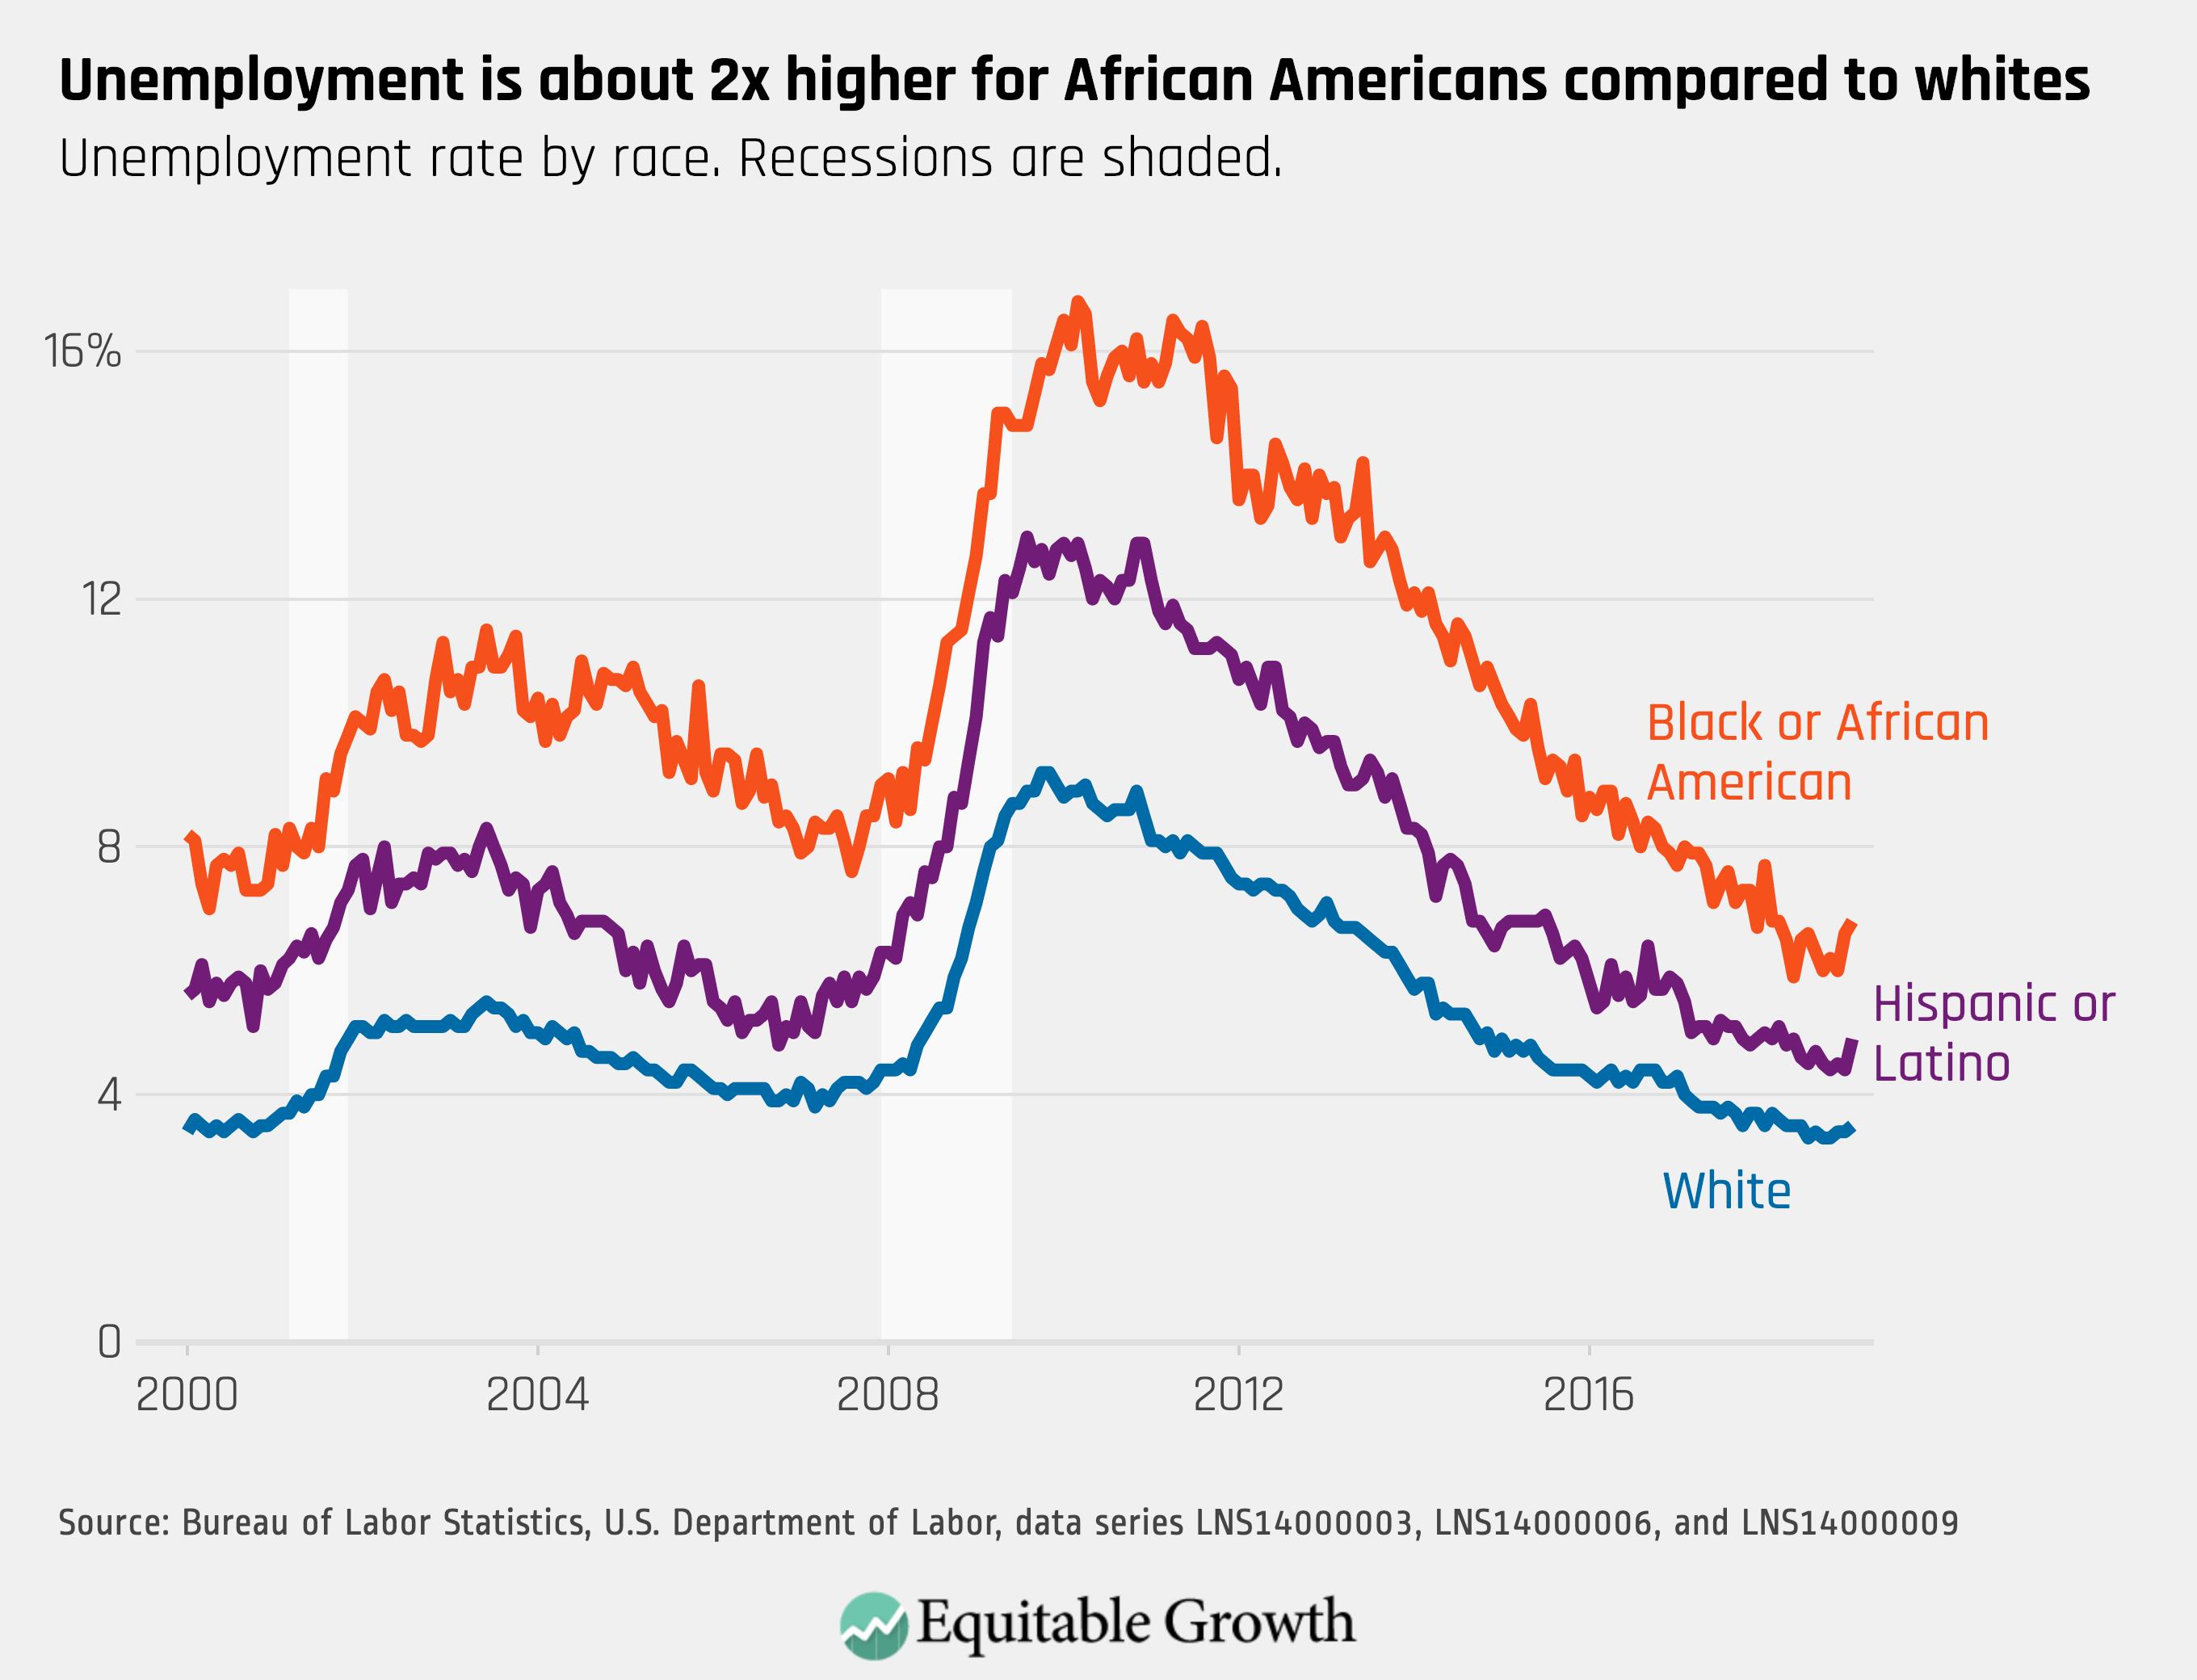
As the labor market continues to tighten, with fewer unemployed workers than there are job openings, significant structural differences remain in employment outcomes for workers. Unemployment continues to be twice as high for African American workers than white workers, and Hispanic workers also face a higher unemployment rate than white workers. (See Figure 5.)
Figure 5
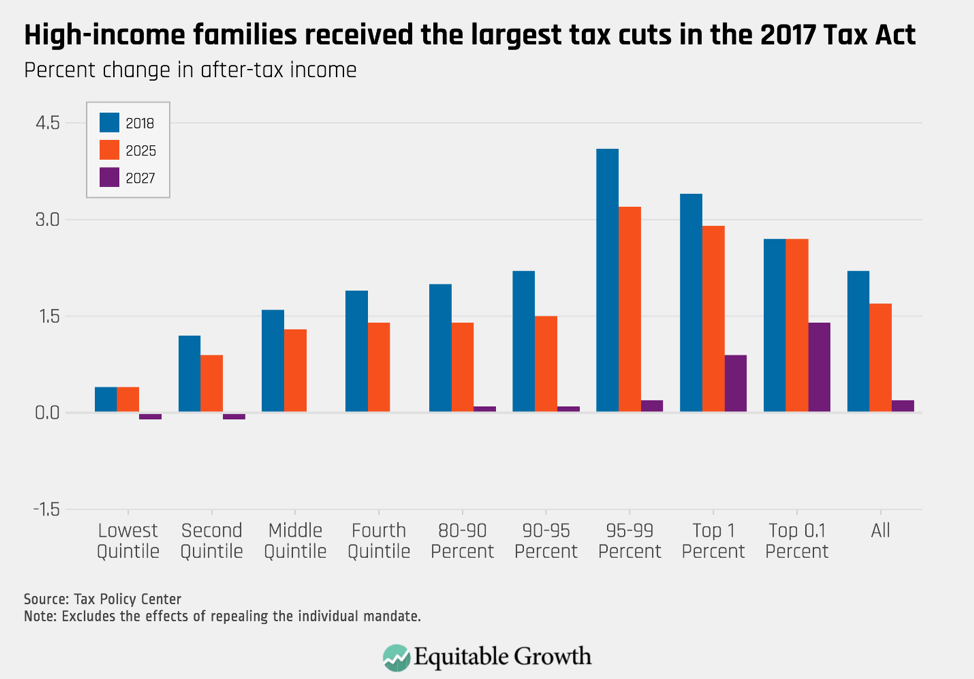
The 2017 Tax Cuts and Jobs Act delivered a highly regressive tax cut that provided most of its benefits to high income taxpayers. (See Figure 6.)
Figure 6
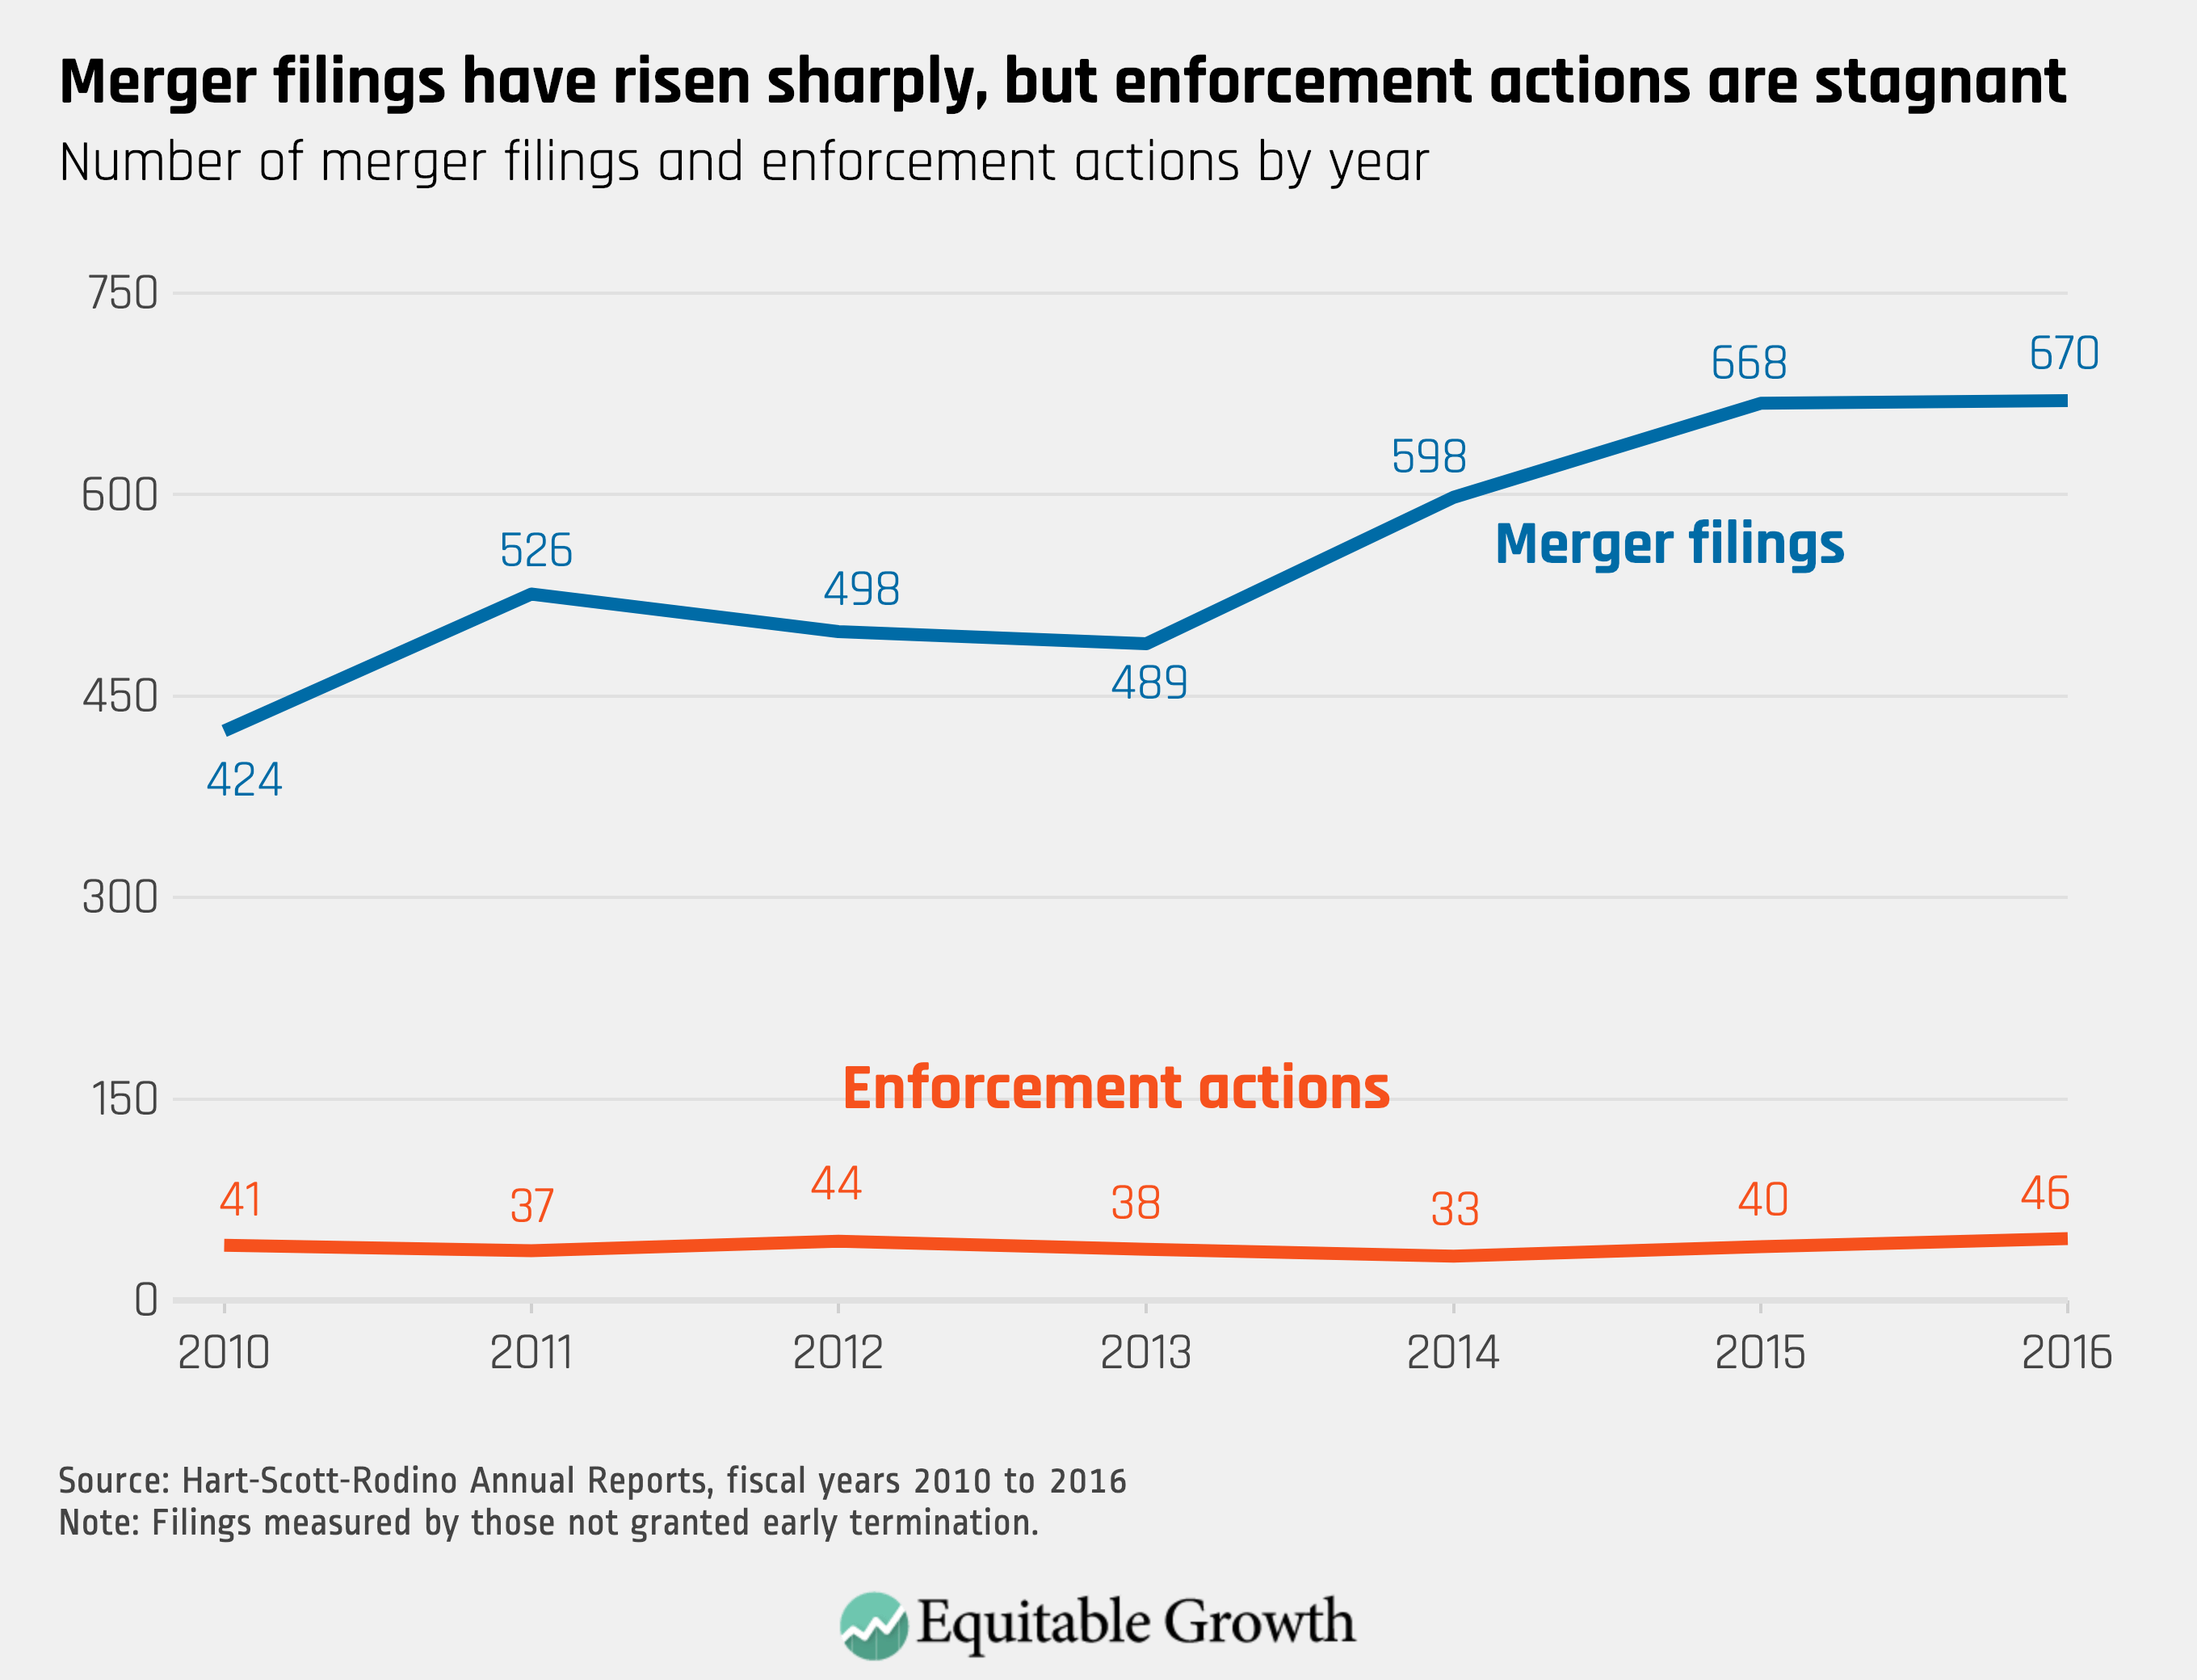
Antitrust enforcement matters to an equitable economy because the less competition in the marketplace, the harder it will be for the economy to expand and for economic opportunity to flourish. Yet despite the recent rapid rise in corporate mergers, the number of enforcement actions has remained essentially flat. (See Figure 7.)
Figure 7
Conclusion
The State of the Union address tomorrow will kick off a debate in Congress on fundamental economic issues facing the American people. These charts should help inform that debate and encourage policymakers to promote strong, stable, and broad-based economic growth.