Women have made the difference for family economic security

Overview

The steady movement of women into the U.S. workforce over the past half-century has dramatically changed the composition of family incomes across the country and up and down the income ladder. All these additional earnings, however, have not meant that family income has increased faster than in earlier eras. A breadth of research demonstrates that overall family economic security in the United States has been declining since the 1970s, especially among low- and middle-income families. As a result, even as more women have joined the labor force and families have lost their time for caregiving, too many families’ continue to face economic insecurity.

This issue brief explores how over the past four decades, women’s increased earnings and increased annual hours of work have been essential as families across the United States seek to find and maintain economic security. Using data from the Current Population Survey, we document how family income has changed between 1979 and 2013 for low-income, middle-class, and professional families, decomposing the differences in male earnings and female earnings from greater pay, female earnings from more hours worked, and other sources of income over this time period.

Download File
Women have made the difference for family economic security (pdf)

Read the full PDF in your browser

This analysis is an extension and update of the analysis presented in the forthcoming book “Finding Time: The Economics of Work-Life Conflict” authored by one of the co-authors of this issue brief, Equitable Growth’s Executive Director and Chief Economist Heather Boushey. Here are our key findings:

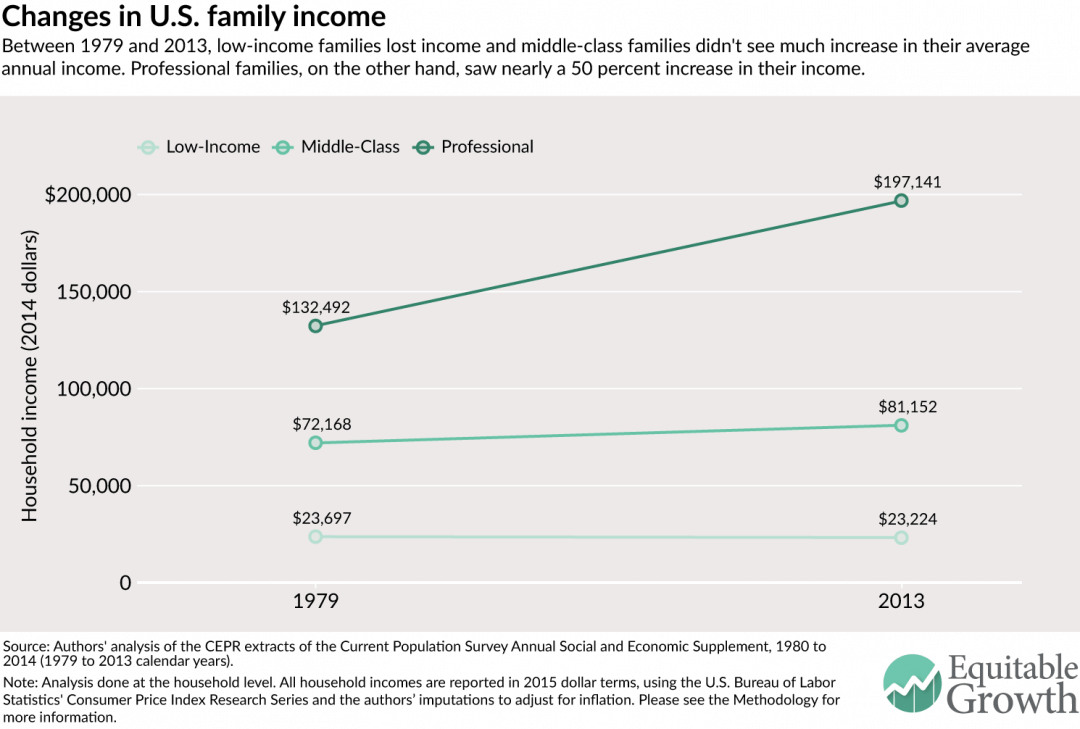
  • Between 1979 and 2013, on average, low-income families in the United States saw their incomes fall by 2.0 percent. Middle-income families, however, saw their incomes grow by 12.4 percent, and professional families saw their incomes rise by 48.8 percent.
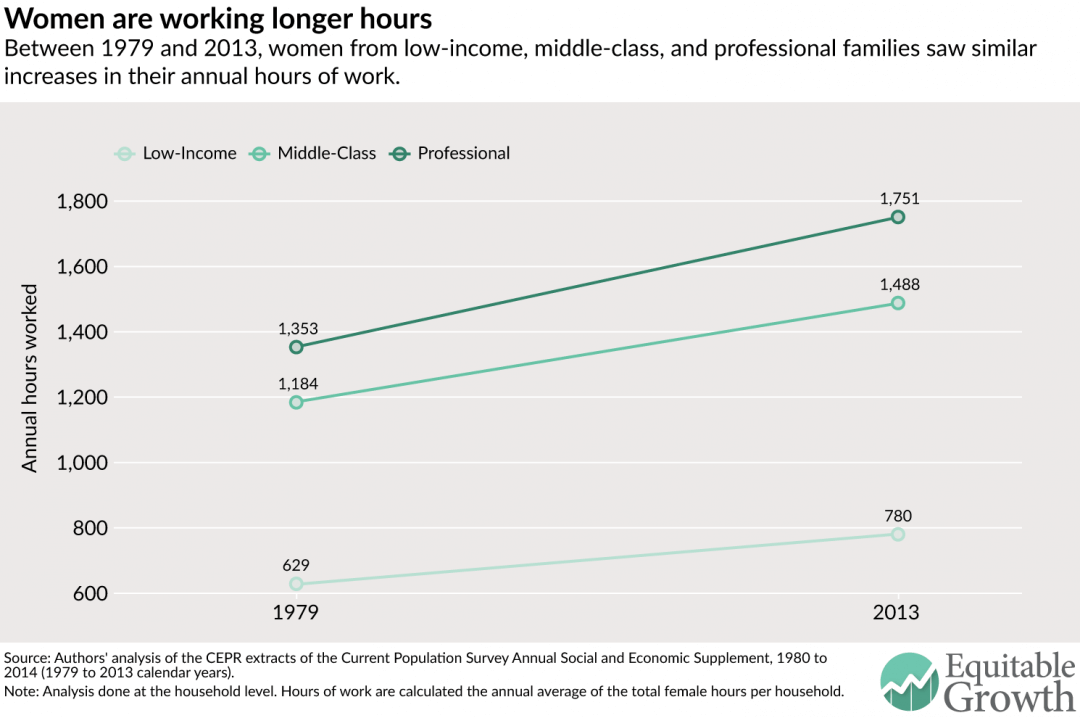
  • Over the same time period, the average woman in the United States saw her annual working hours increase by 26.4 percent. This trend was similar across low-income, middle-class, and professional families.
  • Across all three income groups, women significantly helped family incomes both because they earned more per hour and worked more per year. Women’s contributions saved low-income and middle-class families from steep drops in their income.

These findings establish that working women, especially those within low-income and middle-income families, have made the key difference in securing earnings for their families. Without women’s added earnings, families would be much worse off.

Women’s changing role in the U.S. labor force

An increasing number of families across the United States, especially low- and middle-income families, are becoming less economically secure. This trend began more than four decades ago, long before the Great Recession of 2007–2009. In light of this increasing instability and stagnant growth in family incomes, families have had to find ways to cope—including an growing reliance on the earnings of women. The role of women in the United States has transformed from predominantly being a wife or mother to being all of these things and a breadwinner.

Half a century ago, women—especially middle-class women—began entering the U.S. labor force and staying there, although they were still more likely to be their family’s caregiver for children, the aging, and the ill. And starting in the 1970s, more women started gaining professional degrees, which along with other factors contributed to a sharp rise in women’s labor force participation as well, especially for prime-age working women (ages 25 to 54). By 2000, about 60 percent of all U.S. women were in the labor force, which remained the case until the financial crash in 2007 and the ensuing Great Recession. (See Figure 1.) 

Figure 1
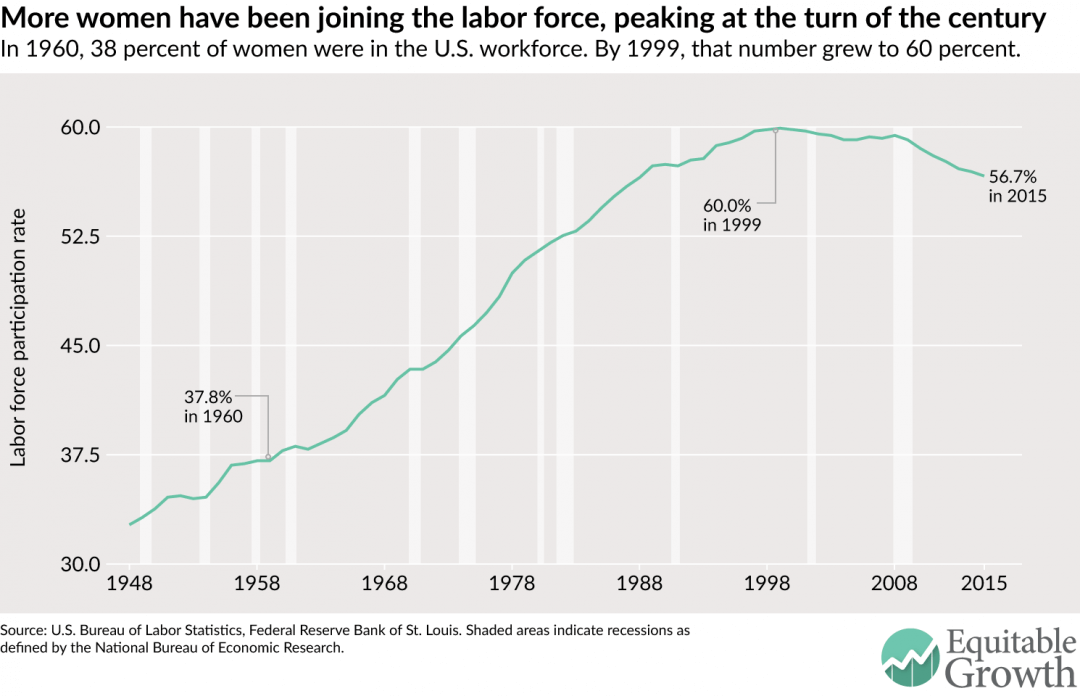
 

As women engaged more in the labor force, they also started working more hours on average. In 1979, 28.6 percent of all U.S. women were working full time. By 2007, right before the Great Recession, this number had increased to 43.6 percent. This change has made a substantial difference at a macroeconomic level: Our gross domestic product in 2012 would have been $1.7 trillion less if women had not increased their working hours over the past four decades.

Updating and building on the findings that Heather Boushey presents in her forthcoming book, “Finding Time: The Economics of Work-Life Conflict,” this brief explores the difference that women’s increased work hours have made at the family level, and how this effect varies for different types of families. Using data from the Current Population Survey, we calculate how family income changed between 1979 and 2013 for low-income, middle-class, and professional families in the United States, decomposing it by differences in male earnings, female earnings, and other sources of income over that time period. We further dissect the change in female earnings to find what portion of that change is due to increases in pay and what portion is due to working more hours in 2013 in comparison to 1979.

Defining income groups

This analysis follows the same methodology presented in “Finding Time.” For ease of composition, we use the term “family” throughout the brief, even though the analysis is done at the household level. We split households in our sample into three income groups. Low-income households are those in the bottom third of the income distribution, which means those earning less than $25,440 per year in 2015 dollars. Professional households are those in the top fifth of the income distribution who have at least one household member with a college degree or higher; in 2015 dollars, these households have an income of $71,158 or higher. Everyone else falls in the middle-class category.

Setting some context

Before we delve into the main analysis, let’s first set some context for how family incomes and women’s hours have changed across low-income, middle-class, and professional families.

How did family incomes change between 1979 and 2013?

The changes in average U.S. family incomes between 1979 and 2013 show widening inequality, consistent with other research. In 1979, low-income families had an average annual family income of $23,697 in 2015 dollars—by 2013, that number dropped by 2.0 percent to $23,224. Middle-class families only fared marginally better: In 1979, they had an average income of $72,168, which by 2013 rose by 12.4 percent to $81,152. Over the same time period, however, professional families saw a 48.8 percent increase in their average income, going from $132,492 in 1979 to $197,141 in 2013. (See Figure 2.)

Figure 2
 

How did women’s working hours change between 1979 and 2013?

Women across all three income groups saw their working hours rise. In 1979, on average, women from low-income families worked 629 hours per year (or 12 hours per week), and by 2013 their annual work hours had grown by 24.1 percent to 780 hours (or 15 hours per week). Similarly, middle-class and professional women’s hours grew by 25.7 percent (from 23 per week in 1979 to 29 hours per week in 2013) and 29.4 percent (from 26 hours per week in 1979 to 34 hours per week in 2013) over that same time period, respectively. (See Figure 3.)

Figure 3
 

Decomposing the changes in family income between 1979 and 2013

Figures 2 and 3 establish that between 1979 and 2013, even as women’s working hours increased at parallel rates for all income groups, family income was either stuck or stalled for low-income and middle-class families. This paradox is resolved when we break down the changes in average family income into male earnings, female earnings, and income from Social Security, pensions, or any other non-employment-related source over that same time period.

Specifically, we divide female earnings into the portion due to women earning more per hour and that due to women working more per year. To calculate female earnings stemming directly from the additional hours worked, we take the difference between 2013 female earnings and the hypothetical earnings of women if they earned 2013 hourly wages, but worked the same hours as women did in 1979. (For more on how we did this calculation, please see our Methodology.) It turns out that this is an important distinction because, as shown in Figure 4, the difference in female earnings due to additional hours has made a significant positive difference for every income group, especially for low-income and middle-class families. (See Figure 4.)

Figure 4
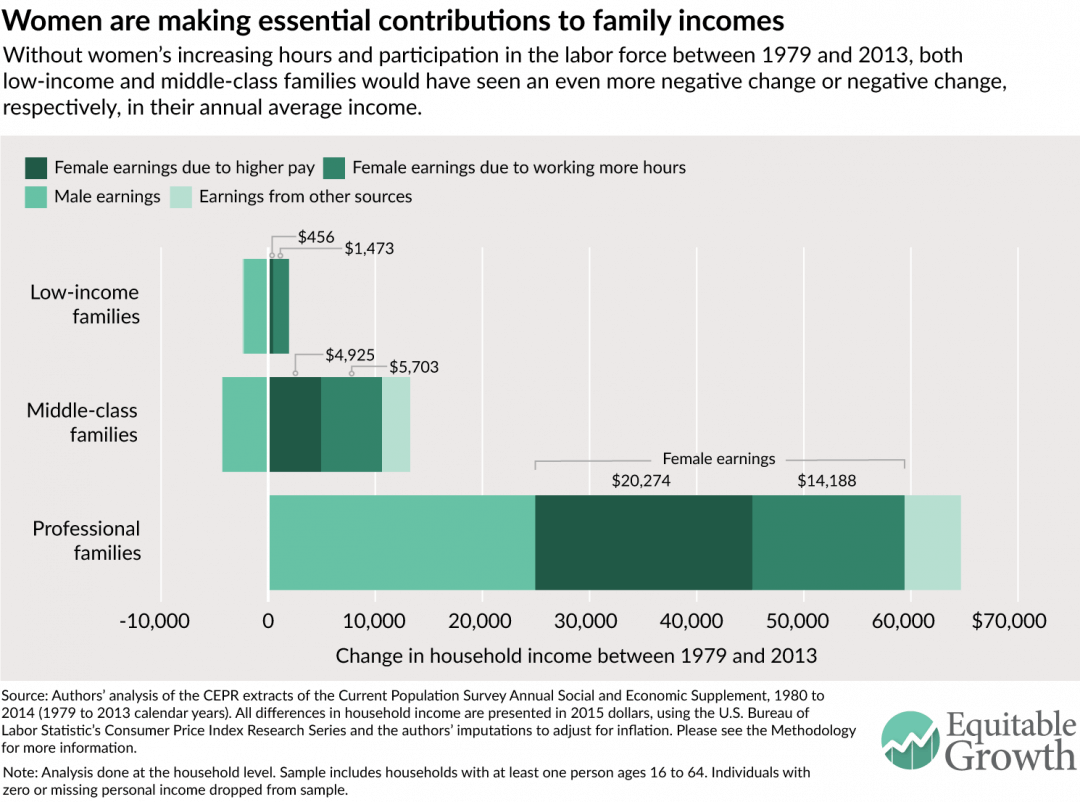
 

Between 1979 and 2013, low-income families saw their income fall, as shown in Figure 2; in Figure 4, we see that this is because men’s earnings fell. Women not only increased their working hours but also their pay per hour—so much so that their overall contribution grew the average annual family income by $1,929 making up for much of the losses from declining male earnings. Women’s earnings from working additional hours alone added $1,473.

In middle-class families, the average annual income grew by $8,984. But, like low-income families, this change was also entirely due to women’s added hours and earnings. Between 1979 and 2013, women’s earnings from working more hours accounted for the largest share of the gains, adding $5,703. The second-largest factor was once again women’s pay, which contributed about $4,925. Also similar to low-income families, men’s earnings pulled down overall income within middle-income families, falling by $4,278.

Professional families experienced significant income growth between 1979 and 2013 across all earnings and income categories. As with low-income and middle-class families, women’s earnings from higher pay and increased hours were the most important factor. Women’s earnings from pay increased by an average of $20,274 per year, while women’s earnings from more hours accounted for $14,188. However, as opposed to families further down the income spectrum, men in professional families earned on average $24,936 more per year over this period, helping boost family income.

Conclusion

Across every income group, women’s increased working hours have helped bolster family economic security. But for low-income and middle-class families, women’s contributions, particularly from working more per year, have been essential in abating the effects of stuck or stalled family income growth. Simply, women’s participation in the workforce has made the key difference for middle-class families and more vulnerable families on the brink.

Families have benefited greatly from the changing roles of women in the home and the work force. Yet across the U.S. job market and across all levels of the income distribution, men and women face daily conflicts between work and family. As researchers strengthen the finding that what happens within a family is just as important to the economy as what happens within a business, it is imperative that we design policies that support families where they live, work, and play. These policies, among them work flexibility, paid family and medical leave, and child care, must be designed so that their distributional effects help all families equitably in order to truly strengthen our economy. 

Heather Boushey is the Executive Director and Chief Economist at the Washington Center for Equitable Growth and the author of the forthcoming book from Harvard University Press, “Finding Time: The Economics of Work-Life Conflict.” Kavya Vaghul is a Research Analyst at Equitable Growth.

Acknowledgements

The authors would like to thank John Schmitt, Ben Zipperer, Dave Evans, David Hudson, and Bridget Ansel. All errors are, of course, ours alone.

Methodology

The methodology used for this issue brief is identical to that detailed in the Appendix to Heather Boushey’s “Finding Time: The Economics of Work-Life Conflict.”

In this issue brief, we use the Center for Economic and Policy Research extracts of the Current Population Survey Annual Social and Economic Supplement for survey years 1980 and 2014 (calendar years 1979 and 2013). The CPS provides data on income, earnings from employment, hours, and educational attainment. All dollar values are reported in 2015 dollars, adjusted for inflation using the Consumer Price Index Research Series available from the U.S. Bureau of Labor Statistics. Because the Consumer Price Index Research Series only includes indices through 2014, we used the rate of increase between 2014 and 2015 in the Consumer Price Index for all urban consumers from the Bureau of Labor Statistics to scale up the Research Series’ 2014 index value to a reasonable 2015 index estimate. We then used this 2015 index value to adjust all results presented.

For ease of composition, throughout this brief we use the term “family,” even though the analysis is done at the household level. According to the U.S. Census Bureau, in 2014, two-thirds of households were made up of families, defined as at least one person related to the head of household by birth, marriage, or adoption.

We divide our sample into three income groups—low-income, middle-class, and professional households—using the the definitions outlined in “Finding Time.” For calendar year 2013, the last year for which we have data at the time of this analysis, we categorized the income groups as follows:

  • Low-income households are those in the bottom third of the inflation- and size-adjusted household income distribution. These households had an income of below $25,440 (as compared to $25,242 and below for 2012). In 1979, 28.3 percent of all households were low-income, increasing to 29.7 percent in 2013. These percentages are slightly lower than one third because the cut-off for low-income households is based on household income data that includes persons of all ages, while our analysis is limited to households with at least one person between the ages of 16 and 64. The working-age population (16 to 64) typically has higher incomes than older workers, and as a result, the working-age population has somewhat fewer households that fall into this low-income category.
  • Professionals are those households that are in the top quintile of the inflation- and size-adjusted household income distribution and have at least one member who holds a college degree or higher. In 2013, professional households had an income of $71,158 or higher (as compared to $70,643 or higher in 2012). In 1979, 10.2 percent of households were considered professional, and by 2013, this share had grown to 16.8 percent.
  • Everyone else falls in the middle-class category. For this group, the household income ranges from $25,440 to $71,158 in 2013 (as compared to $25,242 to $70,643 in 2012); the upper threshold, however, may be higher for those households without a college graduate but with a member who has an extremely high-paying job. This explains why within the middle-income group, the share of households exceeds 50 percent: The share of middle-income households declined from 62 percent in 1979 to 53.4 percent in 2013.

Note that all cut-offs above are displayed in 2015 dollars, using the inflation adjustment method presented earlier.

In our analysis, we limit the universe to persons with non-missing, positive income of any type. This means that even if a person does not have earnings from some form of employment but does receive income from Social Security, pensions, or any other source recorded by the CPS, they are included in our analysis.

These data are decomposed into income changes between 1979 and 2013 for low-income, middle-class, and professional families. The actual household income decomposition uses a simple shift-share analysis to find the differences in earnings between 1979 and 2013 and calculate the extra earnings due to increased hours worked by women.

To do this, we first calculate the male, female, and other earnings by the three income categories. To calculate the sex-specific earnings per household, we sum the income from wages and income from self-employment for men and women, respectively. The amount for other earnings is derived by subtracting the male and female earnings from total household earnings. We average the household, male, female, and other earnings by each income group for 1979 and 2013, and take the differences between the two years to show the raw changes in earnings by each income group.

To find the change in hours, for each year by household, we sum the total hours worked by men and women. We average these per-household male and female hours, by year, for each of the three income groups.

Finally, we calculate the counterfactual earnings of women. We use the 2013 earnings per hour for women and multiply it by the 1979 hours worked by women. Finally, we subtract this counterfactual earnings from the female earnings in 2013, arriving at the female earnings due to additional hours.

One important point to note is that because of the nature of this shift-share analysis, the averages don’t exactly tally up to the raw data. Therefore, when presenting average income, we use the sum of the decomposed parts of income. While economists typically show median income, for ease of composition and the constraints of the decomposition analysis, we show the averages so that the data are consistent across figures. Another important note is that we make no adjustments for changes over time in topcoding of income, which likely has the effect of exaggerating the increase in professional families’ income relative to the other two income groups.

(Featured photo credit: Flickr/yooperann)

Must-read: Gavyn Davies: “The internet and the Productivity Slump”

Must-Read: Gavyn Davies: The internet and the Productivity Slump: “How much would an average American, whose annual disposable income is $42,300…

…need to be paid in order to be persuaded to give up their mobile phone and access to the internet, for a full year? Would it be more, or less, than $8,400 for the year?… Chad Syverson… calculates that the productivity slowdown in the US is equivalent to about $2.7 trillion of lost output per annum by 2015. Even on the most generous method that he can find to calculate the extent of the underestimated consumer surplus from the digital economy, he reckons that only about one third of the productivity gap can be explained in this way…. He suggests, on prima facie grounds, that few people would value their access to the digital economy at one fifth of their disposable income. Maybe, but… most people are now extremely reliant upon, or addicted to, the internet, especially via their smartphones. Faced with the choice, I doubt whether they would be prepared to be transported back to the obsolete technology of a decade ago in exchange for an annual payment of less than, say, a few thousand dollars a year–i.e. far less than than the value currently accorded to digital activity in GDP…

Monday Smackdown: Robert Waldmann Marks Brad DeLong’s Beliefs about “The Return of Depression Economics” to Market

Robert Waldmann: Brad DeLong Marks His Beliefs about “The Return of Depression Economics” to Market: “Brad DeLong…reposted his review of Krugman’s ‘The Return of Depression Economics’ from 1999…

…’Just in case I get a swelled-head and think I am right more often than I am …’ Way back in the last century, Brad thought he had a valid criticism of Paul Krugman’s argument that Japan (and more generally countries in a liquidity trap) need higher expected inflation. I think the re-post is not just admirable as a self criticism session, but also shows us something about the power of Macroeconomic orthodoxy. Brad is just about as unorthodox as an economist can be without being banished from the profession, but even he was more influenced by Milton Friedman and Robert Lucas than he should have been…. Japan had slack aggregate demand at a safe nominal interest rate of 0–that i,s it was in the liquidity trap. Krugman argued that higher expected inflation would cause negative expected real interest rates and higher aggregate demand and solve the problem. Brad was unconvinced (way back then):

But at this point Krugman doesn’t have all the answers. For while the fact of regular, moderate inflation would certainly boost aggregate demand for products made in Japan, the expectation of inflation would cause an adverse shift in aggregate supply: firms and workers would demand higher prices and wages in anticipation of the inflation they expected would occur, and this increase in costs would diminish how much real production and employment would be generated by any particular level of aggregate demand.

Would the benefits on the demand side from the fact of regular moderate inflation outweigh the costs on the supply side of a general expectation that Japan is about to resort to deliberate inflationary finance? Probably. I’m with Krugman on this one. But it is just a guess–it is not my field of expertise–I would want to spend a year examining the macroeconomic structure of the Japanese economy in detail before I would be willing to claim even that my guess was an informed guess.

And there is another problem. Suppose that investors do not see the fact of inflation–suppose that Japan does not adopt inflationary finance–but that a drumbeat of advocates claiming that inflation is necessary causes firms and workers to mark up prices and wages. Then we have the supply-side costs but not the demand-side benefits, and so we are worse off than before.

As Brad now notes, this argument makes no sense. I think it might be hard for people who learned about macro in the age of the liquidity trap to understand what he had in mind. I also think the passage might risk being convincing to people who haven’t read enough Krugman or Keynes. The key problems in the first paragraphs are ‘adverse’ and ‘any particular level of aggregate demand’. Brad assumed that an increase in wage and price demands is an adverse shift. The argument that it is depends on the assumption that he can consider a fixed level of nominal aggregate demand (and yet he didn’t feel the need to put in the word ‘nominal’). The butchered sentence ‘would diminish how much real production and employment would be generated by any particular level of [real] aggregate demand.’ clearly makes no sense.

During the 80s, new Keynesian macroeconomists got into the habit of considering a fixed level of nominal aggregate demand when focusing on aggregate supply. Because it wasn’t the focus, they used the simplest existing model of aggregate demand the rigid quantity theory of money in which nominal aggregate demand is a constant times the money supply (which is assumed to be set by the monetary authority). This means that the aggregate demand curve (price level on the y axis and real gdp on the x axis) slopes down. This in turn means that an upward shift in the aggregate supply curve is an adverse shift.

More generally, the way in which a higher price level causes lower real aggregate demand is by reducing the real value of the money supply, but if the economy is in the liquidity trap the reduction in the real money supply has no effect on aggregate demand. In the case considered by Krugman, the aggregate demand curve is vertical. This means that he can discuss the effect of policy on real GDP without considering the aggregate supply curve. The second paragraph just repeats the assumption that higher expected inflation causes ‘costs’. There are no such costs (at least according to current and then existing theory) if the economy is in a liquidity trap. The third paragraph shows confusion about the cause of the ‘demand side benefits’. They are caused by higher expected inflation not by higher actual inflation. If there were higher expected inflation not followed by higher actual inflation, Japan would enjoy the benefits anyway. Those benefits would outweigh the non-existent costs.

Krugman actually did consider a model of aggregate supply, but it is so simple it is easy to miss. As usual (well as became usual as Krugman did this again and again) the model has two periods–the present and the long run. In the present, it is assumed that wages and prices are fixed. In the long run it is assumed that there is full employment and constant inflation. Krugman’s point is that all of the important differences between old Keynesian models and models with rational forward looking agents can be understood with just two periods and very simple math. The problem is that the math is so simple that it is easy to not notice it is there and to assume that he ignored the supply side.

I am going to be dumb (I am not playing dumb–I just worked through each step) and consider different less elegant models of aggregate supply. The following will be extremely boring and pointless:

  1. Fixed nominal wages, flexible prices and profit maximization (this is Keynes’s implicit model of aggregate supply). In this case, the supply curve gives increasing real output as a function of the price level. An ‘adverse’ shift of this curve would be a shift up. It would not affect real output in the liquidity trap since the aggregate demand curve is vertical. it would not impose any costs as the increased price level would reduce the real money supply from plenty of liquidity to still plenty of liquidity. This model of aggregate supply is no good (it doesn’t fit the facts). It is easy to fear that Krugman implicitly assumed it was valid when in a rush (at least this is easy if one hasn’t been reading Krugman every day for years–he doesn’t do things like that).

  2. A fixed expectations-unaugmented Phillips curve which gives inflation as an increasing function of output. An ‘adverse’ shift of he Phillips curve would imply higher inflation. This would have no costs.

  3. An expectations-augmented Phillips curve in which expected inflation is equal to lagged inflation–output becomes a function of the change in inflation. In a liquidity trap, there would be either accelerating inflation or accelerating deflation. For a fixed money supply accelerating inflation would reduce real balances until the economy would no longer be in a liquidity trap. The simple model would imply the possibility of accelerating deflation and ever decreasing output. This model is no good, because such a catastrophe has never occurred, Japan had constant mild deflation which did not accelerate, even during the great depression the periods of deflation ended.

  4. An expectations augmented Phillips curve with rational expectations–oh hell I’ll just assume perfect foresight. Here both the aggregate demand and aggregate supply curves are vertical. If they are at different levels of output, there is no solution. The result is that a liquidity trap is impossible. This is basically a flexible price model. If there were aggregate demand greater than the fixed aggregate supply, the price level would jump up until the real value of money wasn’t enough to satiate liquidity preference. Krugman assumed that, in the long run, people don’t make systematic forecasting mistakes. So he assumed that the economy can’t stay in the liquidity trap for the long run. Ah yes, his model had everything new classical in the long run (this is the point on which Krugman has marked his beliefs to market).

The argument that Krugman would not have reached his conclusions about the economics of economies in liquidity traps if he had considered the supply side only makes sense if it includes the intermediate step that, if one considers the supply side, one must conclude that economies can never be in liquidity traps. This is no good as Japan was in the liquidity trap as are all developed countries at present.

I think the only promising effort here was (3)–a Phillips curve with autoregressive expectations. The problem is: why hasn’t accelerating deflation ever occurred? Way back in 1999, Krugman clearly thought that the answer was just that we had been lucky so far. He warned of the risk of accelerating deflation. Now he thinks he was wrong. Like Krugman, I think the reason is that there is downward nominal rigidity — that it is very hard to get people to accept a lower nominal wage or sell for a lower price. This depends on the change in the wage or price and not in that change minus expected inflation.

Clearly this rigidity isn’t absolute (Japan has had deflation and there were episodes of deflation in the 30s). But it is possible to get write a model in which unemployment is above the non accelerating inflation rate, but nominal wages aren’t cut. In this case expected inflation remains constant–actual deflation doesn’t occur so expected deflation doesn’t occur. The math can work. See here.

Must-read: Juan Linz: “The Perils of Presidentialism”

Must-Read: Juan Linz’s “The Perils of Presidentialism” is a rather good analysis of Richard Nixon and his situation, but a rather bad analysis of Barack Obama and his. In a way, the McConnell-Boehner-Ryan strategy, taken over from the Gingrich playbook, was based on Linz: Block everything Obama attempts, they decided, and then his supporters who have an exaggerated idea of his power will turn against him, and we will rise to power:

Juan Linz: The Perils of Presidentialism: “Given his unavoidable institutional situation…

…a president bids fair to become the focus for whatever exaggerated expectations his supporters may harbor. They are prone to think that he has more power than he really has or should have, and may sometimes be politically mobilized against any adversaries who bar his way. The interaction between a popular president and the crowd acclimating him can generate fear among his opponents and a tense political climate…. In the absence of any principled method of distinguishing the true bearer of democratic legitimacy,, the president may use ideological formulations to discredit his foes; institutional rivalry may thus assume the character of potentially explosive social and political strife….

This analysis of presidentialism’s unpromising implications for democracy is not meant to imply that no presidential democracy can be stable; on th contrary, the world’s most stable democracy–the United States–has a presidential constitution. Nevertheless… the odds that presidentialism will help preserve democracy are… less favorable…. The best type of parliamentary constitution… [needs] a prime-ministerial office combining power with responsibility… [to] help foster responsible decision-making and table governments… encourage genuine party competition without causing undue political fragmentation…. Finally… our analysis establishes only probabilities…. In the final analysis, all regimes… must depend… upon the support of society at large… a public consensus which recognizes as legitimate authority only that power which is acquired through lawful and democratic means… on the ability of their leaders to govern, to inspire trust, to respect the limits of their power, and to reach an adequate degree of consensus. Although these qualities are most needed in a presidential system, it is precisely there they are most difficult to achieve…

Looking at Obama’s 53% approval rating and contrasting it with GWB’s 28%, it has, obviously, not worked out that way. Instead, it is McConnell and Boehner and Ryan’s supporters–not the president’s–who had exaggerated expectations that were disappointed by reality, and have now turned against their putative leaders and representatives.

Must-read: Tim Duy: “Yellen Pivots Toward Saving Her Legacy”

Must-Read: Ever since the Taper Tantrum, it has seemed to me that the center of gravity of the FOMC has not had a… realistic picture of the true forward fan of possible scenarios.

Now Tim Duy sees signs that the center of the FOMC’s distribution is moving closer to mine. Of course, I still do not see the FOMC taking proper account of the asymmetries, but at least their forecast of central tendencies no longer seems as far awry to me as it had between the Taper Tantrum and, well, last month:

Tim Duy: Yellen Pivots Toward Saving Her Legacy: “Janet Yellen… [would] her legacy… amount to being just another central banker…

…who failed miserably in their efforts to raise interest rates back into positive territory[?] The Federal Reserve was set to follow in the footsteps of the Bank of Japan and the Riksbank, seemingly oblivious to their errors. In September… a confident Yellen declared the Fed would be different…. ANN SAPHIR…. “Are you worried… that you may never escape from this zero lower bound situation?” CHAIR YELLEN…. “I would be very surprised if that’s the case. That is not the way I see the outlook or the way the Committee sees the outlook…. That’s an extreme downside risk that in no way is near the center of my outlook.”…

Bottom Line: Rising risks to the outlook placed Yellen’s legacy in danger. If the first rate hike wasn’t a mistake, certainly follow up hikes would be. And there is no room to run; if you want to ‘normalize’ policy, Yellen needs to ensure that rates rise well above zero before the next recession hits. The incoming data suggests that means the economy needs to run hotter for longer if the Fed wants to leave the zero bound behind. Yellen is getting that message. But perhaps more than anything, the risk of deteriorating inflation expectations – the basis for the Fed’s credibility on its inflation target – signaled to Yellen that rates hike need to be put on hold. Continue to watch those survey-based measures; they could be key for the timing of the next rate hike.

Weekend reading: April Fool’s Day edition (but no joke, this is good reading)

This is a weekly post we publish on Fridays with links to articles that touch on economic inequality and growth. The first section is a round-up of what Equitable Growth has published this week and the second is work we’re highlighting from elsewhere. We won’t be the first to share these articles, but we hope by taking a look back at the whole week, we can put them in context.

Equitable Growth round-up

The U.S. labor share has declined quite a bit over the past 15 years. But it’s actually increased since 2012, in part due to the continued economic recovery. Does this mean we can return the labor share to its old levels through strong economic growth alone?

Social insurance isn’t just a form of redistribution. It is, unsurprisingly, also a form of insurance. Programs like Medicaid don’t just insure against the risk of deprivation, but also encourage workers to move into riskier yet higher-paying jobs.

You’ve almost certainly heard of the gig economy. But you probably haven’t heard concrete numbers on its size or importance to the labor market. New research shows that reality is far from the caricature we often hear about Uber and its ilk.

The number of good-paying union jobs and manufacturing jobs have fallen sharply in the United States over the past several decades. Ben Zipperer explains why this downturn has hurt African American workers more than white workers.

Links from around the web

Discussions of higher education among policymakers and the media are dominated by talk about the experiences and challenges that students have when they apply to and attend selective four-year universities. But the typical college-going American has a very different experience. Ben Casselman describes how this skews the public debate about higher ed. [fivethirtyeight]

Larry Summers works through why record-high corporate profits may be a problem. “Suggestive evidence of increases in monopoly power,” he writes, “makes me think that the issue of growing market power deserves increased attention from economists and especially from macroeconomists.” [larrysummersdotcom]

There’s been a significant rise in the number of contractors and temps over the past decade, larger than the rise in overall employment from 2005 to 2015. This trend poses a number of big questions—specifically about the state of social insurance and how much of it will be shifted onto workers, writes Neil Irwin. [the upshot]

The Federal Reserve has a large impact on the U.S. economy, but you wouldn’t know that by the debates presidential candidates are having about the state of the economy. The public would be better served by the candidates talking about the role of the central bank. Narayana Kocherlakota, former president of the Minneapolis Fed, offers some questions on the topic. [bloomberg view]

Speaking of the Federal Reserve, some commentators have worried that Congress is increasingly posing a threat to the independence of the central bank. But is that sense borne out by the data? Carola Binder takes a look and says it doesn’t look like it does. [quantitative ease]

Friday figure

Figure from “How the student debt crisis affects African Americans and Latinos” by Marshall Steinbaum and Kavya Vaghul.

Must-reads: April 1, 2016


Must-read: Dean Baker: “Prime-Age Workers Re-Enter Labor Market”

Must-Read: The Federal Reserve is looking at the past six months and seeing significant improvement in the labor market. It is also looking at financial markets and seeing increased pessimism about inflation. It is having a difficult time reconciling these two.

The reconciliation is, I think, that financial markets now believe that the Phillips Curve is flatter and that the NAIRU is lower than they thought two years ago–and they are likely to be right:

Dean Baker: Prime-Age Workers Re-Enter Labor Market: “The economy added 215,000 jobs in March…

Graph Employment Rate Aged 25 54 All Persons for the United States© FRED St Louis Fed

…with the unemployment rate rounding up to 5.0 percent from February’s 4.9 percent. However, the modest increase in unemployment was largely good news, since it was the result of another 396,000 people entering the labor force. There has been large increase in the labor force over the last six months, especially among prime-age workers. Since September, the labor force participation rate for prime-age workers has increased by 0.6 percentage points. This seems to support the view that the people who left the labor market during the downturn will come back if they see jobs available. However even with this rise, the employment-to-population ratio for prime-age workers is still down by more than two full percentage points from its pre-recession peak.

Another positive item in the household survey was a large jump in the percentage of unemployment due to voluntary quits. This sign of confidence in the labor market rose to 10.5 percent, the highest level in the recovery, although it’s still more than a percentage point below the pre-recession peaks and almost four percentage points below the levels reached in 2000.

While the rate of employment growth in the establishment survey was in line with expectations, average weekly hours remained at 34.4, down from 34.6 in January. As a result, the index of aggregate hours worked is down by 0.2 percent from the January level. This could be a sign of slower job growth in future months.

Must-read: Ben Thompson: “Andy Grove and the iPhone SE”

Must-Read: Invest like mad in your technology drivers–even if it looks as if they are not the most profitable. But, conversely, don’t keep pouring money into things that used to be technology drivers but are no longer. And keep your mind open and place many bets as to what your future true technology drivers will be:

Ben Thompson: Andy Grove and the iPhone SE: “While [Gordon] Moore is immortalized for having created ‘Moore’s Law’…

…the fact that the number of transistors in an integrated circuit doubles approximately every two years is the result of a choice made first and foremost by Intel to spend the amount of time and money necessary to make Moore’s Law a reality… and the person most responsible for making this choice was Grove…. Grove [also] created a culture predicated on a lack of hierarchy, vigorous debate, and buy-in to the cause (compensated with stock)…. Intel not only made future tech companies possible, it also provided the template for how they should be run….

Grove’s most famous decision…. Intel was founded as a memory company… the best employees and best manufacturing facilities were devoted to memory in adherence to Intel’s belief that memory was their ‘technology driver’…. The problem is that by the mid-1980s Japanese competitors were producing more reliable memory at lower costs (allegedly) backed by unlimited funding from the Japanese government…. Grove soon persuaded Moore, who was still CEO to get out of the memory business, and then proceeded on the even more difficult task of getting the rest of Intel on board; it would take nearly three years for the company to fully commit to the microprocessor….

Intel today is still a very profitable company…. [But] the company’s strategic position is much less secure than its financials indicate, thanks to Intel’s having missed mobile. The critical decision came in 2005…. Steve Jobs was interested in… the XScale ARM-based processor… [for] the iPhone. Then-CEO Paul Otellini….

We ended up not winning it or passing on it, depending on how you want to view it. And the world would have been a lot different if we’d done it…. You have to remember is that this was before the iPhone was introduced and no one knew what the iPhone would do…. At the end of the day, there was a chip that they were interested in that they wanted to pay a certain price for and not a nickel more and that price was below our forecasted cost. I couldn’t see it. It wasn’t one of these things you can make up on volume. And in hindsight, the forecasted cost was wrong and the volume was 100x what anyone thought.

It was the opposite of Grove’s memory-to-microprocessor decision: Otellini prioritized Intel’s current business (x86 processors) instead of moving to what was next (Intel would go on to sell XScale to Marvell in 2006), much to the company’s long-term detriment…