This is a weekly post we publish on Fridays with links to articles that touch on economic inequality and growth. The first section is a round-up of what Equitable Growth has published this week and the second is work we’re highlighting from elsewhere. We won’t be the first to share these articles, but we hope by taking a look back at the whole week, we can put them in context.
Equitable Growth round-up
After the U.S. housing bubble popped, consumer expenditures dropped a considerable amount and haven’t recovered as strongly as in past recoveries. A new paper looks at how much of that pullback was due to the huge drop in housing prices, and how much was due to the amount of debt that households had.
The Panama Papers have increased interest in offshore wealth. But while most of the stories about the leak have been about individuals, U.S. corporations also keep quite a bit of cash offshore. Kimberly Clausing of Reed College explains how profit shifting is a problem for the U.S. corporate income tax base.
Economists and policymakers are increasingly coming to the conclusion that the United States’ incarceration policy has more costs than benefits. And many of these costs may be understated due to measurement issues caused by how we treat incarcerated people in statistics.
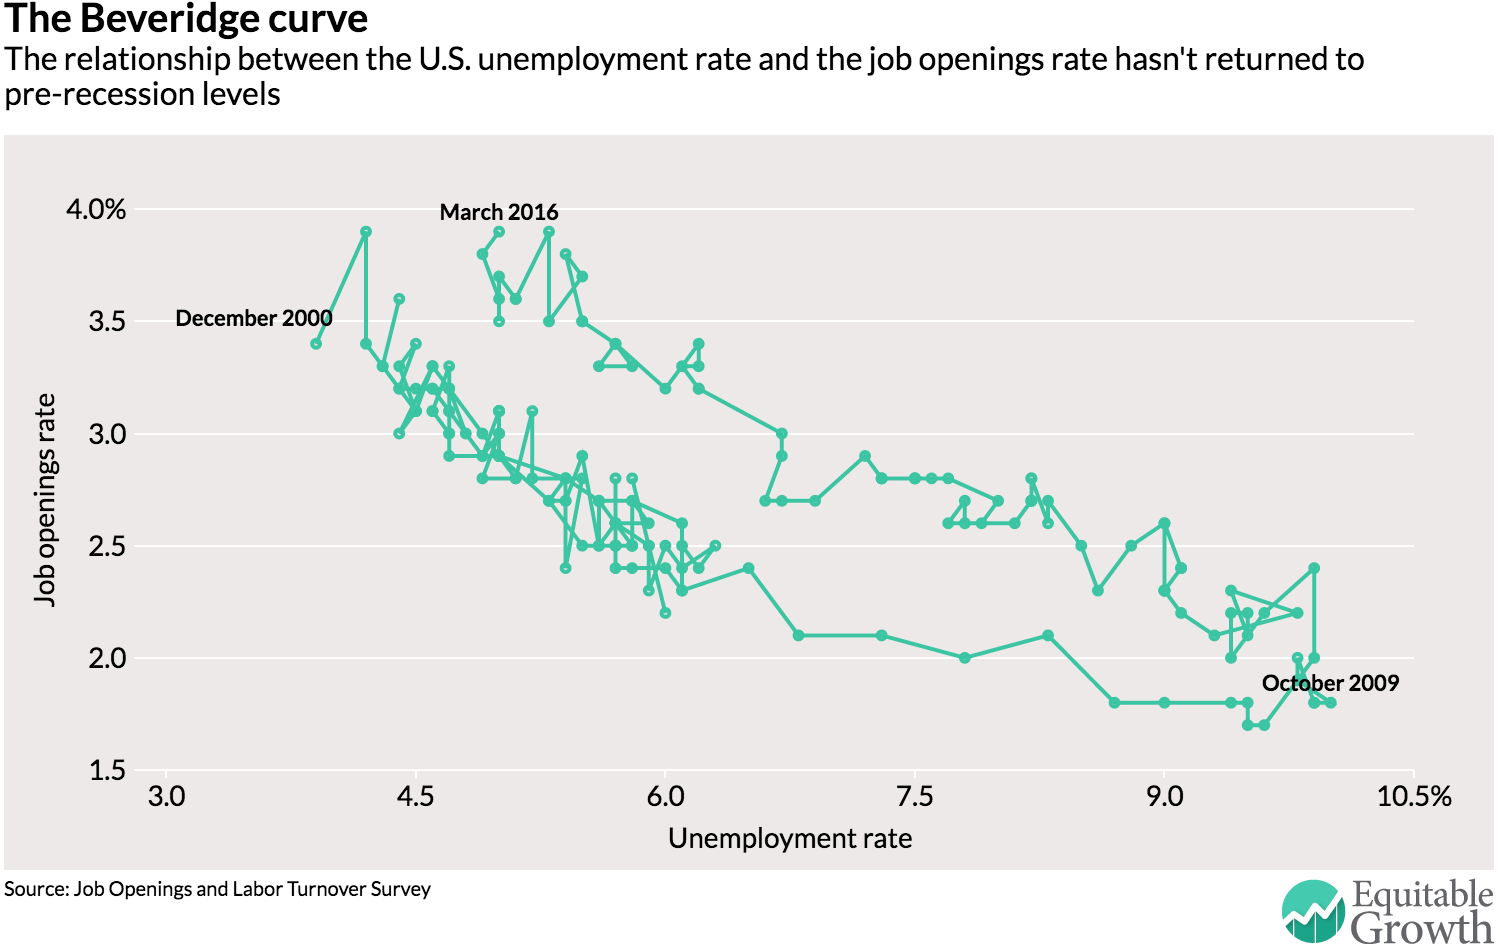
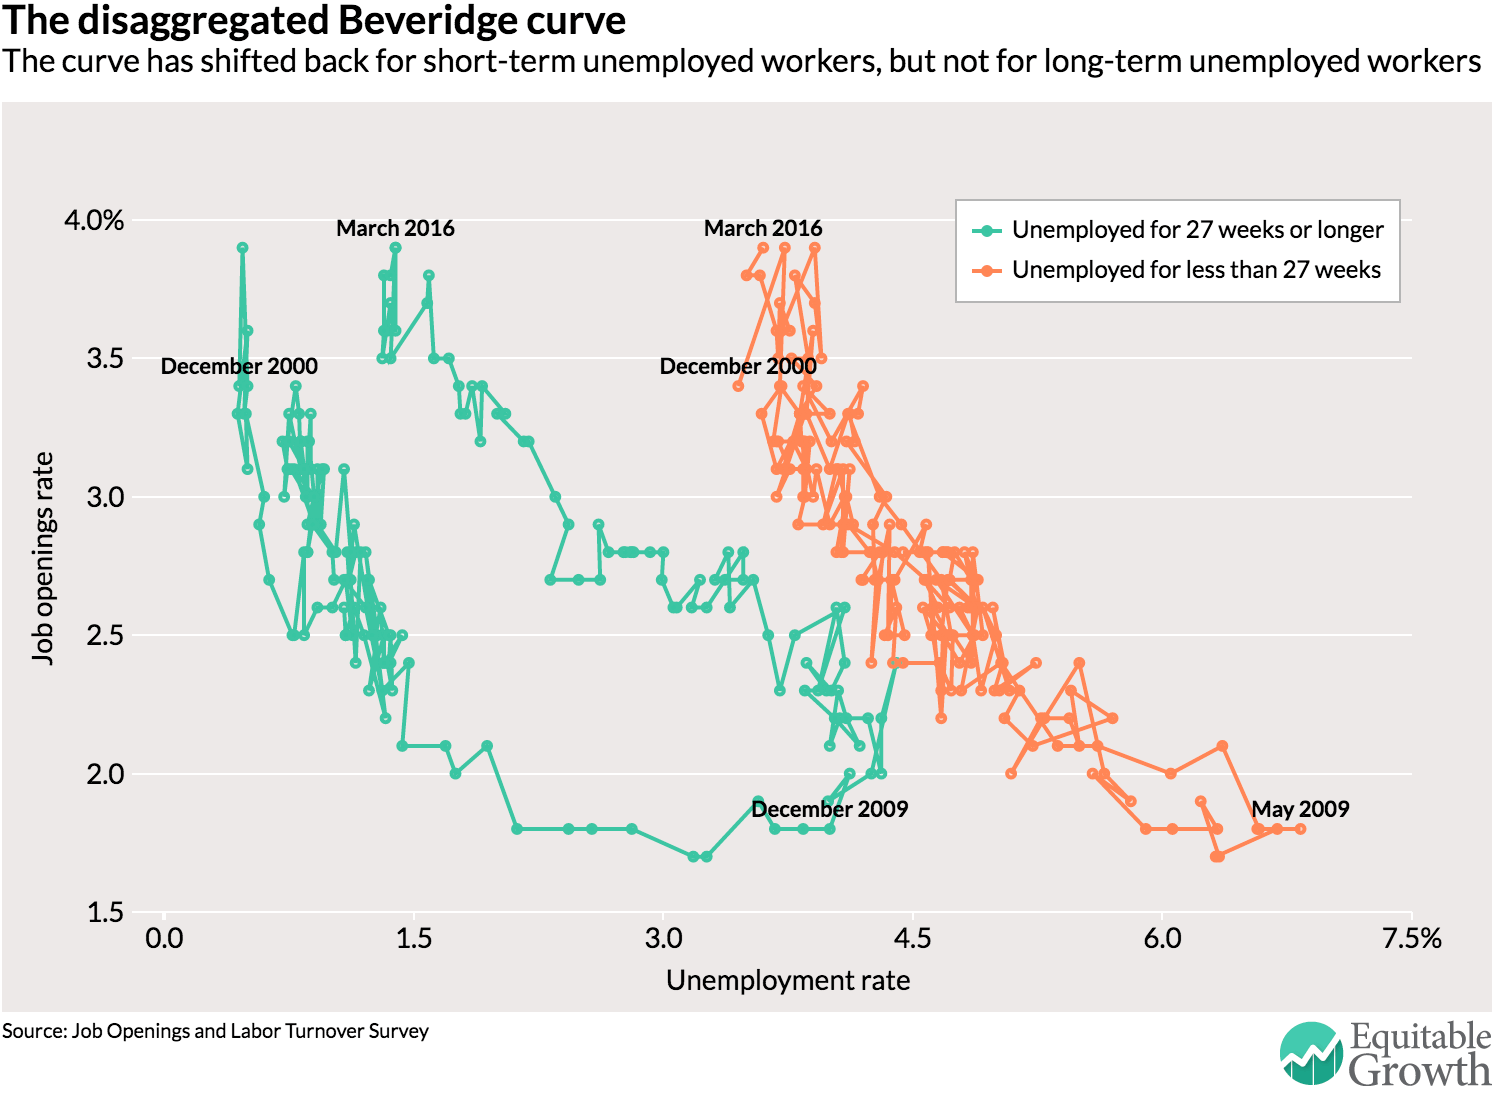
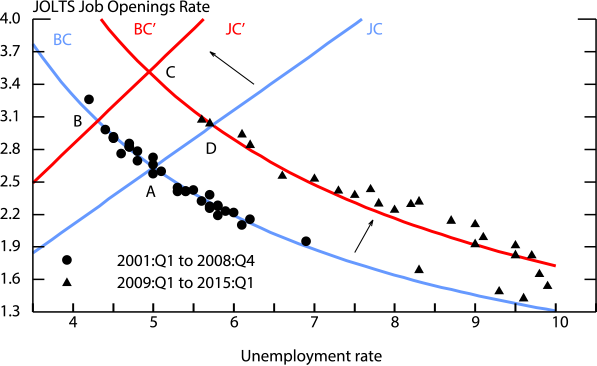
The seeming deterioration of the Beveridge curve has some economists concerned about the state of the U.S. labor market. But we should remember in economics that we’re usually interested in where curves cross other curves. Taking a broader look should assuage some concerns about the labor market.
Links from around the web
The broad U.S. labor market is steadily improving as job growth continues to cut into joblessness. But the labor market isn’t strong for many segments of the population. Patricia Cohen looks at the situation of young workers without college degrees. [nyt]
One of the charges against the Federal Reserve’s extraordinary efforts to revive the economy is that the central bank increased wealth inequality by propping up asset prices. But a look at some data suggests just the opposite. Narayana Kocherlakota argues that wealth inequality increased because the Fed didn’t ease enough. [bloomberg view]
“Perhaps the most overlooked aspect of economic inequality has been the role that firms play in it.” Walter Frick looks at how rising differences between firms have implications for inequality and what the role of competition may be in these trends. [hbr]
The U.S. economy is faced with a significant question: Where will the new, high-paying jobs of the future come from? Eduardo Porter argues that the country has been in this situation before, that government action helped create prosperity, and that it can do it again. [nyt]
Consumption is an understudied economic concept when it comes to inequality and mobility. But a new note from the Federal Reserve Bank of New York looks at how much households move up and down the consumption ladder over the course of their lifetime. [liberty street economics]
Friday figure
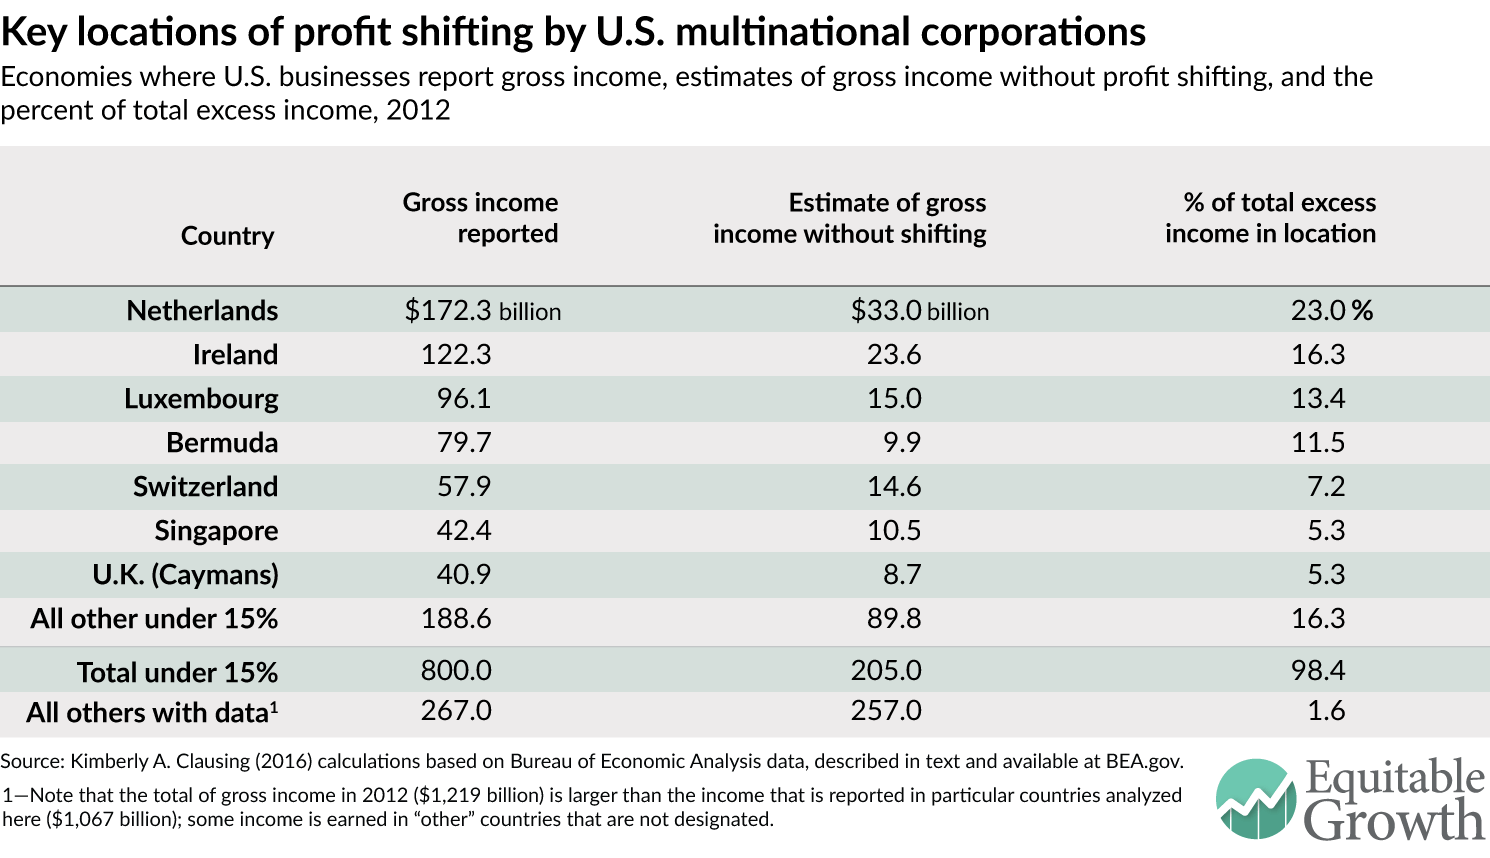
Figure from “Profit shifting and U.S. corporate tax policy reform,” by Reed College’s Kimberly Clausing.