What impact is artificial intelligence having on the U.S. labor market and the nation’s economy?

""

As new and groundbreaking technologies emerge, they can function as a blank canvas onto which people project both aspirations and anxieties. Artificial intelligence—despite its quick uptake in broader society and its rapid evolution so far—is still loosely defined in the public imagination and crosscutting in ways that can make it difficult to discern informed insight from speculation.

Yet AI is already impacting the U.S. economy, as well as current and prospective workers in myriad ways, meriting policymakers’ attention. While researchers are rapidly expanding the evidence base needed to better understand and govern AI, much of the field is still emerging.

This column looks broadly at artificial intelligence and its current uses in the U.S. economy, as well as potential areas of expansion in the future. It then turns to how policymakers can consider developing guardrails to protect the American public, particularly workers, from possible harms caused by AI or resulting from its development. This document is intended as a compass, rather than a definitive guide, to help policymakers navigate toward reliable, evidence-based sources, help frame key questions for policy development, and critically evaluate claims relating to AI and the economy.

What is artificial intelligence?

Artificial intelligence refers to a wide range of related technologies, primarily computer systems that can perform tasks without significant human oversight. AI is an umbrella term that includes common applications that have been supporting worker productivity for years, such as those that provide grammar and spelling support, bibliography generation, and project management. It also includes more sophisticated technologies, including large language models, such as ChatGPT, and software systems known as AI agents that can take over more time-intensive tasks. 

For the purposes of this column, the 2019 National Defense Authorization Act  provides a useful AI shorthand definition: “an artificial system designed to think or act like a human, including cognitive architectures and neural networks.” A more recent definition can be found in Executive Order 14110, issued in 2023, which defines artificial intelligence as a machine-based system that can, for a given set of machine- and human-based objectives, make predictions, recommendations, or decisions influencing real or virtual environments in an automated manner.

For different ways to think about AI, see the Equitable Growth essay by Sorelle Friedler of Haverford College and Harvard University’s Marc Aidinoff.

How is AI affecting the U.S. economy?

OpenAI Inc., the firm behind ChatGPT, recently claimed that AI will “drive unprecedented economic growth” in the U.S. economy in the long run. But it is essential to consider that a range of factors beyond technology—including public and private investments, productivity, and the makeup of the labor force—drive economic growth. Such factors intersect with AI technologies in differing ways and varying timescales.

How much investment in AI is occurring?

Proposals for how to measure the contributions of AI technology production to economic growth are emerging. By 2024, corporate AI investments were more than $250 billion. These investments in building out AI infrastructure are driving national Gross Domestic Product growth and raise concerns that the investments may not be able to provide an appropriate return—or worse, become a speculative bubble. During the first half of 2025, half of the country’s reported GDP growth, 1.2 percent, was reportedly due to the investments related to AI infrastructure. But the increasingly circular web of investments between the largest private firms investing in AI should be closely watched.

Few firms have reported any returns on those investments. A recent paper published by NANDA at MIT finds that of the tens of billions of dollars that private enterprises have invested, 95 percent of them reported no measurable impact on their profits and losses, primarily due to a lack of a productive learning feedback loop to improve pilot programs for workers’ actual workflows. Although workplaces are quickly adopting these new technologies, firms are not seeing the payoff to their bottom lines yet. AI technologies will need to become more productivity-enhancing before they have a meaningful effect on worker productivity and GDP, with current estimates of the impact being limited.

How is AI being deployed, and what impact is it having on workers?

AI firms’ own research finds that their large language models are primarily being utilized for software development and writing tasks to support existing workers through the augmentation of their jobs. But there also has been a recent rise in AI agents, or active assistants that can initiate tasks, adapt a plan to new information, and operate across applications. In some cases, augmentation can help reduce workers’ exposure to dangerous tasks, while in other cases it may make their jobs more challenging.

The introduction of self-check-out machines in lieu of traditional cashiers, for example, has reduced the number of guest service workers needed during retail transactions and created a new need for human interaction when the machine does not work as designed. This is not the result of AI technologies, but it shows how limiting worker interactions with customers to almost exclusively when an issue arises results in workers more likely to deal with frustrated customers.

In the spring of 2024, a study of U.S. Census Bureau data reported that only 5.4 percent of firms were using AI technologies, up from 3.7 percent the year prior. At the same time, recent research by Alexander Bick at the Federal Reserve Bank of St Louis, Adam Blandin at Vanderbilt University, and David Deming at the Harvard Kennedy School suggests that workplace adoption of generative AI—a specific AI category of  “deep-learning models” that create content from existing data—has been swifter than the adoption of the personal computer. They report that almost 40 percent of the U.S. population has used generative AI at least once in the prior week, and 23 percent of those who were employed reported using AI at least once at work in the previous week.

Still, the three co-authors suggest that AI technology applications will take some time to refine in order to support widespread and impactful increases in productivity. Their analysis suggests that the time savings AI currently provides amounts to only 1.4 percent of work hours. And researchers at the Massachusetts Institute of Technology’s Shaping the Future of Work initiative estimate that the number of workers who may lose their positions to AI-driven automation to be as low as 1 percent to 2 percent of the workforce over the next 20 years.  Yet one of the purveyors of the technology itself—AI firm Anthropic’s CEO Dario Amodei, who has a sizeable financial stake in selling this version of the future—claims it could drive unemployment to record highs in the immediate term.

Indeed, some employers have already implemented aspects of AI technologies into their employees’ workdays without workers’ knowledge or consent in an attempt to increase productivity, producing negative and unwanted effects such as limited productivity gains and the diminished health and safety of workers. Survey research by Alexander Hertel-Fernandez at Columbia University suggests that employers’ adoption of AI-enabled automated management and surveillance is already fairly widespread in the U.S. economy: An estimated 70 percent of workers across sectors and occupations in the economy may already be subject to some form of electronic monitoring by their employers, leading to negative impacts on workers’ health and well-being.

Large language models also can produce hallucinations, or inaccurate content that can be made up or false. Such hallucinations can contribute to a proliferation of misinformation or present direct risks when providing incorrect and dangerous professional advice. Sometimes AI-generated work is poorly prepared, referred to as “workslop,” thus limiting, or even diminishing, the productivity gains the technology claims to provide.

The introduction of AI into management software is already having profound effects on some worker’s abilities to earn fair wages. Research into AI labor-management vendors in various sectors, from health care to logistics, finds that employers are using the technology to set compensation structures and calculate individuals’ wages, leading to an erosion of fairness and transparency in setting and calculating workers’ pay, as detailed by law professor Veena Dubal at the University of California, Irvine and her co-author Wilneida Negrón, in “How artificial intelligence uncouples hard work from fair wages through ‘surveillance pay’ practices—and how to fix it.

How is it impacting the U.S. labor market?

JP Morgan Chase & Co. CEO Jamie Dimon has already blamed the adoption of artificial intelligence for job reductions and reduced demand for workers, but the research is mixed. Stanford University’s Digital Economy Lab finds that employment for young workers meaningfully decreased in occupations that are particularly exposed to AI, while other work suggests that recent graduates’ unemployment rates were already climbing prior to the introduction of large language models in workplaces. New analysis by the Yale Budget Lab of Current Population Survey data suggests that the introduction of large language models has not yet caused a decrease in the need for cognitive labor.

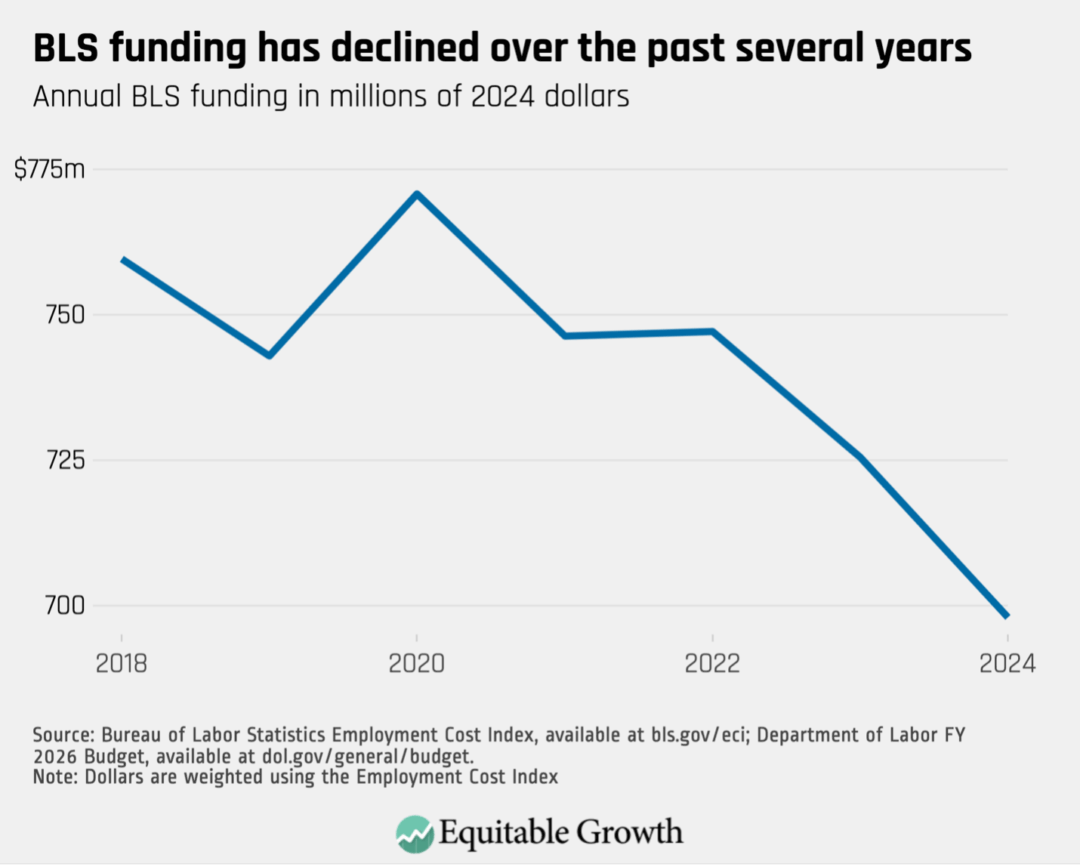
Whatever the case, the perceived downturn in U.S. economic activity recently could be due to a mix of tariffs, inflation, immigration crackdowns, reduced rates of job creation, and low consumer confidence, rather than any AI-induced effects on the U.S. labor market. Making these assessments more difficult is the fact that the federal government’s statistical agencies are not currently equipped to track AI’s impact on the workforce, while the recent disruptions at the U.S. Department of Labor’s Bureau of Labor Statistics mean that recent GDP data are currently unavailable.

How do we anticipate AI will affect the U.S. labor market in the future?

The widescale adoption and integration of AI into the U.S. economy is still in its early stages, and it is not clear whether extensive automation will occur since AI is both augmenting and automating tasks within jobs. It also is not obvious how slowly or quickly AI adoption in the workplace will happen, though evidence from NANDA at MIT suggests firms are striving to swiftly integrate the technology into their workflows.

The pace by which AI is adopted into the workplace will be shaped by innovation, market and regulatory forces, and human preferences. More widespread use also will require that the professional and personal adoption of AI technologies continues to increase, the public and private sectors operate as rational actors that seek to maximize their benefits and minimize their costs, and energy production keeps pace with AI’s incredible need for power. 

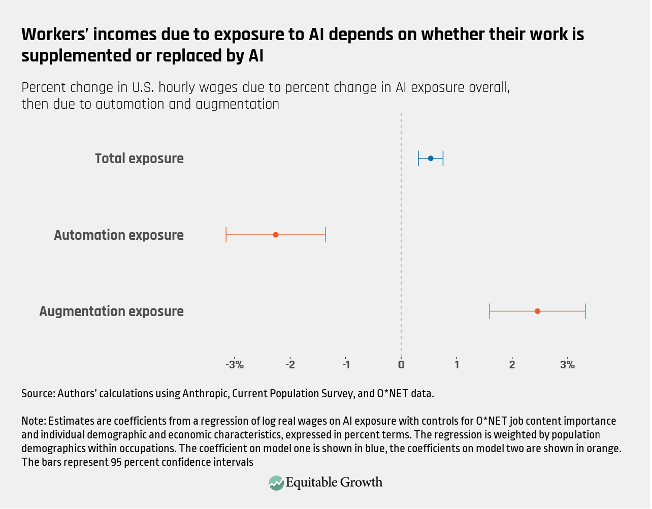
Some jobs are more susceptible to exposure to artificial intelligence technologies than others. Researchers can provide us with some insight into how susceptible an occupation might be based on whether AI technologies can perform core aspects of that job. Consider a primary or secondary school teacher: AI technologies may currently be able to handle some tasks, such as drafting lesson plans or building a curriculum, but not other tasks, including real-time classroom management or supporting children to develop their emotional-social competencies.

Jobs with fewer tasks are more at risk of being automated by AI technologies independent of human supervision compared to jobs that require human interaction. If AI can perform the core functions of an occupation, then it is much more susceptible to automation and replacement, while if AI can only perform supplemental tasks, then workers enjoy more stability. In a recent Equitable Growth report, “Adoption of generative AI will have different effects across jobs in the U.S. logistics workforce,” the four co-authors explore this distinction in more detail.

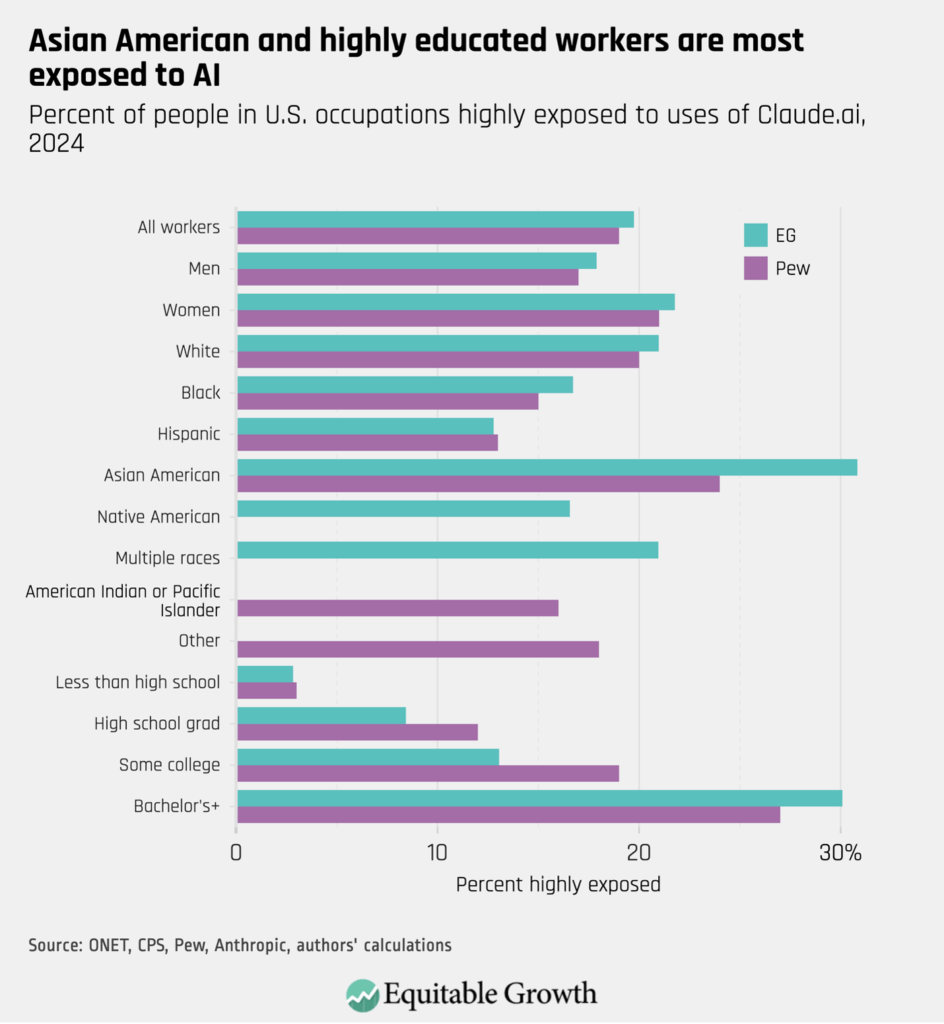
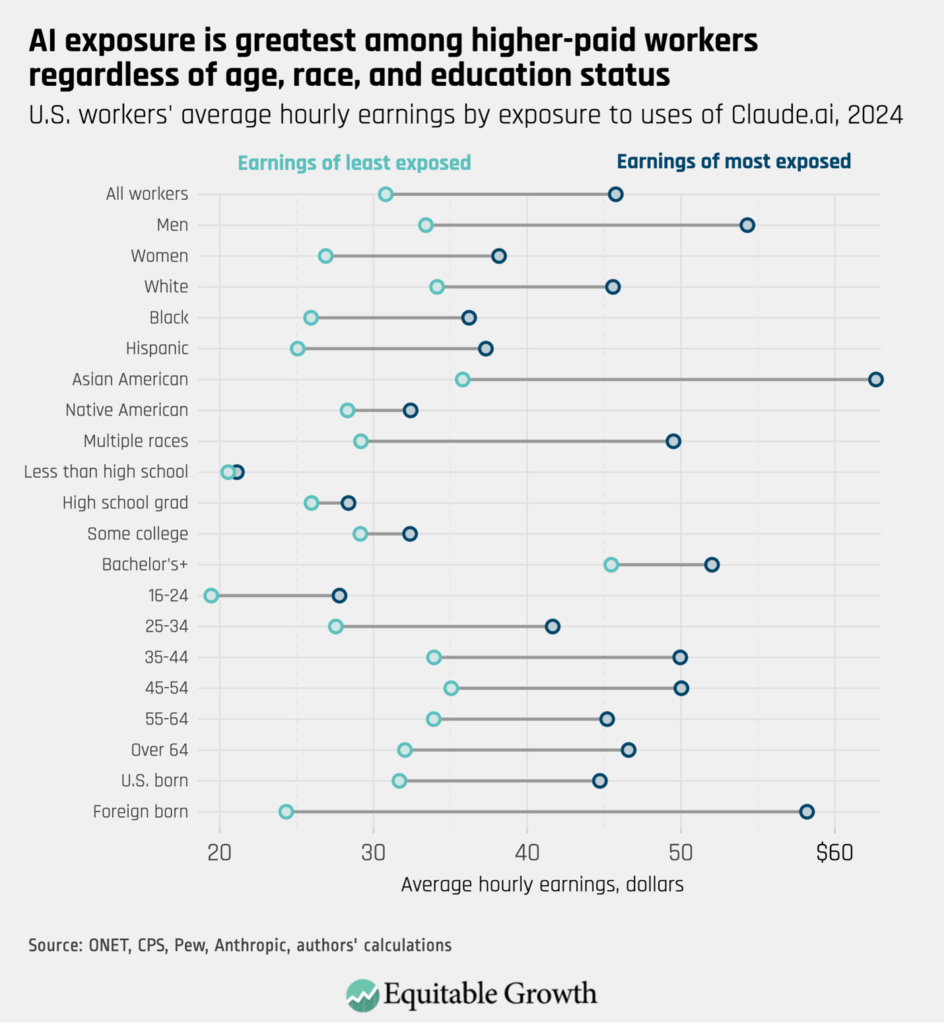
Exposure to AI also doesn’t seem to be equally distributed. A new working paper and accompanying column by Equitable Growth’s Chris Bangert-Drowns and Chiara Chanoi suggests that workers with higher levels of education in high-paying positions are particularly exposed to AI, and women tend to work in more exposed occupations. This research builds on recent work by the Pew Research Center and Anthropic.

AI could impact workers in ways other than via automation or augmentation. AI could produce a workplace where jobs are broken up by task and translated into roles closer to those considered part of the gig economy today. This fragmentation of jobs could happen by breaking apart roles into discrete tasks and using AI technologies for some aspects of the position and human workers for others.

During the recent Writers Guild of America’s strike, for example, there was a concern that large Hollywood studios would replace human writers and utilize AI to write first drafts of scripts, with the human writers coming back as editors, shortening their time of employment and lowering their pay. Ultimately, it was the strength of the Writers Guild of America that staved off the worst potential impacts and job degradation of AI on their union members.

This is not to say that AI will not disrupt the U.S. workforce. AI-driven innovations could lead to sizable wage declines for concentrated groups of workers in certain occupations most at risk, such as office and administrative support, financial operations, and media occupations.

What should policymakers consider?

Although there are many unknowns—and new innovations such as Open AI’s ChatGPT-fueled Atlas web browser are seemingly constantly being unveiled—the information available at this stage of AI’s adoption and deployment suggests that there is a need for federal leadership to provide some rules of the road. Policymakers at least need to consider how to regulate the use of AI to protect workers, consumers, and data privacy, while also promoting innovation and market competition and minimizing public risks. Attempts to prevent thoughtful governance are short-sighted and put the economy and public safety at risk.

Computer scientists Arvind Narayan and Sayash Kapoor at Princeton University argue that policymakers should view “AI as normal technology,” rejecting the vision that AI is itself an agent in determining the future. Policymakers should heed their recommendation and view AI as a tool that can be controlled. Below is an initial set of policy considerations that Equitable Growth will continue to build on in the coming months.

What guardrails are in place to guide the integration of AI in the economy?

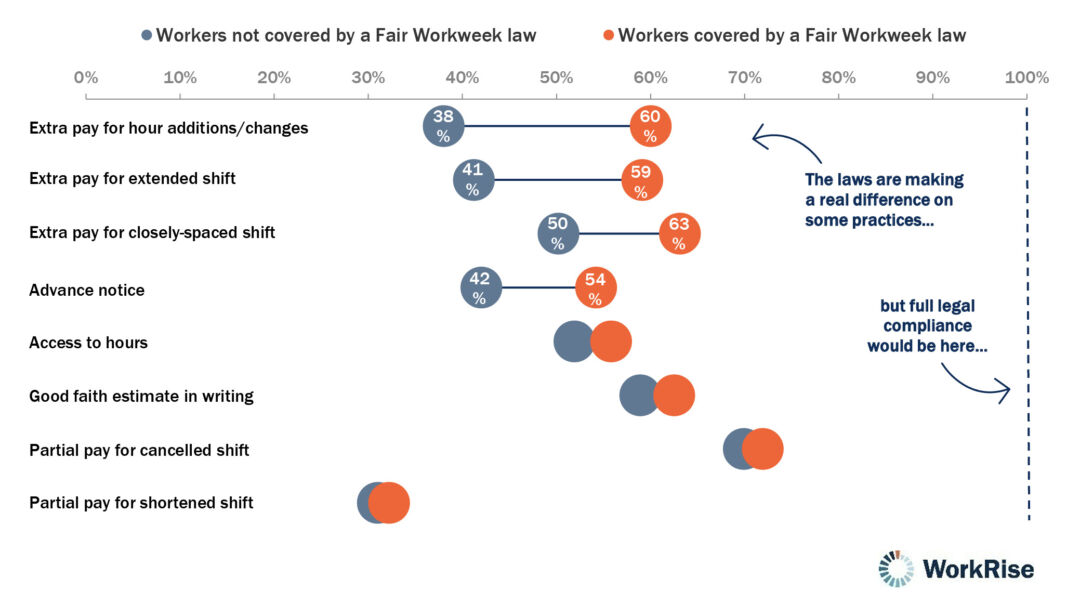
After the Trump administration rescinded and replaced the Biden administration’s executive order on artificial intelligence and the other related executive orders on AI, there are now few guardrails in place at the federal level. Critically, some researchers have already detailed how the introduction of AI-powered algorithmic wage discrimination practices have been violating existing fair wage laws, as well as health and safety protections, without facing federal or state enforcement.

In the absence of strong federal leadership to regulate AI as it proliferates in our everyday lives, there has been a flurry of activity at the state level across a range of topics and issues that intersects with the introduction of AI to society. These bills and laws illustrate the need for comprehensive congressional action to provide guidelines rather than deregulation or a full moratorium on state-level innovations that could yield important insights for advancing federal efforts.

Arguments in favor of commercial deregulation that frame AI innovation as a race with China or other U.S. competitors under the guise of national security and as a zero-sum game should be viewed with skepticism. Racing to be first in AI innovation with no guardrails could produce dangerous results by encouraging all parties to cut corners, be more secretive, and risk consumer safety in the name of speed. Nobel laureate Daron Acemoglu at MIT (and a member of the Washington Center for Equitable Growth’s Steering Committee) has detailed how more deregulation does not spur innovation, but rather how rules and regulated markets attract investment by mitigating risk and supporting optimal decisions.

Indeed, strong institutions, predictability, and programs that help spur research and development that would be cost-prohibitive without public-private partnership funding for university-based research and development (included in the 2022 CHIPS and Science Act and the Inflation Reduction Act) are essential for innovation. Many of these programs, however, are currently at risk of losing or have already lost vital federal funding.

How do we address AI market concentration?

Left unchecked, economic activity surrounding the rollout of AI technologies could dampen economic growth by reducing employment dynamism, in addition to other negative externalities, such as the sizeable environmental costs and a greater concentration of wealth at the top. A healthy economy needs fair and competitive markets, achievable through active antitrust enforcement.

Given the small number of large private firms dominating the market for AI products, such as large language models, there are fears that the technology stack that supports AI is increasingly concentrated, as described by University of California, Berkeley law professor Tejas Narechania in “Understanding market concentration in the AI supply chain.” This market dynamic has led researchers and lawyers to pursue frameworks for taxing revenue streams produced by data and AI services to democratize some of the positive economic impacts that AI could produce. Mona Sloane at the University of Virginia and Ekkehard Ernst, chief economist at the International Labour Organisation, explore this in “Tackling AI, taxation, and the fair distribution of AI’s benefits.”

If the U.S. labor market experiences large disruptions, what will happen to workers?

There could be a large disruption to the U.S. workforce, in which swaths of workers become unemployed, for many reasons, among them an economic recession or public health crisis. Given the currently weakening U.S. labor market, future layoffs, which may or may not be the direct result of the adoption of AI, could be attributed to the technologies all the same because it is difficult to distinguish between larger market forces, corporate consolidation, and AI adoption in pinpointing labor market effects.

Even without large-scale job losses, the current U.S. safety net is inadequate to help workers in the immediate term since Unemployment Insurance only replaces a portion, typically less than 50 percent, of workers’ average weekly income for up to 26 weeks, though many states are less generous. Of the nearly 4 million unemployed individuals who were actively seeking employment in August 2025, more than a quarter had been unemployed for more than 27 weeks, according to the U.S. Bureau of Labor Statistics.

This number of unemployed workers could rise sharply during future periods of prolonged financial and economic instability. The economic changes enacted through the Republican-led HR1, including massive federal funding cuts and more stringent work requirements for some income support programs, such as Medicaid and the Supplemental Nutrition Assistance Program, will exacerbate holes in the safety net and shrink its efficacy.

The changes to these and other social infrastructure programs could not come at a worse time for the adoption of AI in U.S. workplaces. There will be short-, medium-, and long-term demand for these programs, whether AI is actually creating problems in the economy or just being blamed for them. Economic crises require government intervention, including emergency financial support for impacted workers and structures that optimize the nation’s human capital in the long run, such as meaningful pathways to retrain and reenter the workforce.

Some policymakers are aware of this potential need. U.S. Sen. Mark Kelly (D-AZ) recently proposed establishing the AI Horizon Fund to provide support for initiatives that train and reskill the U.S. population and prepare for changes that AI-driven innovation might bring to the U.S. economy.

How can we protect workers’ rights?

One way to ensure that workers benefit from these advancements in technology is to include their voices when deciding upon businesswide changes that impact their jobs. In Germany, labor unions have helped produce optimal outcomes for workers and businesses alike, as detailed by Virginia Doellgast of Cornell University and Nell Geiser, research director at the Communications Workers of America, in their “Boosting U.S. worker power and voice in the AI-enabled workplace.”

Equitable Growth recently announced funding for additional research to further investigate the potential benefits of including workers’ voices in AI adoption in their workplaces, including a case study of the Labor Management Partnership at Kaiser Permanente and the role of worker voice in management strategy and job quality.

Conclusion

There is a lot that policymakers, academics, workers, and employers alike still do not know about how AI is directly and indirectly impacting the U.S. economy now and into the future. That is why Equitable Growth recently announced investments in 12 scholars to help generate actionable insights that policymakers can use as they navigate the era of AI innovation.

Innovation and economic growth do not have to be at direct odds with workers’ rights and economic equity. Artificial intelligence can complement workers’ job skills rather than replace them by centering workers in production processes when AI is intended only to augment their occupations. And researchers and technologists can work to ensure the ethical production and adoption of AI applications, as well as increase AI-relevant skills and literacy, so that productivity gains and benefits of artificial intelligence are more broadly shared.

Additional resources available to readers on AI, tech, and the economy.


Did you find this content informative and engaging?
Get updates and stay in tune with U.S. economic inequality and growth!

Posted in Uncategorized

Tariff costs impact industries with mostly White, male, and noncitizen workers

""

Overview

The U.S. economy is flying blind, with most economic-data publications paused indefinitely due to the shutdown of the federal government amid a general U.S. labor market slowdown and just as the U.S. Supreme Court is due to hear arguments on the legality of the White House’s costly tariff policy. On October 14, new tariffs on imported lumber and furniture took effect, threatening to raise the costs of housing construction at a time when polling overwhelmingly suggests that Americans are deeply concerned about housing access and affordability. And the new furniture tariffs, currently at a baseline of 25 percent, are due to spike as high as 50 percent on January 1, 2026.

Other product-specific tariffs loom. Existing tariffs on automobiles and auto parts, for example, are due to expand to include trucks and truck parts in November. In early October, the White House threatened to slap a 100 percent tariff on pharmaceutical imports from companies that do not negotiate lower drug prices. The Trump administration also floated possible levies on imports of semiconductors, critical minerals, robots, and even movies and iPhones.

In addition to threatening—and, in some cases, imposing—these commodity-specific tariffs, the White House has maintained country-specific or so-called reciprocal tariff rates as high as 50 percent for some countries. The first iteration of Equitable Growth’s tariff tracking project, published in July, focused on these reciprocal tariff rates, finding that they imposed additional input costs as high as 4.5 percent in some industries. Manufacturing, construction, mining, and repair and maintenance were found to be the most impacted sectors by reciprocal tariffs. Since then, some reciprocal tariff rates have changed as trade deals have been negotiated or new levies have been imposed, alongside the new commodity-specific rates.

This second version of this tariff tracking project makes two major contributions to the economic literature. First, it presents updated input cost estimates based on both reciprocal and commodity-specific tariffs. These updated estimates largely corroborate the findings from the July analysis, with manufacturing, construction, mining, and repair and maintenance among the most exposed group of industries to tariffs. Additional input costs are significantly higher in some cases, compared to the July analysis, reaching a peak of more than 12 percent for the primary metal manufacturing sector, which encompasses facilities smelting and refining metals such as steel, aluminum, and copper—metals often purchased from abroad.

Second, this tariff update presents a series of demographic findings about workers in highly exposed industries using worker-level data from the Current Population Survey. Overall, it finds that White and Hispanic men and workers with less than a college education comprise a disproportionate share of employment in the most exposed group of industries. Noncitizen men are also highly concentrated in exposed industries, while younger workers and women of all racial groups are underrepresented.

Geographically, workers in the Midwest and South tend toward employment in highly exposed industries, compared to workers in other parts of the country. If businesses pass tariff costs down to workers in the form of slower hiring, slower wage growth, or even loss of incomes or employment, workers in this most-exposed group are likely to be especially impacted.

Let’s first turn to the updated costs of the White House’s current tariff regime.

Rising tariff costs hit U.S. manufacturing industries the hardest

U.S. manufacturers face substantial tariff costs as a fraction of total input costs, with our approximation of commodity-specific tariffs (discussed in the Methodology appendix) weighing especially heavily on the primary metals industry. This conservative approximation means that many manufacturing subsectors reliant on imports of inputs containing aluminum, copper, and steel could face tariff costs closer to the primary metals level of more than 12 percent. (See Figure 1.)

Figure 1

Tariff costs as a percent of all inputs for the top fifth of exposed industries, 2024

The tariff costs imposed on manufacturing, construction, mining, and repair and maintenance are likely to be passed down to consumers and downstream industries because outputs from these sectors are used as inputs by other domestic industries. In other words, while the immediate costs of commodity-specific tariffs will be borne disproportionately by manufacturing and other select industries, all sectors of the U.S. economy will eventually be forced to grapple with tariff costs as price increases cascade down supply chains.

As discussed in the Methods appendix, this updated tariff analysis includes a handful of industries that appear in the Current Population Survey but were not included in our initial analysis, a few of which show up in the top quintile of exposed industries. These new additions include the fishing, hunting, and trapping sector and the U.S. Postal Service.

The inclusion of the Postal Service in this group is important because more than half a million people worked in the USPS industry in 2024, so tariff-related payroll cost-cutting could have meaningful consequences for the broader U.S. economy. It is also important because similar to manufacturing and construction, the Postal Service is a key logistics industry with significant downstream importance. In other words, tariff costs passed down from USPS firms will have a broad impact on the U.S. economy.

The USPS example is illustrative of another important finding in this tariff update. While tariffs on China, and in some cases the European Union, comprise a significant portion of total industry-level tariff costs, levies on imports from countries besides China contribute most of the additional tariff costs for many of the most exposed industries. This means that while a potential China trade deal could mitigate a significant portion of tariff costs, industries would still face large additional input costs from tariffs on imports from other countries.

This finding is especially important as the White House increasingly turns to commodity-specific tariffs under so-called Section 232 authority of the Trade Expansion Act of 1962 while legal challenges to the administration’s authority under the International Emergency Economic Powers Act—under which reciprocal tariffs were implemented—wind through the courts.

Tariffs impact some demographic groups of workers more than others

This iteration of Equitable Growth’s tariff analysis includes worker-level data from the Current Population Survey to better understand the potential demographic incidence of tariff costs, with both economic and political lessons.

While many businesses can accommodate additional tariff costs without cutting their payrolls—by improving operational efficiency, finding alternative input sources, or simply allowing profit margins to shrink—others may be forced to reduce operations, lay off workers, or even close locations altogether. These more extreme consequences are likely to be concentrated in the industries most impacted by tariffs. Comparing workforce demographics in that most-exposed group with broader U.S. workforce averages can help elucidate the potential human consequences of tariff policies.

The gender composition of workers is highly lopsided in industries with the highest tariff exposure. While women comprise about 47 percent of the overall U.S. workforce in our sample, they represent only about a quarter of workers in the most-exposed group of industries. This gender disparity is consistent across racial groups, with women always underrepresented compared to men in the most-exposed industries.

The gender disparity is particularly pronounced among White, Hispanic, and noncitizen workers. Hispanic men, for example, comprise a share of the workforce in the high-exposure group that is about 80 percent larger than their share of the overall U.S. workforce. White men’s share of employment in the high-exposure group is about 42 percent larger than their share in the overall U.S. economy. (See Figure 2.)

Figure 2

Proportion of U.S. workers overall and in the top quintile of tariff exposure, 2024

Union coverage is one of the chief ways workers are shielded from sudden economic shocks such as lost incomes or employment because unions can often push back against layoffs—as federal unions have done during the recent U.S. government shutdown. In our sample, the union coverage rate among the most-exposed industries is about the same as the national average. Yet an analysis of coverage by demographic groups shows some meaningful differences in worker protections.

White workers in the most-exposed group, for example, enjoy a slightly higher union coverage rate compared to the average White worker in the United States. Hispanic and noncitizen workers, meanwhile, suffer a lower union coverage rate in the high-exposure group. This means that workers already at risk of discrimination due to racial and xenophobic bias are comparatively less protected by unions than workers not at risk of discrimination.

Educational attainment represents another key fault line between workers in exposed industries and those in the rest of the U.S. economy. Roughly 40 percent of workers in the economy have earned a bachelor’s degree or more, while about 35 percent have achieved less than a college degree. Those proportions invert for the most-exposed industries: College-educated workers comprise about 26 percent of most-exposed industries’ workforce while workers with less than a college education represent well higher than 48 percent. (See Figure 3.)

Figure 3

Percent of U.S. workers in each quintile of tariff exposure by level of education, 2024

A similar pattern holds for young workers in the U.S. economy. People under the age of 25 make up more than 13 percent of the total U.S. workforce but a little more than 10 percent of the workforce in the most-exposed industries. People under the age of 35 make up more than 35 percent of the total U.S. workforce but less than 32 percent in the most-exposed industries. Altogether, any loss of incomes or employment related to additional tariff costs are likely to be borne more by workers with less than a college education and those over age 35.

Broader implications

These demographic findings have broader economic and political implications. First, the latest installment in Equitable Growth’s series on job quality in the United States finds disparities in occupational exposure to artificial intelligence across gender, race, education, and income. More specifically, it finds that women, Asian American, college-educated, and high-income workers were all more likely to work in occupations highly exposed to uses of AI.

In other words, some of the demographic groups least exposed to industry-level tariff costs are the very same groups with high occupational exposure to AI. Workers displaced by AI from cognitive-oriented tasks into manual jobs could face constricted opportunities due to tariff pressures on hiring in manufacturing, construction, and other industries with a tendency toward manual labor.

Separately, evidence from the impacts of the China trade shock in the 2000s suggests that job losses among non-college-educated White men in manufacturing and the demographic labor market shift toward younger, college-educated workers are associated with increased political support for far-right candidates. To the extent tariff costs result in loss of incomes or employment, impacted geographical areas of the country could see political shifts on the margin toward right-wing populism.

Like many of the workers impacted by the China trade shock, workers in our Current Population Survey sample tend to live in some of the historically industrial states in the Midwest and in parts of the South. Michigan stands out, where more than 26 percent of workers in our sample are employed in the most exposed quintile of industries. On the other side of the distribution, only about 7 percent of workers in the District of Columbia were employed the most tariff-exposed industries. (See Figure 4.)

Figure 4

Percent of U.S. workers in the most exposed group of industries, 2024

The political implications here are self-evident: Workers are most exposed to the costs of tariffs in some of the key political battleground states that have determined recent presidential and general elections and in other states that are core to a future electoral strategy.

Conclusion

Tariffs—both country- and commodity-specific—are introducing new and sometimes significant input costs for a handful of foundational segments of the U.S. economy, including manufacturing, construction, mining, and repair and maintenance. These industries produce goods and provide services that are utilized across the entire spectrum of the U.S. economy, meaning tariff-related costs could cascade down supply chains to increase prices for a broad swath of businesses, workers, and consumers. The inflationary consequences of tariffs are not the focus of this paper, but insights into directly impacted industries could help researchers and policymakers interested in studying or crafting solutions to tariff-induced inflation.

Tariff costs also could be passed down in part to workers in the form of slower hiring, slower wage growth, and even layoffs or location closures in the worst-case scenarios. These scenarios become more likely if firms face difficulties in passing down tariff costs through price hikes or in otherwise accommodating costs through efficiency gains or profit losses.

Workers in the most-impacted group of U.S. industries skew male, Hispanic, and noncitizen and tend to be older and less educated than the general U.S. population. Income and employment losses among these groups could risk replicating the economic and political consequences of the China trade shock of the 2000s, which impacted similar economic sectors and groups of workers.

As global economic uncertainty continues to rise and firms absorb tariff policy changes and adapt their supply chains, Equitable Growth will continue to monitor how some costs are pushed off not only onto firms downstream of impacted industries but also onto workers in those impacted industries themselves.


Did you find this content informative and engaging?
Get updates and stay in tune with U.S. economic inequality and growth!

Posted in Uncategorized

Risks escalate for U.S. retirement plans due to unregulated private credit funds and new rules opening them up to retirement savings accounts

""

When the privately owned auto parts manufacturer First Brands Group earlier this month began to be unable to service its $6.1 billion debt load, the financial press began to pick up on the story—not because it was so unique or important to the U.S. economy, but rather because various financial institutions, including the Swiss banking giant UBS Group AG, were admitting that their exposure to the company was higher and more complicated than they had previously shared, through their private credit funds.

UBS’s private credit funds have $500 million in debt exposure to Cleveland-based First Brands, which boasts more than 20 subsidiaries across the United States. The chaotic bankruptcy of First Brands exposed the opaque complexity of many institutions lending to one business, with leading shortseller Jim Chanos comparing these deals to the “packaging up of subprime mortgages that preceded the 2008 financial crisis, due to the ‘layers of people in between the source of the money and the use of the money.’”

Indeed, this kind of business lending takes place across the unregulated side of the U.S. financial system, creating a different kind of economic risk than policymakers are used to dealing with in the regulated banking sector. As this kind of lending becomes more central to U.S. economic activities, the interconnected levels of debt and collateral involved in these private lending deals need to be much more clearly disclosed by lenders—not least because these investments may soon appear in the retirement savings accounts of average Americans.

Under U.S. financial market regulations, private funds pool together money from many individuals and groups of individuals, often organized by their employer to put aside money collectively, into a vehicle that can engage in deals. Funds have to be managed by fund managers, who are required to disclose specific information about their activities unless they meet certain criteria that gives them an exception. The Investment Company Act of 1940 laid out these rules and created two exceptions, Section 3(c)(1) and Section 3(c)(7), which are limited in terms of the number of participants or to certain “qualified purchasers,” respectively.

These private funds have used these two exceptions for a long time, but because of their high-risk, high-reward profile, nonwealthy households were restricted from access to them. Financial institutions that pool the assets of nonwealthy households have been able to access such funds for decades, but the Trump administration has now opened up access to individual households through their retirement accounts—without increasing the risk management or disclosure requirements on these funds to help households understand what they are investing in for retirement.

Private equity funds have been a major feature of the U.S. economy for some time, but private credit funds have grown in importance more recently. They are structured to lend directly to nonfinancial businesses, with giant asset managers such as Apollo Global Management Inc. and Blackstone Inc. structuring bespoke deals, using the assets they manage for institutional shareholders such as pension funds and university endowments. These firms are increasingly taking market share away from the regulated banking sector, yet their activities are deeply intertwined with banks, as banks lend to the funds themselves.

The risks to the broader U.S. economy—and particularly to everyday Americans with retirement accounts—are clear. At the same time that the market share of private credit funds grows, government regulations are suddenly exposing retirement savings to unregulated financial assets.

Unregulated financial institutions now dominate financial activity, yet these sectors are still posited as an alternative to “normal” finance, such as public stock exchanges and regulated banks. There was good reason to divide the financial sector between regulated banks and exchanges and so-called private markets to protect less financially savvy and less-wealthy investors from the risks taken in unregulated finance. This barrier has now collapsed, and unregulated finance is flooding in to touch all sectors of the U.S. economy. Overall, private funds have approximately tripled in size in the past decade to nearly $25 trillion in gross assets, according to the most recent data from the U.S. Securities and Exchange Commission, and private markets raise more in equity than public markets.

This shift in finance toward unregulated private lending began in the aftermath of the 2008 financial crisis and has escalated so quickly that the possible adverse economic impacts are unclear. Yet the rising reliance of the nonfinancial corporate sector on private markets creates potential systemic risks and challenges for U.S. economic prosperity.

In the eyes of average Americans, publicly traded stocks on stock exchanges such as NASDAQ and the New York Stock Exchange are the dominant financial markets where shareholders buy and sell the stocks of large companies that offer their shares to anyone with the funds to buy them. Yet in 2024, 87 percent of companies with revenue greater than $100 million were private, meaning their equity is not available on open stock markets. Their equity—and, increasingly, their loans—are issued, bought, and sold on nonpublic financial markets that are almost entirely unregulated. Now, all U.S. households holding any financial assets could be exposed to these deals without even realizing it.

Here are the details of the Trump administration’s recent opening of these nonpublic markets to Americans’ retirement saving accounts. In an August executive order, “Democratizing Access to Alternative Assets for 401(k) Investors,” President Trump framed access to “alternative” assets as a barrier that must be breached. He argued in the executive order that while these assets are available to the wealthy and public pension fund beneficiaries, “more than 90 million Americans participat[ing] in employer-sponsored defined-contribution plans do not have the opportunity to participate … in the potential growth and diversification opportunities associated with alternative assets investments.”

No mention was made of why this barrier has been in place since the start of defined-contribution plans in the late 1970s. The U.S. Department of Labor—the regulator of employer-based retirement plans—followed up in late September by rescinding a Biden-era statement that “discouraged fiduciaries from considering alternative assets in 401(k) plan investment menus.” Leading financial institutions quickly rushing in to take advantage of this opportunity.

Blackstone, the world’s leading private alternative asset manager, opened a 401(k) business unit on October 15. Not to be outdone, Martin Small, CFO of BlackRock Inc., the largest asset manager holding public financial assets, claimed that “including private market assets in retirement accounts could add 50 basis points of additional returns annually and generate 15 percent more retirement assets by the end of life.” BlackRock also recently launched a new private equity-focused 401(k) fund.

In Conversation

In Conversation with Lenore Palladino

November 16, 2022

These types of claims in support of these new investment vehicles are intended to fuel the rush of retirement savings funds into the private equity and private credit funds sectors of financial markets. Major financial market regulators, including the Federal Reserve and the International Monetary Fund, are calling attention to the vulnerabilities created by nonbank financial institutions, including private credit funds, as the sector continues to grow rapidly. 

So, too, is the sole remaining Democrat-appointed commissioner at the Securities and Exchange Commission, Caroline Crenshaw. She recently remarked that “as calls for retail investor access to private markets accelerate, I am concerned that we are headed for a high-speed collision—with Main Street retail investors left without airbags.” That’s why policymakers need to look past claims about potential gains and understand the real risks that these developments pose to U.S. financial markets and American working families trying to save for retirement.


Did you find this content informative and engaging?
Get updates and stay in tune with U.S. economic inequality and growth!

Posted in Uncategorized

Workplace exposure to artificial intelligence is higher among U.S. workers with higher wages, depending on how AI is used

""

Overview

Recent advances using artificial intelligence in workplaces, particularly large language models such as Claude.ai and ChatGPT, are increasingly disrupting the U.S. labor market. The cognitive power of AI has the potential to enhance the productivity of some workers while automating other tasks. But how the progression of AI in the workplace plays out across different occupations and affects the earnings of U.S. workers is still hard to pinpoint with precision.

In our new working paper, we measure U.S. workers’ exposure to AI and assess how it may affect their wages. Our analysis builds on previous work by the Pew Research Center and the AI firm Anthropic, as well as Equitable Growth’s own job-quality series. We confirm that exposure to AI is higher among people with higher levels of education who work in high-paying jobs, regardless of gender or race. We also find that AI’s effect on incomes, while overall marginally positive, is contingent on how it is used in workplaces to either augment or automate jobs.

Calculating U.S. workers’ exposure to AI

In July 2023, the Pew Research Center published its paper on AI exposure. Pew’s methodology was largely qualitative, with the researchers using their “collective judgment” to predict AI exposure by occupation. Then, in February 2025, the AI firm Anthropic published its findings on worker exposure to AI by occupation as a part of its “Economic Index,” along with a corresponding paper. By analyzing trends in conversations with their chatbot, Claude.ai, the Anthropic researchers measured the frequency at which certain tasks are augmented (supported) or automated (replaced) by the use of AI.

Both Pew and Anthropic utilized the worker task hierarchy supplied by the U.S. Department of Labor’s Occupational Information Network, or O*NET, as the primary framework for their analyses. These metrics are useful for understanding the content of jobs and are the basis for Equitable Growth’s series on job characteristics and job quality in the United States.

Anthropic linked queries made to Claude.ai to one of several thousand O*NET tasks, or functions performed by a worker in the course of doing a particular job. They then measured the frequency with which these tasks are associated with Claude.ai conversations. The worker task “design or develop automated testing tools,” for example, occurs in 15.7 percent of Claude.ai queries in the sample, 8.8 percent of which describe automative behavior and 6.9 percent of which describe augmentative behavior.

In our analysis, we also calculate AI exposure by occupation using these publicly available task-level metrics. We additionally source task frequency data from O*NET and then weight each task by how often it is performed on average in its corresponding occupation. Once we determine overall exposure for O*NET occupations, we then match AI exposure metrics to the U.S. Census Bureau’s list of occupations. We used these data to produce figures comparable to those in the original Pew paper, confirming greater AI exposure in the workplace among women versus men, Asian Americans versus other racial and ethnic groups, and highly educated workers. (See Figure 1.)

Figure 1

Percent of people in U.S. occupations highly exposed to uses of Claude.ai, 2024

We additionally confirm the Pew finding that workers with higher incomes tend to be more exposed to AI, regardless of race, age, citizenship status, and education. (See Figure 2.)

Figure 2

U.S. workers’ average hourly earnings by exposure to uses of Cluade.ai, 2024

The relationship between AI exposure and workers’ incomes

We find that exposure to AI in workplaces has a statistically significant and positive but minor effect on workers’ hourly wages.This may be due to more profound but opposing influences of different types of AI and their applications. Whether artificial intelligence improves or undermines workers’ incomes is therefore largely determined by whether AI supports or replaces the tasks they perform.

More specifically, we calculate the percent change in hourly wages given a percent change in exposure to AI. (See Figure 3.)

Figure 3

Percent change in U.S. hourly wages due to percent change in AI exposure overall, then due to automation and augmentation

All else held equal, a percent increase in total AI exposure will, on average, predict an 0.5 percent increase in hourly wages. But, as seen in Figure 3 above, this relatively minimal overall effect of AI exposure on wages may conceal the larger effects of augmentation-driven or automation-driven AI use. When considered on its own, exposure to automative AI reduces wages by 2.3 percent, but this effect is simultaneously counteracted by augmentative AI exposure, which increases wages by 2.5 percent for every 1 percent increase in AI exposure.

These results are telling. Artificial Intelligence has the potential to improve some workers’ wages if it helps them do their jobs more effectively and efficiently. But AI is equally likely to reduce workers’ wages in areas where it can substitute for workers.

Conclusion

U.S. workers’ exposure to artificial intelligence, measured in terms of uses of Anthropic’s Claude.ai agent, has a still-ambiguous relationship with workers’ incomes. Different occupations’ exposure to the augmentative use of AI is positively correlated with higher wages, while exposure to its automative use is negatively correlated. Overall exposure is slightly positively correlated with earnings.

Corroborating earlier work from the Pew Research Center, we find meaningful differences in AI exposure along lines of gender, race, education, and income. Women tend to work more in highly exposed occupations compared to men, a relationship that holds across most racial groups. Workers with college educations and high incomes also tend to work in highly exposed occupations, trends that are persistent across race. White and Asian American workers overall tend to work more in highly exposed occupations, compared to Black and Hispanic workers.

Our new working paper advances the growing body of research on the continuing impacts of artificial intelligence on the U.S. labor market and suggests avenues for future exploration. Different types of AI use are likely to be deployed to differing effects, with some uses assisting human workers and other uses displacing human work altogether. Policymakers should be cognizant of these differences when regulating the development and workplace deployment of artificial intelligence.


Did you find this content informative and engaging?
Get updates and stay in tune with U.S. economic inequality and growth!

Posted in Uncategorized

Equitable Growth supports scholars studying the economics of the energy transition

""

The Washington Center for Equitable Growth today announced a new cohort of grantees. These nine scholars will study how the design and implementation of federal policy influences how businesses and regions innovate and invest as part of the energy transition, and the resulting effects on workers and local labor markets.

The Biden-Harris administration’s signature climate legislation, the Inflation Reduction Act of 2022, was widely touted as the most significant climate action in U.S. history, appropriating $145.4 billion in grants with additional incentives available through tax credits and loans. A few years later, however, the One Big Beautiful Bill Act was passed by Congress and signed into law in July 2025 and winds down many of the Inflation Reduction Act’s key provisions.

Still, estimates suggest that more than two-thirds of those grant dollars appropriated by law—or roughly $90 billion—were already obligated prior to the passage of the One Big Beautiful Bill Act. And while many of the tax credits are now set to expire more quickly due to that 2025 bill, roughly $3.3 billion of those credits were claimed just for electric vehicle tax credits in 2023 alone.

These variations offer researchers an opportunity to study how companies and consumers respond to shifting incentive structures, as well as examine the economic effects of the energy transition more broadly. The move away from fossil fuels and toward renewable sources of energy presents opportunities to drive innovation and investment, create new jobs, and revive distressed local economies. Yet it also poses risks to workers and regional economies dependent on the fossil-fuel industry.

Earlier this year, Equitable Growth issued a Request for Proposals for research that generates evidence on the Inflation Reduction Act’s effect on labor markets and regions, as well as innovation and investment in clean energy, in order to inform future policymaking. The new Equitable Growth grantees who responded to this RFP will look at areas such as the 2022 law’s subsidies for electric vehicles, solar supply chain effects, place-based policies that aim to ease the transition from fossil fuels, and the labor market implications of various IRA tax credits.

More specifically, the four funded projects are as follows:

The energy transition is underway. Understanding how federal policy can effectively drive innovation and economic growth in ways that benefit workers and local economies is essential to ensuring the United States remains competitive and that workers and regions are not left behind. We look forward to seeing the actionable insights that these grantees produce.


Did you find this content informative and engaging?
Get updates and stay in tune with U.S. economic inequality and growth!

Posted in Uncategorized

Payment for schedule changes under Fair Workweek laws in three U.S. cities

""

Overview

Fair Workweek laws set new standards for scheduling U.S. workers in jobs and industries characterized by fluctuating and unpredictable work hours, such as jobs in retail and food service. A number of cities and states have implemented these laws in the absence of a federal policy. These laws often feature multiple provisions, including those that govern when and how employers must inform employees of their schedule and how employees are compensated for schedule changes.

There are two types of compensation for schedule changes that employees can qualify for:

  • Predictability pay. For employer-driven changes that result in more or the same number of scheduled hours, the laws require employers to ask employees if they agree to work additional or different hours and to then pay them extra for doing so (commonly the equivalent of one extra hour of pay).
  • Partial compensation. For employer-driven changes that result in fewer hours, employers do not need to ask employees if they agree to the changes, but employers do need to provide employees with partial compensation for the earnings they lose by having their hours reduced (commonly the equivalent of half of the hours remaining on the shift).

Some employers have expressed concern that Fair Workweek laws will hurt profitability by limiting their ability to adjust their labor supply to changing demand. But the provisions of most Fair Workweek laws do not prohibit employers from making schedule changes—they simply require employers to compensate employees when changes to a work schedule are made.1

In other words, predictability pay can be viewed as a risk-sharing approach to improve employees’ work schedules. Payment for schedule changes is intended to protect labor flexibility for employers while compensating workers for at least some of the costs that schedule changes create, such as earning reductions, disrupted child care or transportation arrangements, or interferences with school and training schedules.

This factsheet reports on findings from two studies of Fair Workweek laws that offer insights into employee compensation for schedule changes and managers’ experiences providing compensation as required by their local Fair Workweek law. The first is a survey of 1,781 retail and food-service workers in Chicago, Seattle, and New York City conducted in 2024, and the second is a four-wave interview study (done between 2017 and 2022) with local managers responsible for implementing Seattle’s Secure Scheduling Ordinancein 139 retail or food-service worksites.2

Most covered workers receive predictability pay 

  • Fair Workweek laws are spurring retail and food-service employers to provide extra pay for additional or changed hours. When analyzing the combined responses of workers in Chicago, Seattle, and New York City, about 60 percent of workers at covered worksites report having received extra compensation the most recent time a manager requested or required them to extend their shift beyond their scheduled end time or to work an additional or different shift than was on the original schedule. The odds of receiving extra pay for these manager-driven changes are more than twice as high among workers at worksites covered by Fair Workweek laws than among workers at uncovered worksites.
  • Receipt of predictability pay is comparable across all three cities studied. More than half of covered workers in Chicago, Seattle, and New York City who should have received predictability pay, according to their local laws, report having received it the most recent time they worked more or different hours in response to a manager’s request. In each city, a significantly smaller proportion of uncovered workers in comparable circumstances report having received extra pay, suggesting that Fair Workweek laws are making a difference in all three cities studied.
  • The complexity of exemptions from paying predictability pay make legal compliance—and managers’ jobs—more difficult. Although rates of receiving predictability pay are similar across the three cities we studied, each city offers employers unique ways either to avoid payment for schedule changes or to reduce the amount they pay workers.3 These exemptions mean that whether workers are compensated for incurring the same type of manager-driven schedule changes depends on the city in which they work. Seattle’s Secure Scheduling Ordinance, for example, does not require employers to provide predictability pay for shift extensions if the employee volunteered to stay by responding to a manager’s request sent to multiple employees currently at the worksite. This exemption meant that 38 percent of covered employees in our Seattle sample who incurred a manager-driven shift extension were not eligible for predictability pay. In contrast, their counterparts in Chicago and New York City (at fast-food worksites) were all eligible for this extra compensation
  • Predictability pay can provide an incentive for managers to minimize shift extensions. Some Seattle managers talked about how the premium pay requirement made them reluctant to extend employees’ shifts, as reflected in this manager’s response to a question asking how often they request employees to stay beyond their scheduled end time:

Not often, unless there’s like, we had a call out that day or we’re super understaffed for some reason [like] sickness … but usually we try to make it work and not try to ask people to extend because we’d still have to pay the predictive pay if you ask people.
—Apparel retail manager, Seattle, June 2022

  • Predictability pay can also be used to incentivize employees to extend their shifts. Some Seattle managers talked about how predictability pay provided them with a new tool for maintaining staffing levels when business surged or employees were tardy, as reflected in this manager’s response when asked how often they request employees to stay beyond their scheduled end time:

Yeah [we extend shifts] …. And generally, whenever we are asking someone to extend their shift, that is always just an extra perk that we let them know, like, “Hey, if you do stay, you can get predictability pay,” and that’s almost their, in a way, incentive if they’re willing to stay longer.
—Apparel retail manager, Seattle, June 2022

Most workers receive partial compensation for shifts cancelled ahead of time—but not for same-day hour reductions

  • Almost three-fourths of workers at covered and uncovered worksites report some compensation the most recent time a manager cancelled one of their shifts. Given that a comparable proportion of workers at covered and uncovered worksites in New York City, Seattle, and Chicago report partial payment for cancelled shifts, the Fair Workweek laws may not be driving this practice.
  • Only a minority of workers at covered and uncovered worksites report having received partial compensation for lost hours when their managers requested or required them to leave work before their scheduled end time. About a third of employees at covered worksites in all three cities studied who were asked or required to leave work early report that they were partially compensated for the remaining hours, which is comparable to rates of compensation among workers at uncovered worksites. 
  • Receipt of partial payment for shift cancellations and same-day hour reductions is comparable across the three cities studied. In Chicago, Seattle, and New York City, the majority of workers covered by a Fair Workweek law report being partially compensated the last time a manager cancelled their shift ahead of the workday, but only a minority report being compensated for hours lost due to same-day hour reductions as required by their local law. Fair Workweek laws are thus falling short on smoothing earnings when hours are reduced by management the day of or during a shift.
  • Many managers in covered worksites believe that partial compensation for lost hours is not required when they ask for volunteers to leave work early, contrary to all municipal Fair Workweek laws. In all cities, partial compensation is mandatory when a manager requests or requires employees to leave work before their scheduled end time, even when the employee welcomes this change. Only when the employee initiates a request to leave early is partial compensation not required. Our interviews in Seattle suggest that many managers are unaware of  or confused by this provision, as illustrated by this conversation with an apparel retail manager in Seattle in 2022:

Manager: “If it’s a slow day and there aren’t a lot of tasks to do … sometimes we do just ask associates if anyone would like to go home early. We don’t ever send anyone home. We just ask them, “Hey, if there’s anyone who would like to go home early today…”

Interviewer: “Would they receive compensation for the hours that they would’ve worked if they completed their full shift?”

Manager: “… from my understanding, if they are sent home, then yes, they do get that compensation. But if it’s something that we present to them as something that’s a voluntary choice and no one’s required to go home … [no].”

Conclusion

Just as an overtime premium compensates hourly employees for working beyond what is conventionally viewed as a reasonable workweek, predictability pay compensates employees for accommodating employer requests for schedule flexibility. Moreover, predictability pay incentivizes managers to limit schedule changes to those really worth it to their businesses. A federal framework that minimizes exemptions from predictability pay could provide a useful foundation for ensuring consistency across municipalities and states, furthering the goal of establishing universal standards for employers and meaningful improvements for employees. The benefits of such a policy would accrue to both employers and workers across the United States. (See Table 1.)

Table 1

Percentage of workers receiving compensation for employer-driven schedule changes, by coverage, type of change, and urban area, in Chicago, Seattle, and New York City

Did you find this content informative and engaging?
Get updates and stay in tune with U.S. economic inequality and growth!

Posted in Uncategorized

Rethinking U.S. economic mobility to study change within a generation

""

Overview

When most people think about intergenerational mobility, they often assume it unfolds gradually over long periods of time. Historical patterns have reinforced this perception, shaping a widespread belief that meaningful economic mobility is tied to the passage of time.

Yet in today’s political and social climate, concerns about the prospects for economic mobility are mounting as inequality continues to widen. The United States now ranks among the lowest in economic mobility compared to other advanced economies. With ongoing federal cuts to essential social programs such as Medicaid and the Supplemental Nutrition Assistance Program, questions persist about who is truly positioned to thrive in today’s U.S. economy.

These realities make it increasingly urgent to pursue research that investigates the conditions enabling mobility over shorter periods of time to create more effective policies. By shifting the lens from long-term structural legacies to more immediate, community-level dynamics, research on economic opportunity can identify how to encourage economic mobility within generations as well.

A recent working paper, “Changing Opportunity: Sociological Mechanisms Underlying Growing Class Gaps and Shrinking Race Gaps in Economic Mobility,” studies this potential shift in perspective. The researchers from Opportunity Insights who co-authored the paper—Raj Chetty, Will Dobbie, Benjamin Goldman, Sonya R. Porter, and Crystal S. Yan—aim to understand the causal mechanisms behind rapid changes in intergenerational economic mobility.

As it turns out, the authors find that changes in community conditions, such as employment rates within racial and economic parental peer groups, have a causal effect on children’s long-term economic outcomes. In other words, where and with whom parents and children live and interact shapes the trajectory of the next generation.

The co-authors observed a stark divergence in intergenerational economic mobility across race and class between those born in 1978 and those born in 1992. Specifically, the gap in economic mobility between low-income Black and White families narrowed, while the gap between White children from low- and high-income families widened. These trends—a shrinking race gap and a growing class gap—were seen not just in earnings, but also in other life outcomes, including marriage, mortality, and incarceration rates.

Still, the study finds that Black children from low-income families continue to face significantly lower levels of upward mobility—highlighting just how deep racial economic inequality is and remains. The research by the Opportunity Insights co-authors suggests that while racial disparities are shrinking among low-income groups, class remains a powerful barrier to mobility. Notably, income gaps among children from high-income Black and White families remained relatively unchanged, pointing to the limits of progress at the top of the income distribution.

The role of community in mobility

Chetty and his co-authors examined various potential explanations for these diverging trends, including neighborhood- and family-level factors. They find that community-level changes, especially in the social environments to which children are exposed, contribute the most to the observed differences.

This indicates that growing up in a community with higher parental employment increases a child’s chances of upward mobility. As such, it seems children are more influenced by the employment status of other parents in their own peer group, characterized by similar racial, class, and geographic backgrounds.

Yet the paper also finds that the impact of parental employment rates on children’s outcomes varies depending on the social environment in which they grow up. In other words, it is not just how wealthy a community is that matters, but with whom children and their families interact as well. Social networks and daily interactions within a community thus play a larger role in shaping a child’s future than material resources alone.

These social dynamics help explain why moving to a community with rising parental employment rates, especially at a young age, can significantly improve long-term outcomes, highlighting the powerful role of social context in driving intergenerational mobility.

Conclusion

These findings are critical for policymakers to address both racial and class-based economic inequality. Debates earlier this year around the One Big Beautiful Bill Act highlight how broad federal policy decisions can deeply influence the local environments that shape children’s outcomes. Increases in health care costs for Medicare recipients, cuts to nutrition assistance programs, and the redirection of public school funding collectively threaten the stability and opportunity structures within low-income communities.

Given the evidence that neighborhood social environments play a critical role in shaping children’s life outcomes, it is imperative that policy shifts toward more targeted interventions—ones that strengthen communities rather than erode them. Structured-focus policies that invest in community-level change, particularly those that build opportunity-rich environments for low-income families, may be critical in addressing both racial and class-based economic inequality. In doing so, these policies can pave the way for greater opportunity and equitable prosperity for countless individuals in the generations to come.


Did you find this content informative and engaging?
Get updates and stay in tune with U.S. economic inequality and growth!

Posted in Uncategorized

The status of U.S. labor market data amid the government shutdown

""

Overview

The federal government ground to a halt earlier this week as Congress was unable to reach a bipartisan agreement on continuing funding after annual appropriations ran out at the end of the 2025 fiscal year on September 30. The consequences of such a shutdown—the nation’s first in 6 years—could fall disproportionately on federal workers, as furloughed federal employees lose income and the White House threatens permanent layoffs.

Also under threat are the federal data used to track the health and trajectory of the U.S. economy. As the U.S. Labor Department made clear before the shutdown began, regular collection and publication of labor market data would halt if the federal government is not funded.

In the short run, this means that the researchers, investors, business leaders, and consumers who rely on the U.S. Bureau of Labor Statistics’ monthly employment situation report, due to have been released this morning, are operating in the dark. In the longer run, critical data collection operations—including for the decennial census that will be released in 2030—could be set back at a time when BLS funding is already at a multi-decade low. As Equitable Growth grantee Peter Norlander wrote in a recent piece on data democratization, individuals and organizations can take steps to protect and preserve U.S. labor market data, but there is no substitute for the robust, independent data produced by the U.S. government.

This column first describes the work of the Bureau of Labor Statistics. It then turns to how BLS data are used by individuals, businesses, and policymakers alike, before detailing the impact of the agency not releasing its employment situation report this month due to the shutdown. It closes by explaining recent BLS budget constraints and how this affects the agency’s operations and data collection.

What is the Bureau of Labor Statistics?

The Bureau of Labor Statistics is a premier statistical organization of the U.S. federal government and part of an ecosystem that includes several other federal agencies devoted to data collection and analysis. The U.S. federal statistical system is responsible for producing public reports and metrics that help policymakers, firms, and individuals make informed decisions about the U.S. economy. Accuracy and data confidentiality are key to the success of the U.S. federal statistical system.

The agency organizes several regular data releases, including the monthly employment situation report, which includes insights from two key programs: the Current Population Survey, also known as the household survey, and the Current Employment Statistics, also known as the establishment survey. It also produces a range of other important metrics, including job openings and turnover rates, consumer and producer measures of inflation, and employment by industry and geographic region.

How BLS data are used

Businesses, policymakers, researchers, and everyday Americans use BLS data directly and indirectly to make informed economic decisions. Individuals look to headline inflation data to make decisions about durable goods purchases, while businesses use employment and inflation data to weigh investment decisions. A BLS factsheet notes that key corporate functions—including compensation and benefits analysis and contract administration—are often guided by detailed industry-level BLS data releases on wage and price trends.

In a paper for the National Association for Business Economics, former BLS Commissioner Erica Groshen listed dozens of uses of BLS data by private citizens, businesses, researchers, advocacy groups, and governments. Groshen wrote that BLS data guides individual decisions about where to live, how to invest, and what career to pursue, as well as business decisions about setting wages and prices, managing employee turnover, improving workplace safety, estimating financial risk, and validating private data sources.

The precise economic value of federal statistical data is difficult to calculate, but the myriad uses of the data suggest disruptions to BLS work could slow decision-making and lead to riskier choices across the U.S. economy.

The impact of not releasing an October employment situation report

One of the very first casualties of this government shutdown is more information about how everyday workers are doing across the U.S. economy. The labor market has recently been a source of real strength in the U.S. economy, but it has been slowing down considerably over the past few months. The latest BLS employment situation report, which would have included new data from September along with adjustments to data from prior months, could have indicated whether that labor market slowdown is continuing, accelerating, or reversing.

The economy is very much on a “knife’s edge,” and every data point matters for policymakers who should be trying to strengthen the economy. Second quarter Gross Domestic Product growth was strong, but some of that strength was likely a bounce back from incredibly weak first quarter GDP growth. What we know for sure is that the economy has been creating fewer jobs, wage growth has been slowing, and middle-class consumers have been feeling pinched.

This slowdown in the U.S. labor market is likely to be made worse by the Trump administration’s calls to cut public services, specifically health care assistance. These cuts would hurt the economy by putting more strain on already-overburdened middle-class budgets.

More broadly, the disruptions that will result from this government shutdown will put further pressure on the cracks in our already-brittle economy. It is hard to predict the exact ways in which a shutdown will cause economic disruptions and pain, but that uncertainty is part of the problem and creates big risks for the economy.

BLS funding has fallen dramatically in recent years

Regular public data releases, such as the BLS monthly employment situation report, could help mitigate some of this uncertainty. Yet the shutdown is not solely to blame for strains placed on BLS data collection. The agency’s declining budget also plays a role.

Economists and policymakers alike have warned for years that declining real funding for the Bureau of Labor Statistics has stymied the agency’s efforts to improve and innovate its data collection and analysis. In October 2018, for example, the Council of Professional Associations on Federal Statistics wrote in a blog post that the Bureau of Labor Statistics’ purchasing power has dropped $120 million, as flat nominal funding is eroded by inflation. Equitable Growth analysis of federal budget and inflation data show another at least $50 million in eroded funding since 2018. (See Figure 1.)

Figure 1

Annual BLS funding in millions of 2024 dollars

In May 2024, the co-chairs of the professional association Friends of BLS—both former BLS commissioners—wrote in a letter to congressional appropriators that BLS funding must be increased to improve Current Population Survey data collection, including through an internet self-response method. Similarly, experts at the Center for American Progress wrote in September 2024 that the survey needs additional funding to expand its sample size, which has remained at roughly 70,000 U.S. households since 2001.

In a “Commissioner’s Corner” blog post in December 2024, then-BLS Commissioner Erika McEntarfer wrote about the need for improved BLS funding, particularly for the agency’s IT systems, to address survey nonresponse issues exacerbated by the COVID-19 pandemic. In May 2025, the Friends of BLS co-chairs once again wrote to lawmakers warning of the 22 percent real decline in agency funding since 2010 and highlighting funding needs, including modernization of the Current Population Survey.

Conclusion

The government shutdown’s impact extends far beyond federal data collection and release. But the lack of an employment situation report today will only exacerbate the uncertainty facing the U.S. economy of late. As budget negotiations work through Congress for fiscal year 2026, policymakers should consider increasing the BLS budget to ensure continuity, accuracy, and reliability of these vital economic statistics.


Did you find this content informative and engaging?
Get updates and stay in tune with U.S. economic inequality and growth!

Posted in Uncategorized

U.S. workers’ and managers’ experiences with Fair Workweek laws can inform enforcement and education

""

Overview

Fair Workweek laws are intended to set new standards for scheduling workers in jobs and industries characterized by fluctuating and unpredictable work hours, such as jobs in retail and food service. The laws include a set of provisions that govern when and how employers must inform workers of their schedules, provide extra compensation for schedule changes, and offer workers input into the timing of their work. The goal of the laws is to increase employees’ schedule predictability, stability, adequacy, and control.

A number of cities and states have implemented Fair Workweek laws in the absence of a federal policy that sets new work-hour standards. Recent research indicates that these laws are improving work schedules in targeted jobs, but not for all of the provisions and not for all covered workers. 

This factsheet offers information that may help close this gap between Fair Workweek laws’ intentions and their real-world impacts. We draw on findings from two studies that offer lessons for targeting enforcement of Fair Workweek regulations and educating workers on their rights and managers on their responsibilities. The first is a survey of 1,781 retail and food service workers in Chicago, Seattle, and New York City conducted in 2024, and the second is four waves of interviews (between 2017 and 2022) with front-line managers responsible for implementing Seattle’s Secure Scheduling Ordinance in 139 retail or food service worksites.4

Workers covered by Fair Workweek laws are largely compensated for schedule changes

  • Fair Workweek laws are spurring retail and food-service employers to provide extra pay for additional or changed hours. About 60 percent of workers at covered worksites reported that they received extra compensation the most recent time a manager requested or required them to work a closely spaced shift, to extend their shift beyond their scheduled end time, or to work an additional or different shift than on the original schedule. These rates of compensation are significantly higher than among workers facing the same circumstances in uncovered worksites.

Fair Workweek laws are not meeting their full potential—yet

  • A large proportion of workers in jobs covered by Fair Workweek laws are losing out on these protections. Although Fair Workweek laws are increasing the likelihood of compensation for manager-driven schedule changes, a substantial share of covered workers report not receiving required premium pay for practices such as shift extensions (41 percent), hour additions/changes (40 percent), and closely spaced shifts (37 percent), or partial pay for shift reductions (68 percent) and cancellations (28 percent). Moreover, more than a third of covered workers report that they were not asked before a manager added or changed their scheduled hours, had not received a good faith estimate in writing, or had not received 2 weeks’ advance notice.
  • Workers seldom receive partial compensation for last-minute reductions in hours. Less than one-third of workers covered by Fair Workweek laws who were sent home early from a shift report receiving partial compensation for reduced hours, a similar rate to those at worksites not covered by these laws. Although the majority of workers sent home report that firms document that the reduction in hours was manager-initiated, this did not trigger partial compensation for the hours remaining on most workers’ schedules, as required by law.
  • Two weeks’ advance notice remains uncommon. Fair Workweek laws in Chicago and Seattle, as well as provisions for fast-food workers in New York City, require employers to provide employees with a schedule of the days and times they will be required to work at least 14 days in advance. But only in Seattle do covered workers have a significantly greater chance than uncovered workers of receiving their schedules with at least 2 weeks’ notice. The difference between covered and uncovered workers who report 2 weeks’ notice is more than 20 percent in Seattle but less than 5 percent in the other municipalities. In addition, only in Seattle do more than half (57 percent) of covered workers report that they receive their work schedules at least two weeks in advance of the workweek (32 percent in Chicago; 31 percent among New York City fast food workers).  
  • Fair Workweek laws are improving workers’ control over schedule changes, but workers still feel pressured to accept managers’ scheduling requests. At covered worksites, a significantly larger proportion of workers than at uncovered worksites reported that a manager had informed them of their right to decline a request to change their schedules. Workers at covered worksites also were more likely to have actually declined a change request. Nevertheless, the majority of workers at covered worksites report that there are benefits to accepting a manager’s scheduling request—particularly, getting better hours. They also report that there are costs to declining requests, such as losing hours and being assigned harder tasks. Their assessments seem reasonable, as 8 in 10 workers who had recently declined a manager’s scheduling request reported at least one negative repercussion for doing so. Thus, despite providing a legal right to decline a manager’s request for a schedule change, the overall incentive structure that employees face seems to have remained intact, calling into question how much control workers actually have over changes to their schedules.

Improving enforcement and education around Fair Workweek laws

  • Education and enforcement should be targeted on the provisions of Fair Workweek laws with low rates of compliance. The low rates of compliance with the policies on 2 weeks’ advance notice and partial compensation for shortened shifts are noteworthy. Our study of front-line managers in Seattle suggests that a substantial part of the problem is managers’ misunderstanding of these provisions. Although providing 2 weeks’ advance notice may seem easy to understand, several managers in Seattle thought they were complying with the notice requirement by posting 2 weekly schedules at a time, even though the start date on the earliest schedule was only a few days before the beginning of the workweek. Managers also commonly believed that partial compensation for lost hours is not required when they ask for volunteers to leave work early, contrary to all municipal Fair Workweek laws. Moreover, many managers provided examples of how they entice workers to comply with their scheduling requests, while still viewing workers’ acquiescence as completely voluntary. Targeted education around advance notice, partial compensation for shortened hours, and the right to decline are useful next steps.
  • The ongoing education of workers and managers is needed. In retail and food service, turnover is high at both the employee and manager levels, suggesting the need for ongoing training and education of local managers and workers’ groups. Ensuring posters that clearly describe the law are posted in a frequently trafficked location for employees to view seems particularly helpful: Workers in our study who had observed a Fair Workweek poster in their workplace had the most accurate knowledge of their local laws.
  • Corporate involvement in the implementation of Fair Workweek laws can help set companywide compliance procedures. In our longitudinal study of managers in Seattle, sustained compliance was most likely to occur when companies adjusted scheduling and payroll systems to automatically monitor compliance. Aligning administrative systems to the laws ensured that compliance was monitored even as local managers came and went.
  • Give it time. Five years after enactment, our longitudinal study finds that several Seattle managers attest to how, with practice, Fair Workweek laws set new and improved standards for scheduling workers in retail and food service. With time and training, managers come to see fair scheduling practices as standard-operating-procedure.

Did you find this content informative and engaging?
Get updates and stay in tune with U.S. economic inequality and growth!

Posted in Uncategorized

How Are Workers Experiencing Fair Workweek Laws? Evidence for policymakers and advocates

""

This factsheet, “How Are Workers Experiencing Fair Workweek Laws? Evidence for policymakers and advocates,” originally appeared on WorkRise at https://www.workrisenetwork.org/sites/default/files/2025-08/howareworkersexperiencingfairworkweeklaws.pdf.

New laws that regulate employer scheduling practices have been enacted in ten US localities over the last decade. Known as Fair Workweek laws, these rules target industries in which a large proportion of employees are in lower paid jobs and face the constant uncertainty of fluctuating, unpredictable hours, such as retail and food service. The local laws address similar dimensions of work schedules, but the specific industries, size and type of employer, and administrative rules that define compliance vary by locality. Adapted from the brief, How Are Municipal-Level Fair Workweek Laws Playing Out on the Ground? Experiences of Food Service and Retail Workers in Three Cities, the chart below shows how workers are experiencing Fair Workweek laws in Chicago, Seattle, and New York City.

Figure 1

Fair Workweek Laws Are Improving Some—But Not All—Scheduling Practices

Share of retail and food service workers experiencing practices in alignment with scheduling laws, by coverage

Share of retail and food service workers experiencing practices in alignment with scheduling laws, by coverage
Note: Scheduling practices without values shown do not have significant differences between groups of workers.

What can policymakers do?

For policymakers in cities that have already approved Fair Workweek laws, implementation is the critical next step. These cities can support effective implementation by adopting easy-to-understand rules that encourage employer compliance, strengthen enforcement by city agencies, and educate employees and employers on their rights and responsibilities under Fair Workweek laws. In cities that have not yet adopted comprehensive Fair Workweek legislation, policymakers can still take meaningful steps by providing incentives to employers for adopting high-road scheduling practices, setting up a hotline for employees to report problematic scheduling experiences, and assembling information to inform future Fair Workweek legislation. Specific actions include:

  • Bolster funding to labor enforcement offices. Labor enforcement offices across the country face chronic funding shortages. Without adequate staffing, they lack capacity for proactive investigations, community outreach, and enforcing full compliance with Fair Workweek laws.
  • Launch education campaigns to help employers understand that it is illegal to not comply with Fair Workweek laws. Compliance is the responsibility of employers, not workers. To strengthen adherence with Fair Workweek laws, cities should work closely with employers to address barriers to the implementation of Fair Workweek provisions at local worksites, such as providing training modules and sample workplace practices to equip all managers with the knowledge and tools they need to implement Fair Workweek protections effectively.
  • Launch education campaigns to help workers know if and how they are covered by Fair Workweek laws. Because geographic boundaries governing coverage of Fair Workweek laws can be blurry and the types of jobs covered may be misunderstood, workers may not know they are protected by their local law. Cities should launch informational campaigns to confirm coverage areas, provide hotlines for people to ask questions and report violations, post FAQs in plain language, and highlight high-road employers who proactively inform their workers.
  • Give added attention to Fair Workweek provisions that are furthest from full compliance. Policymakers should investigate the specific areas of non-compliance in their local Fair Workweek law, paying particular attention to provisions with the lowest rates of compliance. This information can be used to educate employers and employees on legal requirements and to refine administrative rules that impede effective implementation on the ground.
  • Simplify Fair Workweek laws by restricting the number of exemptions for premium pay. Some municipalities offer covered employers exemptions that allow them to avoid paying employees a premium for schedule changes. These exemptions mean that workers may not be compensated when their employer requests or requires a change to their schedule—undermining the stated aims of the laws. The administrative rules defining these exemptions are complex, further impeding policy goals by complicating implementation for on-site managers, enforcement by city officials, and understanding by employees.

For more insights on these findings, see the full report How Are Municipal-Level Fair Workweek Laws Playing Out on the Ground? Experiences of Food Service and Retail Workers in Three Cities at urbn.is/WRFWW

This summary was funded by WorkRise, a research-to-action network hosted by Urban Institute and supported by a multifunder collaborative. Our philanthropic supporters make it possible for WorkRise and Urban to advance their shared missions of bringing high-quality evidence to changemakers with the power to transform economic opportunity for all. The views expressed are those of the authors and should not be attributed to WorkRise or to the Urban Institute, its trustees, or its funders. Funders do not determine research findings or the insights and recommendations of Urban experts. Further information on the Urban Institute’s funding principles is available at urban.org/fundingprinciples.


Did you find this content informative and engaging?
Get updates and stay in tune with U.S. economic inequality and growth!

Posted in Uncategorized