Equitable Growth’s Household Pulse graphs: October 14 – 26

On November 3, the U.S. Census Bureau released new data on the effects of the coronavirus pandemic on workers and households. Below are four graphs compiled by Equitable Growth staff highlighting important trends in the data.

Low-income families are more likely to report not being employed compared to middle- and high-income families, exacerbating financial precarity for these U.S. households amid the Coronavirus Recession.

Share of respondents reporting being employed in the last 7 days, by 2019 U.S. household income

As coronavirus cases surge across the country, workers with lower levels of education are reporting higher rates of not working due to symptoms of the disease compared to those with a bachelor’s or graduate degree.

Share of U.S. population 18-years and older not working at time of the survey because they were sick with coronavirus symptoms, by educational attainment, October 14-26

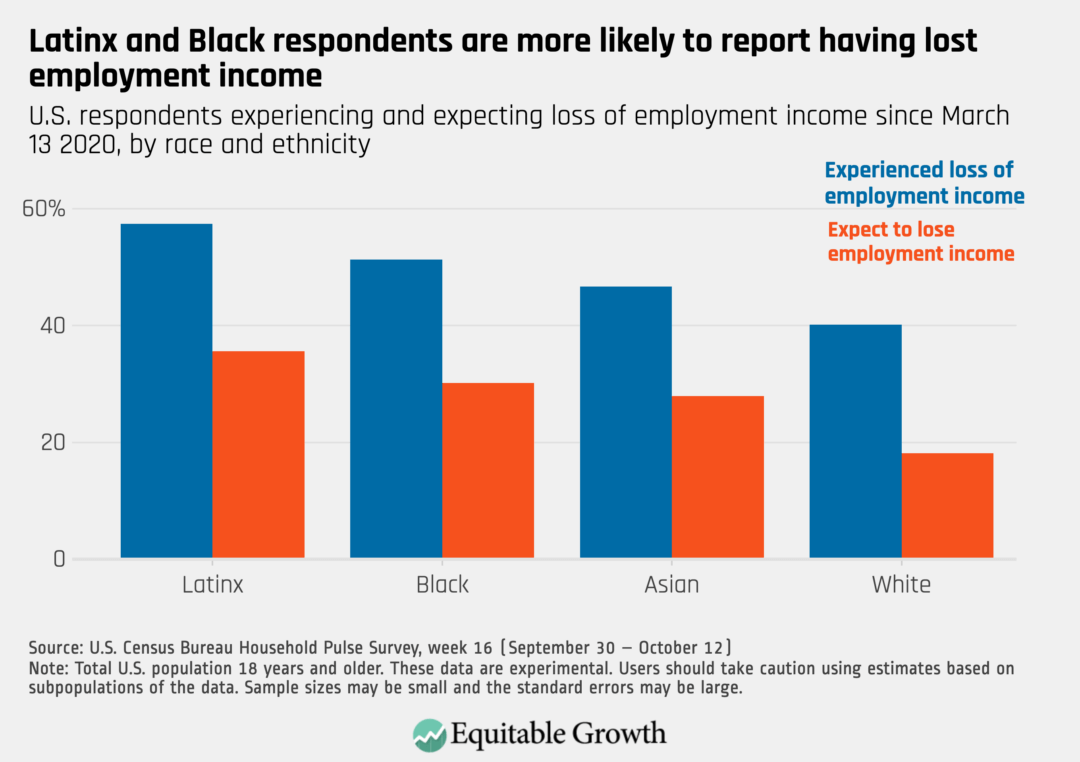
Latinx, Black, and Asian American households continue to report having already lost income during the current recession and expect to continue to lose income at higher rates compared to White households.

U.S. respondents experiencing and expecting loss of employment income since March 13, 2020, by race and ethnicity

Nearly one-quarter of Black renters and one-fifth of Latinx and Asian American renters report they are not currently caught up on rent, and people of color who own their homes are more likely to report not being current on their mortgage payments compared to White homeowners.

Currently caught up on rent and mortgage, by race and ethnicity

Equitable Growth’s Household Pulse graphs: September 30–October 12

On October 21, the U.S. Census Bureau released new data on the effects of the coronavirus pandemic on workers and households. Below are five graphs compiled by Equitable Growth staff highlighting important trends in the data.

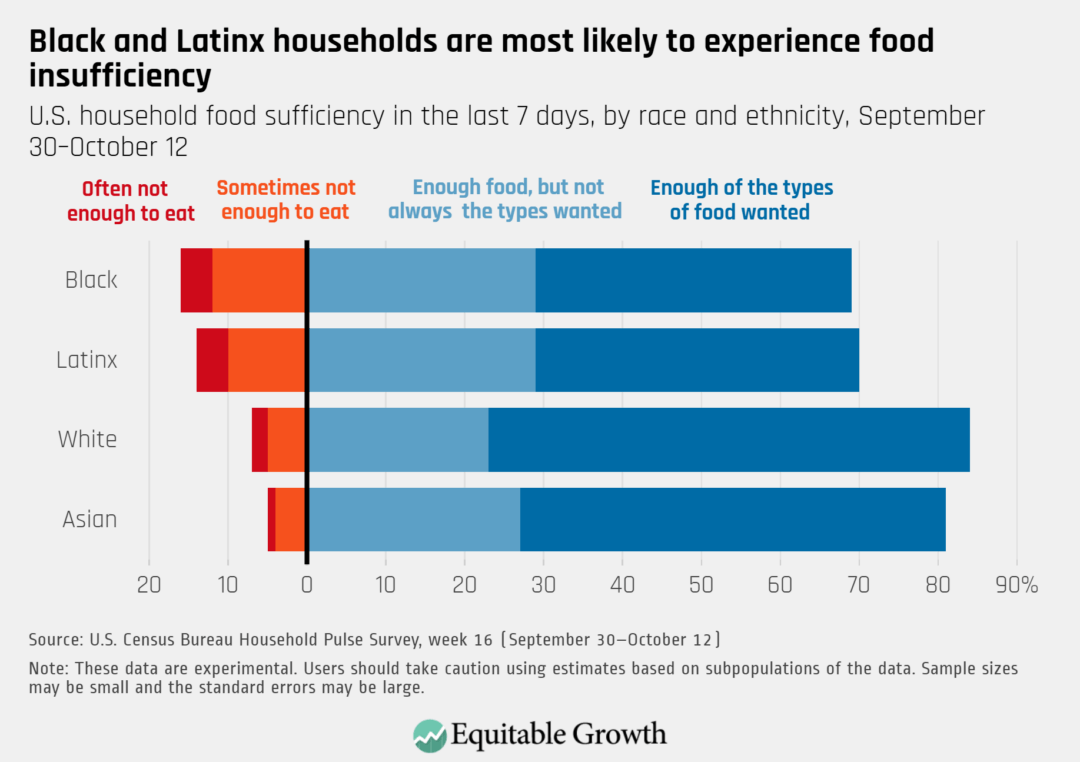
Food insecurity varies significantly by race and ethnicity. Fourteen percent of Latinx households and 16 percent of Black households report not having had enough food to eat in the prior week, compared to 7 percent of White households and 5 percent of Asian households.

U.S. household food sufficiency in the last 7 days, by race and ethnicity, September 30-October 12

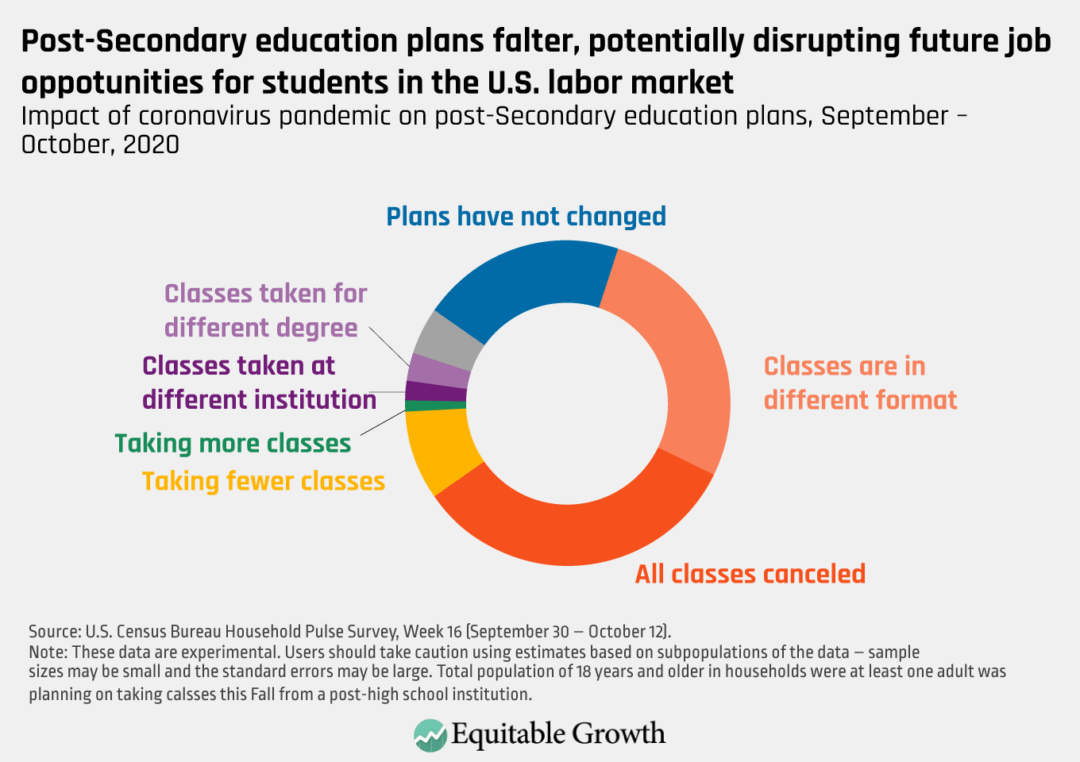
As higher education plans are changed or delayed, those who are delaying education will have fewer options in the U.S. labor market now given high unemployment as well as less opportunity in the future based on credentialism.

Impact of coronavirus pandemic on post-secondary education plans, September–October, 2020

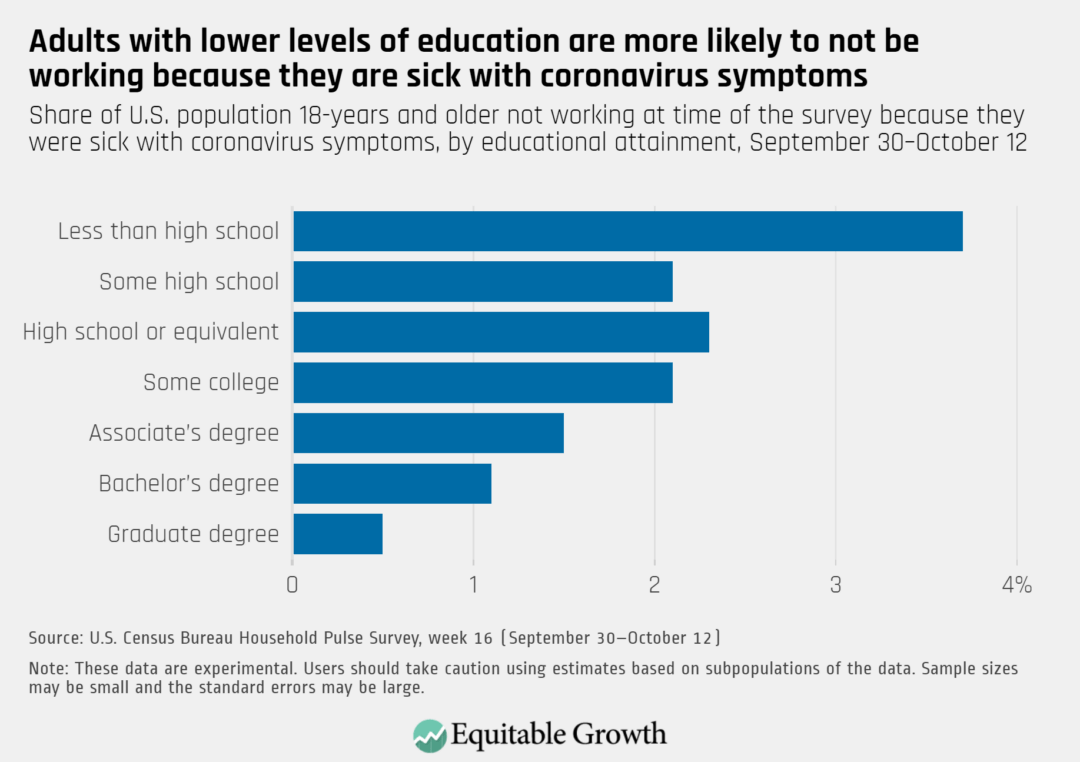
The spread of the coronavirus has impacted the employment of workers with less than a college degree, more of whom report they are not working due to being sick with coronavirus symptoms compared to those with an associate’s degree or greater.

Share of U.S. population 18-years and older not working at time of survey because they were sick with coronavirus symptoms, by educational attainment, September 30-October 12

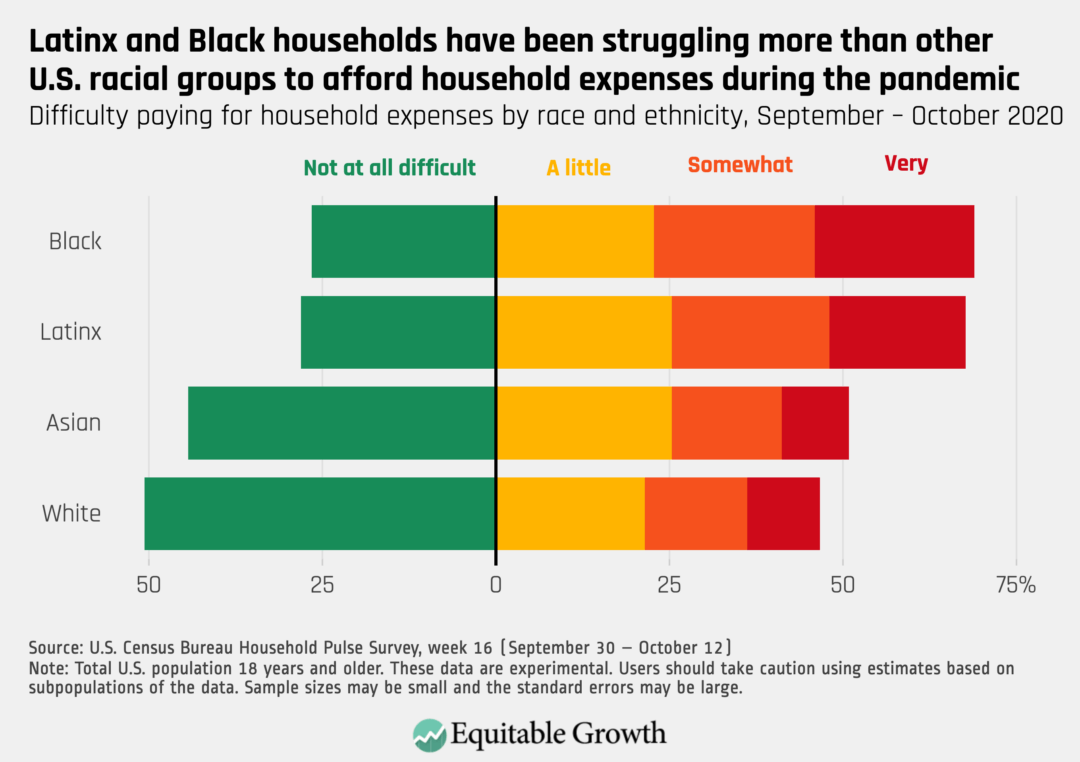
More than half of all households reported having difficulty affording household expenses over the past month, with more than two-thirds of Latinx and Black households reported having difficulty with expenses.

Difficulty paying for household expenses by race and ethnicity, September-October 2020

More than half of Latinx and Black respondents report experiencing losses to their employment incomes since the start of the coronavirus recession, with more than one-fifth of all respondents saying they expect to lose income over the next four weeks.

U.S. respondents experiencing and expecting loss of employment income since March 13, 2020, by race and ethnicity

Equitable Growth’s Household Pulse graphs: September 16–28 Edition

On October 7, the U.S. Census Bureau released new data on the effects of the coronavirus pandemic on workers and households. Below are five graphs compiled by Equitable Growth staff highlighting important trends in the data.

While continued progress on extending economic relief has stalled, a majority of Black and Latinx households reported having difficulty paying household expenses as of the last two weeks of September.

Difficulty paying for household expenses by race, September 16–28, 2020

Job losses are concentrated among low- and middle-income workers, who are much less likely to be employed compared to high-income workers as of the end of September.

Share of respondents reporting being employed in the last 7 days, by 2019 U.S. household icome

One-quarter of Latinx workers and 28 percent of Black workers who have applied for Unemployment Insurance have not received benefits since the start of the Coronavirus Recession.

Percent of U.S. applicants actually receiving Unemployment Insurance benefits since March 13, 2020, by race and ethnicity

More than half of Latinx and Black survey respondents reported they have lost income since the beginning of the Coronavirus Recession and roughly a third expect to lose income in the coming month.

U.S. respondents experiencing and expecting loss of employment income since March 13, 2020, by race and ethnicity

Most workers without a college degree are not able to work remotely from the safety of their homes, exacerbating the polarization of job quality by education level.

U.S. respondents who have been able to substitute some or all of their typical in-person work with telework, by educational attainment between September 16-29, 2020

Equitable Growth’s household pulse graphs: September 2–14 edition

On September 23, the U.S. Census Bureau released new data on the effects of the coronavirus pandemic on workers and households. Below are four graphs compiled by Equitable Growth staff highlighting important trends in the data.

For the period of September 2–14, more than 50 percent of respondents in households making less than $50,000 reported having experienced loss of employment income since March 13.

The number of workers filing for Unemployment Insurance benefits remains staggeringly high. Out of the major racial or ethnic groups, Black applicants are the least likely to have received benefits.

Percent of applicants receiving Unemployment Insurance benefits since March 13, by race and ethnicity

Nearly a quarter of Latinx, Black, and Asian respondents are behind on rent payments. Additionally, Black respondents are struggling to keep up with mortgage payments.

Currently caught up on rent and mortgage, by race and ethnicity

This recession also is hitting those with lower levels of education the hardest. More than half of those without a high school degree report having a somewhat or very difficult time paying for usual household expenses.

Difficulty paying for usual household expenses, by educational attainment

What have we learned about geographic cross-sectional fiscal multipliers?

The limits of monetary policy during the Great Recession pushed fiscal policy back to the forefront of macroeconomic policy discussions in the United States. Yet empirical estimates of the effects of fiscal policy vary. Two main challenges dominate economic thinking. First, fiscal policy can respond to a changing economic trajectory, as when the American Recovery and Reinvestment Act of 2009 increased spending precisely because unemployment was already rising. Second, changes in spending often coincide with changes in taxes or other policies. Both challenges mean that the naïve relationship between government spending and subsequent outcomes may not measure the true causal impact.

The past several years delivered up a wave of new research using geographic variation in spending to better understand the employment and output effects of fiscal policy. By definition, a geographic cross-sectional fiscal multiplier uses variation in fiscal policy across distinct geographic areas within a single period of time to measure the effect of an increase in spending in one region in a monetary union. This cross-sectional approach has the advantage of identifying much greater variation in policy across space than over time, and variation more plausibly exogenous with respect to the no-intervention paths of outcome variables.

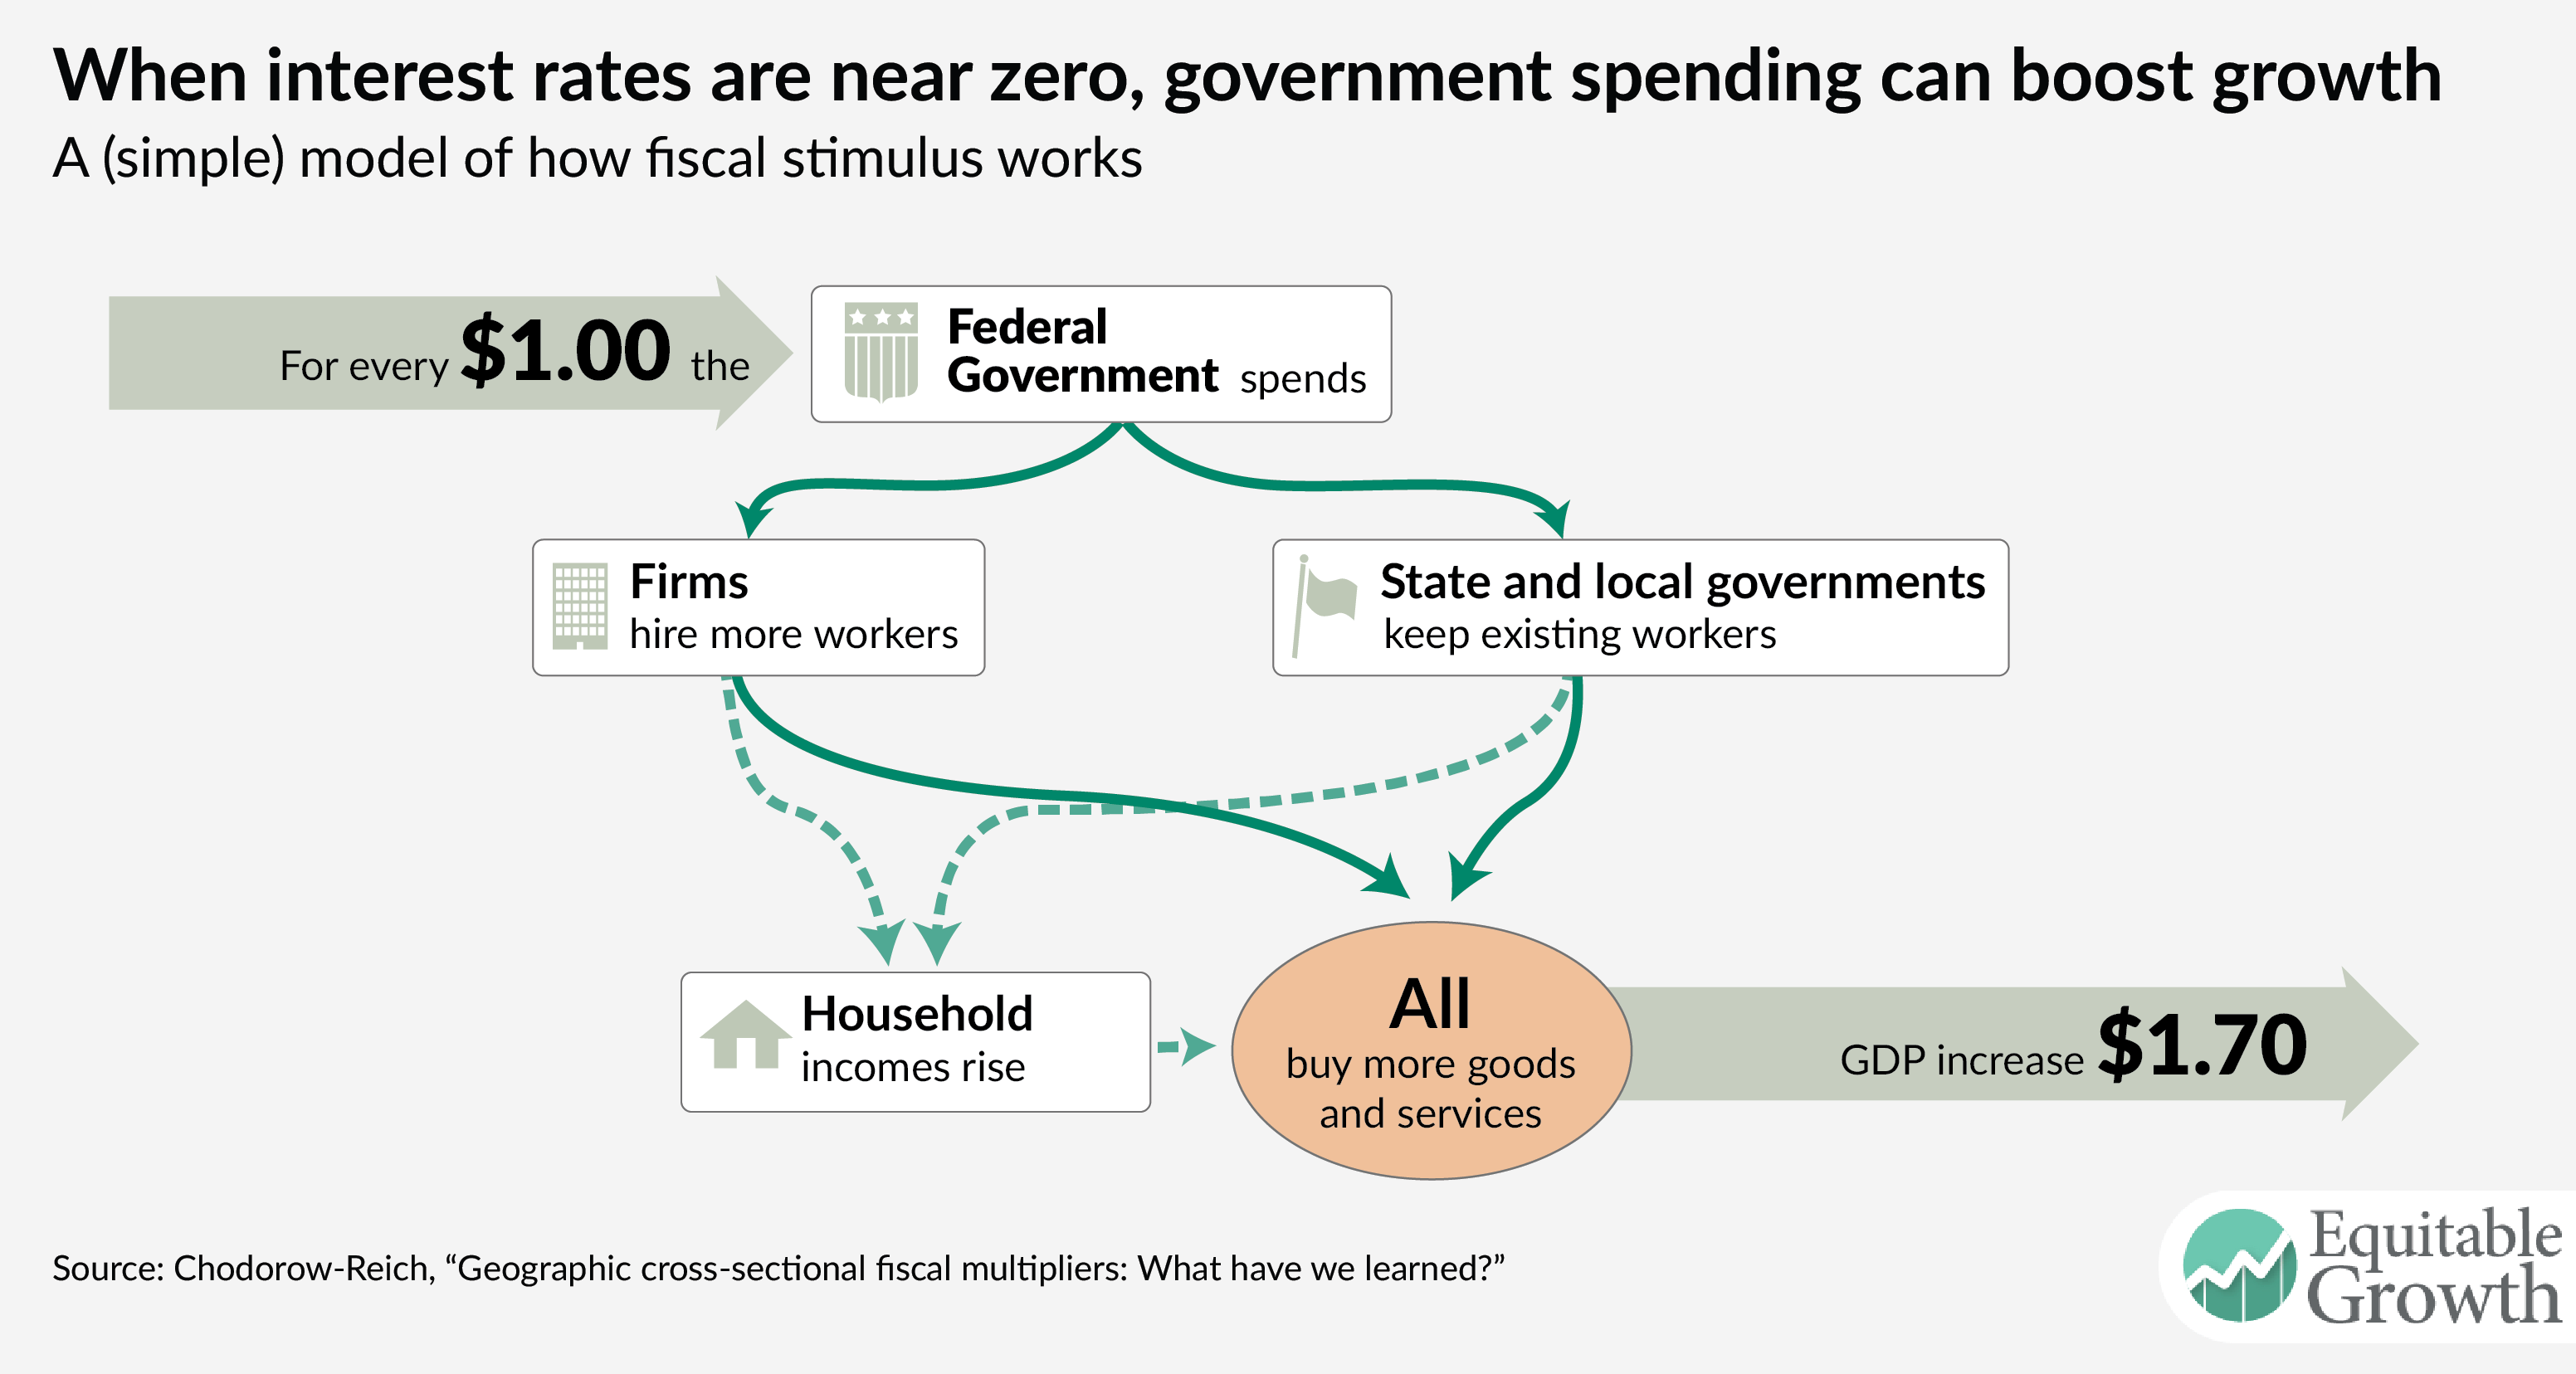
In a new review paper, I assess what we have learned from this research wave. I conclude the cross-sectional evidence implies a national multiplier of about 1.7 or above when monetary policy is constrained. This magnitude falls at the upper end of the range suggested by earlier studies using time series variation only, and suggests that fiscal policy can play an important role in the management of business cycles when monetary policy has reached its limits. (See Figure 1.)

Figure 1

An example based on three papers studying the effects of the Recovery and Reinvestment Act makes clear the meaning of a cross-sectional multiplier. These papers exploit variation in the non-discretionary, formulaic component of the distribution of ARRA funds, due to factors such as pre-recession Medicaid spending or the number of lane miles of federal highway. I combine the spending variation in the three studies and use updated employment data and new state output data to estimate cross-sectional instrumental variable regressions of the cumulative increase in employment and output during 2009 and 2010 as a function of ARRA spending in a state. I find a cross-sectional “cost per job” of roughly $50,000 and output multiplier of roughly 1.75.

A review of the recent empirical literature broadly confirms the lessons from this example. One strand of this literature examines various components of the Recovery Act. The cost-per-job across these studies ranges from roughly $25,000 to $125,000, with around $50,000 emerging as a preferred number. Using a production-function approach, this magnitude translates loosely into an output multiplier of about 2. Another set of recent papers uses variation from historical episodes or other countries, many quite creatively. The diversity of outcome variables and policy experiments makes reaching a synthesized conclusion across these studies harder. Nonetheless, those papers that estimate a cost-per-job find numbers of around $30,000, and (with one or two notable exceptions) those which estimate income or output multipliers find numbers in the range of 1.0 to 2.5.

Research into the mapping between cross-sectional multipliers and national multipliers also has advanced. Three main differences can arise, depending on who pays for the spending, what monetary policy does, and the different openness of regions and the country as a whole.

Starting with the first, in many cross-sectional multiplier studies the spending does not affect the present value of local tax burdens, for example, because the spending is paid for by the federal government. Standard economic theory, however, suggests that such outside financing can have a small effect on local output. Fully rational, forward-looking, liquidity unconstrained households (sometimes denoted as so called “Ricardian agents”) will increase their private spending by only the annuity value of the outside transfer, which for transitory spending implies a small increase relative to the direct change in government purchases, while spending by fully “rule-of-thumb” or “liquidity-constrained” agents does not depend at all on the present value of the tax burden. In either case, the fact that the financing of the spending comes from outside the region adds little to the local private-spending response.

Monetary tightening in response to higher spending may reduce the output impact. Therefore, cross-sectional multipliers best help to characterize national multipliers when monetary policy is constrained, for example, by a zero lower bound on interest rates. Finally, expenditure switching and import leakage exert a downward influence on regional multipliers relative to the aggregate multiplier.

Combining these three arguments, the cross-sectional multiplier offers a rough lower bound for a national multiplier as long as the spending is relatively transient and monetary policy is constrained. These conditions appear likely to hold in many empirical settings, including during the implementation of the Recovery Act.

Combining the empirical evidence and the recent theory, the cross-sectional studies suggest a closed economy, constrained monetary policy, deficit-financed multiplier of about 1.7 or above.  This magnitude falls at the upper end of the range suggested by earlier studies using time series variation only.

The cross-sectional literature and my review essay have focused their attention most on understanding what cross-sectional multipliers imply about national multipliers. Other lessons also emerge. Foremost, many of the cross-sectional studies test for and find evidence of higher multipliers or less crowd-out in regions and periods with more unused resources. These results suggest multipliers may be larger during downturns and for reasons beyond constraints on monetary policy.

I conclude this summary with a comment on research practices. In the wake of the Great Recession of 2007-09, many have criticized the economics profession and macroeconomists in particular. The foray into cross-sectional multipliers offers a positive example of economists directing their research toward understanding newly relevant policy levers. Necessarily, the effort involved both empirical and theoretical advances. As a result, I believe we have a better grasp of the efficacy of fiscal policy than we did before the Great Recession started.

— Gabriel Chodorow-Reich is an assistant professor of economics at Harvard University. His research focuses on macroeconomics, finance, and labor markets. His working paper upon which this column is drawn can be found here.

Are we better off than our parents?

The data that underscores the fading “American dream”

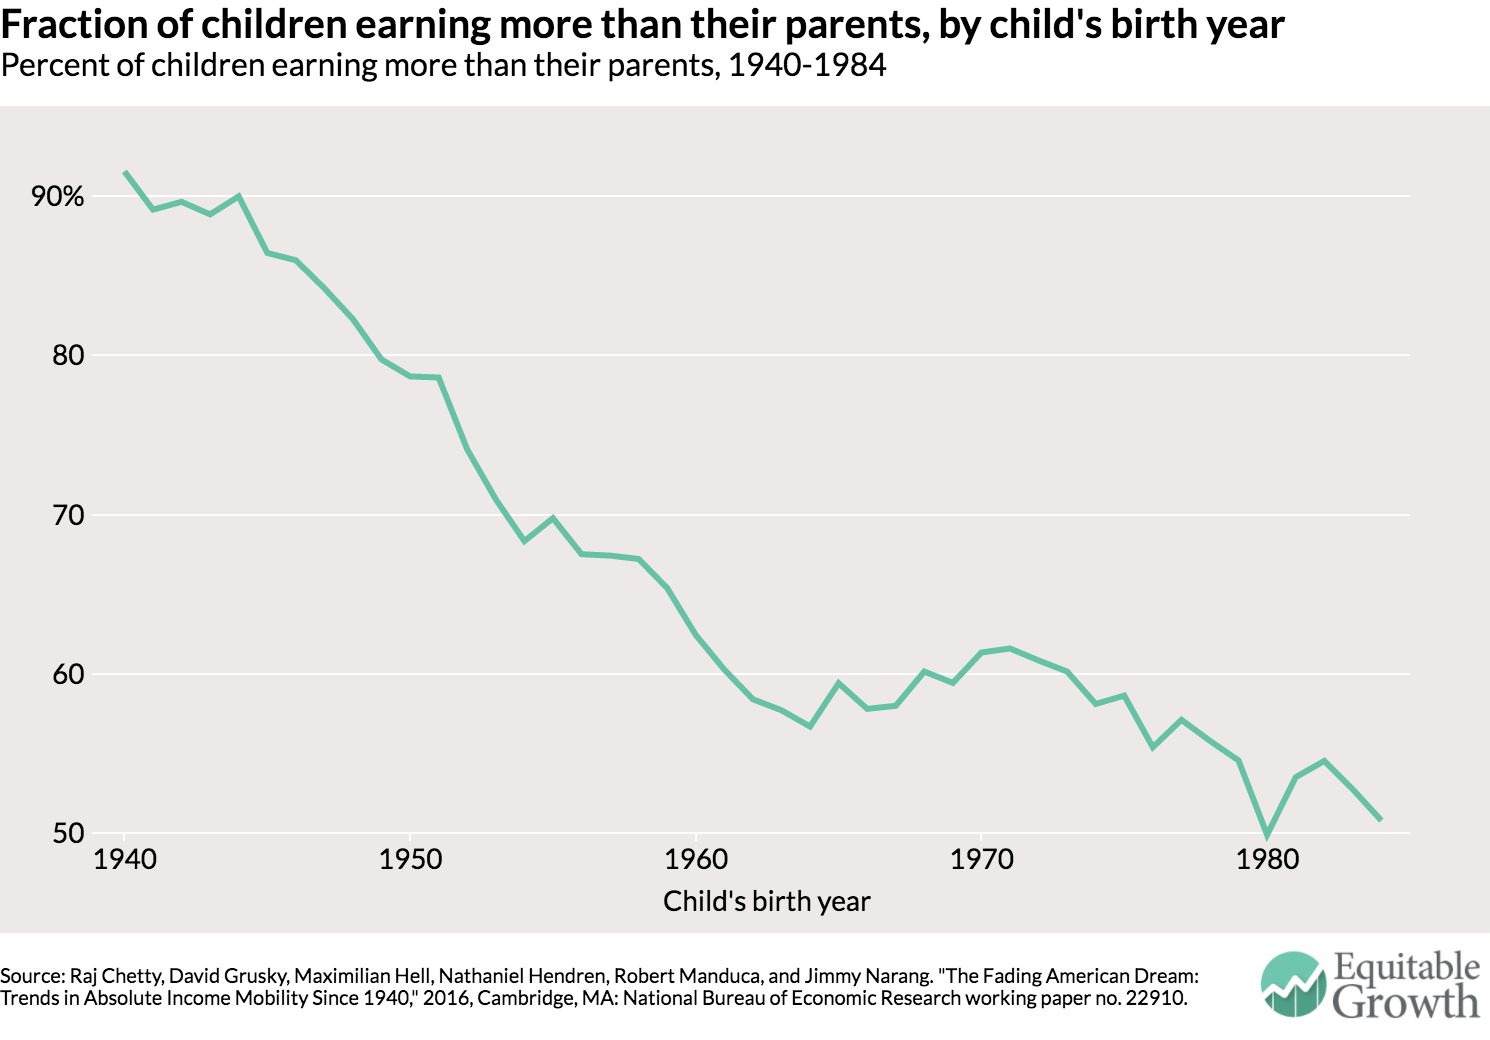
Every parent hopes that their children will have a better standard of living than their own: it is a defining feature of the American Dream. Yet this opportunity is fading for many Americans. New research by Raj Chetty, David Grusky, and Maximillian Hell (Stanford University), Nathaniel Hendren and Robert Manduca (Harvard University), and Jimmy Narang (University of California-Berkeley) shows that “absolute income mobility”—the fraction of children that are earning more than their parents—has declined over the past half century due to rising inequality. Here are some key facts from their analysis.1

Download File
The-fading-American-dream

Read the PDF in your browser

Absolute income mobility has declined for Americans across the entire income spectrum

Rates of absolute income mobility in the United States have fallen sharply since 1940. Ninety-two percent of children born in 1940 earned more than their parents in inflation-adjusted terms. In contrast, only 50 percent of children born in 1984 earned more than their parents. (See Figure 1.) The downward trend in absolute mobility persists when using alternate inflation adjustments, accounting for taxes and transfers, measuring income at later ages, and adjusting for changes in household size.

Figure 1

The middle class saw the largest rate of decline. Absolute income mobility fell across the entire income spectrum, but the middle class experienced the largest declines in the likelihood of children earning more than their parents.

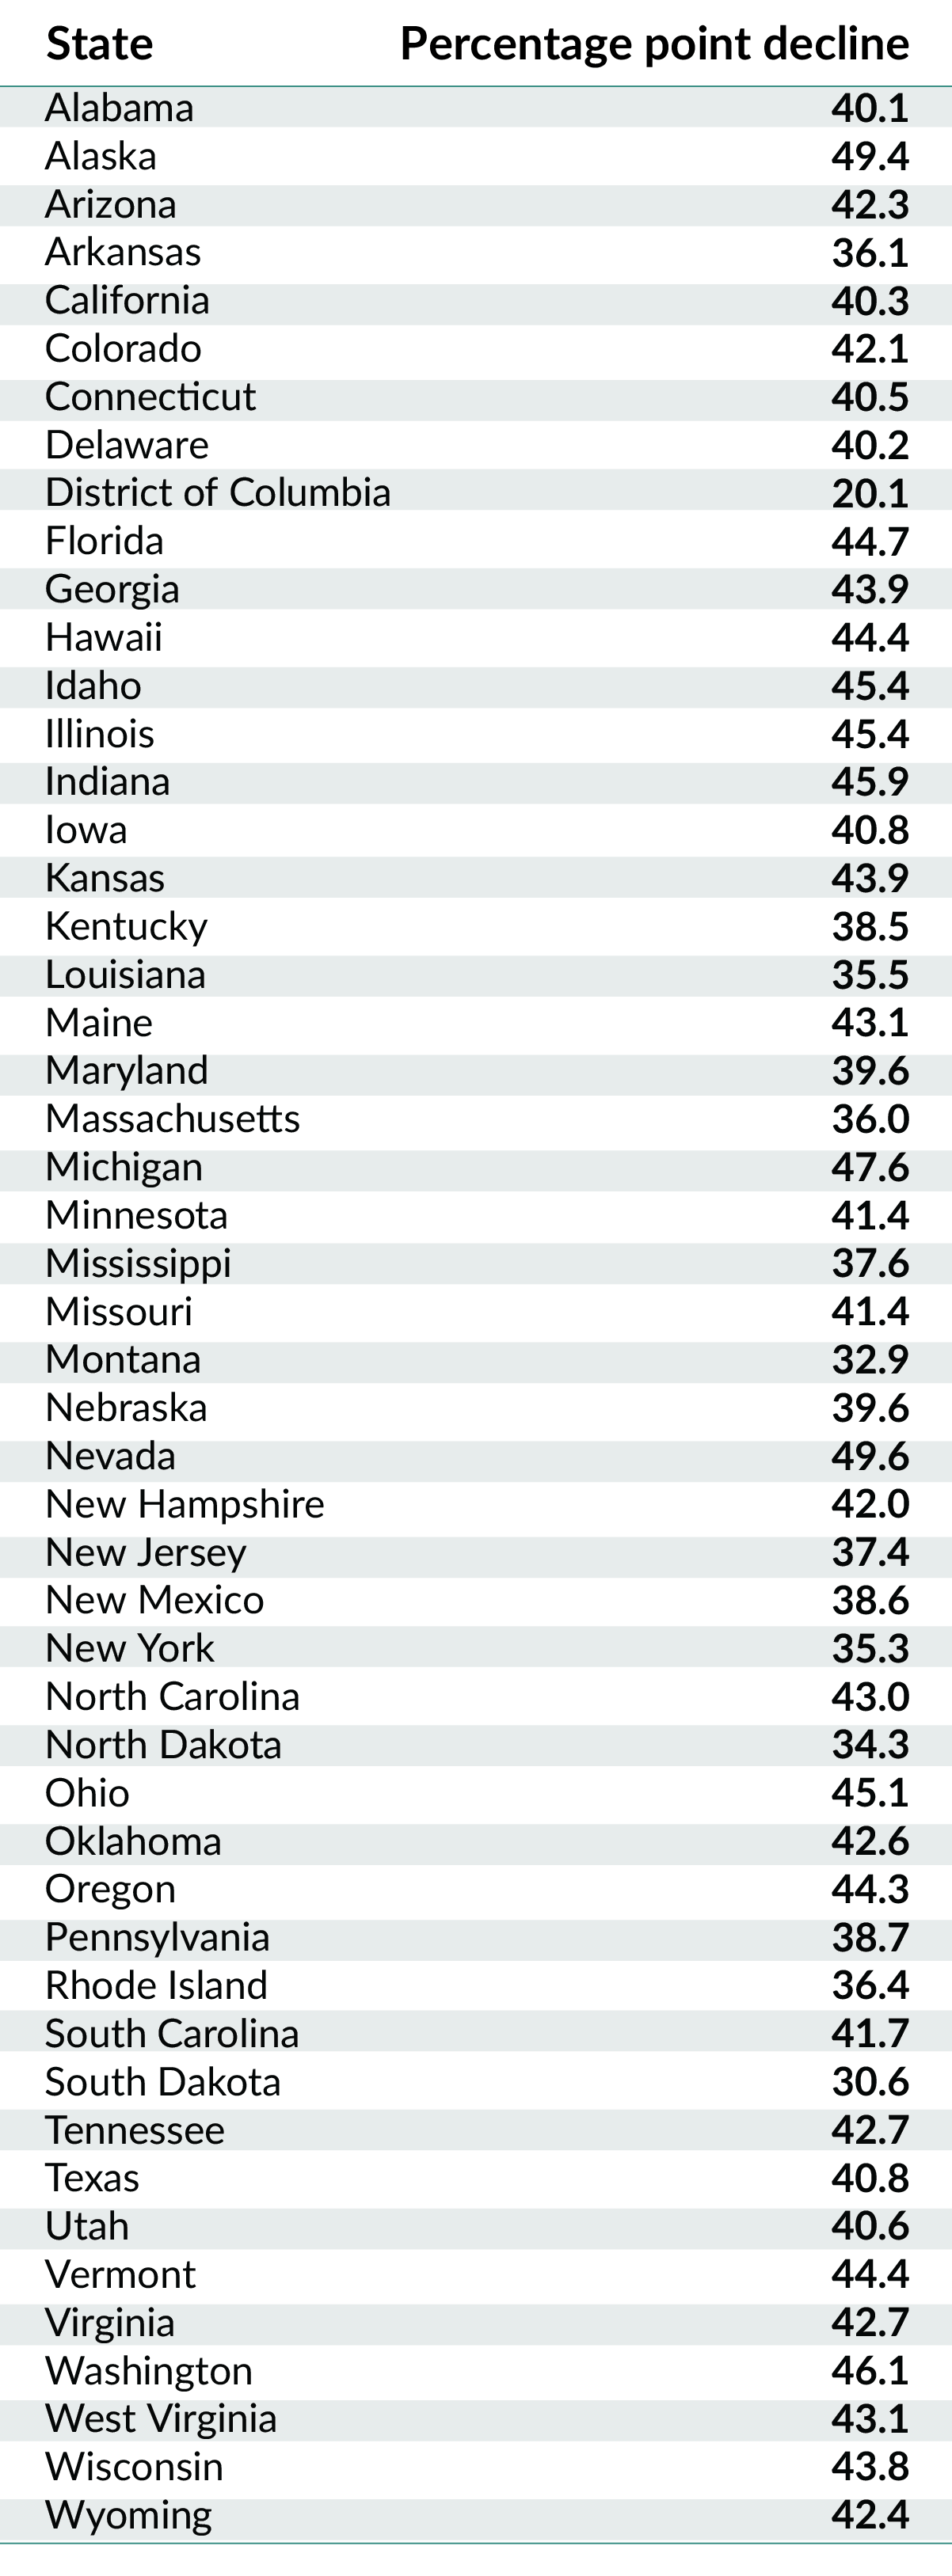
The largest declines are concentrated in Rust Belt states. Absolute income mobility fell in all 50 states and the District of Columbia, but the largest declines were concentrated in the Rust Belt states, such as Michigan and Indiana (which registered 49 and 46 percentage-point declines, respectively). The smallest declines occurred in Massachusetts, New York, and Montana, which recorded absolute mobility declines of approximately 35 percentage points. (See Figure 2 and table, below.)

Figure 2

Men’s economic prospects declined dramatically. Ninety-five percent of men born in 1940 earned more than their fathers compared to 41 percent in 1984 (a 54 percentage-point decline). The fraction of daughters earning more than their fathers fell from 43 percent of women born in 1940 to 26 percent of women born in 1984.

In order to revive the American dream, we must address inequality

The decline in absolute mobility is driven by inequality and the unequal distribution of economic growth. Children born in 1980 experienced lower growth in gross domestic product, the broadest measure of economic growth, compared to those in the 1940s and 1950s, but the authors find that the decline is absolute income mobility was driven primarily by the increasingly unequal distribution of GDP growth rather than by the slowdown in aggregate economic growth.

Higher growth rates alone are insufficient to restore absolute mobility. Because a large fraction of economic growth goes to a smaller fraction of high-income households today compared to the 1940s and 1950s, higher GDP growth does not automatically increase the number of children who earn more than their parents.

  • Restoring GDP growth rates to the levels experienced in the 1940s and 1950s while distributing GDP across income groups as it is distributed today (much more unequally) would increase the likelihood of children earning more than their parents to only 62 percent, reversing less than one-third of the reduction in mobility relative to what in was for children born in 1940 (92 percent).
  • Maintaining GDP growth at its current level but distributing it as it was distributed for children born in the 1940s would increase the likelihood that children earn more than their parents to 80 percent, thereby reversing more than two-thirds of the decline in absolute mobility.

    A Child Tax Credit primer

    The analysis “A Child Tax Credit primer” contained errors that had been identified by Equitable Growth. Before the errors could be corrected, Congress enacted major tax legislation that substantially changed the policies discussed in the piece. As a result, Equitable Growth no longer plans to post a corrected version of the analysis and has removed the original.


    Equitable Growth in Conversation: an interview with the OECD’s Stefano Scarpetta


    “Equitable Growth in Conversation” is a recurring series where we talk with economists and other social scientists to help us better understand whether and how economic inequality affects economic growth and stability.
    In this installment, Equitable Growth’s executive director and chief economist Heather Boushey talks with Stefano Scarpetta, the Director of Employment, Labour and Social Affairs at the Organisation for Economic Cooperation and Development in Paris, about how high levels of inequality are affecting economic growth in the organization’s 35 member countries and possible policy responses.

    Read their conversation below

    Heather Boushey: The OECD has been doing really interesting work over the past few years looking at how and whether inequality affects macroeconomic outcomes or outcomes more generally. A lot of questions are circling around the report that came out last year titled “In It Together: Why Less Inequality Benefits All.” One thing that really strikes me is that inequality isn’t a unitary phenomenon. It’s not just one thing. You can have inequality increasing at the top of the income spectrum, you can have something happening in the middle, you could have something happen in the bottom. But these are different trends and they may affect economic growth and stability in different ways because of their effects on people or on consumption or on what have you. That’s one of the things that I really enjoyed about that OECD report is that you used multiple measures of inequality; you didn’t just stick with one. So, I wondered if you could talk a little bit about that.

    Stefano Scarpetta: Sure. Some indicators of income inequality, such as the Gini coefficient, of course don’t tell us exactly what’s happening with different income groups. So, much of the work we have done at the OECD is to look at the income performance of different groups along the distribution. And one of the findings that is emerging, not just in the United States but also across a wide range of advanced and emerging economies, is that income for those at the top 10 percent, and in many cases actually the top one percent, has been growing very rapidly. At the same time the income of those on the bottom—not only the bottom 10 percent but actually sometimes the bottom 40 percent—has been dragging, if not declining, in some countries.

    This fairly widespread trend becomes very important when we think about policies to address inequalities, but also when you want to look at the links between inequality and economic growth. As you know, there are at least two broad strands of theory about the links between inequality and growth. A traditional theory focuses on economic incentives. Some inequality, especially in the upper part of the distribution, is needed to provide the right incentives for people to take risk, to invest, and innovate.  An alternative theory instead focuses on missing opportunities associated with high inequality: it focuses more on the bottom part of the distribution, and stresses that high inequality might actually prevent those at the bottom of the distribution from investing in, say, human capital or health, thus hindering long-term growth..

    We have done empirical work looking at the links between inequality and economic growth.  This is very difficult, and though we have used some state-of-the-art economic techniques, we still have a number of limitations. We have looked at 30 years of data across a wide range of OECD countries. And basically, the bottom line of this analysis is that there seems to be clear evidence that when inequality basically affect the bottom 40 percent [of the income distribution], then this leads to lower economic growth. These results are fairly robust, but what’s the mechanism behind this effect? That’s what we’ve been doing as well.

    Potentially there are different types of mechanisms. We have investigated one of them in particular: the reduced opportunities that people in the bottom part of income distribution have to invest in their human capital in high-unequal countries. The OECD has coordinated the Adult Skills Survey, which assesses the actual competencies of adults between the ages of 16 and 65 in 24 countries along three main foundation skills: literacy, numeracy and problem solving. Thus the survey goes beyond the qualification of individuals and allows us to link actual competencies with their labor market status. The survey actually measures what people can do over and above their qualifications. Then we looked at whether educational outcomes, not only in terms of qualifications but also actual competencies, are related to the socioeconomic backgrounds of the individuals themselves, and also whether the relationship between the socioeconomic backgrounds of individuals and the education outcomes vary depending on whether the individuals live in low- or high-inequality countries.

    What emerges very clearly from the data—and these are micro data of a representative sample of 24 countries—is that there is always a significant difference or gap in the educational  achievement of individuals, depending on their socioeconomic background.  So individuals coming from low socioeconomic backgrounds tend to have worse outcomes whether we measure them in terms of qualifications, or even more importantly in terms of actual competencies — actual skills, if you like. The interesting result is that the gap tends to increase dramatically when we move from a low-inequality to a high-inequality country. The gap tends to be much, much bigger. The difference in the gap between those with intermediate or median socioeconomic backgrounds and those with high socioeconomic backgrounds is fairly stable across the income distribution level of inequality of these countries. But when we look at the highly unequal countries there is a drop, particularly among those coming from low socioeconomic backgrounds

    One way to interpret this is that if you come from a low socioeconomic background, your chances of achieving a good level of education are lower. But if you are in a high-unequal country, the gap tends to be much, much larger compared to those coming from an intermediate or high socioeconomic background. And the reason is that in high-unequal countries it’s much more difficult for those in the bottom 10 percent —and indeed the bottom 40 percent— to invest enough in high-quality education and skills.

    HB: That’s very consistent with research by [Stanford University economist] Raj Chetty and his coauthors in the United States on economic mobility, noting in U.S. parlance that the rungs of the ladder have become farther and farther apart. Would you say that these are consistent findings? One thing inequality does is it makes it harder to get to that next rung for folks at the bottom or even the mid-bottom of the ladder.

    SS: Precisely, that’s exactly the point. The comparisons of the gap in educational achievements between individuals from different socio-economic backgrounds across the inequality spectrum suggest that the gap widens when you move from qualifications to actual competencies. So, basically, it’s not just a question of reaching a certain level of education, but actually the quality of the educational outcomes you get. In highly unequal countries, people have difficulty not only getting to a tertiary level of education, but also accessing the quality of the education they need, which shows very clearly in terms of what they can do in terms of literacy, numeracy and problem solving. So, yes, high inequality prevents the bottom 40 percent from investing enough in human capital, not only in terms of the number of years of education, but also in terms of acquiring the foundation skills because of the adverse selection into lower quality education institutions and training.

    HB: I want to step back just for a moment. To summarize, it sounds like the research that you all have done finds that these measures of inequality are leaving behind people at the bottom and that affects growth. Is there anything in your findings that talked about those at the very top, the pulling apart of that top 1 percent or the very, very top 0.1 percent? What did your research show for those at the very top?

    SS: It’s well known that the top one percent, actually the top 0.1 percent, are really having a much, much stronger rate of income growth than everybody else. This takes place in a wide range of countries, not to the same extent, but certainly it takes place.

    The other descriptive finding we have is that for the first time in a fairly large range of OECD countries, we have comparable data on the distribution of wealth, not just the distribution of income. And what that shows is that there is much wider dispersion of the distribution of wealth, which actually feeds back into our discussion about investment in education because what matters is not just the level of income, but actually the wealth of different individuals and households.

    Just to give you a few statistics: in the United States the top 10 percent has about 30 percent of all disposable income, but they’ve got 76 percent of the wealth. In the OECD, on average, you’re talking about going from 25 percent of income to 50 percent of wealth. So, basically, the distribution of wealth adds up to create a deep divide between those at the top and those at the bottom. The interesting thing is that there are differences in the cross-country distribution of income and wealth. Countries that are more unequal in terms of income are not necessarily more unequal in terms of distribution of wealth. The United States is certainly a country that combines both, but there are a number of European countries, such as Germany or the Netherlands, that tend to be fairly egalitarian in terms of distribution of income, but much less so when you look at distribution of wealth.

    I think that going forward, research has to take the wealth dimension into account because a number of decisions made by individuals rely of course on the flows of income, but also in terms of the underlining stock of wealth that is available to them.

    Going back to your question: the fact that the top 10 percent is growing much more rapidly does not necessarily have negative impact on economic growth. What really matters is the bottom 40 percent, which as I said before justifies our focus on opportunities and therefore on education. And the work we are doing now at the OECD extends our analysis to look at access to quality health services. My presumption is that individuals in the bottom 40 percent, especially in some countries, might be not as able as others to access quality health. And therefore, this also affects the link between health, productivity, labor market performance, and so on. This might also be an effect that becomes a drag on economic growth altogether.

    HB:  One really striking finding that really struck me in the OECD report, as an economist who focuses on policy issues, is that your analysis doesn’t conclude the policy solutions are really in the tax-and-transfer system. As you’ve already said, it’s really thinking about education, perhaps educational quality, health quality—things that might be a little bit harder to measure in terms of the effectiveness of government in some ways.  After all, it’s easier to know exactly how much of a tax credit you’re giving someone versus the quality of a school or health outcome. You can certainly measure these outcomes, but it’s more challenging. It seems to me that a lot of the conclusions of this research are that it’s not enough to focus on taxes and transfers, but rather that we have to focus on these things that are harder, in the areas of education and health outcomes, focusing on people and people’s development. Would that be a fair assessment of the emphasis that this research is leading you to?

    SS: To some extent, because I think both are important. Let me try to explain why. The first point is that more focus should indeed go into providing access to opportunities. And these are not just the standard indicators of how much countries spend on public and private education and health, but actually how people in different parts of the distribution have access to these services, and the quality of the services they receive. So I think the focus should be on promoting more equal access to opportunities, which means going beyond looking at access and quality of the services that individuals receive, especially those from the bottom 10 percent to the bottom 40 percent of the income distribution. This is much more difficult to measure, but I think we have to consider fundamental investment in human capital. And a lot of the policies should move toward providing more equal access to opportunities, at least in the key areas of education, health, and other key public services.

    Now, the other point is that if you don’t address the inequality of outcomes then you can’t possibly address the inequality of opportunities. In countries in which the income distribution is so unequally distributed it’s difficult to think that individuals, despite public programs, can actually invest enough on their own to have access to the right opportunities. So, the two things are very much linked. By addressing some of the inequality in outcomes, you’re also able to promote better access to opportunity for individuals. So, I think it’s really working on both sides.

    We are not the only ones who have been arguing for years that the redistribution effort of countries has diminished over time. It has diminished over the past three decades because of the decline in the progressivity of income taxes and because the transfer system in general has declined in terms of the overall level, even though some programs have become more targeted. But we’re not necessarily saying spend more in terms of redistribution, but spend well in terms of benefit programs. So I think the discussion becomes: Focus more on opportunities, address income inequality because this is a major factor in the lack of access to opportunities, but be very specific in what you do in terms of targeted transfer programs. In particular, focus on programs that have been evaluated and showed that they actually lead to good outcomes.

    HB: I’d also like to talk about gender- and family-friendly policies. I noticed in the report that you talked a lot about the importance of reducing gender inequality on overall family inequality outcomes but also on the opportunity piece. Could you talk a little bit about the importance of these in terms of the research that you found?

    SS:  One of the most interesting results of our analysis in terms of the counteracting factors of the trend increase in income inequality across the wide range of OECD countries—including a number of the key emerging economies—has been the reduction in the gender gaps. The greater participation of women in the labor market has certainly helped to partially, but not totally, alleviate the trend increase in market income inequality. But as we know, there are gender gaps not only in labor market participation, but increasingly also in the quality of jobs that women have access to compared to men. Depending on the country, of course, there are large differences.

    In that context, I’m very glad we have been supporting the Group of 20 Australian presidency in 2014, which brought a gender target into the forum of the G-20 leaders. Now, they have committed to reducing the gender gap in labor force participation by 25 percent by 2025. It’s only one step into the process, but I think it’s an important signal. We at the OECD also have the “Gender Recommendation,” a specific set of policy principles that all OECD countries have engaged in, with a fairly ambitious agenda on gender equality, focusing on education, labor markets, and also entrepreneurship.

    Ensuring greater participation of women in the labor market remains a very important objective, but looking more into the quality of jobs that women have access to, and making sure that policy can facilitate women entering the labor market and also having a career is very important. And also allowing women to reconcile work responsibility with family responsibility. In that context, what we are doing perhaps more than in the past is looking not only at what women should be doing or have to do, but also at what men can do and should do. At the OECD, for example, we are looking specifically at paternity leave, because many of the decisions at the household level are taken jointly by the father and the mother. And I think while we have made some progress in changing the behavior of mothers, much remains to be done to also change the behavior of fathers.

    We are looking at some of the interesting policies that a number of countries are implementing to promote paternity leave, for example by reserving part of the parental leave only to the father. Either the father takes the leave or it is not given to the household. And there are a number of interesting results. Some countries, such as Germany, have reserved part of the parental leave going to the father and have been able to increase the number of fathers who take parental leave by a significant proportion. Again, the focus should certainly be on all the different dimensions of inequality, including gender inequality, in the labor market, but also look at the interactions of individual behaviors of men and women and those of the companies in which they work. We are doing interesting research in the case of two countries that have very generous paternity leave, Japan and South Korea: 52 weeks. Yet, only 3 percent of the fathers take paternity leave. For male workers in these countries, absence from work because of family reasons is perceived to be a lack of commitment to the firm and employer and thus may have a negative impact on their careers; not surprisingly only a few men actually take paternity leave.

    HB: One thing I know from my own research is that United States, of course, is different in that we tie in the states that have family leave, such as California, New Jersey, and Rhode Island, with New York soon implementing it, to our federal unpaid family and medical leave, which is 12 weeks of unpaid leave and which covers about 60 percent of the labor force. At both the state and federal level, the leave is tied to the worker. So, we already have a “use it or lose it” policy in place. So for children who are born to parents California, both the mother and the father have an equal amount of leave, but if dad doesn’t take it then the family doesn’t get it.

    We’ve seen from research that once the leave was paid; men are increasingly taking it up. If the OECD hasn’t been looking at this in a cross-national comparative way, it might be an interesting case study or research project that I’ll just put out there in terms of how the United States has done. That’s the only thing that we’ve done right on paid leave vis-a-vis other OECD countries.

    My last question here. Going back to the beginning of our conversation, the OECD research found that the rise of inequality between 1985 and 2005 in 19 countries knocked 4.7 percentage points off of cumulative economic growth between 1990 and 2010. That’s a big deal. The policy issues that we’ve been talking about are wide-ranging and possibly expensive, but also very important, it seems, for economic growth.

    From where you sit in Paris at the OECD, are you seeing policymakers both at the OECD but also in member countries that you work with, really taking this research seriously? And are there any big questions that you think an organization like the Washington Center for Equitable Growth should be asking in our research to help show people what the evidence says? Are there sort of big questions that policymakers say, “Oh, I’ve seen this report, Stefano, but I don’t believe this piece of it.” Are there any avenues that you think we need to pursue where people are perhaps a little bit more skeptical if they’re not taking it as seriously as this research implies?

    SS: These are all extremely relevant and very good questions, Heather. Let me start with the first point you raised; over a 30-year period, and across a wide range of OECD countries, high and increasing inequality has knocked down economic growth. Obviously this is not the last word and further research is needed. As we discussed, the identification of the effect and the links are not straightforward. We have used what we think is the best state-of-the-art economic techniques, but of course it’s not the last word. It would certainly help to work along these lines with a number of researchers to gather more evidence.

    But it also is important for researchers to look at the channels through which increasing high levels of inequality might be detrimental for growth: namely by under-investment in broadly-defined human capital of the bottom 40 percent and therefore long-term economic growth. I think this is certainly an area in which there is a lot of scope for doing more work. In particular, there’s a lot of space for doing serious micro-based analysis looking at the extent to which individuals with low socioeconomic backgrounds actually have difficulties investing in quality education, quality human capital, and other areas.

    Now, in terms of the work we have done— and the work that was done also by the International Monetary Fund and others— I think we are contributing somewhat to changing the narrative about inequality. For decades, there was a field of research on the economics of inequality, but this was largely confined to addressing inequality for social cohesion —for social reasons. We hope that now we have brought the issue of growing inequality toward the center of policymaking because inequality might be detrimental to economic growth, per se. So, even if you just want to pursue economic growth, you might want to be careful about increasing income inequality in your country.

    We are not there yet, but I think there are a number of signals that indicate growing dissatisfaction in many countries, at least in part be driven by the fact that people don’t see the benefits [of economic growth] even amid a recovery. One of the more clear signals is that now the issue of inequality is discussed more openly in our meetings with colleagues from the fianance and economy ministries. In fact, the broad economic framework we’re now using at the OECD is inclusive growth. I would say that these are not things that would have been possible a decade ago. There is now a fairly consistent narrative around the need to pursue inclusive growth. And there is a strong focus on employment and social protection, and on investments in human capital.

    I think the research community really needs to feed this discourse. There might be still some temptation as soon as economic growth resumes to revert back to traditional economic growth focus. And because there are a lot of fears and concerns about secular stagnation, the thinking could focus on growth because we need growth back, and we will deal with the distribution of the benefits of growth at a later stage. But, we should really have a comprehensive strategy that fosters a process of economic growth that is sustainable and deals with some of the underlining drivers of inequality.

    HB: Thank you. And I will note our very first interview for this series “Equitable Growth in Conversation” was with Larry Summers, who actually talked about the importance of attending to inequality if we want to address secular stagnation.

    SS:  Exactly.

    HB: This has been so enormously helpful and so interesting. We here at Equitable Growth really appreciate the work that you all are doing at the OECD and find it incredibly illuminating. Thank you so much for taking the time to talk to us today.

    SS: Thank you, Heather. Thank you very much. It’s been a pleasure.

    Shared responsibility mortgages

    AP Images

    About the authors: Atif Mian is a professor of Economics and Public Affairs at Princeton University and Director of the Julis-Rabinowitz Center for Public Policy and Finance at the Woodrow Wilson School at Princeton University. Amir Sufi is the Bruce Lindsay Professor of Economics and Public Policy at the University of Chicago’s Booth School of Business.

    The mortgages that are predominantly used in U.S. housing finance, and explicitly promoted by the federal government, place an undue amount of risk on families who own their homes. Our main policy recommendation is to encourage the Federal Housing Finance Agency to declare more “equity-like” mortgages as mortgages conforming to the federal government’s securitization guidelines. This would enable these mortgages to be securitized by the federal housing finance giants Fannie Mae and Freddie Mac, which would promote their growth in the home mortgage marketplace.

    The widespread use of such mortgages will protect families from unforeseen downturns in the housing market, and will reduce the painful boom-and-bust episodes that have characterized housing markets in recent years. The economic benefits are large. We believe that the Federal Housing Finance Agency must play a critical role in overseeing and enforcing the use of such equity mortgages.

    Why debt mortgages are problematic

    A home mortgage that currently satisfies the conforming mortgage definition is a standard debt contract, which places a great deal of risk on the homeowner. Suppose a homeowner buys a home for $100,000, using an $80,000 debt mortgage. The homeowner has $20,000 of equity in the home. If house prices drop by 20 percent then the home is worth only $80,000. But the interest payments on the mortgage and the mortgage balance remain the same. House prices fall during economic downturns, which make homeowners less able to pay the mortgage payments. Further, if the homeowner sells the home for the new price of $80,000 then the homeowner must pay the $80,000 mortgage and is left with nothing. The homeowner loses 100 percent of her equity even though house prices dropped only 20 percent.

    This is the effect of debt. Debt contracts force losses on the homeowner before the lender bears any loss. This makes no economic sense. The average homeowner in the United States is far less able to bear house-price risk than the investors putting money into the financial system. The use of debt contracts means homeowners are bearing this risk when it would be far better for investors to bear that risk.

    Delivering equitable growth

    Previous article: Monetary policy, Alan Blinder
    Next article: Geography of economic inequality, Kendra Bischoff

    In our 2014 book, “House of Debt: How They (and You) Caused the Great Recession and How We Can Prevent It from Happening Again,”2 we show that the use of debt contracts in housing finance amplifies housing price booms, and makes housing price busts painful for the entire economy. Research shows that severe economic downturns are preceded by mortgage debt-financed housing booms. When house prices fall, the losses are born disproportionately by middle- and low-income homeowners. Further, foreclosures skyrocket, which depresses house prices even for those that continue to pay their mortgage. Homeowners reduce spending dramatically in response to the decline in housing wealth. The sharp drop in consumer spending sends the economy into a tailspin. This cycle explains the Great Depression in the 1930s and the Great Recession of 2007-2009 in the United States as well as the severe economic downturns seen in Ireland and Spain during the previous decade.

    The financial system must overcome its addiction to mortgage debt. By uniquely allowing straight debt mortgages to be securitized by Fannie Mae and Freddie Mac, the federal government encourages the exact type of mortgages that we know are bad for homeowners and the overall economy. The government should instead push for more equity-based mortgages, which would provide relief to the homeowners that most need it in case of a downturn in the housing market.

    What is an “equity-like” mortgage
    and why would it help?

    How does a more “equity-like” mortgage work? The mortgage contract we promote in our book is the Shared Responsibility Mortgage. In this mortgage, the principal balance of the mortgage and the interest payments are linked to a local house price index that measures the average value of houses in the zip code of the purchased home. If house prices in the neighborhood fall, the principal balance and interest payments automatically adjust downward. This provides relief to the homeowner exactly when it is most needed: when difficult economic circumstances arise in the neighborhood.

    In our book, we use the example of a mortgage in which the principal balance and interest payments adjust downward by the same percentage point as the fall in house prices. So if a homeowner has a monthly payment of $1,000 and house prices in the zip code fall by 20 percent then the monthly payment automatically adjusts downward to $800. If house prices rise once again, the monthly payment will increase up to $1,000, but the payment can never be higher than the original amount of $1,000 paid when the home was purchased, no matter how high house prices go in the neighborhood.

    In return for the protection against house price declines, the lender who provides the mortgage is given an extra payment in case house prices rise and the homeowner sells the home. So, for example, if the home increases in value from $100,000 to $120,000 and the owner sells the home, then a part of the capital gain of $20,000 would be paid to the lender. We calculate that only 5 percent to 10 percent of the capital gain would need to be paid to ensure the lender is properly compensated for the downside protection. In this example, this implies a payment of $1,000 to $2,000 out of the $20,000 capital gain.

    An interesting related idea is the ratchet mortgage by housing finance specialists Bert Ely and Andrew Kalotay. It is essentially a one-way adjustable rate mortgage where the interest rate paid by the borrower is tied to a long-term government bond rate such as the 10-year Treasury bond. The key characteristic is that interest rates only adjust downward: if the reset formula yields a higher interest rate than the current rate paid by the borrower then the current rate prevails. Interest rates tend to fall in recessions, which would provide automatic savings to homeowners exactly when they need it. Further, homeowners would not bear the risk that interest rates rise in the future. Of course, the initial interest rate on a ratchet mortgage would be higher than a fixed-rate mortgage, but the protection offered would be advantageous to the homeowner and to the broader economy.

    Both of these types of mortgages more equitably share house price risk than traditional mortgages. This has large benefits for the economy. When house prices fall, middle- and low-income homeowners using an equity-like mortgage would not bear the lion’s share of the burden. Their interest payment would automatically decline, and their housing wealth would be preserved. As a result, they would not cut spending so dramatically. Equity-like mortgages provide exactly the type of automatic stabilizer the economy needs to avoid severe recessions.

    Further, tying mortgages explicitly to house prices would lessen the likelihood of unsustainable bubbles emerging in the first place. Research shows that debt fuels bubbles by engendering false security among lenders. Lenders feel they are immune to the bubble when providing debt financing because homeowners bear almost all of the risk. Explicitly tying house prices to mortgage payments would force lenders to think twice about lending into an unsustainable housing boom.

    Are “equity-like mortgages” feasible
    in today’s mortgage market?

    Yes.

    PartnerOwn, a firm based in Chicago, is commercializing a version of the Shared Responsibility Mortgage. Their work has given context to the theoretical benefits for mortgage borrowers, lenders, and investors while also highlighting some of the remaining obstacles.

    PartnerOwn’s surveys show that mortgage borrowers prefer the Shared Responsibility Mortgage relative to current mortgage product offerings. In a sample of 40 borrowers at Chicago Housing and Urban Development Homebuyer Workshops, 80 percent preferred it to a 30-year fixed rate mortgage after watching a 15-minute in-person presentation. Sixty percent of online respondents similarly preferred the Shared Responsibility Mortgage after watching a 3 minute-video about the product. Perhaps most encouraging, 80 percent of respondents were able to correctly articulate the payoff structures in multiple scenarios of the product. Millennials, a demographic that is often priced out of more “price stable” neighborhoods, have been among the most interested groups.

    Regional banks have been receptive to the Shared Responsibility Mortgage for ensuring the stability of the local market that they serve, and PartnerOwn has begun work on a fund that sources capital from multiple regional banks to provide liquidity for the new home mortgage product. The Federal Reserve Bank of Chicago recently highlighted it in its publication ProfitWise as a tool for Community Reinvestment Act: Shared Responsibility Mortgages, it said, “would also provide benefits to the bank or institution that holds the mortgage, such as helping expand lending to new potential borrowers who are concerned about house price volatility, and potentially helping lenders earn CRA credit for serving LMI [low-to-moderate income] communities.”

    Institutional investors are encouraged by the new mortgage’s incorporation of frictionless modifications for mortgage borrowers and the reduction in defaults at a portfolio level. The Great Recession revealed that various government programs, such as the Home Affordable Modification Program and Home Affordable Refinance Program, showed the strains that take place when developing modification rules and applying these on behalf of investors in mortgage-backed securities amid an economic downturn. The Shared Responsibility Mortgage provides modifications when they are needed in a local economy to help keep mortgages performing, and the resultant effects from fewer defaults and streamlined modifications ultimately trickle up to institutional investors.

    PartnerOwn’s biggest task is now in ensuring compliance with the various regulatory agencies for residential mortgages, consumer finance, and banking to provide mortgage lenders with regulatory assurance should they become Shared Responsibility Mortgage lenders.

    Why does the federal government
    need to be involved?

    The federal government has been incredibly influential in the U.S. mortgage market since the Great Depression by serving as a provider of liquidity to mortgage lenders and by lowering the cost of funding mortgages. This consideration is even truer today since 94 percent of residential mortgage-backed securities are issued by Fannie Mae and Freddie Mac.3

    The two housing giants also have historically defined what mortgages are available to market participants. In the 1970s, their standardized mortgage contracts, such as the 30-year fixed rate mortgage, became available for resale to institutional investors. More recently, the Consumer Financial Protection Bureau has defined a “qualified mortgage” to provide clarity to mortgage-market participants about the rules governing various mortgage products to prevent the more outrageous terms and practices that contributed to the debt buildup that led to the Great Recession.

    The government should be involved in promoting the use of mortgage contracts that have better economic properties. We give three specific reasons for government involvement below.

    First, by securitizing debt mortgages and not securitizing Shared Responsibility Mortgages, the federal government through Fannie Mae and Freddie Mac provide a huge cost advantage to debt mortgages that meet the definition of a conforming mortgage. The government currently tilts the game toward the mortgages that have bad economic properties. The Federal Housing Finance Authority should even the playing field by declaring the Shared Responsibility Mortgage a conforming mortgage.

    Second, the economic benefits of Shared Responsibility Mortgages may not be reflected in private market pricing because of externalities. More specifically, research shows that debt contracts have large negative externalities on the economy that are not properly priced among private parties. The most obvious example is foreclosures. Foreclosures are the direct result of mortgage debt contracts that force the homeowner to bear the losses when house prices decline; a foreclosure has negative effects on house prices throughout the neighborhood. The entire neighborhood is made better off if the lender and any given homeowner agree on an Shared Responsibility Mortgage instead of a debt mortgage. Because such externalities are present, the government should play an important role in promoting this new home mortgage product.

    Third, the Federal Housing Finance Authority, and potentially the Consumer Financial Protection Bureau, should play an important role in setting the terms for Shared Responsibility Mortgage contracts, which are more complex than the 30-year fixed rate mortgage contract—and more complexity often comes with manipulation and misleading practices by financial intermediaries. We show in our book that a Shared Responsibility Mortgage with an equivalent interest rate as a 30-year fixed rate mortgage should only require the homeowner to pay the lender 5 percent to 10 percent of the capital gain at sale. One worry would be that a financial intermediary would take advantage of the complexity of the new mortgage product by offering contracts that take much more of the capital gain than is fair. We believe the Shared Responsibility Mortgage has large economic benefits, but the complexity comes with the need of oversight.

    A more stable housing market

    Housing is crucial to sustaining a strong middle class, but the current mortgage finance system encourages volatility and excessive risk-bearing by homeowners. More equity-like mortgages such as the Shared Responsibility Mortgage would stabilize the housing market and protect homeowners against economic downturns. The benefits would accrue to the entire economy.

    U.S. top one percent of income earners hit new high in 2015 amid strong economic growth

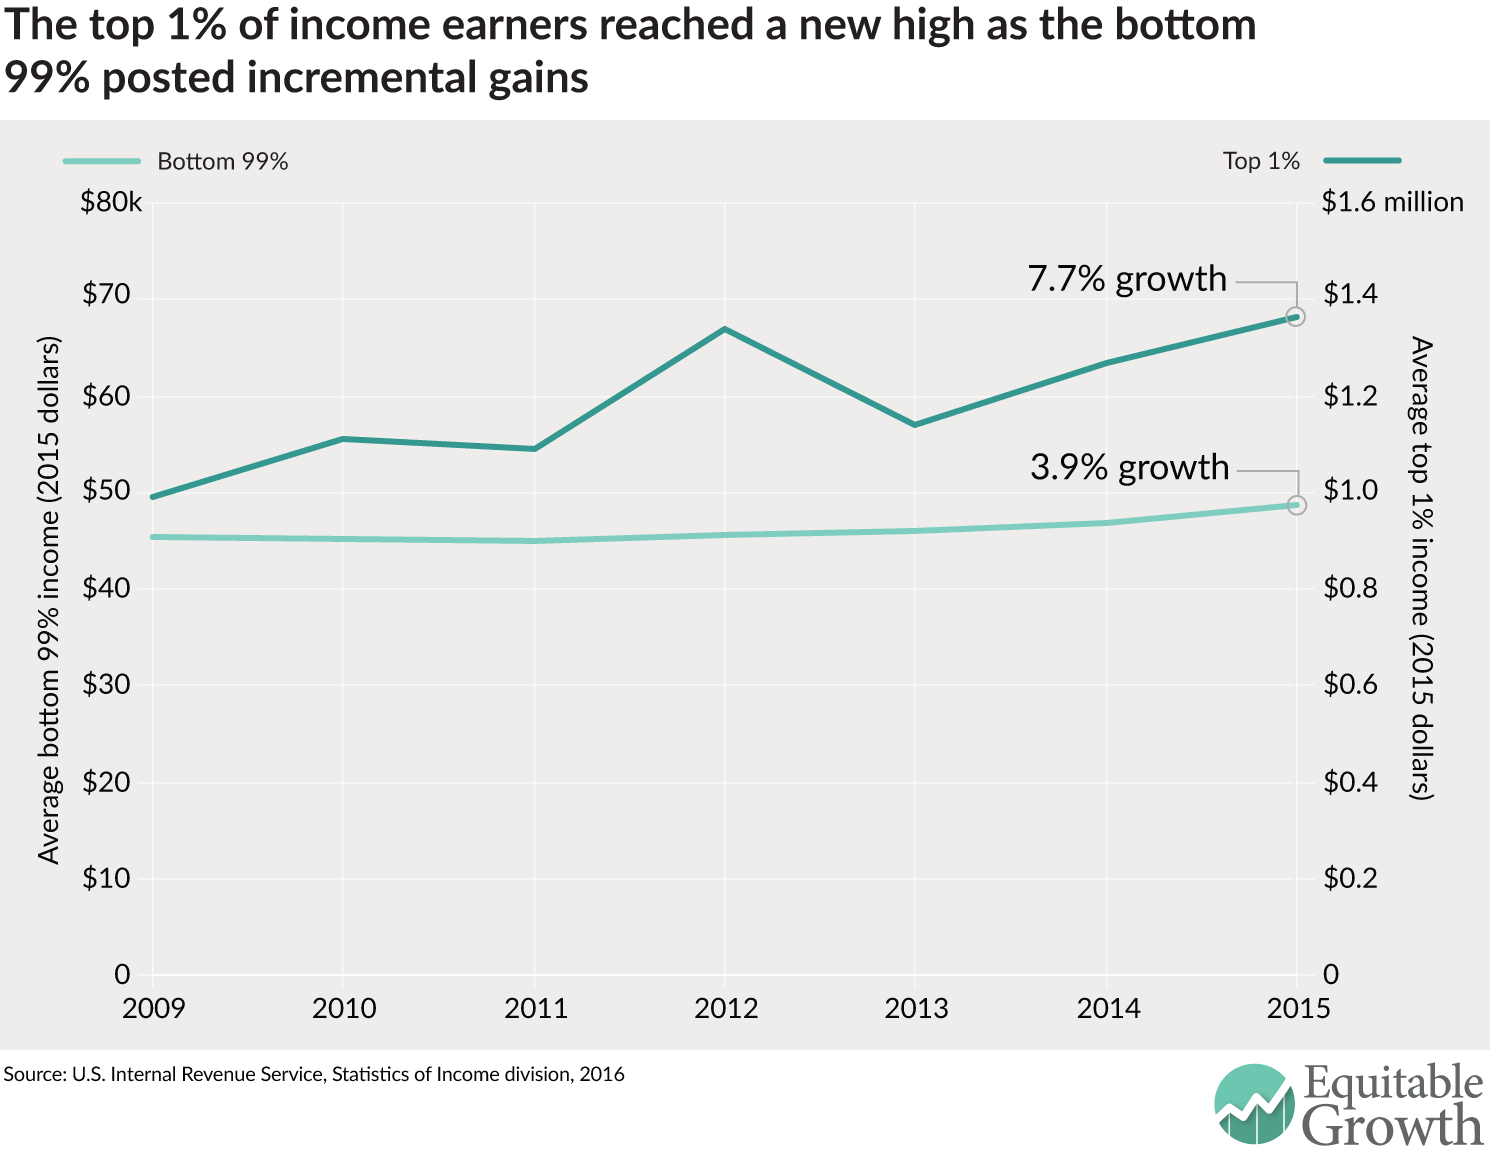
    The top 1 percent income earners in the United States hit a new high last year, according to the latest data from the U.S. Internal Revenue Service. The bottom 99 percent of income earners registered the best real income growth (after factoring in inflation) in 17 years, but the top one percent did even better. The latest IRS data show that incomes for the bottom 99 percent of families grew by 3.9 percent over 2014 levels, the best annual growth rate since 1998, but incomes for those families in the top 1 percent of earners grew even faster, by 7.7 percent, over the same period. (See Figure 1.)

    Figure 1

    Overall, income growth for families in the bottom 99 percent was good again in 2015 as it had been last year, marking the second year of real recovery from the income losses sparked by the Great Recession of 2007-2009. After a large decline of 11.6 percent from 2007 to 2009, real incomes of the bottom 99 percent of families registered a negligible 1.1 percent gain from 2009 to 2013, and then grew by 6.0 percent from 2013 to 2015. Hence, a full recovery in income growth for the bottom 99 percent remains elusive. Six years after the end of the Great Recession, those families have recovered only about sixty percent of their income losses due to that severe economic downturn.

    In contrast, families at or near the top of the income ladder continued to power ahead. These families at or near the top of the income ladder did substantially better in 2015 than those below them. The share of income going to the top 10 percent of income earners—those making on average about $300,000 a year—increased to 50.5 percent in 2015 from 50.0 percent in 2014, the highest ever except for 2012. The share of income going to the top 1 percent of families—those earning on average about $1.4 million a year—increased to 22.0 percent in 2015 from 21.4 percent in 2014.

    Income inequality in the United States persists at extremely high levels, particularly at the very top of the income ladder. Figure 1 shows that the incomes (adjusted for inflation) of the top 1 percent of families grew from $990,000 in 2009 to $1,360,000 in 2015, a growth of 37 percent. In contrast, the incomes of the bottom 99 percent of families grew only by 7.6 percent–from $45,300 in 2009 to $48,800 in 2015. As a result, the top 1 percent of families captured 52 percent of total real income growth per family from 2009 to 2015 while the bottom 99 percent of families got only 48 percent of total real income growth. This uneven recovery is unfortunately on par with a long-term widening of inequality since 1980, when the top 1 percent of families began to capture a disproportionate share of economic growth.

    The 2015 numbers on income have been built using the new filling-season statistics by size of income published by the Statistics of Income division of the IRS. These statistics can be used to project the distribution of incomes for the full year. We have used these new statistics to update our top income share series for 2015, which are part of our World Top Incomes Database. These statistics measure pre-tax cash market income excluding government transfers such as the disbursal of the earned income tax credit to low-income workers.

    Timely statistics on economic inequality are key to understanding whether and how inequality affects economic growth. Policymakers in particular need to grasp whether past efforts to raise taxes on the wealthy—in particular the higher tax rates for top U.S. income earners enacted in 2013 as part of the 2013 federal budget deal struck by Congress and the Obama Administration—are effective at slowing income inequality.

    The latest data from the IRS suggests the 2013 reforms proved to be fleeting in terms of reducing income inequality. There was a dip in pre-tax income earned by the top one percent in 2013, yet by 2015 top incomes are once again on the rise—following a pattern of growing income inequality stretching back to the 1970s.

    —Emmanuel Saez in a professor of economics at the University of California-Berkeley and a member of the Washington Center for Equitable Growth’s steering committee.

    Photo by Steve Johnson, via flickr