The Washington Center for Equitable Growth recently hosted a webinar examining the economic, fiscal, and labor‑market effects of evolving U.S. tariff laws and regulations, particularly in the wake of the recent U.S. Supreme Court decision overturning tariffs imposed under the International Emergency Economic Powers Act. While those tariffs were struck down, uncertainty remains as the Trump administration seeks to replace them with tariffs enacted under alternative authorities—notably, Section 301 investigations that historically have been used by the U.S. Trade Representative to protect domestic industries from unfair trade practices.
Opening the event, Equitable Growth President and CEO Shayna Strom emphasized that tariffs’ “impacts on jobs, prices, and economic growth not only [aren’t] going away, they’re getting even more confusing.” The purpose of the event, she said, was to ground the debate in evidence rather than rhetoric.
Equitable Growth researcher Chris Bangert‑Drowns then presented the organization’s updated tariff data project, which estimates tariff‑related input costs across U.S. economic sectors, industries, and geographies using real effective tariff rates rather than statutory ones. He showed that nearly every U.S. sector experienced sharp tariff cost increases in 2025, often in multiple waves, and that the impacts of the tariffs vary widely.
“Almost every U.S. economic sector experienced two rounds of tariff growth last year—in some cases explosive tariff growth,” Bangert‑Drowns noted. While manufacturing does not always appear as the most exposed industry when looking only at tariff rates, it becomes the most affected sector by the Trump administration’s tariff policies once imported inputs are considered in the context of all input costs. “When you combine tariff rates with import shares,” he explained, “we find manufacturing actually is the most impacted sector in the U.S. economy.”
The updated data also allow for detailed geographic analysis of tariff impacts across the country. Midwestern and southern states face particularly high tariff exposure due to their concentration of manufacturing employment. These patterns, Bangert‑Drowns suggested, matter not just economically but also politically, given how narrowly recent presidential elections have been decided.
Following the presentation, Associated Press journalist Josh Boak moderated a panel discussion with Elena Patel of The Brookings Institution, Carola Binder of the University of Texas at Austin, Riley Ohlson of the AFL‑CIO, and Bangert‑Drowns.
Patel focused on tariffs as a source of federal revenue and a tool of economic policy. While the Trump administration may succeed in reimposing similar tariffs through Section 301, she argued that tariffs are an unreliable solution to the budget deficit. “Can this solve our deficit problem? The answer is probably not,” Patel said, pointing out that tariffs only raise revenue if imports continue. Higher tariffs, by design, shrink the import tax base over time.
Patel also warned about legal and administrative uncertainties. “There’s $200 billion right now that is in question about how this is going to be refunded and to whom it’s going to be refunded,” she said of the recently overturned IEPA tariffs, calling it “a really complicated question.”
Binder addressed the inflation fears that followed initial tariff announcements in 2025. While tariffs deliver inflationary supply shocks, she explained that uncertainty can suppress demand, offsetting some price pressure as the economy contracts. “Policy uncertainty … reduces aggregate demand,” Binder said, making the net inflation effect smaller than many predicted. Looking ahead, however, she raised concerns about Federal Reserve policymaking. “If they’re concerned about inflation expectations becoming unanchored,” Binder warned, “then they might have to respond by raising interest rates, which would have pretty bad consequences for the real economy.”
From the labor movement’s perspective, Ohlson emphasized that not all tariffs are alike. “If you’re looking at sectoral‑based tariffs … where there is idle capacity, we do see positive outcomes,” he said. But broad, rapidly changing tariffs create instability. “You’re not going to reline a blast furnace,” he explained, “if the tariff could change in the next three months, or three weeks, or three days.”
Ohlson stressed that tariffs must be paired with industrial policies that benefit workers. “[Tariffs] need to be strategic, they need to be thoughtful, they need to be paired with industrial policy,” he said, warning that uncertainty itself is a major drag on investment and wages.
Panelists broadly agreed that tariff costs are largely passed on to U.S. firms and consumers, not foreign exporters. Bangert‑Drowns pointed to existingresearchshowing that “most of the tariff costs faced by businesses are being passed down to their business clients or to consumers.” He also highlighted that small businesses are more vulnerable to tariff impacts than large firms, which have greater capacity to manage compliance and absorb temporary losses.
The discussion also addressed claims that tariffs have single‑handedly revived U.S. manufacturing or generated trillions of dollars in new investment, to which the panel expressed skepticism. “It’s very hard … to say this is because of policy X or tariff Y,” Patel said, noting that businesses’ major investments are typically years in the making and influenced by many factors.
In closing, the speakers emphasized that tariffs are a blunt instrument. Patel cautioned against distorting trade laws beyond their intended purpose, while Binder summed up the macroeconomic view bluntly: “Tariffs are not a good tool for macroeconomic policy.” Ohlson stressed the risk of swinging back to an equally damaging status quo, arguing instead for targeted trade enforcement combined with sustained investment in workers.
Across perspectives, the central message was consistent: U.S. trade policy must be predictable, targeted, and paired with broader economic strategies if it is to support economic growth, policy credibility, and working‑class prosperity.
This article was drafted with assistance from Microsoft Copilot.
Did you find this content informative and engaging? Get updates and stay in tune with U.S. economic inequality and growth!
A handful of key U.S. economic sectors—construction, manufacturing, mining, and repair and maintenance—face disproportionately large first-order tariff costs, complicating growth and investment in these sectors.
Across nearly all of the U.S. economy, estimated tariff rates ballooned in the first half of 2025 and remained elevated through the end of the year, with little apparent relief for cost-burdened businesses.
Developments in trade policy through the first quarter of 2026 suggest a deepening uncertainty around the duration, magnitude, purpose, and legal basis of the current tariff regime. This uncertainty slows growth and investment just when the U.S. labor market already faces threatening headwinds.
Overview
All tariffs are not created equal. Throughout U.S. history, policymakers have imposed import taxes for a variety of economic and ideological reasons, with varying impacts. Targeted tariffs have been effective in some cases at supporting domestic industries facing competition from low-cost imports.
But the large and volatile tariff regime in place since early 2025 is far from targeted. Instead, broad tariffs have been imposed on nearly every U.S. trading partner and nearly every imported commodity, increasing input costs across the economy. Retaliatory tariffs have been imposed on exports from the United States, diminishing the competitive advantage of U.S. import tariffs for some businesses.
The U.S. Supreme Court’s recent decision invalidating the president’s tariff-setting authority under the International Emergency Economic Powers Act should not be taken as a sign that the tariff regime will be rolled back. Instead, after the court’s decision was released, the Trump administration immediately announced broad tariffs under a different, unprecedented legal authority and signaled the continued use of targeted trade investigations to impose commodity-specific tariffs. Lawsuits over these newly imposed tariffs are already winding their way through U.S. courts, while businesses are fighting in the U.S. Court of International Trade for refunds for tariffs they paid under the now-invalid IEEPA authority.
Together, these developments suggest continued volatility in U.S. tariff policies in 2026. To better understand the effects of this broad and volatile policy environment, Equitable Growth’s tariff project has sought to estimate costs for U.S. industries importing intermediate goods used as inputs in production processes. Through this focus on input costs, our model seeks to isolate one of the channels through which tariffs impact the U.S. economy.
U.S. importers can respond to elevated tariff costs in a few ways. They can reorient supply chains toward domestic sources or cheaper imports. They can pass costs down to purchasers of their goods and services. And they can contain other business costs by suppressing wage growth and new hiring. Equitable Growth’s tariff model informs all three mechanisms through estimates of commodity- and industry-level tariff exposure weighted by employment.
Our model, however, is not comprehensive. It does not address the potential benefits of tariffs for U.S. businesses whose final goods are in competition with low-cost imports. Nor does it address the competitive disadvantages of retaliatory tariffs imposed by trading partners on U.S. exports. Rather, our focus on first-order input costs can be combined with other estimates of second-order costs and competitive advantages and disadvantages to reach a more holistic picture of tariff impacts.
Construction, manufacturing faced higher tariff costs than other sectors
This update to Equitable Growth’s tariff tracking project corroborates results from the earlier work, finding that certain key economic sectors faced relatively high tariff rates and first-order costs in 2025. Indeed, the U.S. construction sector faced the highest estimated tariff rate1 in 2025, peaking at higher than 19 percent in October. Mining and other extractive activities faced the next-highest estimated tariff rate, peaking at more than 15 percent in October.
Manufacturing faced a relatively lower average estimated tariff rate, peaking at more than 11 percent in October, but this sector was burdened by the largest tariff costs measured as a fraction of all inputs.2 On average, the manufacturing sector imports nearly 19 percent of all its inputs, so even a middling tariff rate can cause a substantial increase in tariff costs relative to total input costs. (See Figure 1.)
Figure 1
Across U.S. sectors, tariff rates and fractional costs skyrocketed from February to the early summer, with initial peaks recorded in May 2025. A second spurt of rapid growth in estimated tariff rates occurred from June to the early fall. Most sectors faced peak estimated tariff rates in September and October before a slight tapering off in the final two months of the year.
Disaggregating exposure to tariffs by subsector reveals nuance in their impact
Disaggregating broad sectoral categories into subsectors reveals important variation in the impact of tariffs in 2025. While the manufacturing sector faced average tariff costs of about 2 percent of total inputs—higher than any other sector of the U.S. economy—some manufacturing subsectors faced costs as high as 4 percent of all inputs while others experienced much lower costs as a percent of their total inputs.
The most tariff-impacted manufacturing subsectors in 2025 were machinery, furniture, apparel, and primary metals production, followed closely by fabricated metals and transportation equipment—two of the most significant manufacturing employers in the country. Meanwhile, food production and chemical production, two of the other significant manufacturing employers, faced relatively low tariff costs of less than 1 percent of inputs.
Food production firms import a significantly smaller share of their inputs compared to chemical production, but key tariff exemptions—particularly an exemption for pharmaceutical imports—means chemicals firms enjoy a fractional tariff cost on par with foods. The petroleum and coal production subsector similarly imports a significant portion of its inputs, but exemptions for energy imports mean it enjoys one of the lowest estimated tariff rates of any subsector. (See Figure 2.)
Figure 2
Further disaggregation of two of the highly impacted manufacturing subsectors, machinery and metals, yields interesting results. In the machinery production subsector, the most impacted industries are agriculture, construction, and mining machinery production and general purpose machinery, which includes production of industrial furnaces, packaging machinery, powered hand tools, pumps, cranes, elevators, and a range of other industrial-oriented machines. (See Figure 3.)
Figure 3
This uneven distribution of tariff costs within the machinery production subsector implies an uneven pass-through of tariff costs to purchasers of those machinery products. In other words, agricultural and construction firms likely faced higher second-order tariff costs when purchasing machinery, compared to, say, purchasers of service-sector or metalworking machinery.
Large tariff costs across the machinery manufacturing subsector—and, in particular, for machinery in industrial, construction, and mining settings—also suggest elevated capital costs for businesses in these downstream industries. Elevated capital costs make it harder for firms to invest in new production and hire more workers, slowing overall growth.
Higher capital costs also can complicate the competitive advantage produced by tariffs for firms whose final goods directly compete with low-cost imports. Those firms, seeking to capitalize on the tariff-induced cost advantages, face their own elevated downstream costs when investing in new machinery to boost production. This is not to say that downstream costs entirely offset the competitive advantage gained by some firms from tariffs. Rather, business leaders and policymakers should be creative in supporting firms that stand to gain from tariffs but face elevated cost burdens from those very same tariffs.
Disaggregating the two metals manufacturing subsectors, primary and fabricated, also reveals important differentiation in estimated tariff rates by industry. By far the most impacted metals industry is steel product manufacturing from purchased steel, with estimated fractional tariff costs consistently higher than 6.4 percent since July 2025. Aluminum, the next most-impacted metals industry, reached a fractional tariff cost peak of 5.3 percent in October. Other metals industries with above-average fractional tariff costs include production of boilers, tanks, and shipping containers, as well as production of springs, wire, and miscellaneous hardware. (See Figure 4.)
Figure 4
Particularly notable in this disaggregation is the difference in tariff costs between steel mills manufacturing and steel production from purchased steel. This difference is attributable primarily to differences in the use of scrap metal inputs. BEA data show us that scrap inputs comprise more than 45 percent of all inputs for the steel mills industry and only about 11 percent of inputs for production from purchased steel. The two industries import only a small portion of their total scrap inputs—roughly 4 percent each—and faced an average scrap tariff rate of less than 1 percent in 2025.
The reliance of steel mills on domestic scrap inputs makes it substantially less import-exposed and suggests a path forward for some heavily tariffed steel producers. In a sign of resilience for the overall metals production subsectors, output from steel mills is roughly four times greater than output from purchased steel production, and employment is almost 50 percent larger.
As was the case with machinery production, the uneven distribution of first-order costs within the metals subsectors suggests differentiation in second-order costs incurred by purchasers of primary and fabricated metals products. Buyers of industrial spring and wire products, for example, may face higher tariff cost pass-throughs, compared to buyers of coating and engraving products, all else held equal.
Industry exposure to tariffs may affect certain states more
Linking these measures of national industry tariff exposure to state- and county-level employment can illustrate variations in estimated tariff impact across the country. This geographic disaggregation can be useful for policymakers and advocates representing regions where employment is particularly concentrated in tariff-exposed industries.
Equitable Growth’s project produces an “employment exposure score,” weighing an industry’s tariff exposure against its share of state and county employment. This score is useful in indicating where tariff pressures on the U.S. labor market are likely to be concentrated, and where policymakers could be most supportive. (See Figure 5.)
Figure 5
As Figure 5 shows, Michigan and Indiana register the highest in the employment exposure score metric alongside Wisconsin and other Midwest and Southern states with above-average employment in tariff-exposed industries. In Michigan and Indiana, the disproportionately large scores are attributable to large employment shares in auto and related manufacturing, construction, machine shops, and other manufacturing industries.
While aggregate state economies could face headwinds from tariff costs, disaggregating impact by county can reveal potential hotspots in states that, overall, face average exposure levels. Below, we explore this county disaggregation for Washington state and Georgia, though this exercise could be done for any other U.S. state.
Washington state
The U.S. aerospace industry is one of the most import-exposed of all manufacturing industries. According to the U.S. Bureau of Economic Analysis, the national aerospace products and parts industry imports roughly 30 percent of all its inputs—well above the average industry import share of 12 percent. Those imports are mostly engines and engine parts, communication and navigation equipment, and other aircraft parts. Tariffs on these specific commodities increased throughout 2025, with engines and parts (representing the bulk of aerospace imports) reaching a peak rate of about 7.8 percent in August.
Navigation and related equipment (a smaller but still meaningful portion of aerospace imports) faced a tariff peak of more than 11 percent in September. The aerospace industry altogether saw its average tariff rate increase throughout 2025, accelerating particularly in April and hitting a peak in September of more than 9.6 percent, or nearly 2.7 percent of all industry inputs. It has remained elevated since.
In Washington state, the aerospace industry is one of the five largest employers, behind restaurants, software developers, company management, and hospitals. Aerospace employment is concentrated in a handful of counties, the overwhelming majority of which is in King and Snohomish counties. Aerospace employment as a percent of overall county employment—a key measure of industrial concentration—is most meaningful in Snohomish County, where around 13.5 percent of all nonfarm private-sector workers are employed in the aerospace industry. The next-highest aerospace concentration is in King County, where about 2.4 percent of nonfarm private-sector jobs are in aerospace.
Aerospace, construction, and restaurants have the highest employment exposure scores in Washington state, meaning tariff costs in those industries could suppress wage growth and investment more than in other industries. Equitable Growth’s county-level data show high exposure scores for aerospace in Snohomish County specifically, as well as for navigational and other instrument manufacturing in Whitman County, where this industry comprises nearly a quarter of all nonfarm private employment.
These findings are important not only for mapping potential labor market implications, but also because U.S. aerospace producers seeking to domesticate their supply of navigational equipment may find domestic producers of such equipment passing down substantial tariff costs to consumers and downstream businesses.
Georgia
Georgia’s industrial composition makes it relatively less tariff-exposed compared to other state economies, but there are some areas of concern. Construction is responsible for a substantial portion, about 5.5 percent, of the state’s total nonfarm private employment and is one of the more tariff-exposed sectors nationally, with an estimated tariff rate climbing above 17 percent in the fourth quarter of 2025. Nationally, the construction sector imports about 10 percent of its inputs.
Even more Georgia workers, about 6.2 percent, are employed in manufacturing. Nationally, on average, the manufacturing sector imports about one-fifth of its inputs and has faced an estimated tariff rate above 10 percent since September 2025.
Disaggregating manufacturing sector employment in Georgia reveals important variations. A little higher than 10 percent of Georgia manufacturing workers are employed in the transportation-equipment production subsector, which, nationally, imports nearly 23 percent of its inputs and has faced an estimated double-digit tariff rate since May 2025. The fabricated-metal production industry employs a similarly substantial portion of Georgia manufacturing workers.
While, on average, the fabricated-metal production industry imports a smaller fraction of inputs, compared to the transportation equipment subsector, it faces a larger estimated tariff rate. Other notable manufacturing subsector employers in Georgia include textile product mills (facing an estimated tariff rate of 18 percent in December 2025), machinery manufacturing (with estimated tariffs of about 20 percent), and plastics and rubber product manufacturing (estimated tariffs of roughly 12 percent).
Drilling down to the county level can reveal geographic hotspots where employment is especially concentrated in tariff-exposed industries. Warren County, for example, is home to a Georgia-Pacific lumber operation that employs more than 150 people and supports other jobs in the area. While the imported share of lumber used in the United States has decreased over the past couple of years, tariff rates on imported lumber increased dramatically throughout 2025, from around 2 percent at the beginning of the year to about 11 percent by December.
Georgia-Pacific is a privately held company, which means they are not subject to SEC filing requirements that might shed light on the company’s tariff incidence. But the company’s facility in Early County was closed in April 2025 in anticipation of reduced competitiveness, possibly a result of retaliatory tariffs imposed by China on U.S. exports. Other Georgia counties with meaningful wood-product manufacturing employment include Atkinson, Jeff Davis, Jasper, Jefferson, and Putnam counties.
Downstream industries are also important to the Georgia economy, including:
Retail dealers of motor vehicles and parts alone comprise about 1.8 percent of all private state employment and face an estimated tariff rate that has remained above 10 percent through the second half of 2025.
Truck transportation firms—essential for the movement of industrial goods—comprise around 1.7 percent of all state employment and face an estimated tariff rate that reached a peak of nearly 12 percent in September 2025.
Automotive repair and maintenance employs more than 30,000 workers in Georgia and is particularly sensitive to tariff policies, with higher than 12 percent of the industry’s inputs being imported. The industry’s estimated tariff rate ballooned from about 3.6 percent in February 2025 to 15 percent in May, reaching a peak of higher than 17 percent in October.
Conclusion
First-order tariff costs are distributed unevenly across U.S. industries, with manufacturing and other key sectors facing disproportionately large increases to input costs because of import duties. These direct tariff costs are compounded by the cost of volatility in tariff policies, as businesses struggle to plan around uncertainty. The Supreme Court decision invalidating many of the Trump administration’s 2025 tariffs, followed by the imposition of time-limited 10 percent tariffs (with an increase to 15% swiftly threatened) under Section 122 of the Trade Act of 1974, all add further uncertainty to business projections of the duration and magnitude of the current tariff regime.
Equitable Growth will continue to monitor developments in trade and tariff policies and publish updates to our data project. Researchers can find data and code files on the Equitable Growth GitHub to reproduce our analysis or create unique datasets of interest.
Factors including declining job quality, immigration, and financialization of the economy have had an impact on people’s support for populist political candidates.
Potential remedies include labor and tenant organizing, place-based investments, and learning from previous efforts to support displaced workers.
To strengthen support for democracy and ensure a dynamic economy in which workers and families can thrive, economic policies must be designed and assessed based on their ability to support economic security, push back against demographic cleavages, and rebuild the social and political fabric that connects us to each other.
Overview
In 2025, the Washington Center for Equitable Growth began to explore the evidence behind a link between the effects of economic policies and global support for authoritarian populist candidates for political office. We saw the U.S. experience as part of a global trend and wanted to investigate whether the design and implementation of economic policies have an impact on the growing frustration that voters around the world are feeling. We also know how important it is to understand what the growing body of research says about the risk factors that might prevent the U.S. economy from achieving shared prosperity, as well as mitigating factors.
To dive into these issues and theories more deeply, we partnered with Alexander Hertel-Fernandez, a leading political economist and director of the American Democracy Initiative at Columbia University’s School of International and Public Affairs and a visiting fellow with Equitable Growth. To incorporate evidence across multiple academic disciplines and perspectives, we commissioned a series of essays from economists, political scientists, and other social science researchers about the causes and effects of people’s perspectives on the economy.
We first published an introductory essay that summarized the literature on support for authoritarian populism and laid out our reasons for doing this work. We also held two publicevents that brought together researchers, advocates, journalists, and policy leaders to discuss the ways in which economic policies have affected people’s political preferences, as well as potential solutions to strengthen support for democracy. In the coming months, we will publish a synthesis piece with criteria for policymakers looking to enact economic policies while keeping the effects on democracy in mind.
This column summarizes the 14 essays in our series, breaking them down into two categories: those that explore the factors driving support for authoritarian populism globally and those that dive into remedies to reverse this trend. Let’s turn now to the first group.
Economic and cultural factors driving support for populist candidates
Many essays in our series focus on the economic and cultural factors that have shaped political preferences, from declining job quality to immigration and trade shocks.
Declining job quality
An essay by Erin Kelly discusses the ways in which job quality has declined throughout the past several decades and the areas on which policymakers should focus their attention to improve not just job quality, but also the dignity that comes with quality employment. These areas include:
Diminished purchasing power for low-wage workers
Unstable work schedules
Lack of paid leave
Limited advancement opportunities for low-wage workers
Threats or perceived threats to worker dignity and social status
Tarik Abou-Chadi and Justin Gest in separate essays detail the ways in which economic and cultural changes threaten social status or lead to a sense of loss, compared with previous generations (a term called nostalgic deprivation). One overarching finding is that the fear or perception of impending loss of social status is stronger in shaping people’s political behavior than the actual experience of loss.
Standard measures of the economy that do not reflect people’s experience of the economy
Jonathan Cohen and Katherine Cramer discuss the ways in which U.S. macroeconomic indicators, such as Gross Domestic Product and the Dow Jones industrial average (an index of 30 corporations listed on U.S. stock exchanges), fail to capture the majority of Americans’ experiences of the economy and how that leads to distrust of government. They propose alternatives to better measure and respond to people’s experiences of the economy, centering on actual well-being.
Sirus Dehdari explores how economic factors, such as rising unemployment and immigration, are intertwined. His analysis shows that people tend to turn to authoritarian populists, who lean into anti-immigration discourse, when they are unhappy with economic conditions and/or perceive immigrants to be worsening economic conditions.
Corporate governance and financialization of the economy
Lenore Palladino’s essay focuses on the ways in which the U.S. corporate governance framework prioritizes shareholder primacy over gains to and protections for workers, and the ways in which that has helped usher in declining support for democratic norms. She additionally explores the increasing financialization and extractive nature of the U.S. economy, which rewards rent-seeking instead of productivity and innovation—to the detriment of workers and society. Palladino suggests employee ownership, employee inclusion in governance, and reorienting finance toward productivity and innovation as remedies.
David Autor, David Dorn, and Gordon Hanson analyze how the U.S. response to the China trade shock ultimately shaped political behavior in the most impacted regions of the country. They determine that areas with high concentrations of manufacturing jobs prior to 2000 faced weakened job and wage growth opportunities for mostly White male manufacturing employees and increased in-migration by U.S.-born Hispanics and foreign-born women accepting lower-paid service jobs, stoking resentment.
Jacob Hacker and Paul Pierson describe U.S. right-wing populism as differing from its counterparts in other countries due to the geographic differences and electoral consequences of such differences in the U.S. political system. The wealthy in the United States are uniquely able to exploit geographic animus among nonurban areas to gain support for their priorities, such as deregulation and lower taxes. To counter these forces, the authors write, policies must be carefully designed, and policymakers must take advantage of political windows in ways that respond to voters’ needs while diminishing the political power of the wealthy.
Relatedly, Andrea Campbell explores in her essay the ways in which the U.S. tax system has become more regressive over time due to the political clout of the wealthy in shaping tax policies and racial resentment about tax expenditures, which are exploited by politicians and the wealthy alike.
Yotam Margalit argues in his essay that economic factors are insufficient in understanding rising support for authoritarian populists. “That support should instead be understood predominantly as a result of anxiety about cultural and demographic shifts and people’s sense that core aspects of their identity are under threat,” he writes. Fear of demographic and cultural change, as well as resentment among rural voters, are the top factors driving voters toward populists both in the United States and abroad. He posits that a focus on increasing solidarity and connection can counter the trend.
Several essays in our series grapple with the questions of how the trend of rising support for authoritarian populists might be reversed and how to better meet people’s economic needs. Beyond suggested remedies from several of the above authors, evidence-based solutions include place-based investments, unionization, and better designed programs to support economically displaced people.
Place-based investments
Tim Bartik describes the ways in which state and federal governments should target aid to distressed places specifically to boost the creation of good jobs in cost-effective ways and that flexibly meet the needs of distressed communities.
Meanwhile, Gbenga Ajilore discusses the assets and opportunities for economic growth in rural communities. He describes previous attempts to direct federal support to rural economic development and lessons from which to learn and build on while giving rural communities agency to determine their futures and strengthening support for democracy.
Research suggests that worker organizing for better jobs and housing conditions is an effective way to counter the trends. In addition to Erin Kelly’s essay, described above, two others also discuss ways to strengthen worker dignity and foster social connection toward democratic aims.
An essay by Adam Dean and Jamie McCallum explores the deterioration of job quality due to “the decline of labor unions, the erosion of workplace protections, the rise of precarious employment, deindustrialization, and shifts in employer strategies designed to place more economic risk onto workers,” including the outsourcing of roles such as janitorial services. Unions, in contrast, not only strengthen economic and working conditions for their members, but also better connect members with each other across race, ethnicity, and class, thereby strengthening social ties.
Jamila Michener shares examples of how organizing broadly, and tenant organizing specifically, connects communities across demographic cleavages while enhancing democracy through real political wins that respond to their material interests, leading to a transformed economy.
Lessons from previous economic displacement programs
Lessons learned from prior periods of large-scale economic displacement and previous attempts at policy solutions to address it can shape the policies necessary to support workers today who face social and economic changes, such as the effects of AI on the labor market. In his essay, Jacob Leibenluft uses the example of the Trade Adjustment Assistance program to explore lessons learned from previous trade-based economic displacement and what policymakers should do differently to respond to large-scale economic change.
The essays in this series underscore a variety of economic and cultural shifts that have made people anxious about their status and the broader economy in the United States and around the world, which research shows influence their voting behaviors. Additionally, one of our assumptions going into this project, which was supported by the research, was that threats to democracy also threaten shared prosperity, and vice versa.
It is possible to reverse the trend of rising support for authoritarian populism, but doing so requires economic policies to be designed in ways that support economic security, push back against demographic cleavages, and rebuild the social and political fabric that connects us to each other. Economic policies also must be assessed based on their ability to strengthen support for democracy and ensure a dynamic economy in which workers and families can thrive.
Did you find this content informative and engaging? Get updates and stay in tune with U.S. economic inequality and growth!
Climate policy uncertainty is stagflationary, behaving like a supply shock. When climate policy uncertainty rises, output, investment, and employment fall, and prices rise.
Climate policy uncertainty also shapes firm-level behavior, with firms postponing investment, scaling back production plans, and reducing R&D expenditures in times of greater uncertainty, suggesting firms view climate policy uncertainty as a material financial risk.
Overview
Recent policy developments in the United States highlight just how quickly climate policies can change. In January 2026, the U.S. Environmental Protection Agency announced that it would stop considering lives saved when setting rules on air pollution. Also this year, the agency overturned its own 2009 endangerment finding—the legal basis for regulating greenhouse gas emissions under the Clean Air Act of 1963.
These developments are emblematic of a broader pattern of policy reversals and debates over climate regulations in recent years. Such shifts in climate policies create uncertainty about the future direction of climate regulations. This uncertainty may affect the U.S. economy in ways that go beyond the direct effects of any particular regulation.
In a new paper, “The Macroeconomic Effects of Climate Policy Uncertainty,” by me and my co-authors Konstantinos Gavriilidis at the University of Stirling, Ramya Raghavan at Northwestern University, and Jim Stock at Harvard University, we study how uncertainty about climate policies affects the U.S. macroeconomy.
Our central finding is that uncertainty in climate policymaking behaves like a supply shock: Increases in uncertainty reduce output, investment, and employment while simultaneously pushing prices upward. This contrasts with other types of uncertainty shocks, which tend to propagate as aggregate demand shocks, moving output and prices in the same direction. We also find strong firm-level responses: Investment and R&D expenditures fall, with larger declines when firms have greater exposure to climate change.
We define climate policy uncertainty as a lack of clarity and predictability about government actions to address climate change and related regulations. Measuring such policy uncertainty is very difficult. To overcome this challenge, we develop a news-based approach. We construct a dataset combining information from millions of news articles published in major U.S. newspapers since the mid-1980s. We identify articles that discuss uncertainty related to climate policies—such as debates over legislation, regulatory reversals, or shifts in international commitments—and aggregate them into a monthly index. The resulting index spikes around major policy events and captures movements that are largely distinct from broader economic policy uncertainty. (See Figure 1.)
Figure 1
Estimating the macroeconomic effects of climate policy uncertainty presents another challenge because movements in uncertainty may themselves be driven by economic conditions or other policy news. To isolate causal effects, we construct a narrative instrument based on 146 historically significant U.S. climate policy events that plausibly shifted uncertainty for reasons unrelated to the current state of the economy. Uncertainty rose sharply in 2009, for example, with the introduction of the Waxman-Markey American Clean Energy and Security Act, which proposed a national cap-and-trade system but faced an uncertain legislative path. Uncertainty also increased in June 2017, when the United States announced its withdrawal from the Paris Climate Agreement, creating ambiguity about the country’s long-run climate commitments.
An additional complication arises because policy news often contains two elements: information about the direction of policymaking (for example, whether regulation is tightening or loosening) and information about the uncertainty surrounding such policy changes. In many settings, these components move together—for instance, bad economic news often increases uncertainty. In the climate policy context, however, policy changes can either resolve or exacerbate uncertainty, depending on their credibility and permanence.
A clear and credible policy announcement, for example, may reduce uncertainty, even if it tightens a regulation. Conversely, contested or reversible policies may increase uncertainty even when they loosen regulations. We exploit this feature to separate the uncertainty component from changes in expected policy stringency. For instance, uncertainty rose both with the introduction of the Waxman-Markey cap-and-trade proposal in 2009 and with the U.S. withdrawal from the Paris Climate Agreement in 2017, even though these events implied opposite directions for future U.S. climate policy.
Using this instrument in a semi-structural model of the U.S. economy, we estimate the macroeconomic effects of a shock increasing climate policy uncertainty. We find that higher climate policy uncertainty leads to declines in output, investment, and employment. Greenhouse gas emissions also fall, largely reflecting the reduction in economic activity. At the same time, prices rise. (See Figure 2.)
Figure 2
These responses indicate that climate policy uncertainty propagates as an aggregate supply shock. When firms become uncertain about the future regulatory environment, they postpone investments, scale back production plans, or adopt more cautious production strategies to hedge against possible regulatory changes. At the same time, uncertainty raises expected future production costs due to the risk of stricter emissions standards or higher compliance costs. These responses reduce productive activity while putting upward pressure on prices, generating the combination of lower output and higher inflation—the classic definition of stagflation.
The results also reveal substantial effects at the firm level, with meaningful impacts on firms’ employment, investment, and R&D expenditures. This suggests that companies view climate policy uncertainty as a material financial risk. The effects are particularly pronounced when firms are more exposed to climate-related risks.
The findings from our paper have important implications for policymakers. Because climate policy uncertainty is stagflationary—reducing economic activity while raising prices—it creates a difficult trade-off for monetary policymakers. Central banks facing such shocks cannot simultaneously stabilize inflation and output as easily as they can in the case of demand-driven economic downturns.
More broadly, our results suggest that the macroeconomic consequences of climate policymaking extend beyond the direct effects of regulation. Uncertainty about the future path of climate policymaking can itself be a significant source of economic fluctuations. For policymakers, this highlights the importance of clear and credible policy frameworks that reduce uncertainty about the long-term trajectory of climate policies.
Did you find this content informative and engaging? Get updates and stay in tune with U.S. economic inequality and growth!
Millions of U.S. families must comply with asset limits set at the state and federal level to participate in essential public benefit programs, from health care to nutrition assistance, in times of need.
Research suggests that asset limits can discourage households from accumulating sufficient emergency savings, resulting in increased economic instability and higher demand on public benefit programs.
New asset-building programs, such as Trump Accounts, will need to contend with the ways in which asset limits could be at odds with the goals of the program if not properly defined.
Overview
A household’s assets, or its overall wealth, are the resources required to ensure its family members can weather the financial disruption when unexpected expenses emerge. Yet many U.S. households do not have enough assets to adequately cover these challenges. Consider that in 2024, only 63 percent of adults reported they could cover an unexpected and hypothetical $400 emergency expense, according to the Federal Reserve Board. This is all the more alarming as preliminary research suggests that 1 in 4 U.S. families may suffer an income disruption in a given year and that low savings is not just an issue for low-income families.
When households experience moments of financial volatility, public benefit programs—specifically means-tested government transfer programs—can serve as a triage for their economic emergency, supporting economic security and staving off worse outcomes, including eviction or hunger. Yet asset limits imposed by state and federal policymakers to restrict access to these essential programs, from health care to nutrition assistance, prevent millions of U.S. families from accessing the assistance they need. These asset limits often work against the stated goals of the programs that utilize them, undermining economic security rather than enabling economic mobility.
This factsheet provides an overview of asset limits and the types of programs that utilize them, reviews some of the research on the impacts of asset limits, and closes with considerations for policymakers.
What are asset limits?
At first glance, asset limits appear relatively straightforward. They are cumulative financial resource thresholds, and if households fall above these limits, then they are restricted from accessing some of the public benefit programs that are meant to help Americans weather economic hardships. Programs such as Supplemental Security Income and the Supplemental Nutrition Assistance Program, for example, require detailed information about household finances, including total income and assets, for people to participate and receive benefits.
In practice, however, asset limits can be complex to calculate and are specific and distinct for each public benefit program that uses them. Typically, a program considers a household’s total financial resources, but many programs exempt owner-occupied homes, retirement savings, and any income received from other public benefit programs.
Cash benefits received from the Supplemental Security Income program or the Temporary Assistance for Needy Families block grant, for example, do not count toward a family’s SNAP resource limits. But depending on the program and state, a household’s motor vehicle may be included in the asset limit, even though it is an illiquid asset and often necessary for keeping and maintaining employment.
There also can be income limits paired with asset limits. Income limits vary by program and can be adjusted based on household size. The aforementioned Texas TANF program features similarly low income limits alongside its low asset limits: To remain eligible for benefits, a single mother with two children cannot exceed a monthly maximum income of $188 to be eligible for a maximum benefit of $382 a month.
These stringent financial limits often are in addition to strict and time-consuming administrative requirements to enroll and remain in the program.
Which programs use asset limits?
A range of public benefit programs use asset limits, impacting tens of millions of Americans. Some programs allow states to set or adjust asset limits, such as Temporary Assistance for Needy Families, for which limits can range from $1,000 in Texas to $10,000 in Delaware, and the Low-Income Home Energy Assistance Programs that select states have chosen to implement.
Meanwhile, the Supplemental Nutrition Assistance Program has a federal asset limit that states are allowed to raise or eliminate if they utilize other eligibility requirements of related programs. For Supplemental Security Income and Medicaid, the federal government sets the asset test—though the Affordable Care Acteliminated the Medicaid asset test for adults younger than 65 who live in the 41 states that expanded the program when the law was enacted. SSI asset limits are often the most restrictive of all public benefit programs and were most recently raised in 1989. If the original resource limit of $1,500, introduced in 1972, were adjusted for inflation, it would be more than $10,000 in 2026 dollars, or five times the current level, according to this author’s calculations.
Why do programs use asset limits?
Policymakers use asset limits to narrowly target the population eligible for a program so as to balance need with administrative capacity and resources. Asset limits are intended to ensure that households that have lots of assets, or high levels of wealth, but low or no monthly income on paper are not able to access these programs.
Yet, in practice, asset limits are so low for most programs that they exclude those households with even modest assets. This often means that asset limits for many programs have been set below the amount most households would need to handle many urgent and unexpected expenses, eliminating their ability to absorb such expenses without increased material hardship and prolonging their reliance on public benefit programs.
What does the research say about asset limits?
Much of the research on asset limits describes the complexity of asset limits and how it confuses families, limits access to programs, and prevents families from accumulating savings. Let’s consider each effect in turn.
Confusion about asset limits
Research funded by the U.S. Department of Agriculture suggests that confusion about asset limits can contribute to families limiting their assets to very low levels to ensure eligibility. This comports with qualitative research that suggests TANF asset limits contribute to lower rates of savings among TANF participants due to the belief that the limits are lower than they actually are.
The same USDA-funded research suggests that SNAP asset limits contribute to reduced emergency savings and reduced financial-services sector participation, such as having a bank account.
Reductions in financial stability
When states eliminated asset tests for program participation, the USDA study found that it led to increases in both the number of low-income households with a bank account and the number of program recipients with bank balances higher than $500.
State program administrators also have asserted in interviews that asset limits in practice required individuals who were income-eligible but above the asset threshold to spend down their assets. This results in households that were more economically vulnerable to material hardship and increased the length of their participation in public benefit programs.
Limiting access to public benefit programs
Asset limits can limit access to public benefit programs and contribute to program churn, or when a household enrolled in a public benefit program exits the program and then re-enrolls. Even a modest financial surprise, such as a lawsuit settlement, a tax return, or a few late child support checks, can trigger a program’s asset limits, resulting in churn despite the household’s unchanged underlying economic situation.
Program churn is associated with increased programmatic expenses and high costs for the families that lose access to program benefits. Three cases in point:
When Virginia eliminated the asset limit for its TANF program in 2003, only 40 additional families gained eligibility for the program. The state forecasted that if all of the newly eligible families enrolled in the program, it would still produce a net savings for the state of $195,850 due to reductions in administrative staff time, despite increased enrollment.
When Iowa eliminated the SNAP asset limit test and raised its gross income limit to 160 percent of the federal poverty line (up from 130 percent), it anticipated it would save more than $700,000 on administrative costs.
When Oklahoma eliminated an asset test for Medicaid eligibility in 1997, by 2001, the state estimated it had saved $1 million by slashing administrative spending on the verification of assets, from $3.5 million to $2.5 million.
Considerations for policymakers
Congress recently presented an opportunity to reconsider the appropriate use of asset limits in public benefit programs through the passage of H.R. 1, in which it established asset-building accounts for children with initial funding of $1,000 that can be invested in the stock market. These so-called Trump Accounts, unlike other child savings accounts, are not explicitly excluded from public benefit programs’ asset limits. Households may take advantage of this new asset-building opportunity not knowing that doing so could impact their ability to partake in other public benefit programs.
Without further clarification, this new program will demand attention from policymakers, as families navigate the ins and outs of its interaction with their public benefits. Policymakers also should consider the advantages of incentivizing asset building and encouraging family economic security, as well as the risks of increased program costs and household disruptions when overly stringent material tests lead to program churn or force families to deplete emergency savings.
In the end, policymakers must assess whether asset limits, as currently enacted, do in fact support the stated goals of the programs that utilize them. If a program’s goal is to bolster the long-term self-sufficiency of its participants, then it should not penalize families for accumulating enough savings to cover emergency expenses in 1989 dollars—let alone in 2026, after nearly 40 years of accumulated inflation.
Did you find this content informative and engaging? Get updates and stay in tune with U.S. economic inequality and growth!
Over the course of U.S. history, policymakers have imposed tariffs on imported goods numerous times. A new study examines how these trade policy choices have impacted the U.S. economy, finding that tariffs tend to shrink the economy, depress manufacturing activity and wages, increase prices, and suppress exports.
Monetary policies have played a key role in shaping how tariff shocks propagate throughout the U.S. economy, with the shift away from the gold standard in the late 20th century marking an inflection point in how tariffs affect workers and the broader economy.
This paper makes an important contribution to the econometrics and economic history literature by using a structured, narrative-based method to identify tariff policy decisions driven by factors unrelated to economic conditions.
Overview
U.S. policymakers have enacted tariffs for a variety of reasons over the course of the country’s history. Motivated by economic pressures to raise federal revenues or address balance-of-payment issues, or by ideological support for protectionism or open trade, policymakers have revised tariff and trade policies dozens of times since the mid-19th century.
Today, import duties enacted by the second Trump administration have pushed U.S. tariff rates to levels unseen since the early 20th century and have renewed interest in the economic effects of trade policymaking. Evidence suggests the current tariff regime is pushing up prices for businesses and consumers and producing a drag on investments and hiring in impacted industries, while providing a modest additional source of revenue for the federal government. But how does the current tariff regime compare to trade policy actions in U.S. history, and what can we learn from the past?
The rich history of U.S. trade policy, featuring large swings in real tariff rates over time, is analyzed in a new working paper from Tamar den Besten and Diego R. Kanzig, both at Northwestern University, called “The Macroeconomic Effects of Tariffs: Evidence From U.S. Historical Data.” The authors find that, historically, tariff increases cause a drag on economic growth, resulting in an immediate reduction of imports and a lagged decline in exports while pushing down total Gross Domestic Product, including manufacturing activity and compensation for manufacturing workers.
The authors show that these tariff effects transmit through both supply-side and demand-side channels. On the supply side, they find that higher import and input costs cause an immediate decline in imports and put upward pressure on prices domestically. Tariffs also produce a decline in aggregate demand, causing U.S. exports to shrink and putting downward pressure on prices at home, offsetting the immediate inflationary impact of tariffs.
Overall, across the previous 185 years of U.S. history, the authors find that tariffs have, on average, caused prices to rise, though shifts in monetary policy conditions over time, such as the transition from a gold-backed to fiat currency, have muted the price effect.
A new historical tariff-shock dataset
To reach these conclusions, den Besten and Kanzig apply a well-established approach to analyzing policy changes that teases apart the motivations for past tariff policies, isolating only the policy shifts that are driven by ideological or other reasons unrelated to current or anticipated economic factors. This approach is used to address the problem of endogeneity—that is, the effects of an economically driven tariff that are are impossible to separate from the effects of the underlying economic reason itself. In other words, policymakers can establish tariffs for economic or ideological reasons, but only ideologically driven tariffs are truly exogenous and thus able to be studied.
To produce a dataset of only exogenous tariff policy changes, the authors parsed the historical record to determine the motivations of these trade policy choices from 1860 through the end of the first Trump administration, producing a novel “narrative tariff shock series.” The authors divide U.S. tariff history into three broad periods:
The revenue period: roughly 1790–1860, when tariffs were used mostly to shore up federal government finances
The protectionist period: 1861–1933, characterized by high and volatile tariff rates established to shield domestic industries
The reciprocity period: from 1934 onward, characterized by multilateral agreements reducing global trade barriers
This historical categorization is useful in understanding the motivations behind tariff increases. The protectionist era, for example, began around the advent of the U.S. Civil War, when the secession of 11 Southern states changed the political composition of the U.S. Congress, allowing protectionist Republicans to pass the Morrill Tariff in response to pressures on the federal budget. After the Civil War began, Congress enacted further tariff increases to shore up federal finances. And following the war, tariff policies shifted according to partisan control, with Republican administrations enacting or defending large protectionist tariffs and Democratic administrations pursuing tariff reductions.
As the authors note, these post-Civil War tariff oscillations illustrate “how similar economic conditions, marked by weak growth and high unemployment throughout much of the 1890s, led to opposite tariff responses depending on political majorities.” In short, the Civil War-era tariffs enacted in response to budget pressures are considered inextricably linked with economic conditions at the time, while the post-war tariff choices are considered motivated by ideological positions.
The role of monetary policy in attenuating inflation from tariffs
The two authors also draw a distinction between tariffs enacted before and after World War II to reflect a shift in monetary policy regimes across U.S. history. Before the war, the United States operated under a constrained monetary policy environment dominated by the gold standard. After the war, however, monetary policy became more autonomous and exchange rates more flexible, changing how tariff shocks propagated through the economy.
Under the gold standard, currency exchange rates were effectively fixed. This meant “real” exchange rates between countries could only change through shifts in relative domestic price levels. Under this paradigm, tariffs caused imports to fall and gold inflows to increase. This gold flow boosted the domestic money supply and pushed prices up.
Yet as countries shifted away from the gold standard and allowed exchange rates to float, tariffs began to impact their economies differently. Under this new regime, tariff increases caused the U.S. dollar to strengthen, weakening the competitiveness of U.S. exports and weighing on aggregate demand. These effects put downward pressure on prices, offsetting the upward price pressures caused by the tariffs themselves.
Splitting the narrative series between pre- and post-World War II tariff events shows a clear inflationary impact of tariffs in the gold standard era, compared to an insignificant price impact after the gold standard was abandoned in the late 20th century, due largely to a tariff-induced contraction in the U.S. economy.
Conclusion
Across the period of U.S. history studied in this paper, tariff increases caused an immediate and sharp reduction in imports followed by a lagged decline in exports, as GDP, aggregate demand, manufacturing activity, and production-worker compensation all contracted. Under some monetary conditions, the price effects of tariffs are muted, with higher import and input costs at least partially offset by the deflation caused by a tariff-induced economic contraction.
Across the entirety of U.S. history, however, tariffs have on average caused prices to rise for U.S. consumers. And tariff increases are generally ineffective at achieving their primary goal of protecting domestic industry and improving conditions for U.S. workers. Policymakers in the current environment should keep these historical lessons in mind as they navigate the current tariff regime.
Did you find this content informative and engaging? Get updates and stay in tune with U.S. economic inequality and growth!
Across a range of metrics, U.S. economic performance in 2025 was quite similar to 2024, with a weaker labor market.
U.S. GDP grew just 2.2 percent, while new job creation almost disappeared, hiring declined, unemployment grew, wages went down, and inflation did not meaningfully go down.
Americans also expressed much disappointment and frustration with the state of the economy, even more so than in recent years.
Overview
President Donald Trump will soon give his annual State of the Union speech before Congress, one year into his second term in the White House. Ahead of his remarks, now is a natural moment to take stock of the U.S. economy over the past year, looking at various metrics of economic well-being and how they compare to recent years. (See Table 1.)
Table 1
The bottom line is that overall economic performance in 2025 was, in many ways, similar to 2024, with certainly no meaningful improvements but also very little notable deterioration except in one key area: the U.S. labor market, which was certainly weaker in 2025 than in 2024 and which bears the most watching as we enter 2026. Despite relatively similar overall economic performance, Americans reported a lot of disappointment and frustration with the economy, even more than in previous years. This disappointment might reflect the weaker labor market, the lack of major improvement in inflation, widening inequality, or some combination of those and other factors.
It is important to clarify that no single metric or number can fully capture something as complex, diverse, and ever-changing as the U.S. economy. Instead, we can only do our best to measure certain aspects of the economy and be sure to include metrics that reveal different important characteristics. Too often, economic analyses try to boil the economy down to just one number—typically Gross Domestic Product or the Dow Jones stock market index—but those measures cannot come close to fully describing the experience that most people have within the U.S. economy. As analysts take stock of U.S. economic performance in 2025, it is certainly important to use topline descriptive aggregates, but they also should look more closely at things such as prices, wages, and jobs, which tend to be more characteristic of how people actually interact with the economic ecosystem around them.
Additionally, even considering multiple economic data points and metrics, we should remember that the United States is a big country. Even if something is true “on average” or at the median, it may not be true for millions of people.
With that, let’s turn first to how the overall economy fared in 2025.
Overall economic growth
The U.S. Bureau of Economic Analysis reported that total real (that is, adjusted for inflation) economic growth in 2025 was just 2.2 percent. That means total economic growth actually decelerated a bit from 2024’s rate of 2.4 percent. That said, last year’s growth was a bit higher than some projections of GDP growth at the beginning of 2025. In January 2025, for example, the Congressional Budget Office projected just 2.1 percent growth in 2025.
Yet overall growth, while important, is not a sufficient marker of economic health, even when it is robust, if that growth does not result in improvements in living standards for most Americans. And while it will be some time before we know for sure how growth in 2025 was distributed among the overall U.S. population, the metrics described below indicate that the benefits of last year’s somewhat tepid growth were not widely shared.
The U.S. labor market
The vast majority of U.S. workers earn their income through employment. The GDP growth number means little to everyday workers if it does not translate into better job opportunities. Unfortunately, as mentioned above, this is the one major economic area that noticeably deteriorated in 2025. New job creation almost entirely disappeared, hiring declined slightly, and the unemployment rate crept up.
In 2024, the U.S. economy added about 1.5 million new jobs, a significant slowdown from 2023’s total of 2.5 million but still very robust. While forecasters expected that job growth in 2025 would be lower than in 2024—the Congressional Budget Office, for example, forecast about 900,000 new jobs would be created in 2025—the actual total for last year was fewer than 200,000 jobs, according to the Bureau of Labor Statistics. To put that into context, 2025 saw the slowest job creation in a nonrecession calendar year in more than two decades.
Not surprisingly, other metrics that look at aspects of the labor market also softened in 2025. The rate at which employers hired new employees dropped in 2025 to 3.3 percent, down slightly from the 3.4 percent rate at the end of 2024. The hiring rate in both 2024 and 2025 was lower than it was before the COVID-19 pandemic hit the economy in 2020. Just as concerning, the overall unemployment rate ticked up over the course of 2025 to reach 4.4 percent by the end of the year. That was 0.3 percent higher than in December 2024.
Not every measure of the labor market pointed downward, however. There were some measures that slightly improved, such as the prime age employment-to-population ratio, or the total percentage of workers between the ages of 25 and 54 who are employed. That rate slightly increased from 2024 and remains higher than pre-pandemic levels.
Nevertheless, such low job creation, weak hiring, and creeping unemployment paint a picture of a job market that is all but frozen. Though 2025 did not see massive job losses, those workers looking to upgrade or get back to work likely found a frustrating dearth of opportunities.
Income and wages
Most people’s experience of the economy boils down to their own bottom line, which is largely defined by household income. Given that most people’s incomes are tied to their jobs, and that the job market weakened last year, it is no surprise that labor income also weakened in 2025.
At a very high level, total employee compensation growth—including both wages and other employee benefits such as health care coverage—was 3.4 percent in 2025, down from 3.7 percent in 2024. Yet workers tend to be more sensitive to changes in wages and salaries than overall compensation. Average hourly wage growth for nonsupervisory workers declined very slightly in 2025, compared to 2024 rates. The degree of the decline depends on the measure of inflation, but both of the most common metrics reveal a slight deterioration in real wage growth over 2025.3
Other metrics also suggest that real income growth declined in 2025. Median weekly earnings growth dropped to just 0.7 percent in 2025, compared to twice that in 2024. And annual real disposable income growth—that is, the money households have after expenses and taxes are taken out—dropped to just 0.4 percent in 2025.
These metrics suggest that workers did not enjoy robust income growth last year, and that many people actually experienced a noticeable slowdown in compensation over the course of 2025 compared to previous years.
Prices
Price growth does not appear to have meaningfully moderated in 2025. Certainly, progress toward reducing inflation fell far short of expectations. Of course, there are many ways to measure inflation and price changes, but, by and large, economists tend to use two main metrics: the Consumer Price Index for urban consumers and the Personal Consumption Expenditures price index. Both of these main metrics declined slightly in 2025, compared to 2024.
Unfortunately, in 2025, these two measures pointed in slightly different directions. Indeed, according to the Consumer Price Index, the rate at which prices increased in 2025 was slightly slower than in 2024. Specifically, this index says price growth declined to 2.7 percent in from 2.9 percent in 2024.4 Yet according to the Personal Consumption Expenditures index, in 2025, overall inflation was 2.9 percent, up slightly from 2024’s rate of 2.7 percent.
Both metrics, despite pointing in slightly different directions, suggest that there simply was not a lot of progress made toward reducing inflation in 2025. Furthermore, two additional dark spots should be noted. First, progress on inflation in 2025 was substantially worse than expected by forecasters. In January 2025, the Congressional Budget Office projected that 2025’s inflation rate would be 2 percent and 2.2 percent, using CPI and PCE respectively. By that standard, 2025 was a clear and significant disappointment.
The other important note when it comes to prices is that while the inflation rate dipped on average in 2025, there are some notable goods to which consumers are particularly sensitive that actually saw inflation accelerate. The inflation rate for food at home, for example, went up from 1.7 percent in 2024 to 2.4 percent in 2025. Health care inflation also accelerated compared to the previous year.
Of course, other goods and services improved significantly over 2024, but it is notable that some of these very-high salience costs did not. After housing and transportation, food and health care are two of the largest household expenditures on average. Without robust wage growth, increased costs in these specific areas might help explain why American families are feeling squeezed.
Americans aren’t happy with the state of the economy
One really striking feature of the U.S. economy in 2025 is the degree to which U.S. consumers soured on it. Of course, as has been widely discussed, it is not as if Americans were thrilled about the state of the economy going into 2025. Indeed, consumer sentiment at the end of 2024 was much lower than it had been prior to the COVID-19 pandemic, according to the University of Michigan survey of consumer sentiment, but it was slightly better at the end of 2024 than it had been in 2023. Over the course of 2025, however, consumer sentiment absolutely cratered, dropping a whopping 33 percent to one of the lowest levels ever recorded.
To some degree, this extreme frustration can be difficult to fully explain. The overall economy did not deteriorate nearly as much as the consumer sentiment numbers might suggest. But economic policymakers must grapple with the fact that Americans have been sour on the economy for several years, even as it recovered strongly from the COVID-19 pandemic and recession.
Perhaps the collapse in consumer sentiment in 2025 is tied to the slowdown in the labor market, combined with little progress on easing inflation. Or perhaps it reflects the fact that many people did not end the year with much more disposable income than they had in 2024. Or perhaps it reflects disappointment with the actual outcomes, compared to expectations. It also could be all of these things, along with many other factors that these metrics do not capture.
Regardless, a fair look at the state of the U.S. economy in 2025 reveals that it was not significantly different from the economy in 2024—certainly not better, but also not much worse. Though the labor market especially seemed to struggle, the most glaring weakness, in some ways, is the simple fact that the American people are furious about economic conditions going into 2026.
Did you find this content informative and engaging? Get updates and stay in tune with U.S. economic inequality and growth!
Women face more constraints on their paid labor in the United States than men. One constraint is geographical—for example, women are less likely than men to accept nonlocal employment, a disparity that grows with the presence of children.
A new study finds that remote work can help attenuate these mobility constraints for working mothers and keep them in the labor force, especially in cities with long commute times and high traffic congestion.
The effect of remote work is largely limited to women with higher levels of education, who tend to work in industries in which remote work and other flexible work arrangements are more accessible, offering them opportunities to balance their professional and personal responsibilities.
Since the late 1990s, however, women’s labor force participation has plateaued, contributing to a slow-down in the convergence of economic outcomes between men and women. A growing body of literature in economics emphasizes the role of persistent constraints on women’s paid work in determining long-lasting gender differences in employment and wages in the United States.
In a recent working paper, we expand on the existing literature by documenting and explaining the significant heterogeneity between U.S. mothers with different levels of education in terms of the impact of commuting time on their labor force participation—a phenomenon we refer to as the “congestion child penalty.” We find that college-graduate mothers’ labor force participation rate is not affected by traffic congestion, while long commute times have a large negative effect on the labor force participation rate of mothers with no college education. In fact, we show that even small increases in commuting times of approximately 3.5 minutes per commute decrease the labor force participation rate of non-college-educated mothers by up to 2.6 percentage points.
One potential explanation for the heterogeneity in the congestion child penalty between working mothers with different educational backgrounds is unequal access to remote work. Remote work can enable employees with children to reconcile family responsibilities and paid work without paying the monetary and time costs of commuting. As such, the availability of remote work in jobs typically performed by highly educated workers could shield the labor supply of college-graduate mothers from the negative impact of long commuting times.
At the same time, mobility constraints may be difficult to overcome for non-college-educated mothers, who seldom have access to remote work, especially in geographical areas characterized by long commuting times. Consequently, some of these women may be forced to drop out of the workforce.
We analyze time-use microdata for the United States to provide evidence that access to remote work likely protects the labor force status of highly educated mothers in geographical areas characterized by long commute times. We document that college-graduate women are more likely than women with lower levels of education to be employed in jobs that can be performed remotely. They also work more daily hours from home and are more likely to work fully remotely.
These differences increase in highly congested metropolitan areas, where we find that college-graduate women rely on remote work more intensely. In these areas, college-graduate working women also spend more time per day working while simultaneously providing care to other household members.
These findings suggest that when the time cost of commuting is especially high, remote work may help women with access to this type of flexibility to reconcile their paid work with their housework and caregiving responsibilities. Among working mothers with no college degree—who are more often employed in inflexible jobs—however, reliance on remote work does not change with higher rates of congestion.
Our paper contributes to the ongoing debate regarding the possibility that structural changes in the organization of work, and the shift toward remote work induced by the COVID-19 pandemic, may be beneficial for women’s labor force participation. We also contribute to the literature studying the varied effects of remote work. The availability of remote work has been shown to increase workers’ satisfaction, decrease workers’ quit rates, and foster firms’ ability to hire or retain female workers. Our findings suggest that remote work can indeed alleviate mothers’ mobility constraints and shield them from the time costs of commuting, thus encouraging their labor force participation, especially in highly congested metropolitan areas.
The beneficial effects of remote work, however, may only be experienced by women working in certain industries and in jobs that can be performed remotely—typically employing mostly highly educated workers. To the extent that women with lower levels of education remain disproportionately represented in jobs that require frequent in-person interactions, such as those in the food-service industry or in retail, their labor supply may remain subject to the mobility constraints that long commute times exacerbate, especially for those who take on the lion’s share of caregiving and housework within their families.
—Ilaria D’Angelis is an assistant professor of economics at the University of Massachusetts Boston. Keren Horn is an associate professor of economics at the University of Massachusetts Boston.
Did you find this content informative and engaging? Get updates and stay in tune with U.S. economic inequality and growth!
Food stamps, now known as the Supplemental Nutrition Assistance Program, provide income support for 42 million Americans to meet their nutritional needs and reduce hunger and food insecurity.
A recent study looks at how the rollout of food stamps in the 1960s and 1970s affected political polarization and voting behavior, finding that White adults at the time of the program’s implementation were more likely to be registered Republican in 2020 than Black or Hispanic adults, who were more likely to be registered Democrat or Independent.
The study shows that nutrition assistance and other social insurance programs offer essential support, not just to those who receive it directly but also to their local economies, which reap the benefits of cash flowing through stores, farmers markets, and other small businesses.
Overview
On January 31, 1964, President Lyndon B. Johnson requested that Congress pass federal legislation to make the Food Stamp Program permanent. Up to that point, the program had operated as a pilot in select counties and states, serving about 380,000 participants.5 The Food Stamp Program expanded dramatically in the ensuing decades, driven largely by a recognition of domestic hunger. It has also undergone many changes—notably 2008 legislation that changed the name to the Supplemental Nutrition Assistance Program, or SNAP, in part to fight the politicized stigma of receiving food assistance.
Today, the program is without a doubt one of the most effective food assistance programs in reducing food insecurity and poverty across the United States. The U.S. Census Bureau reports that supplemental nutrition assistance lifted nearly 3.6 million people out of poverty in 2024, the most recent year for which full data are available.6
What’s more, every dollar in SNAP benefits generates about $1.50 in economic activity, as recipients spend their benefits at grocery stores, farmers’ markets, and small businesses.7 This ripple effect strengthens communities, keeping businesses open and workers employed.
Looking solely at the data, it would seem the anti-hunger program would be viewed by the vast majority of U.S. voters as a practical solution that helps families put food on the table while also supporting local economies. After all, the vast majority of SNAP recipients are children, seniors, and people with disabilities, not the able-bodied adults who are often misrepresented as the main beneficiaries in political debates. And many rural communities, which tend to vote conservatively, rely heavily on this nutrition assistance, with some of the highest SNAP participation rates found in states that lean Republican.8
Yet in spite of its broad social and economic benefits, food assistance has been a politically contested issue ever since it was enacted more than five decades ago, often shaped by ideological and racialized narratives. This polarization persists today, exemplified by the massive cuts to the Supplemental Nutrition Assistance Program in the 2025 Republican budget reconciliation bill (commonly referred to as the “One Big Beautiful Bill Act”) that was passed by the 119th U.S. Congress and signed into law by President Donald Trump in July 2025).
In new research, I, together with co-authors Troup Howard at the University of Utah and William Mullins at the University of California, San Diego, examine the process through which policy-based polarization emerges and persists over time.9 Using the historical expansion of the federal Food Stamp Program between 1961 and 1975 as a case study, we provide empirical evidence that the politicization of social welfare programs generated long-lasting shifts in voting behavior. Understanding this history and its persistence is essential to making sense of current debates over the Supplemental Nutrition Assistance Program.
The rollout of the new federal Food Stamp Program amid the Civil Rights Movement
The historical rollout of the Food Stamp Program provides a case study in how social and economic policies become polarized and how those divisions persist across generations. Political views on food assistance are emblematic of the deeply partisan divide over social insurance programs and racial attitudes, which consistently emerge as key fault lines in U.S. politics, reflecting deep-seated ideological and historical divisions.
Even though political polarization is often framed as a natural consequence of personal preferences and ideological sorting, such an interpretation overlooks the strategic role of political parties in shaping public perception for electoral advantage. We find that these behaviors persisted well beyond the first two decades—through 2020, as detailed in our research, and arguably even more so today.
The Food Stamp Program, now known as the Supplemental Nutrition Assistance Program, has played a critical role in the network of U.S. social programs for more than half a century. After state- and federal-level experimentation, the program was rolled out nationwide between 1964 and 1975 to combat food insecurity and improve nutrition among low-income Americans. The program currently supports 42 million people, including nearly 1 in 5 American children.10 Research consistently demonstrates its effectiveness in reducing poverty,11 stabilizing household food consumption,12 and improving long-term health13 and economic outcomes.14
The initial rollout of the Food Stamp Program coincided with a period of intense legal and political transformation, marked by the Civil Rights Act of 1964, the Voting Rights Act of 1965, and the broader dismantling of Jim Crow laws that legally discriminated against Black Americans across the South. In this context, the introduction of a federal food assistance program was not merely a policy shift but also became a political flashpoint.
Our analysis provides, to the best of our knowledge, the first causal estimates on the racial politicization of social programs. Using individual-level voting data, we find three key results:
The introduction of the Food Stamp Program heightened racial polarization in voting behavior.
This effect was strongest among individuals who were adults at the time of the rollout of the Food Stamp Program.
The resulting political divide persists in voter registration patterns and electoral outcomes today, more than a half a century later.
How the Food Stamp Program generated decades-long political polarization
When a government program is first implemented, voters are often uncertain about its long-term effects.15 This initial ambiguity provides political parties with an opportunity to shape public perception through strategic political moves, particularly in the early stages of a policy’s rollout. Politicians can change the narrative framing surrounding discussions about the program. Or they can steer political resources away from the program and bring into focus other politically polarizing issues. Or they can set agendas that cater to specific groups of voters in an effort to offset any political advantages the opposing party might be accruing from public discussion about the policy.
These are classic partisan political strategies, and we show in our research that political parties, recognizing the potential to consolidate their voter base, have incentives to selectively target different demographic groups with distinct messaging. Even when a policy itself does not explicitly favor one group over another, partisan political moves can amplify political divisions and solidify long-term realignments in voter preferences.
To implement our analysis, we used a comprehensive dataset covering the universe of U.S. voters as of 2020. We then compared the voting behavior between individuals who were adults when the Food Stamp Program was introduced in their county and those who were younger at the time. This methodology, which incorporates a rich set of fixed effects and demographic controls, including age, race, and gender, ensures that our findings are not driven by geographic variation, cohort effects, or broader shifts in political attitudes between 1960 and 2020.
The results reveal the lasting impact of the Food Stamp Program on partisan affiliations. White voters who lived through the Food Stamp rollout as adults were significantly more likely to be registered as Republicans—and less likely to be Democrats—in 2020, compared to White voters who were younger, especially those who were born in a world where the Food Stamp Program was already an established feature of U.S. social programs.
In contrast, Black and Hispanic voters who lived through the Food Stamp rollout as adults were significantly more likely to be registered as Democrats or Independents than Black and Hispanic voters who were younger. Racial polarization in partisan affiliations is an order of magnitude larger than electorate-wide effects, underscoring the extent to which food assistance became a racialized political issue.
Further analysis of voting behavior conditional on party affiliation reveals additional layers of polarization. Exposure to the rollout of the program increased the likelihood of White Republicans turning out to vote while simultaneously boosting turnout among Black and Hispanic Democrats. This divergence suggests that the politicization of food assistance not only influenced party registration but also reinforced voting engagement along racial and ideological lines.
Moreover, when focusing on individuals who registered to vote before the age of 25—a group likely to be more politically engaged—we observe even stronger effects, highlighting the formative role of early political experiences in shaping long-term partisan identity.
Taken together, these findings illustrate how social policy can serve as a catalyst for enduring political realignments. The case of the Food Stamp Program suggests that initial framing and partisan efforts can have consequences that extend well beyond the policy itself, shaping voting behavior for generations.
The program’s name shift in 2008 to the Supplemental Nutrition Assistance Program and its catchy acronym SNAP was intended to partially address this polarization that had developed over many decades. Beyond reducing the stigma associated with “food stamps,”16 the rebranding sought to counter the racialized and partisan narratives that had taken root during the program’s early rollout by emphasizing nutrition, work, and temporary assistance. By reframing food assistance as a modern, employment-adjacent social support rather than a form of welfare, policymakers aimed to make the program more politically durable amid persistent partisan scrutiny—even as the underlying political divisions documented in our analysis continued to shape debates over the program’s scope and funding.
How to bridge the partisan divide over the Supplemental Nutrition Assistance Program
As contemporary debates over social programs continue—not just about SNAP benefits but also in the context of the expansion of Medicaid in the Affordable Care Act of 2010 and the recent cuts to Medicaid in 2025—understanding the historical roots of this polarization is critical. The long-run political consequences of early policy framing should be a central consideration in both policymaking and electoral strategy. And the long-run economic fallout if partisan politics are successful in further diminishing social insurance programs could include substantial contractions in local economic activity as federal SNAP dollars are withdrawn from communities.17
To make discussions about SNAP benefits less partisan, it is important that views about the program become decoupled from partisan politics. Yet separating the program from political narratives and stereotypes can be challenging. SNAP is often misunderstood or misrepresented, but at its core, it is a practical program that helps families meet basic nutritional needs.
By focusing on the facts and the program’s broad benefits, as documented in this issue brief, Americans can move past partisan divides and recognize the Supplemental Nutrition Assistance Program for what it truly is—a bipartisan investment in food security, economic stability, and the well-being of U.S. families.
Did you find this content informative and engaging? Get updates and stay in tune with U.S. economic inequality and growth!
The Washington Center for Equitable Growth’s Inequality Tracker uses trusted government data sources to create several windows into income and wealth inequality in the U.S. economy.
The tracker subdivides both income and wealth by type, allowing users to explore how components of income or wealth have contributed to trends in the economy.
Limiting the tracker to discrete economic eras of the United States, such as a business expansion or contraction, can explain which parts of the economy drove growth over that period.
The tracker allows users to explore different groups so they can disambiguate whether changes in wealth or income were broad-based or particular to a section of the distribution.
Overview
The Washington Center for Equitable Growth’s Inequality Tracker is a data visualization tool designed to help policymakers and economic analysts examine and analyze U.S. income and wealth inequality in the 21st century. The Inequality Tracker is a flexible tool for exploring recent U.S. economic trends such as the recovery from the Great Recession of 2007–2009, the increasing share of transfers in income, and the lagging fortunes of the upper-middle class.
In this column, I will detail some useful lenses for analyzing the U.S. economy and recent economic policies with the tracker, including:
Thinking in components of income and wealth
Analyzing across the business cycle
Disaggregating groups to find the real winners
I will illustrate how the tracker helps with these approaches using graphics pulled directly from it, which you can get by pressing the download image button above each graph. You can also get the data for each graph that way, using the adjacent button.
Thinking in components of income and wealth
One of the most unique features of the Inequality Tracker is the ability to look at how components of income and wealth each contribute to the overall patterns in inequality over time. The first graph below, for example, shows the path of income growth for the ninth decile of households—the 80th to 90th percentile—over the full course of the dataset from 2000 to 2023. (See Figure 1.)
Figure 1
The ninth decile, and the three deciles below it, all experienced less income growth over these 23 years than U.S. households below them or above them. Why did this upper-middle segment of households fall behind in this period? Figure 1 shows that the vast majority of income growth for this group over this period came from growth in their wage incomes. Yet this does not indicate that this group had higher wage growth than other groups.
The second graph below shows the composition of income for the group selected and begins to shed some light on why the ninth decile fell behind. Here, we can see that wages make up about 80 percent of income for households in the ninth decile. (See Figure 2.)
Figure 2
As Figure 2 shows, households in this decile received almost all their income from wages, so gains from wages over this period must have lagged gains in other components of income. But perhaps wages grew unevenly across the income distribution, and upper-middle class households missed out.
To check, we can look at the third graph below, which shows the compound annual growth rate in each component of income for the group selected and some comparison groups. So, for instance, Figure 3 shows that wages grew relatively evenly across the distribution of households but slower than other components of income. (See Figure 3.)
Figure 3
Together, these three graphs explain why the upper-middle deciles of the income distribution saw income gains 10 percentage points lower than the bottom 50 percent and the top 10 percent. This group is extremely dependent on one component of income—wages—that grew similarly across income brackets and grew slower than other components of income.
Analyzing across the business cycle
The example above looked at the entire time series available in the Inequality Tracker, from 2000 to 2023. But trends across smaller time periods also can help us evaluate specific policy regimes.
One narrative that was frequently debated during the economic expansion from 2009 to 2019 was the idea that the labor market should be run hot to shift the balance of bargaining power between workers and employers and generate wage gains for low- and middle-income workers. This narrative was especially prominent in the middle part of the 2010s, as slow wage gains produced an anemic recovery from the Great Recession of 2007–2009.
This policy program was pursued to some degree both by the Federal Reserve, which maintained a relatively dovish stance through this period, and by lawmakers in Congress and the Obama administration. Stimulus included implementation of the Affordable Care Act starting in 2014 and payroll tax cuts in 2011 and 2012. These policies and market conditions created a tight labor market: U.S. unemployment dropped to its lowest level in more than 40 years and prime-age labor force participation recovered to the level of the early 2000s.
Let’s look at this era of the U.S. economy, and specifically at what I call the middle 40 percent—households between the 30th and 70th percentile on the income distribution. This group fits my mental model of the middle class. They get more than 50 percent of their income from wages and are mostly households with more than $50,000 but less than $100,000 of total annual income. The graph below shows the evolution of this group’s income from the start of the Great Recession in 2007 to the end of the expansion in 2019. (See Figure 4.)
Figure 4
There are two distinct eras of wage recovery for this group. Wages dipped dramatically during the recession and did not recover to 2006 levels until 2014. From 2014 to 2019, however, wages grew relatively quickly.
Next, we can look at the compound annual growth rate graph to get a sense of how wage growth in this period compares across the income distribution. Wages for the middle 40 percent group grew at an annual rate of about 3.7 percent in this time span, faster than comparison groups, although these groups also saw strong growth. (See Figure 5.)
Figure 5
Remember from the first example above that 3.6 percent is a much faster rate of wage growth than what was common over the entire period from 2000 to 2023, where no U.S. households saw more than 2 percent annual wage growth. So, from this second analysis, it looks as though running the labor market hot was fairly successful at boosting wages, and especially so for households outside the top 10 percent.
Did the hot labor market reduce inequality though? According to the next graph below, which shows the share of all income earned by the selected middle 40 percent group, this strong period of wage growth did not result in this group capturing significantly more of aggregate income. Indeed, from 2013 to 2019, this group’s share of aggregate income fluctuated very slightly, between 27.3 percent and 27.7 percent of all income. (See Figure 6.)
Figure 6
That’s the brutal math of inequality: Meaningful shifts in the distribution of income require large and sustained shifts in income growth.
Disaggregating groups to find the real winners
So far, we have looked at broad groups of households in the income distribution. Many households that are close in the distribution have similar outcomes in the U.S. economy, but the Inequality Tracker provides ample opportunities to disaggregate and look for exceptions.
Let’s briefly consider the distribution of wealth in the United States. Between 2000 and 2025, the share of all wealth earned by the top 10 percent of U.S. households in the distribution rose through about 2016, then declined through the COVID-19 pandemic of 2020–2023 before recovering somewhat in recent years. (See Figure 7.)
Figure 7
The Distributional Financial Accounts—data that we use to create the wealth side of the Inequality Tracker—allows us to further disaggregate this top 10 percent group, which shows that there is actually considerable heterogeneity within the group. The 90th to 99th percentile of households follow a similar pattern as the top 10 percent through about 2010. After that, the two groups diverge. This group’s wealth as a share of total wealth has declined consistently since 2010. (See Figure 8.)
Figure 8
The only possibility to explain this discrepancy is that the top 1 percent of households is pulling away from the next 9 percent. Figure 9 verifies that top 1 percent’s wealth has continued increasing as a share of total wealth, with a slight dip around the time of the COVID-19 pandemic. (See Figure 9.)
Figure 9
Further exploration with the Inequality Tracker shows that this trend is attributable in large part to the higher share of equities in the wealth of the top 1 percent of households and high growth in equity wealth for that group compared to others.
Conclusion
The Federal Reserve’s Distributional Financial Accounts and the U.S. Bureau of Economic Analysis’s Distribution of Personal Income data series are important new tools for understanding the U.S. economy. Equitable Growth’s Inequality Tracker provides windows onto the data that you can use to think about how inequality is changing in the United States, how a component of wealth or income is performing relative to other components, how the composition of wealth and income is changing over time, and more. You can do even more by analyzing the official data yourself, but we hope the tracker will prove to be a useful jumping off point for developing intuition about the movement of income and wealth in the U.S. economy.
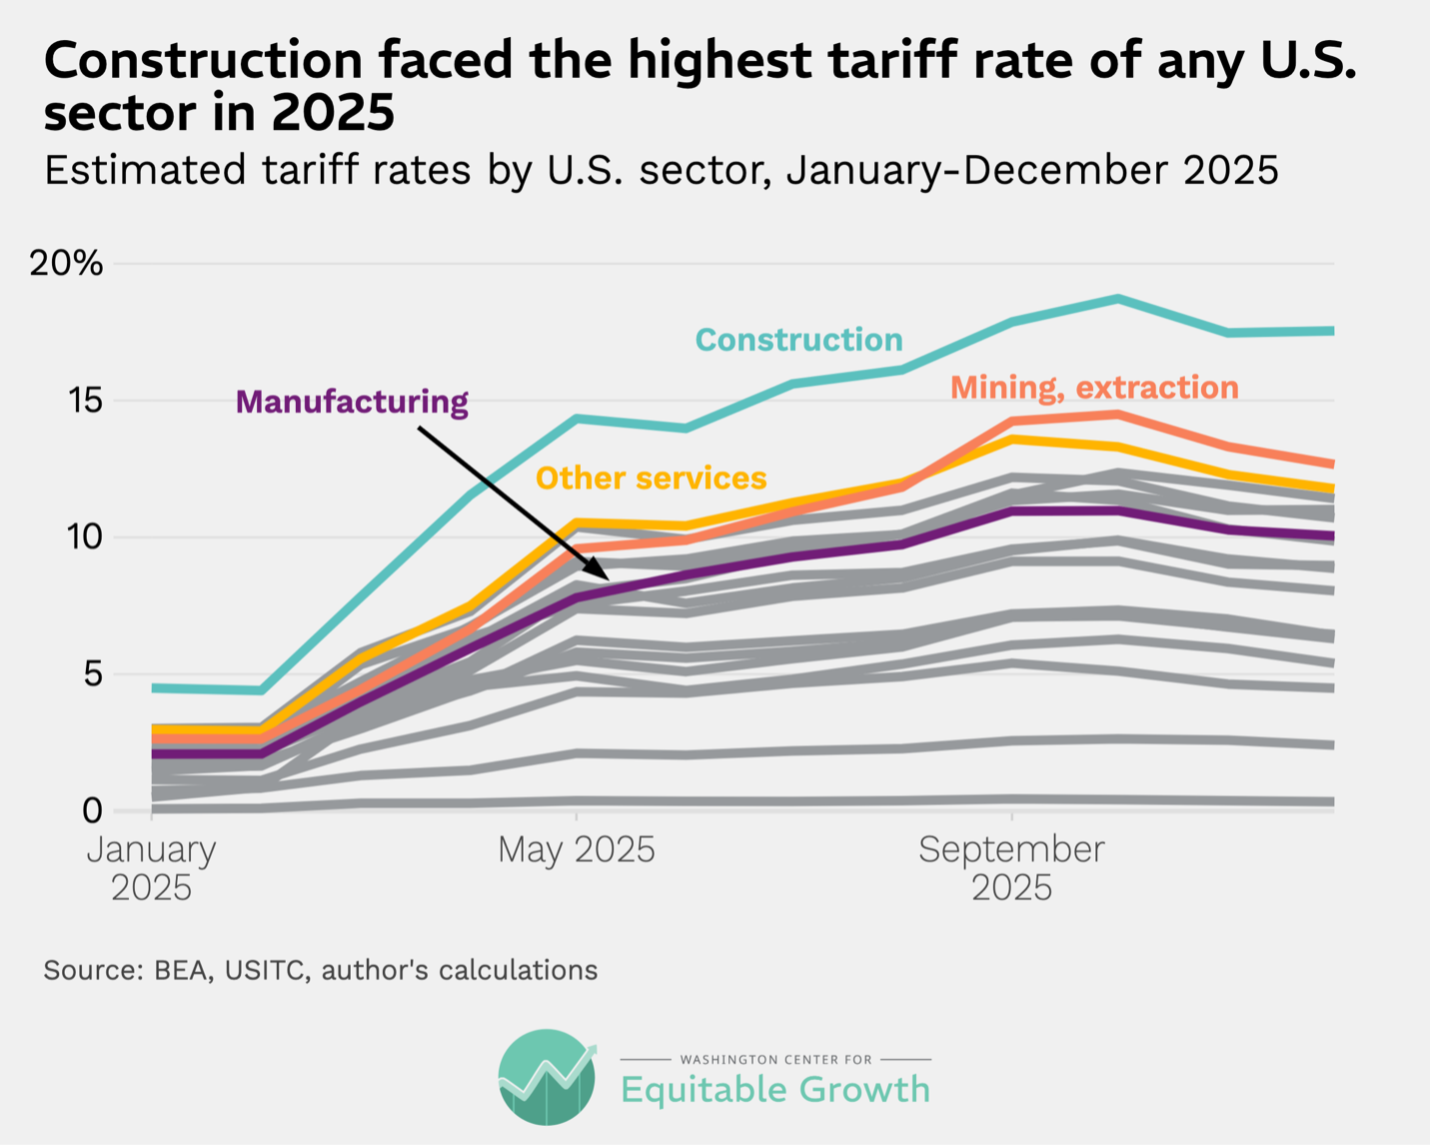
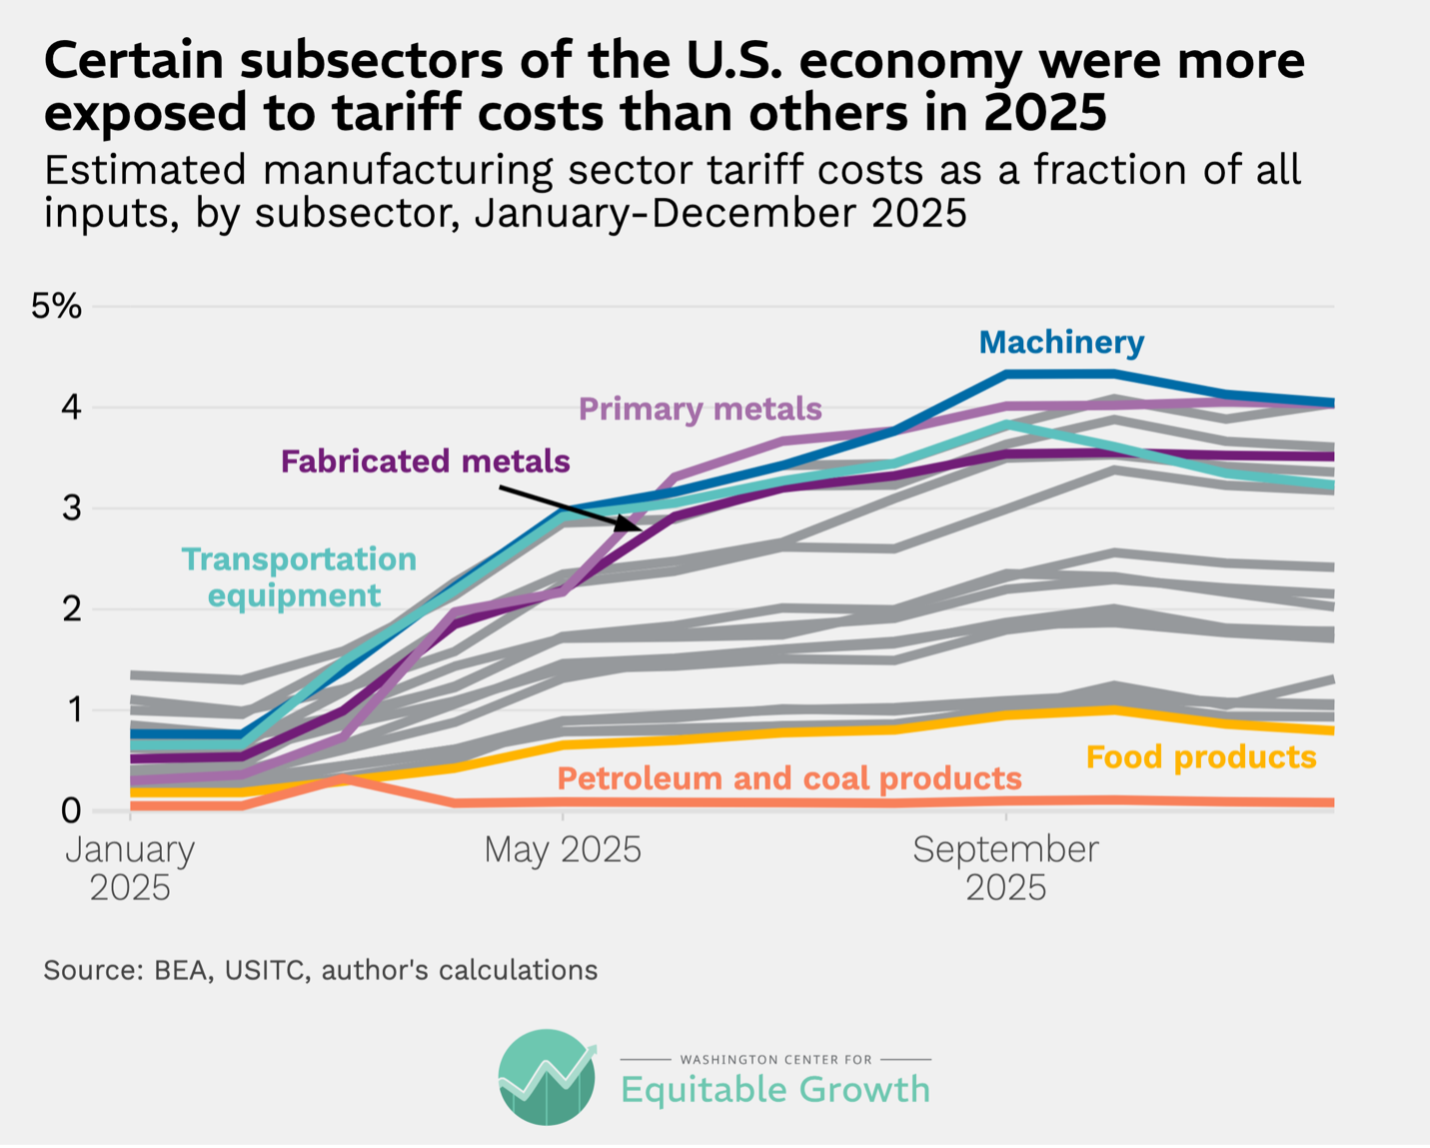
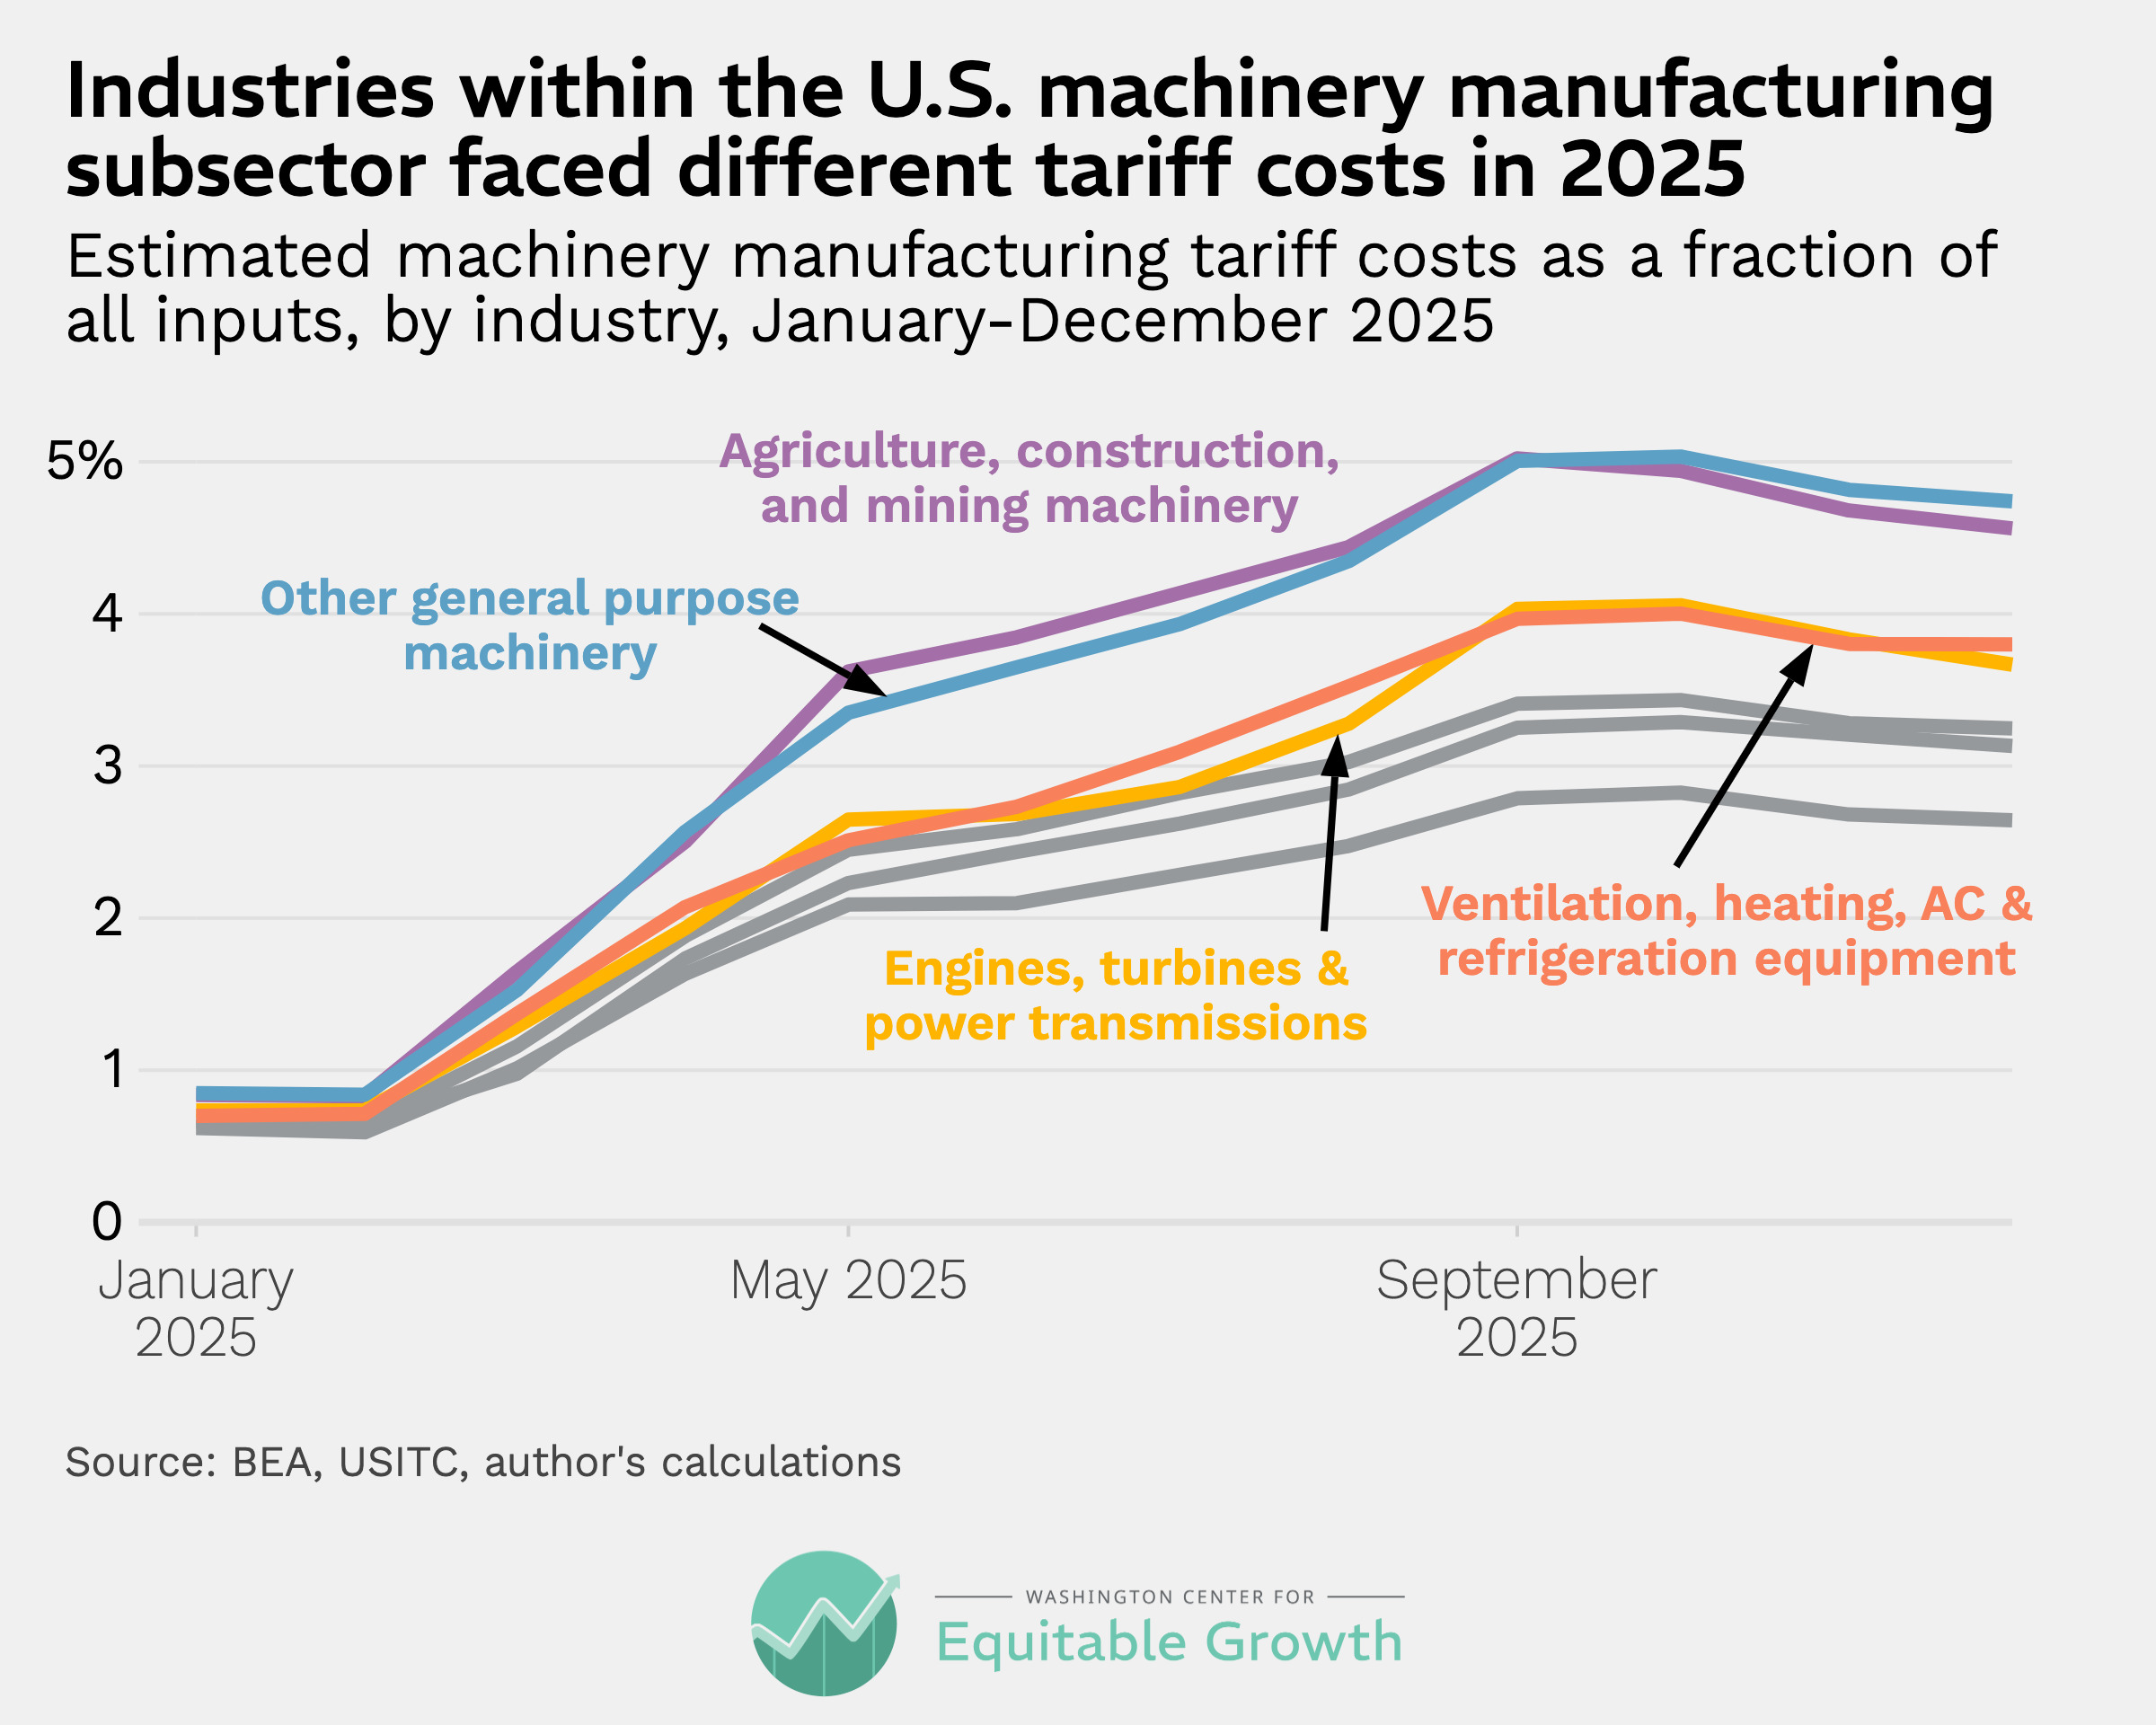
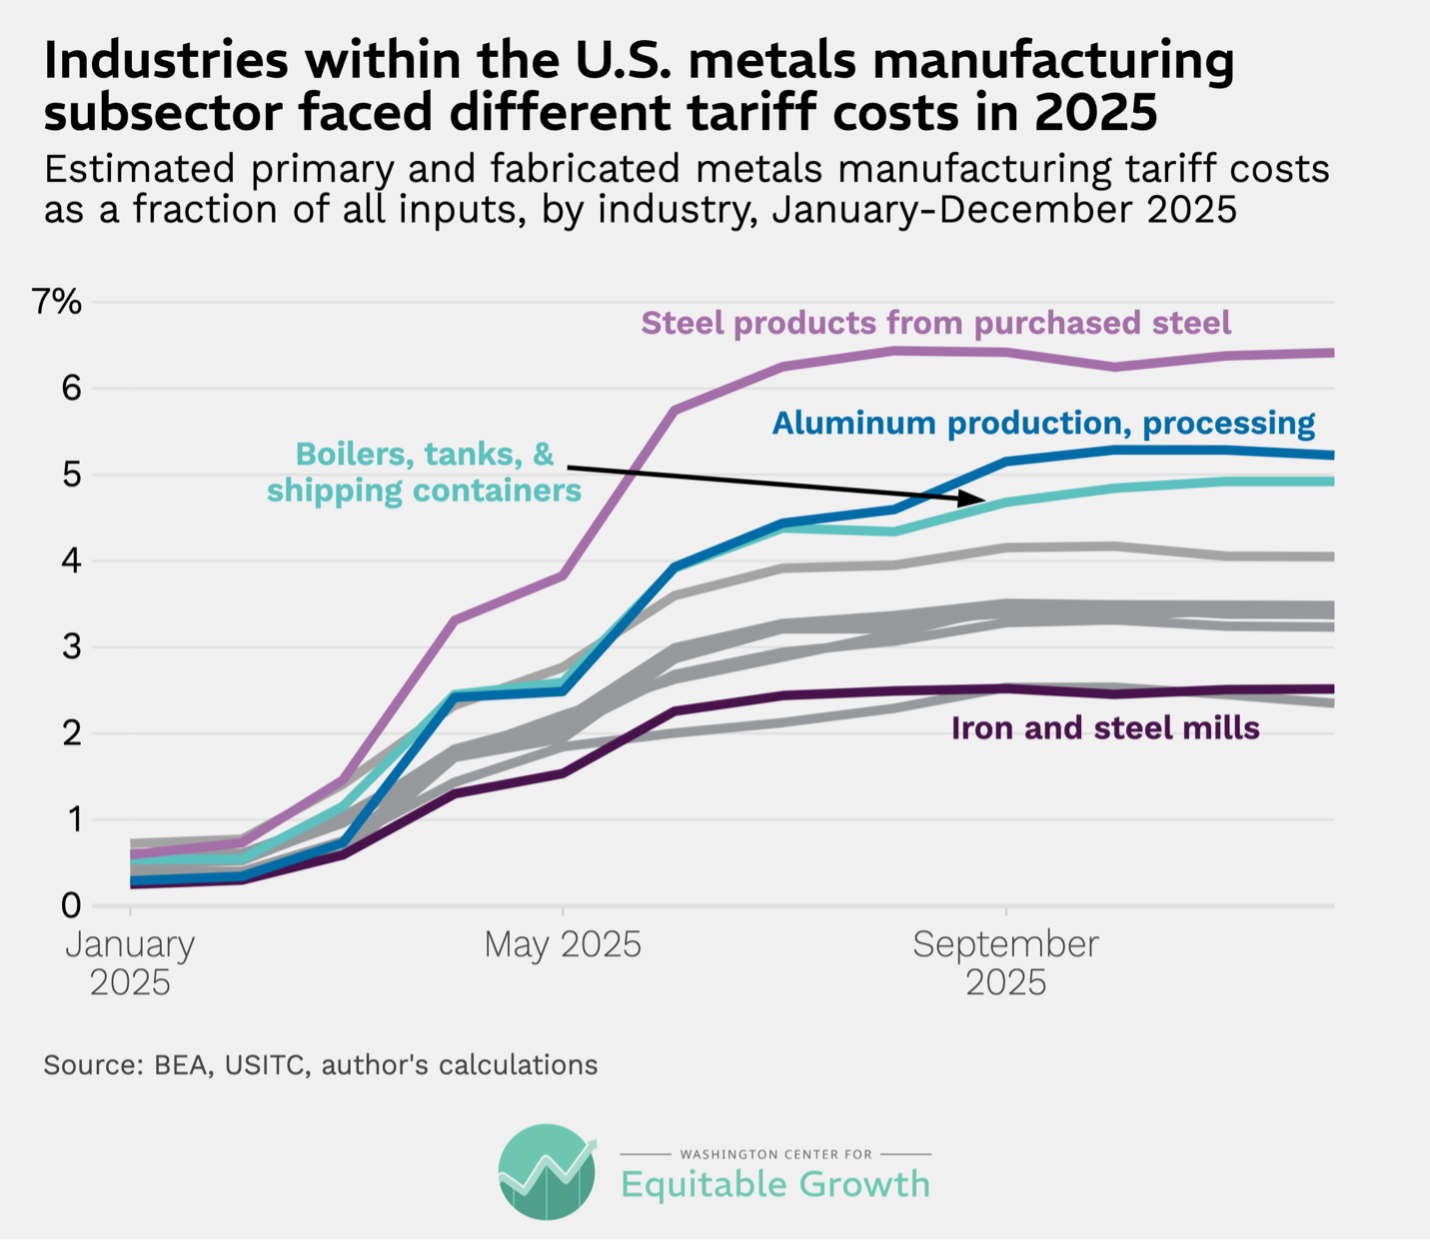
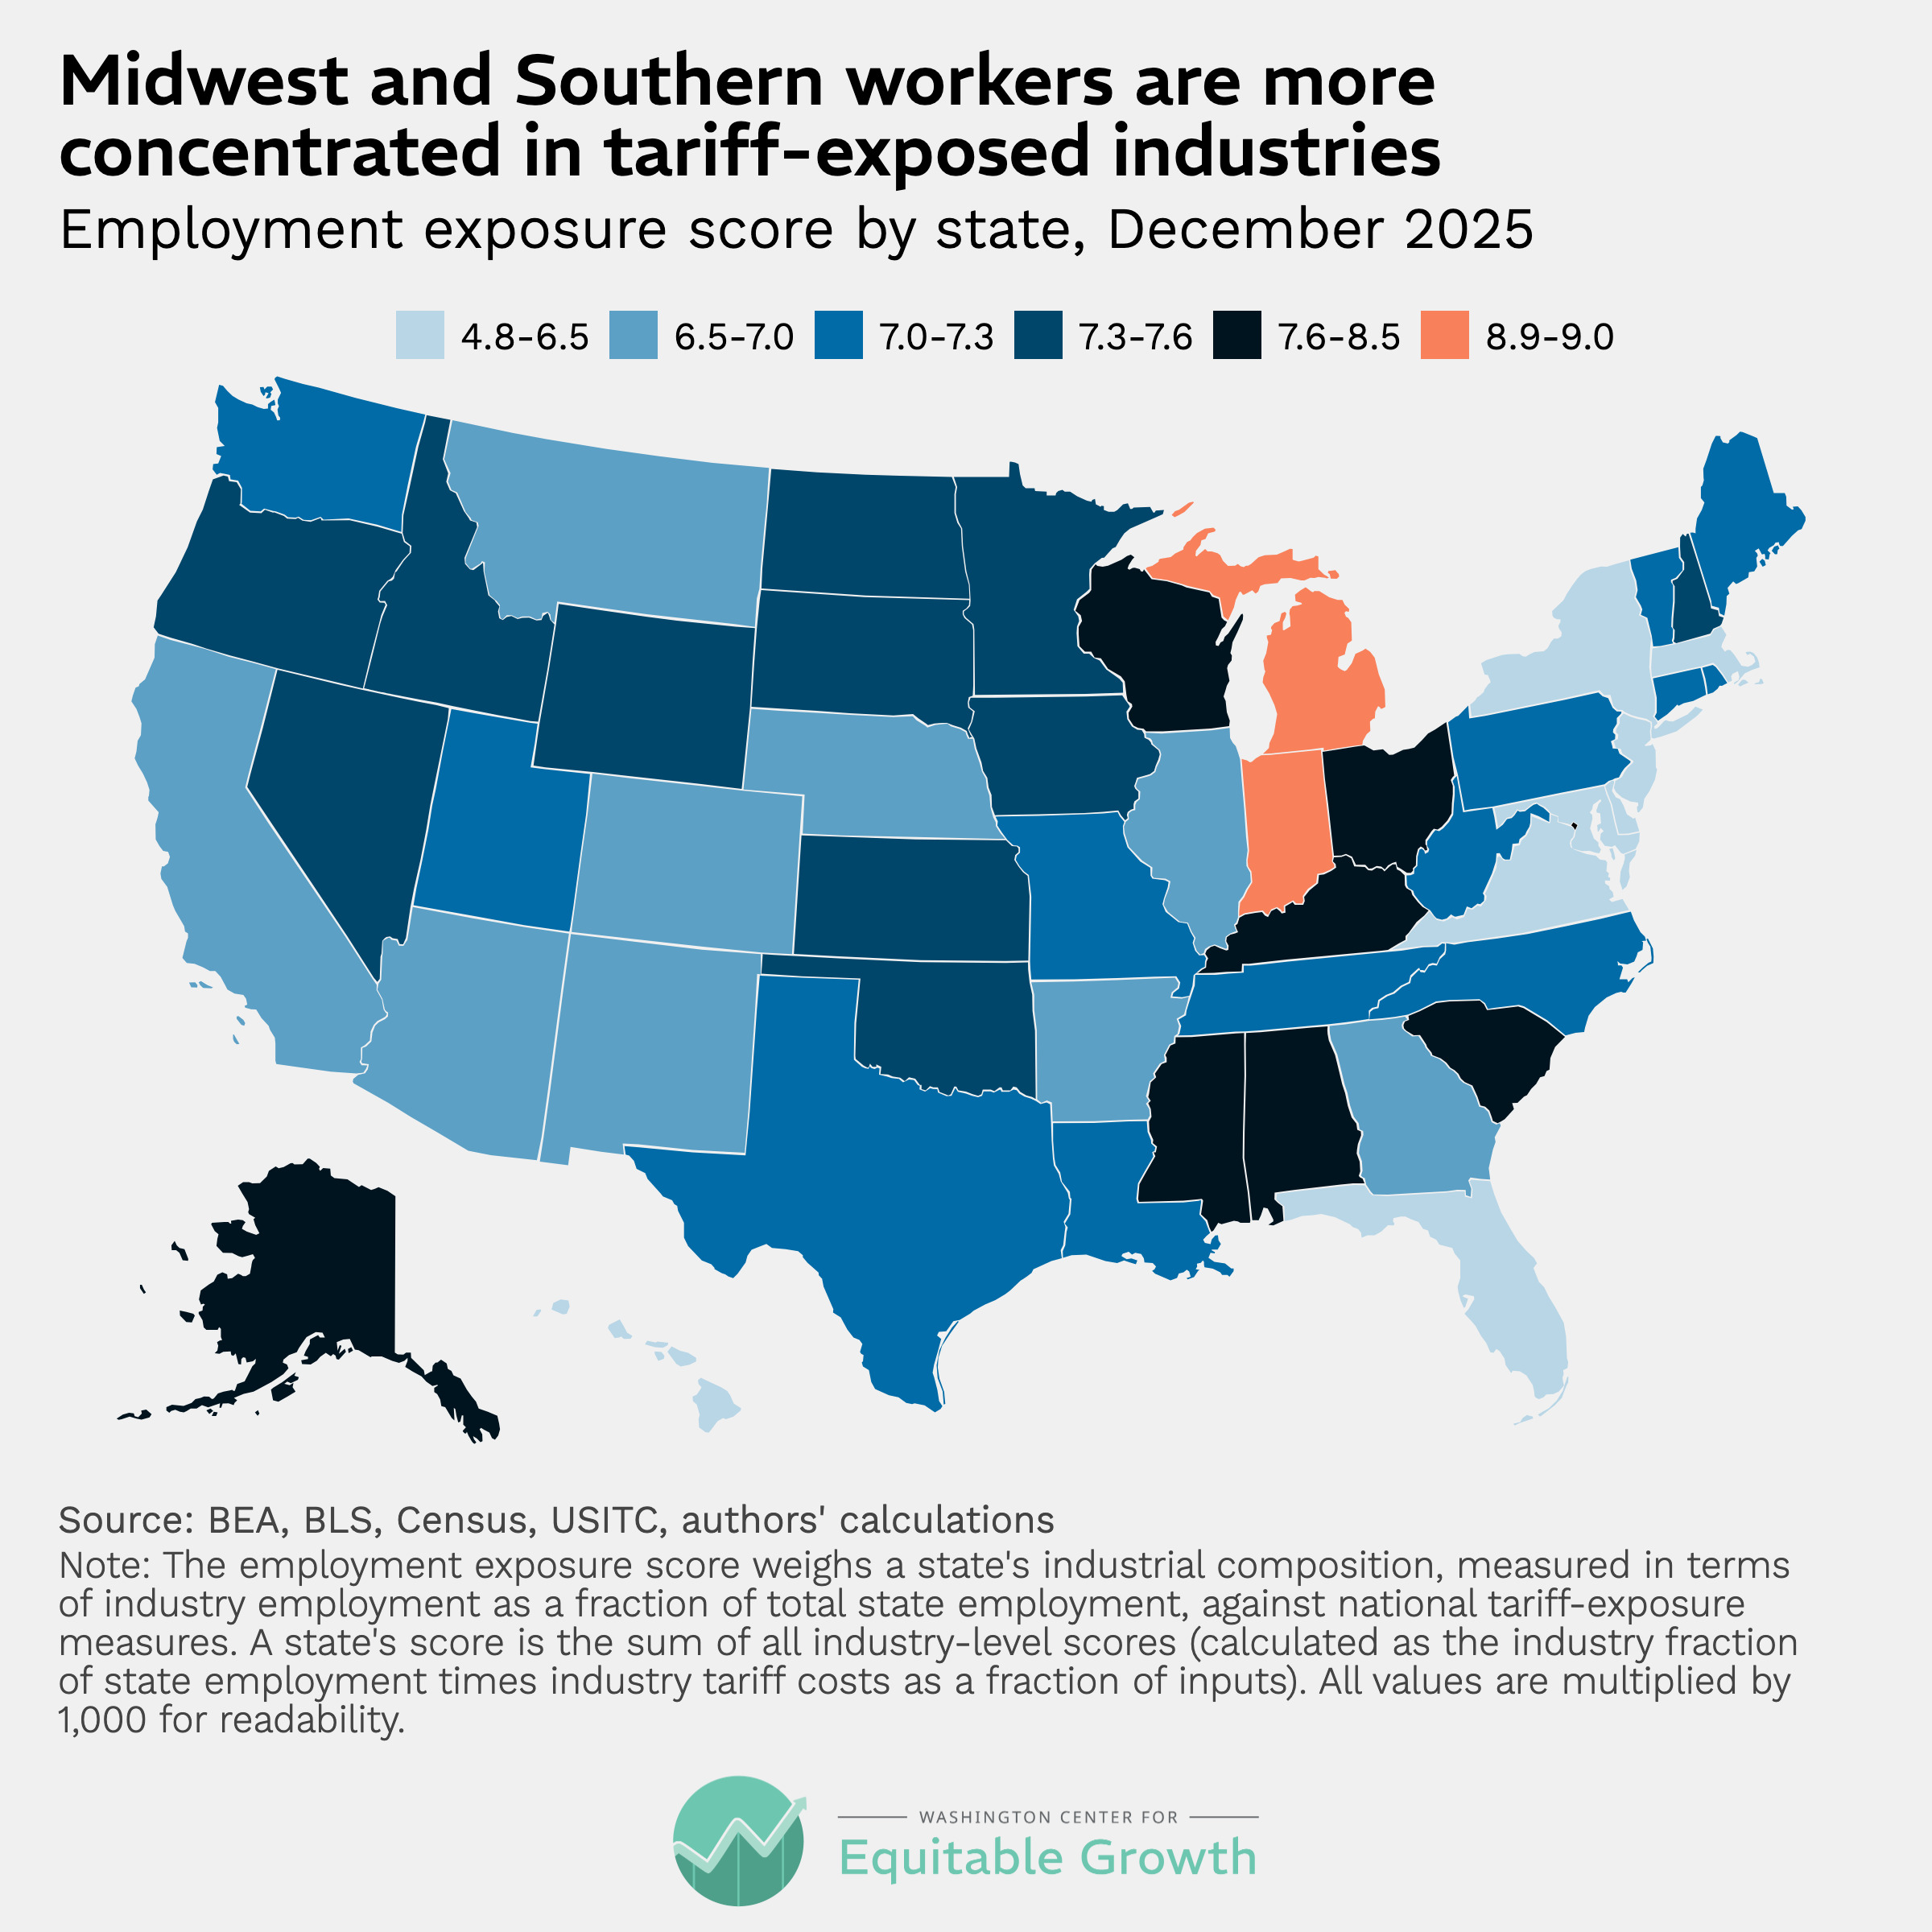


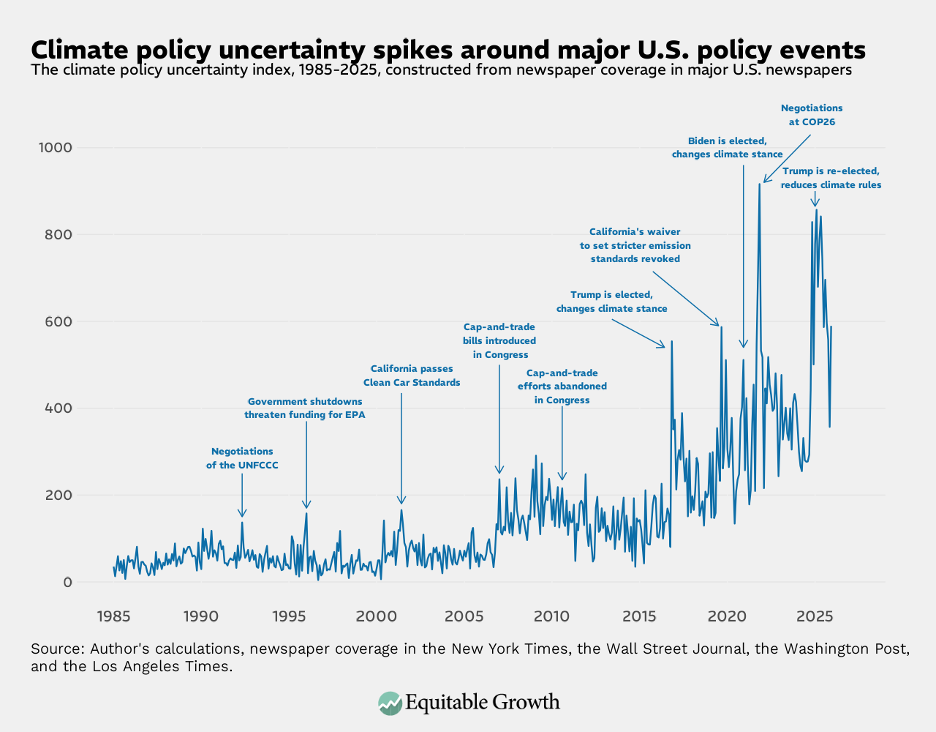
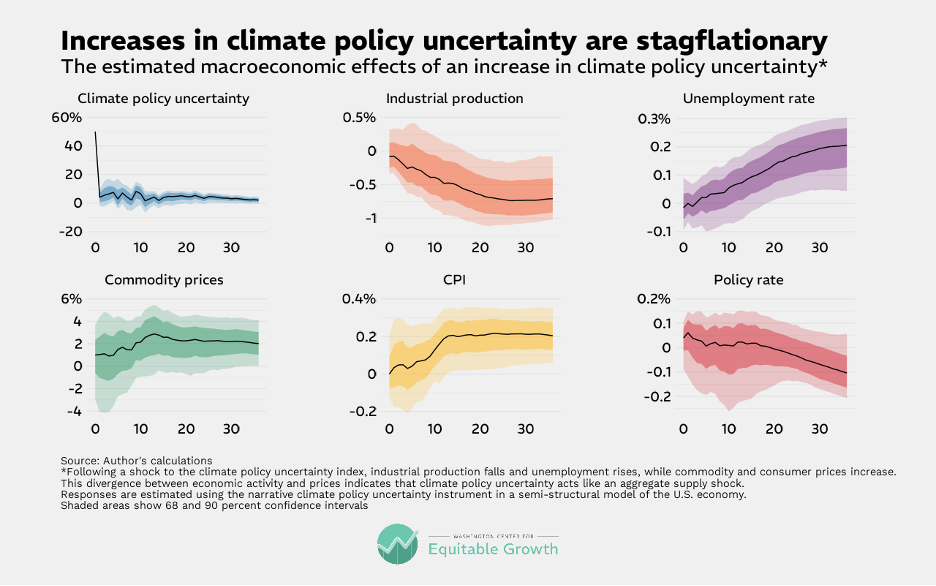


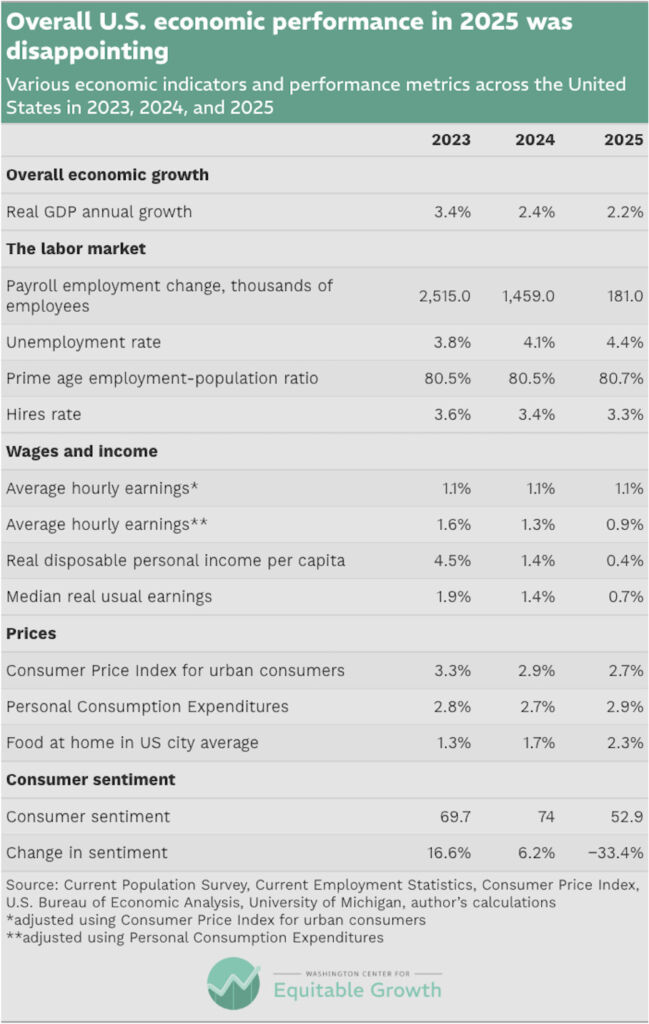


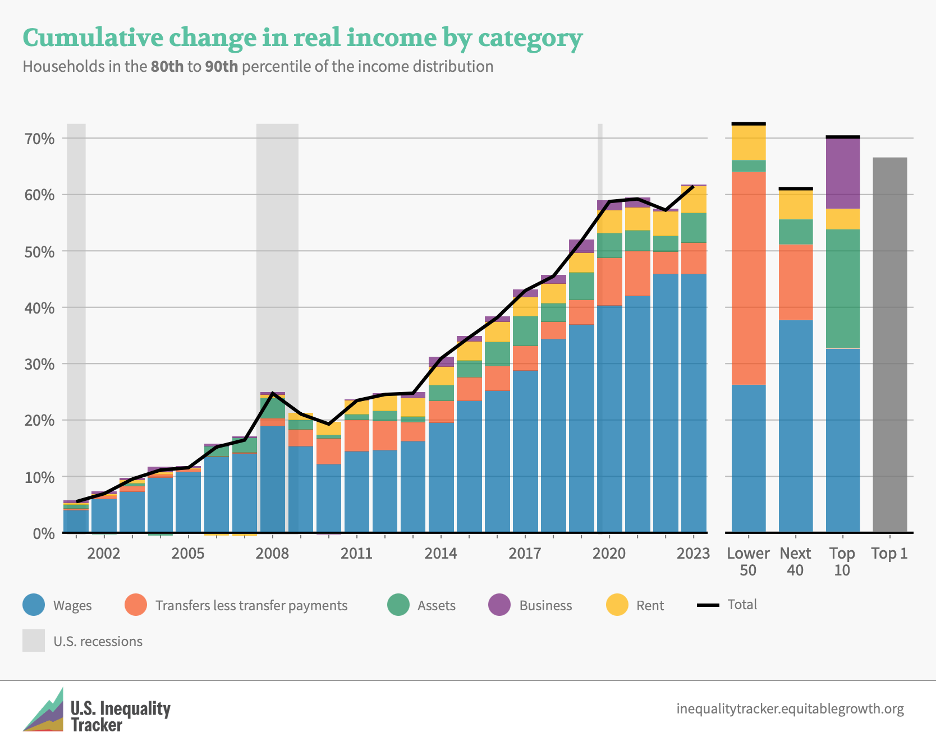
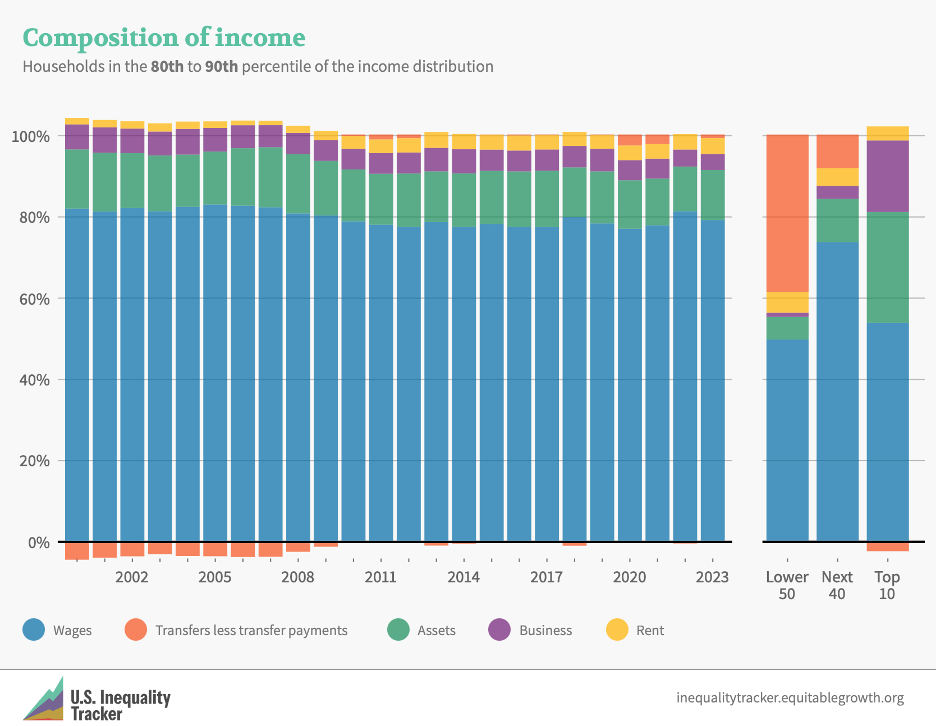
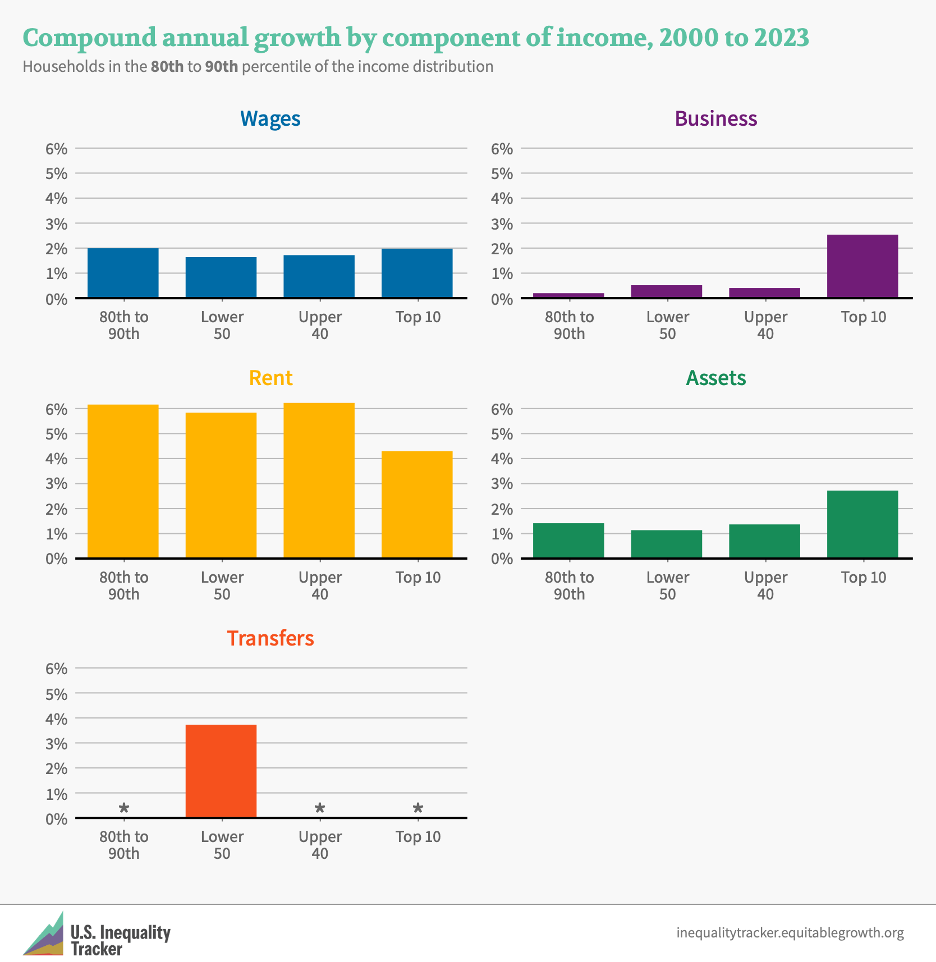
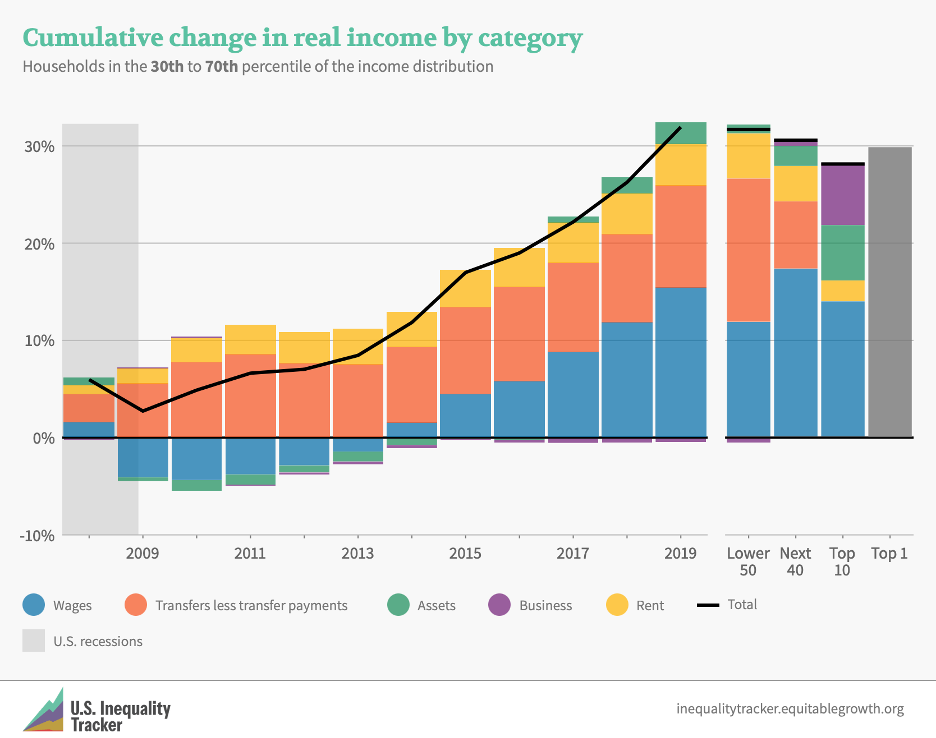
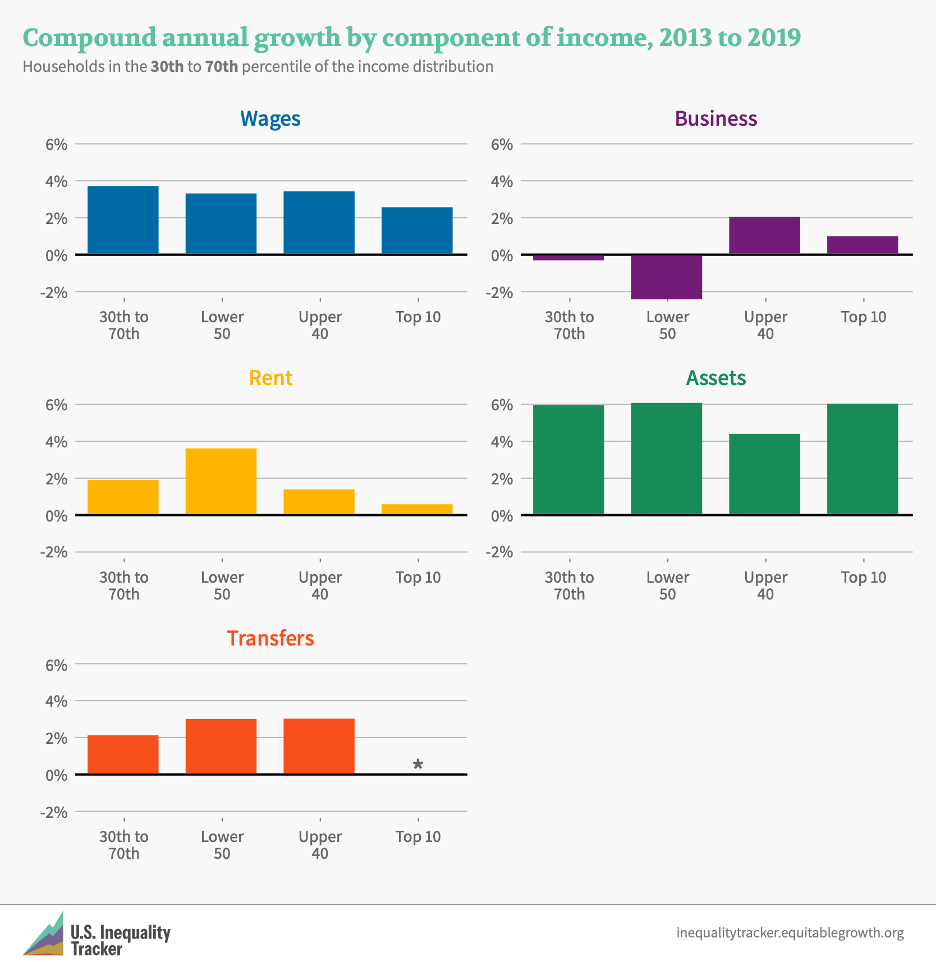
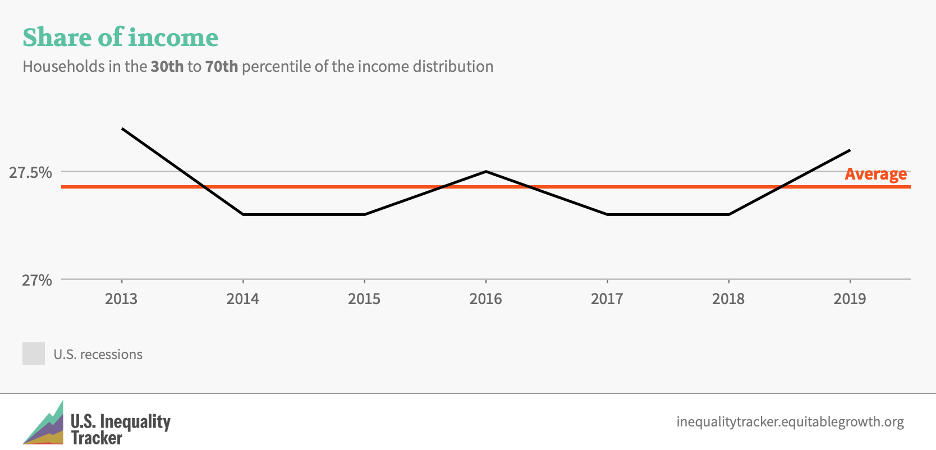
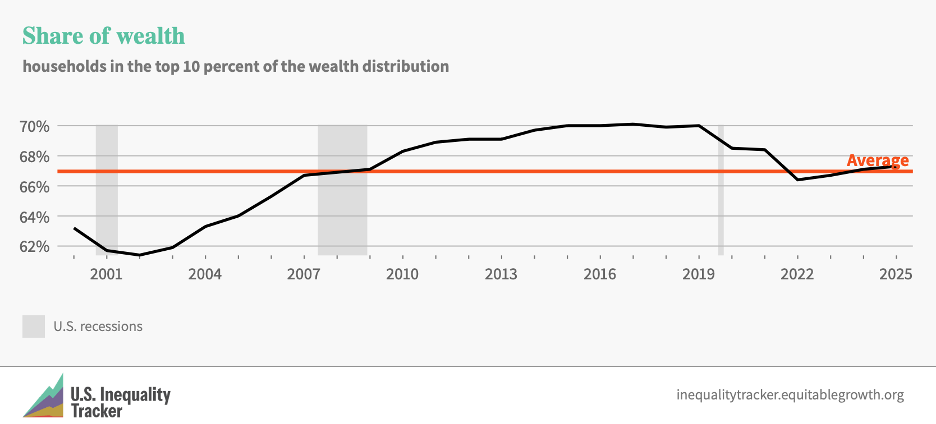
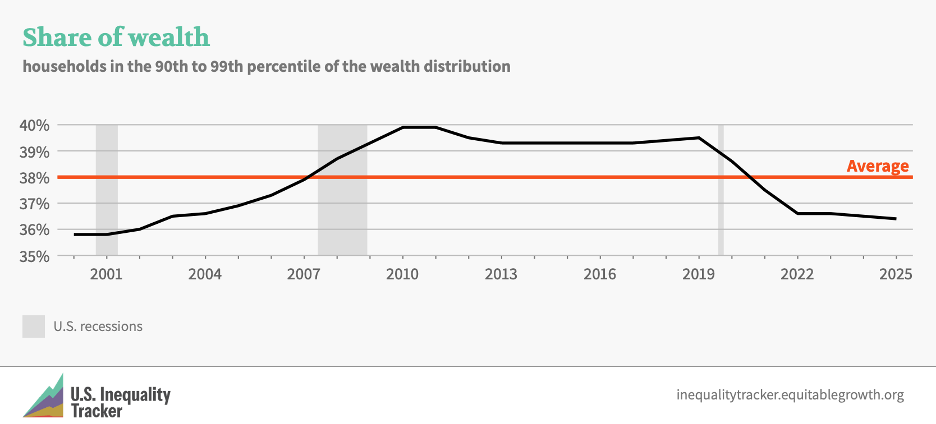
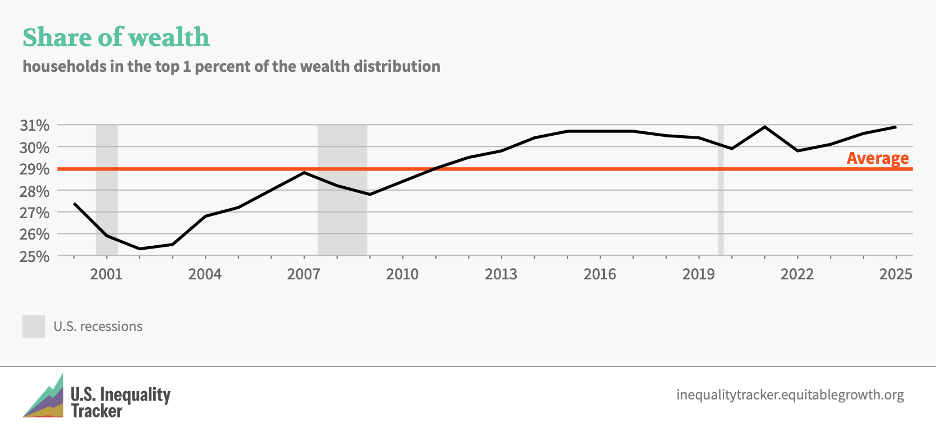
Stay updated on our latest research