The importance of raising the minimum wage to boost broad-based U.S. economic growth

The federal minimum wage today stands at $7.25 per hour, unchanged since 2009 despite rising prices and rising nominal wages for other workers. Indeed, the purchasing power of the minimum wage has been deteriorating for decades. Without legislative action by Congress every year—a very difficult policy endeavor—the minimum wage for the nation will continue to stagnate. This issue brief examines the importance of raising the minimum wage to boost broad-based U.S. economic growth amid rising U.S. income inequality and a still-tepid economic recovery. Policymakers need to understand the broad benefits of raising the minimum wage and whether there are any trade-offs to be made.

Sure to be in the spotlight are questions about whether and how the minimum wage:

  • Improves family incomes, especially in women-led households
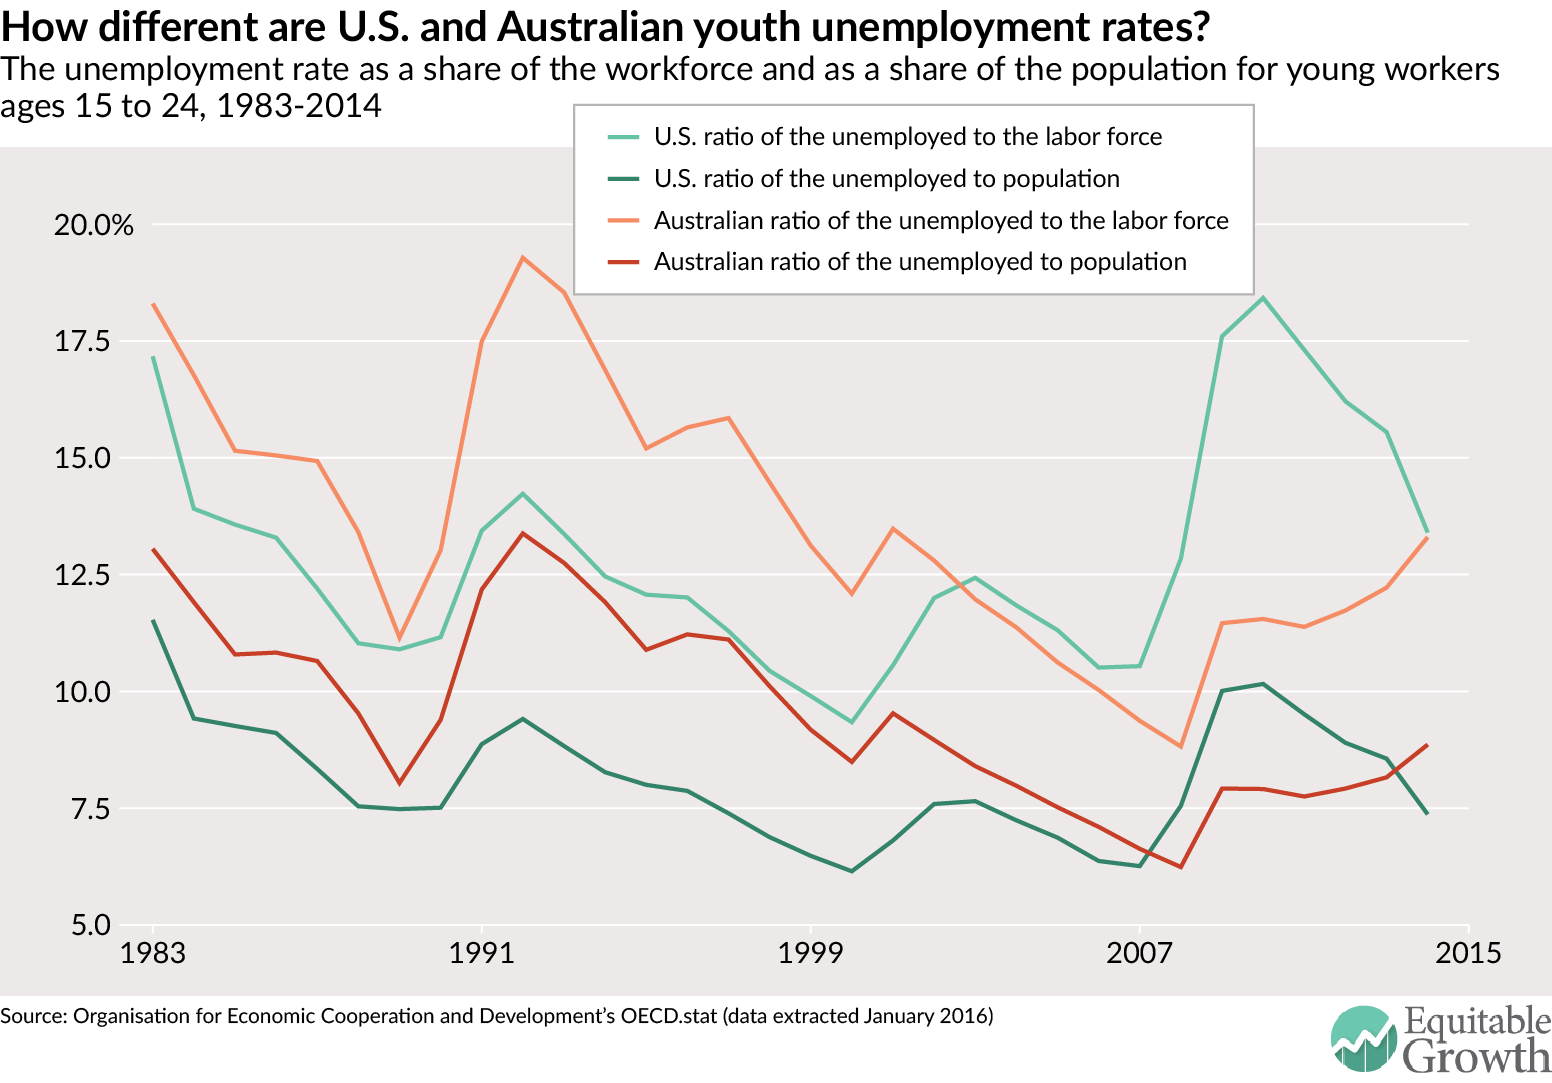
  • Affects job prospects for low-wage workers, the unemployed, and youth entering the labor market
  • Boosts broad-based aggregate economic demand
  • Should be indexed to the rate of inflation or other macroeconomic indicators

This issue brief provides the most relevant details about the minimum wage, drawn from the Washington Center for Equitable Growth’s broad network of academic scholars studying this issue.

Download File
The importance of raising the minimum wage to boost broad-based U.S. economic growth

Read the full PDF in your browser

What are the effects of raising the U.S. minimum wage?

In a new working paper and issue brief for the Washington Center for Equitable Growth on the overall economic benefits of increasing the minimum wage for U.S. households, associate professor of economics Arindrajit Dube at the University of Massachusetts, Amherst, finds:1

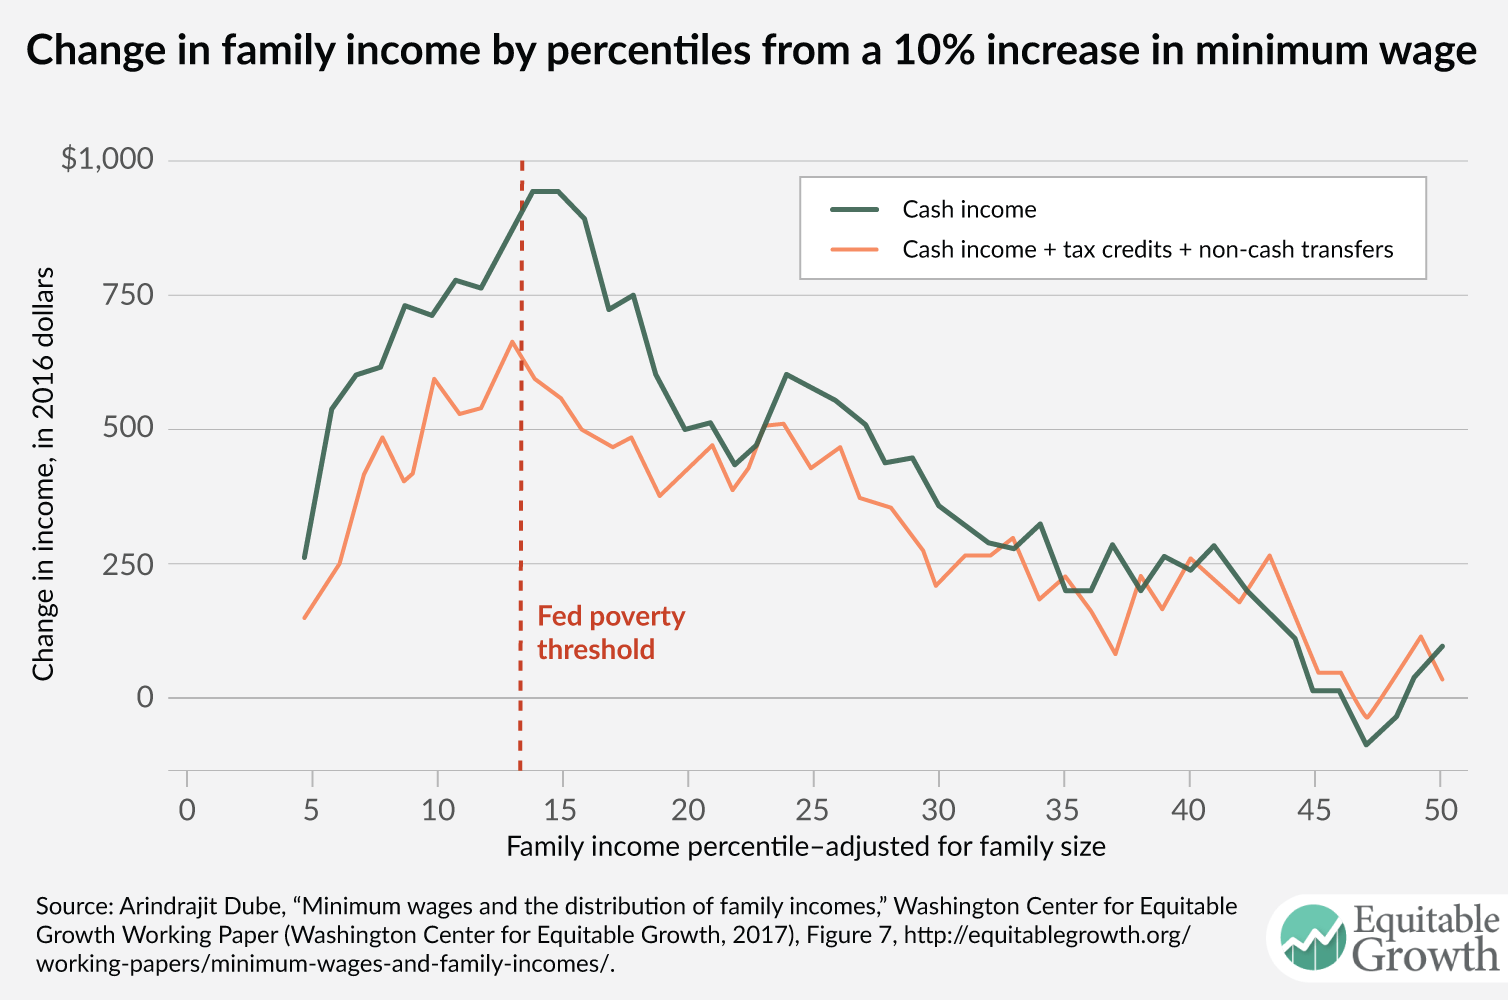
robust evidence that higher minimum wages lead to increases in incomes among families at the bottom of the income distribution, and that these wages reduce the poverty rate. A 10 percent increase in the minimum wage reduces the nonelderly poverty rate by about 5 percent. At the same time, I find evidence for some substitution of government transfers with earnings, as evidenced by the somewhat smaller income increases after accounting for tax credits such as the Earned Income Tax Credit and noncash transfers such as Supplemental Nutrition Assistance Program. The overall increase in post-tax income is about 70 percent as large as the increase in pretax income.

Dube concludes that a “substantial increase in the federal minimum wage can play an important role in reducing poverty and raising family incomes in the United States at the bottom of the income ladder while reducing the use of public assistance.” He notes that “the loss in cash and noncash transfers and tax credits among those who would benefit the most from minimum wage increases is likely to dampen some of the benefits, especially among those around the poverty line, yet the resulting public savings could be ploughed back into further shoring up the safety net—in turn further increasing the complementarity between minimum wages and income support for raising the incomes of families at the bottom of the income ladder.”

Dube says “these findings are consistent with some individuals losing eligibility for benefits as a result of increased income.” He notes that “typically, eligibility for supplemental nutrition assistance, for example, requires income to be less than 130 percent of the federal poverty threshold, which for this population binds just under the 15th percentile. On average, those in the bottom quartile of the income distribution can expect an approximately $525 increase in annual income from the minimum-wage policy; the gains are largest around the 15th percentile.” (See Figure 1.)

Figure 1

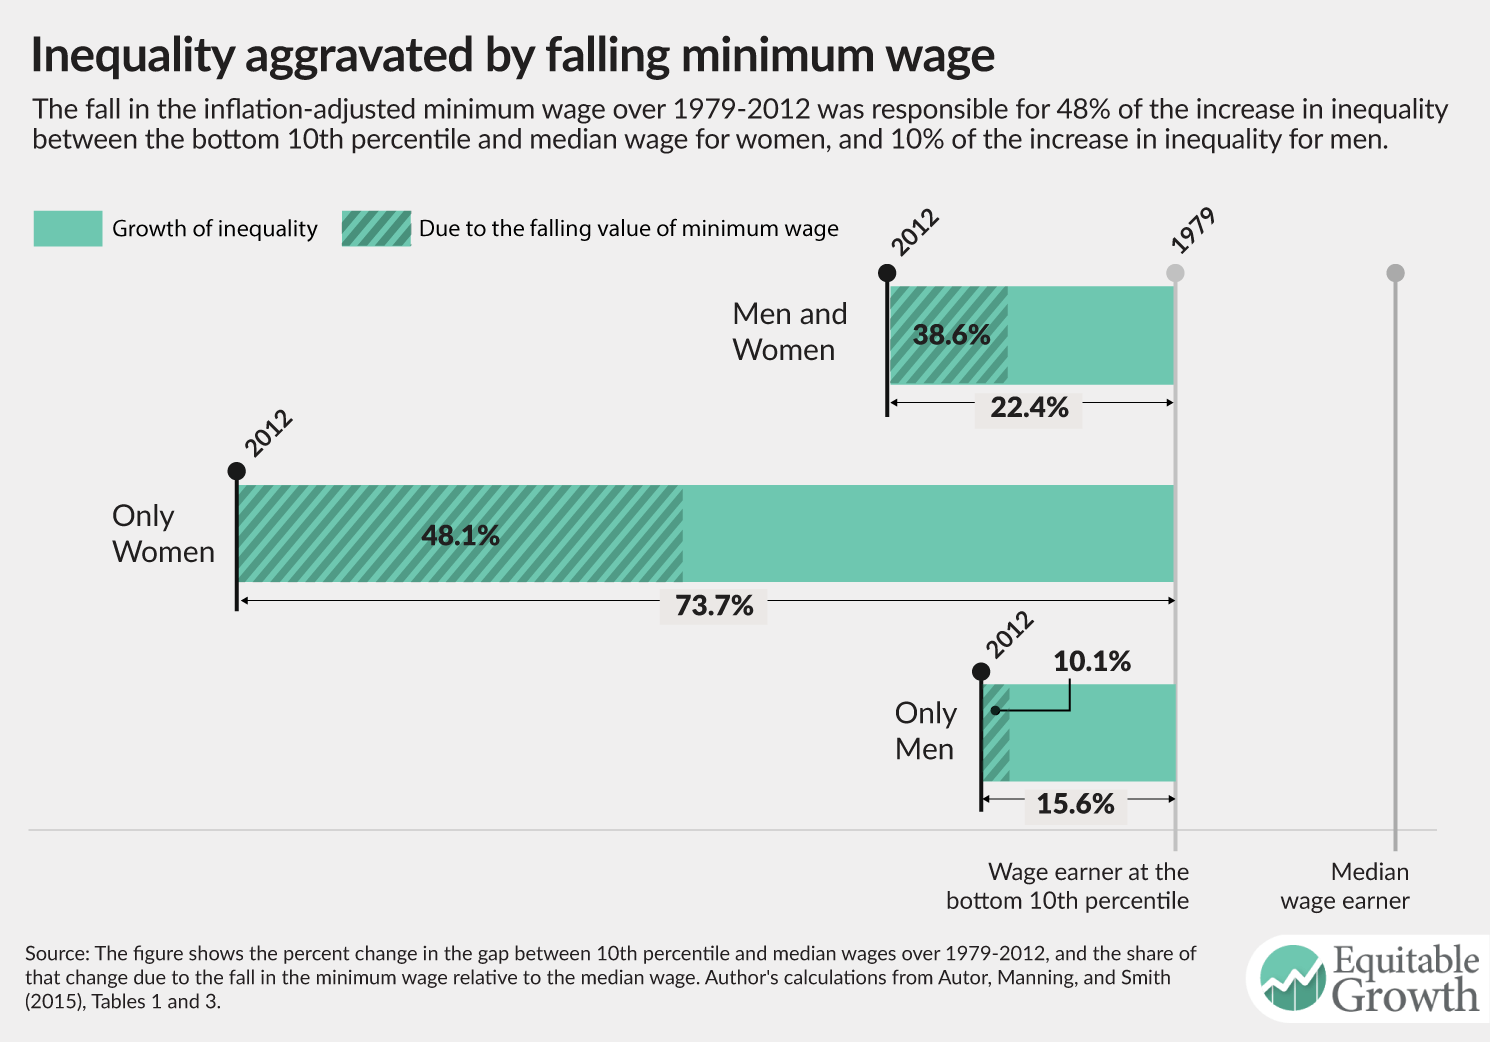
Many U.S. households rely on the incomes of women, especially those headed by single mothers. A recent study by economists David Autor of the Massachusetts Institute of Technology (and a member of Equitable Growth’s Research Advisory Board), Alan Manning of the London School of Economics, and Christopher Smith of the Federal Reserve Board examines all state and federal minimum wage increases from 1979 through 2012, and measures the effect of the raises at each point of the wage distribution.2 One key piece of their findings is that because women are generally paid less than men—and therefore fall closer to the bottom of the wage spectrum—the minimum wage has larger effects on female wage inequality. For wage inequality among women, Autor, Manning, and Smith find that the minimum wage had particularly strong consequences. Between 1979 and 2012, the declining minimum wage was responsible for 48 percent of the increase in female wage inequality between the bottom and middle of the wage distribution. (See Figure 2.)

Figure 2

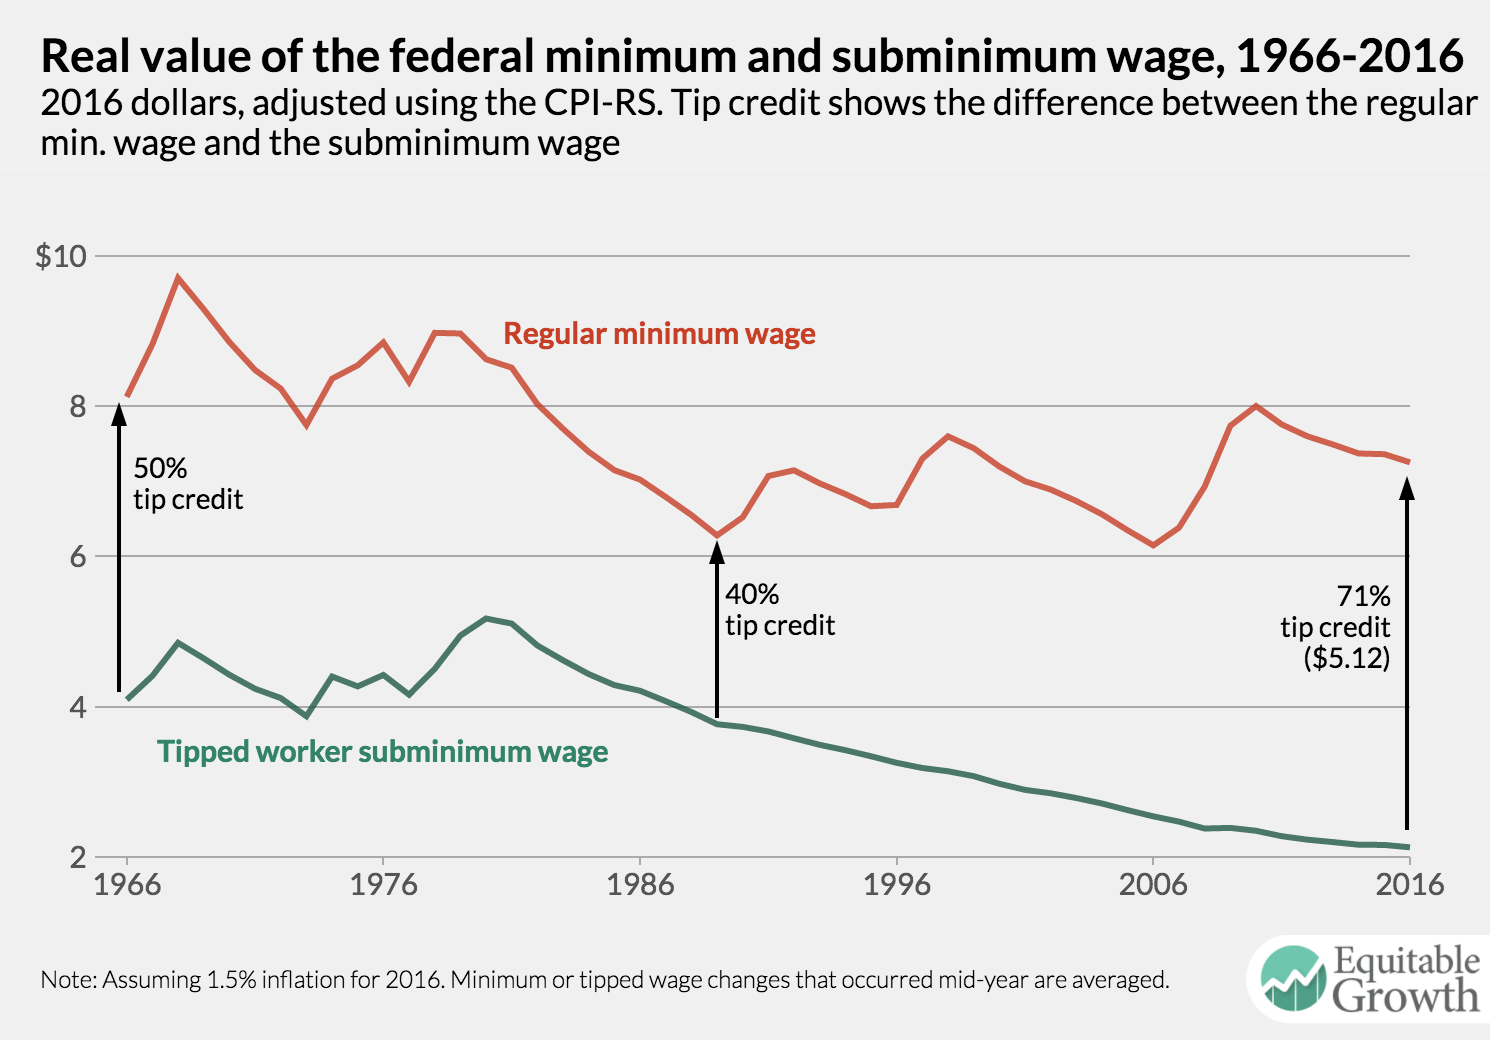
Women are hit particularly hard by anomalies in pay in industries where tipped pay is prevalent such as the restaurant industry. These industries boast many working mothers. Sylvia A. Allegretto, an economist and co-chair of the Center on Wage and Employment Dynamics at the Institute for Research on Labor and Employment at the University of California, Berkeley, wrote an essay for Equitable Growth about the vagaries of the minimum wage for tipped employees.3 In it, she shows that tipped workers are overwhelming female who typically earn low wages. They also have few workplace benefits, live disproportionately in poverty, and experience high rates of sexual harassment. One overall finding about the difference in the regular minimum wage and the lower tipped minimum wage illustrates the problem at hand. (See Figure 3.)

Figure 3

Former Equitable Growth economist Ben Zipperer trained his eye on the impact of the minimum wage on youth employment. In a working paper, he and his co-authors examine one group of low-wage workers—teenagers—whose hourly wages are significantly raised by minimum-wage increases.6 They note that a common objection to raising minimum wages is that doing so will reduce the employment opportunities of low-skilled workers such as teenagers. They show, however, that some studies find negative effects of the minimum wage on teen employment because they fail to control for other economic factors that independently reduced employment around the time of a minimum-wage increase. After controlling for these factors, they demonstrate that the large negative effect on teen employment disappears.

Zipperer and his co-authors note that economists have developed a large body of research comparing the labor-market outcomes in states that raise their minimum wage versus those that don’t. Yet a naive comparison of these two groups of states can lead to misleading conclusions because the variation of state-level minimum-wage policies is not random (which is ideal for assessing the impact of government policies) and is instead geographically concentrated. (See Figure 4.)

Figure 4

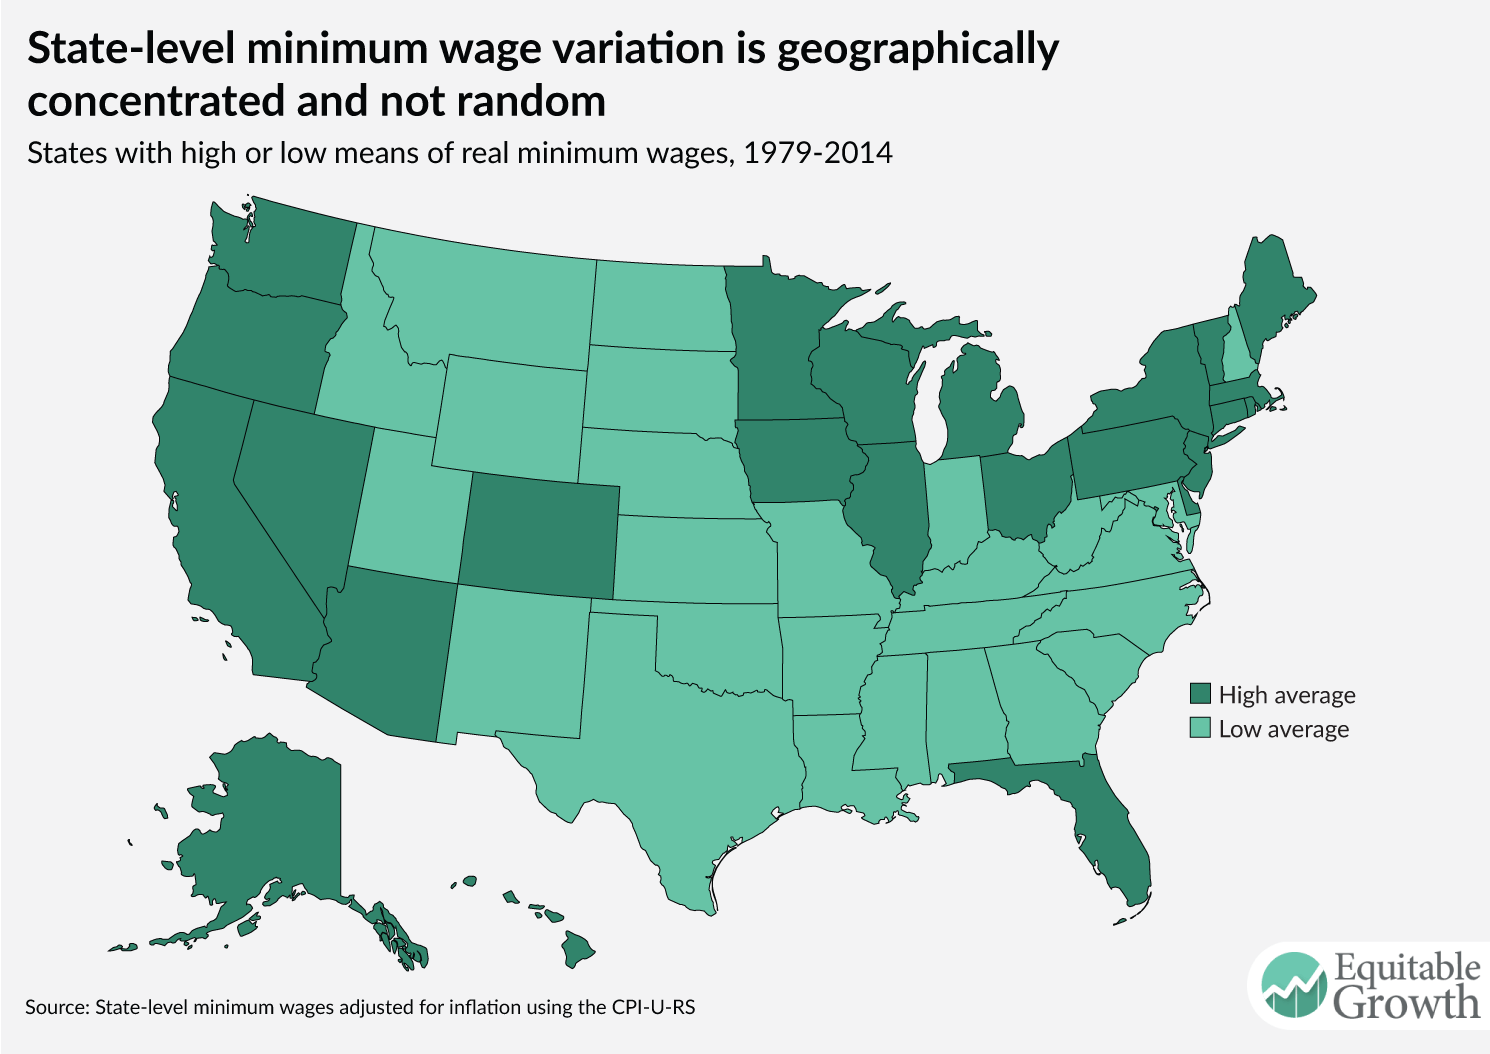
Zipperer and his co-authors show that this map divides states into two groups: states with high average minimum wages and states with low average minimum wages during the 1979–2014 period. States that have high minimum wages were more likely to have been raising their respective wage floors above the federal floor. States with low minimum wages typically followed federal policy. This difference is clearly region-specific.

This clustering of minimum-wage policies within regions of the country is an obstacle for credible research on the minimum wage because comparing the employment of minimum-wage raising and nonraising states effectively compares regions such as the Northeast versus the South. Employment patterns differ in these regions because of a host of economic and political reasons not affected by the minimum wage. High minimum-wage states, for example, also boast higher unionization rates and experienced smaller declines in unionization over the past three decades.

Zipperer in 2015 also did an analysis of how raising the minimum wage ripples through the workforce.7 In it, he says that “although the minimum wage enhances the bargaining power of many low-wage workers, an increased minimum wage’s effectiveness in doing so dissipates as it spreads across the wage spectrum, essentially disappearing for middle-class wage earners.” This ripple effect, he says, “has important implications for wage inequality among workers in the United States.” (See Figure 5.)

Figure 5

How policymakers should think about unemployment and the minimum wage

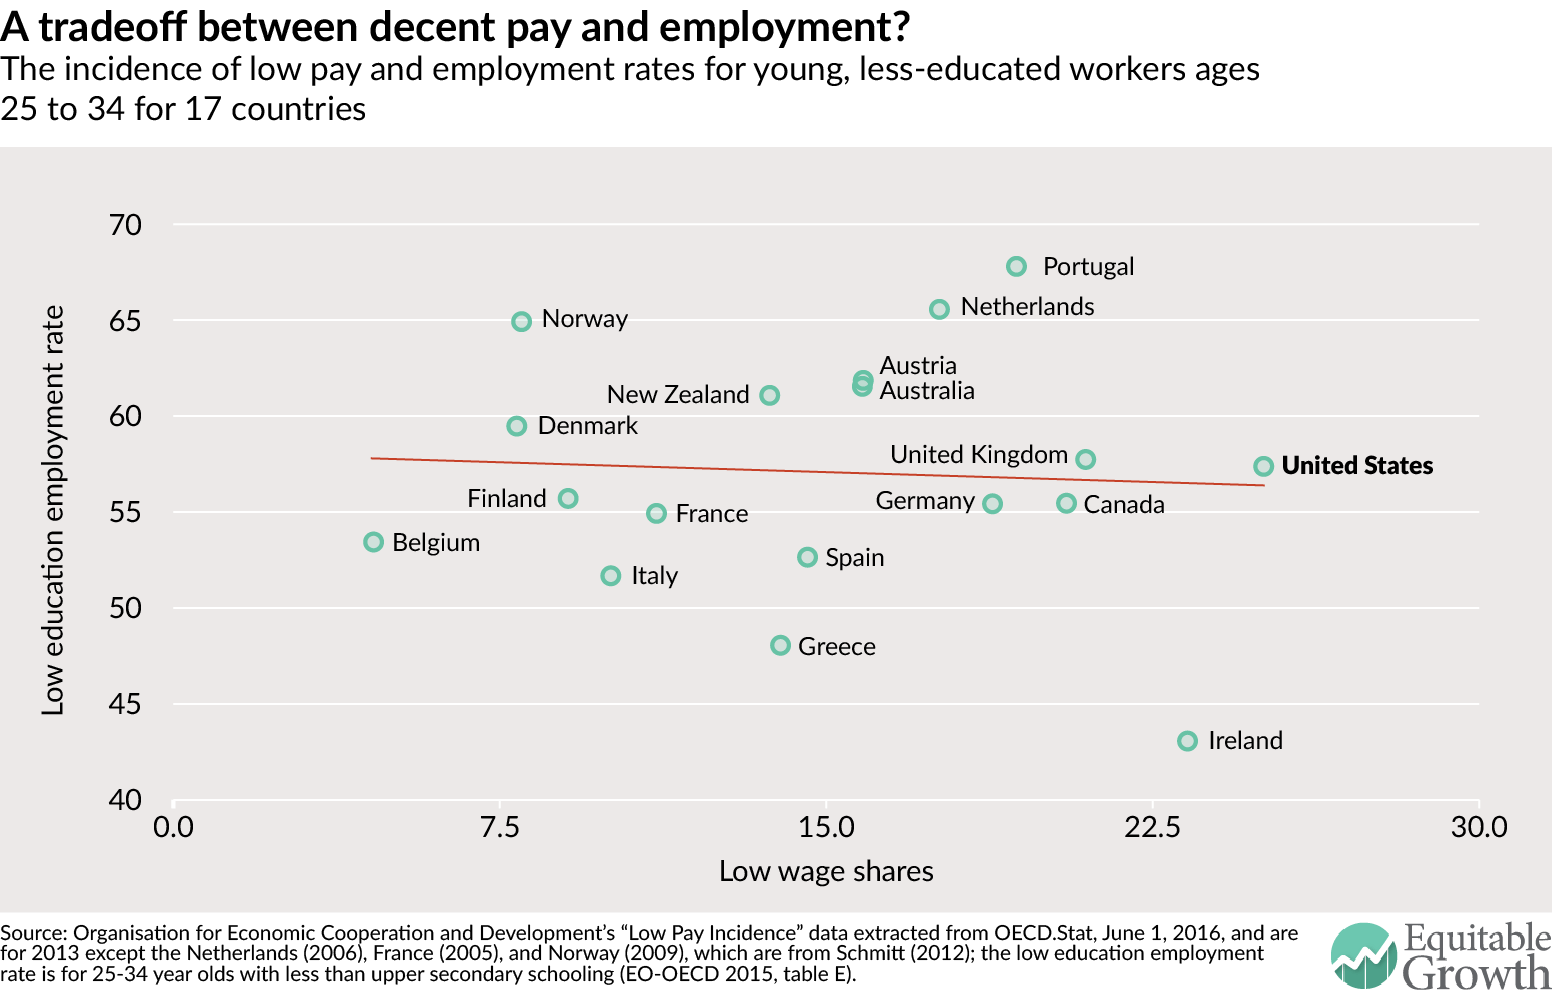
Policymakers need to ask whether the ongoing debate about raising the minimum wage and any resulting job losses is misplaced. David Howell, a professor of economics and public policy and director of the doctoral program in public and urban policy at The New School, argues persuasively that the stalemated academic debate about the minimum wage and any job losses whatsoever ignores the net benefits of raising the minimum wage.8 Howell, an Equitable Growth 2014 academic grantee, notes that “when the criterion for raising the minimum wage is concerned only with the cost side of an increase, the costs of some predicted job losses are all that matters.” But his research, and that of others he points to in his working paper for Equitable Growth, highlights that “there are obviously benefits to raising the legal wage floor that should be counted and compared to the costs.”9

Howell points out that workers receiving wage increases as a result of a rise in the minimum wage benefit directly either because they are earning between the old minimum wage and the new one or because they earn a bit above the new minimum wage since employers increase wages to maintain wage differentials among workers by skill or seniority. The benefits are also evident for taxpayers, he says, because a much higher minimum wage means there is less need for means-tested government programs such as the Earned Income Tax Credit and Supplemental Nutrition Assistance Program for working families.

“If we really care about maximizing employment opportunities, then we should not hold a decent minimum wage hostage to the no-job-loss standard,” says Howell. “Rather, we should put a much higher priority on full-employment fiscal and monetary macroeconomic policy, minor variations of which would have massively greater employment effects than even the highest statutory wage floors that have been proposed.”

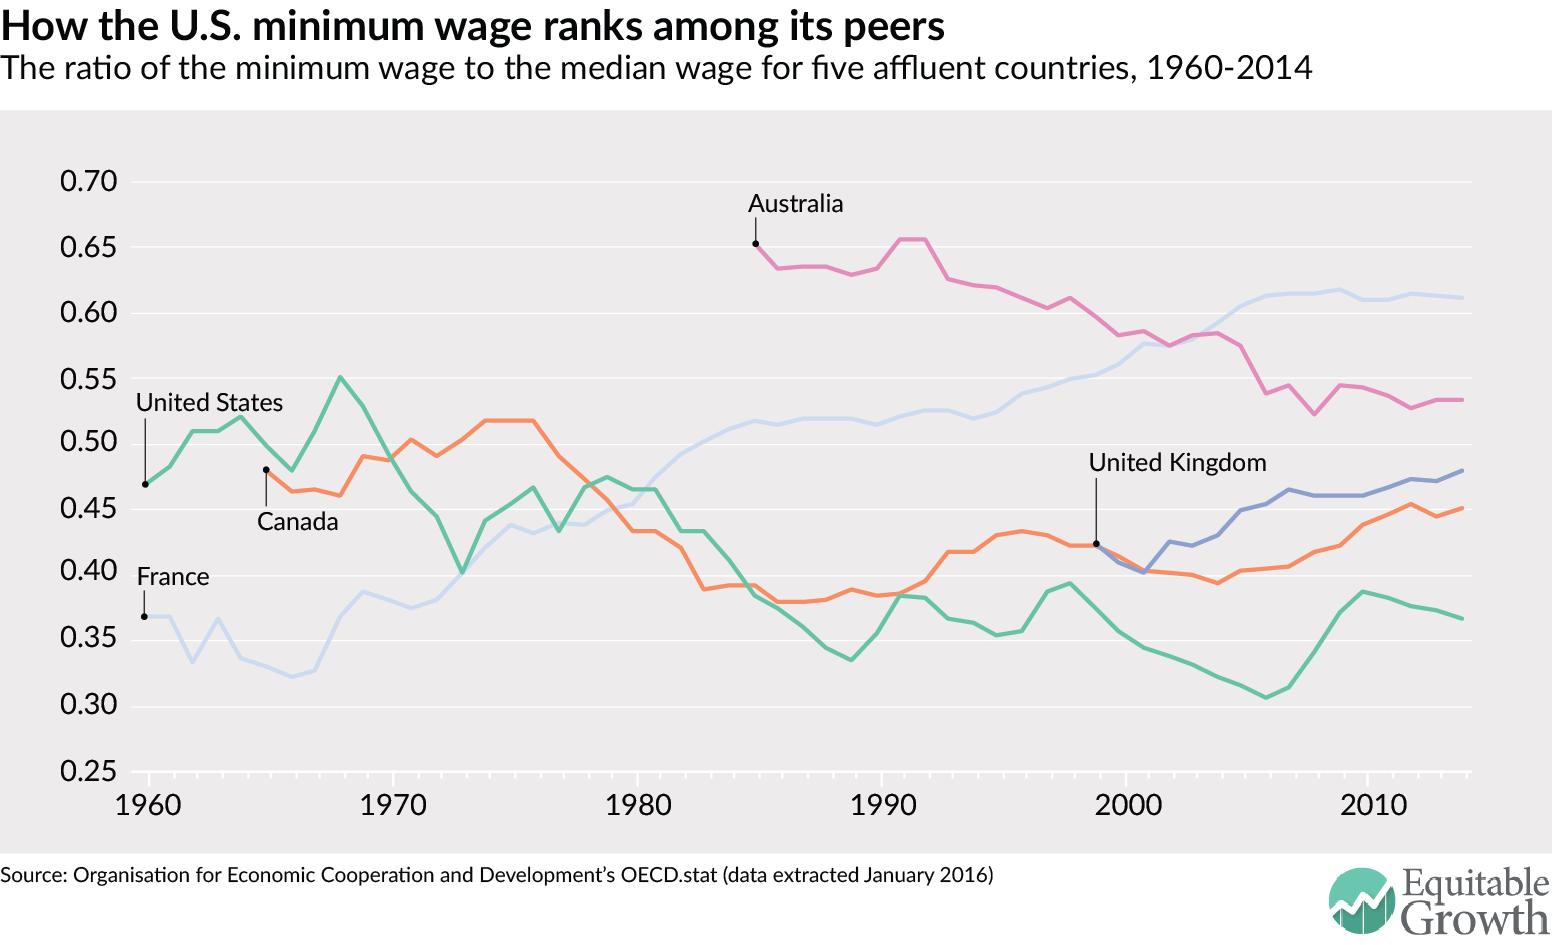
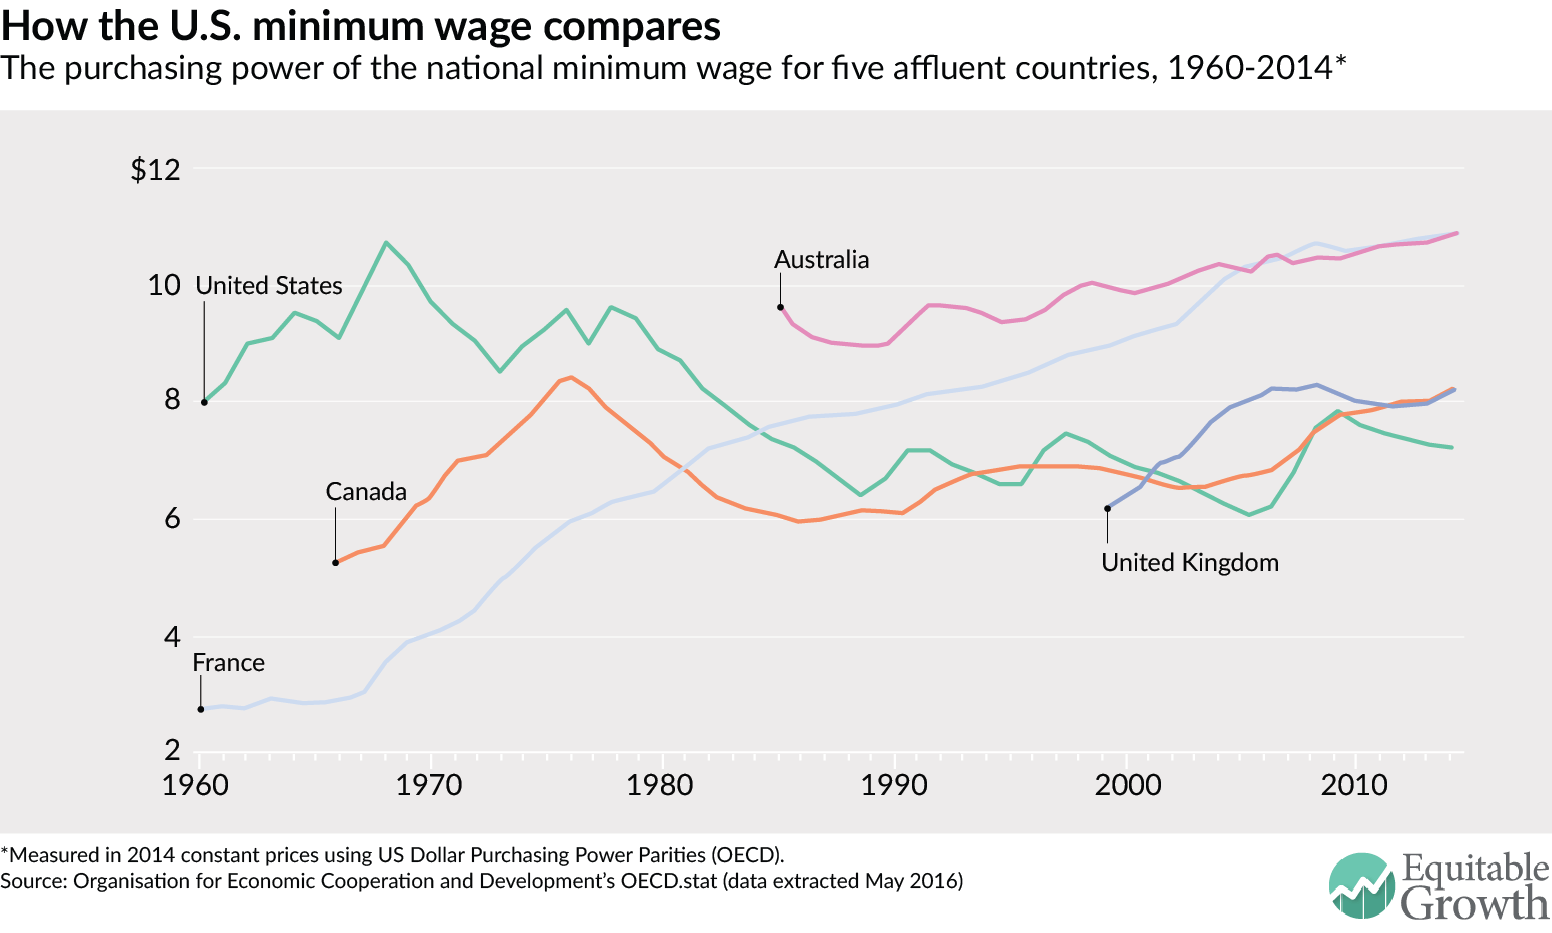
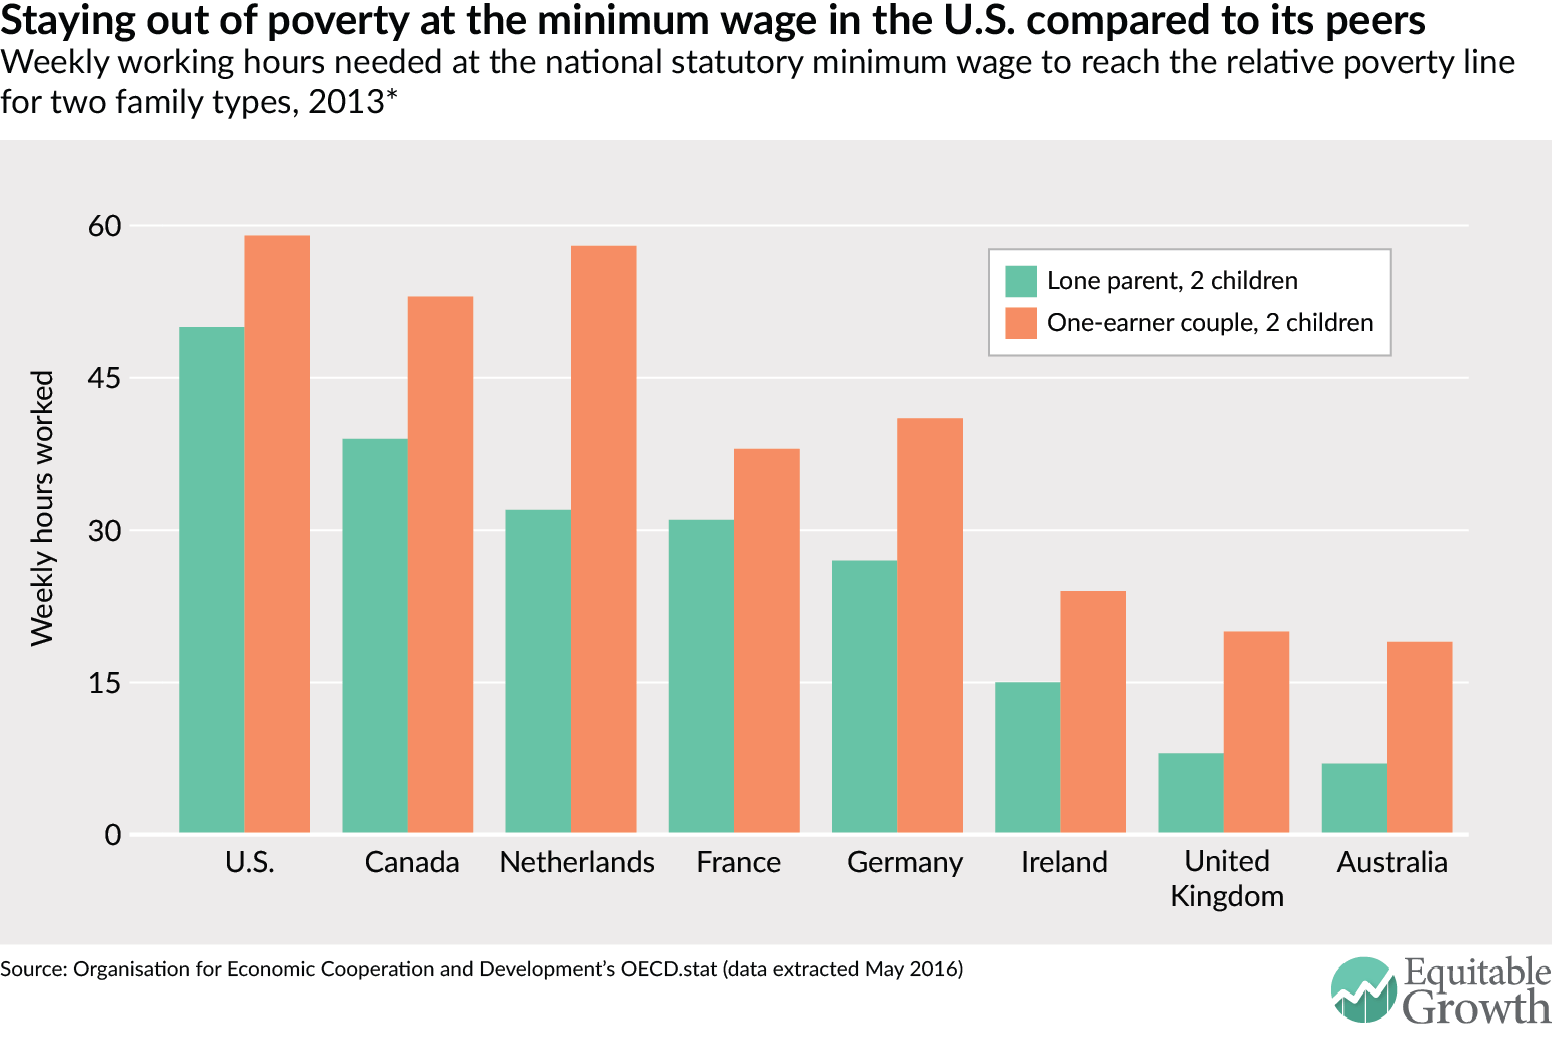
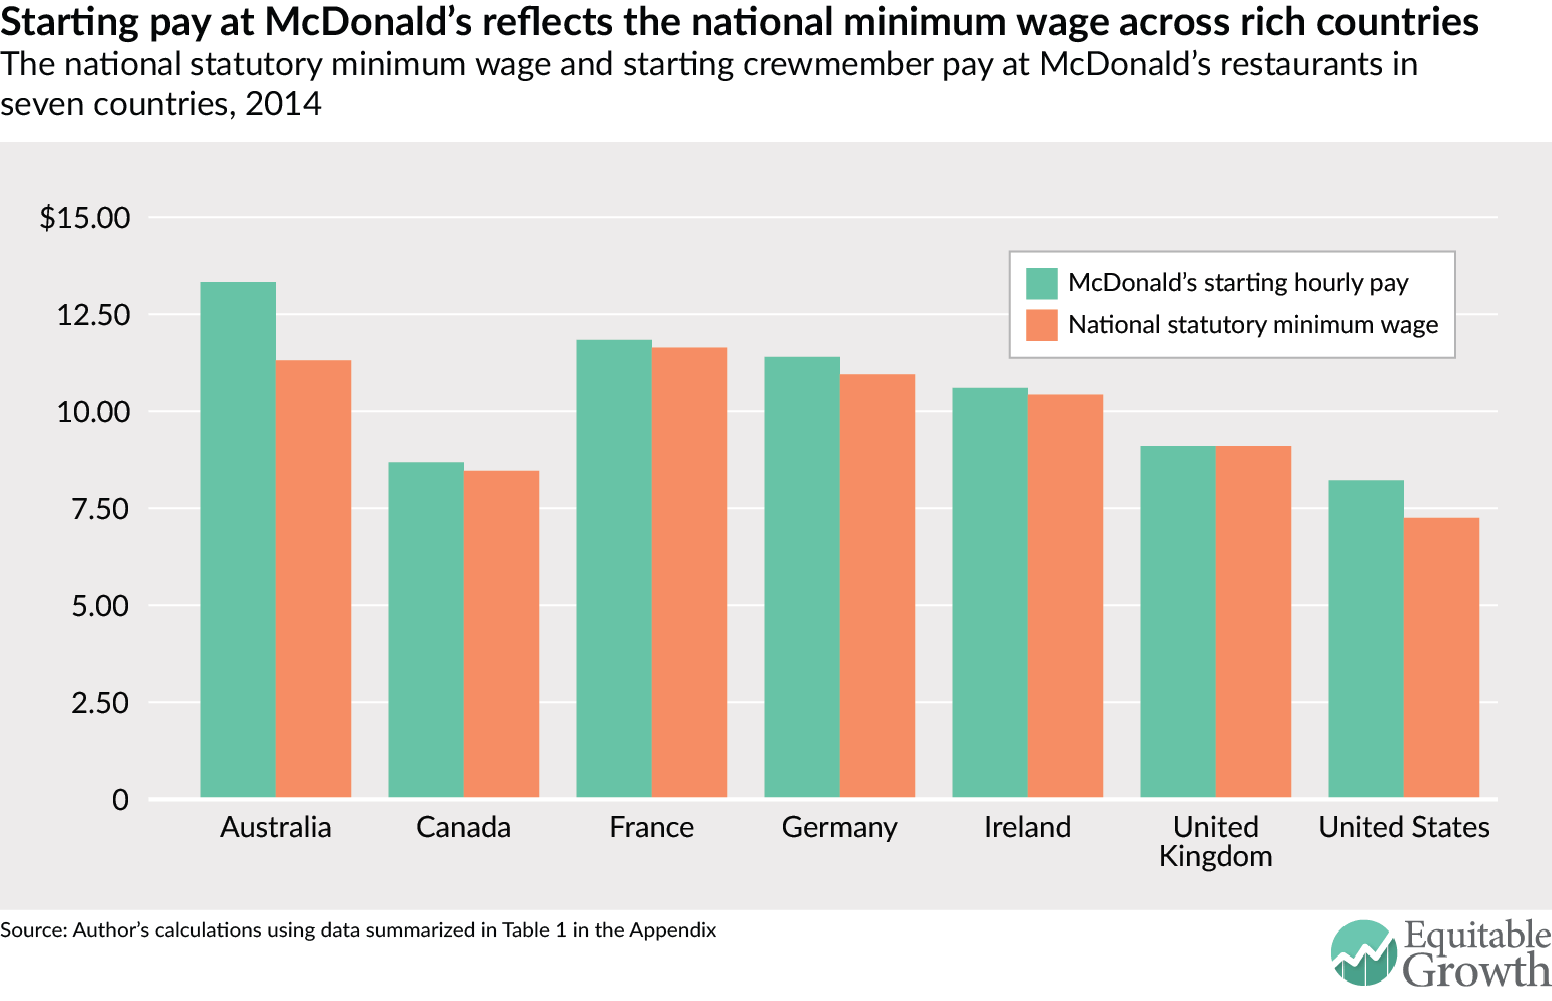
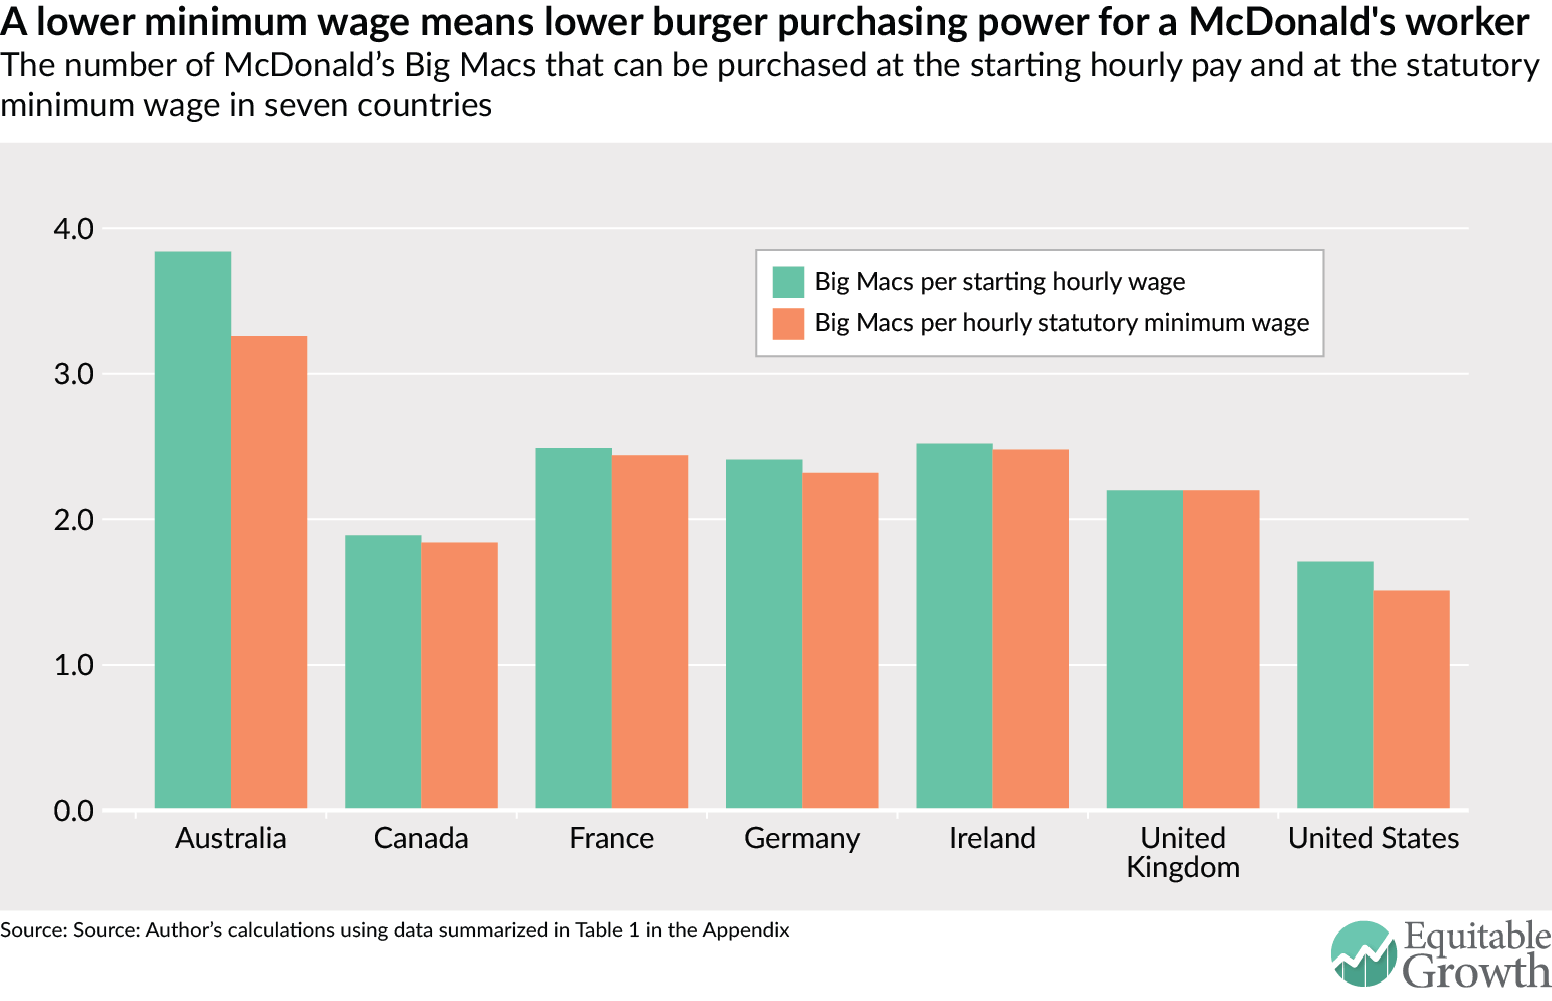
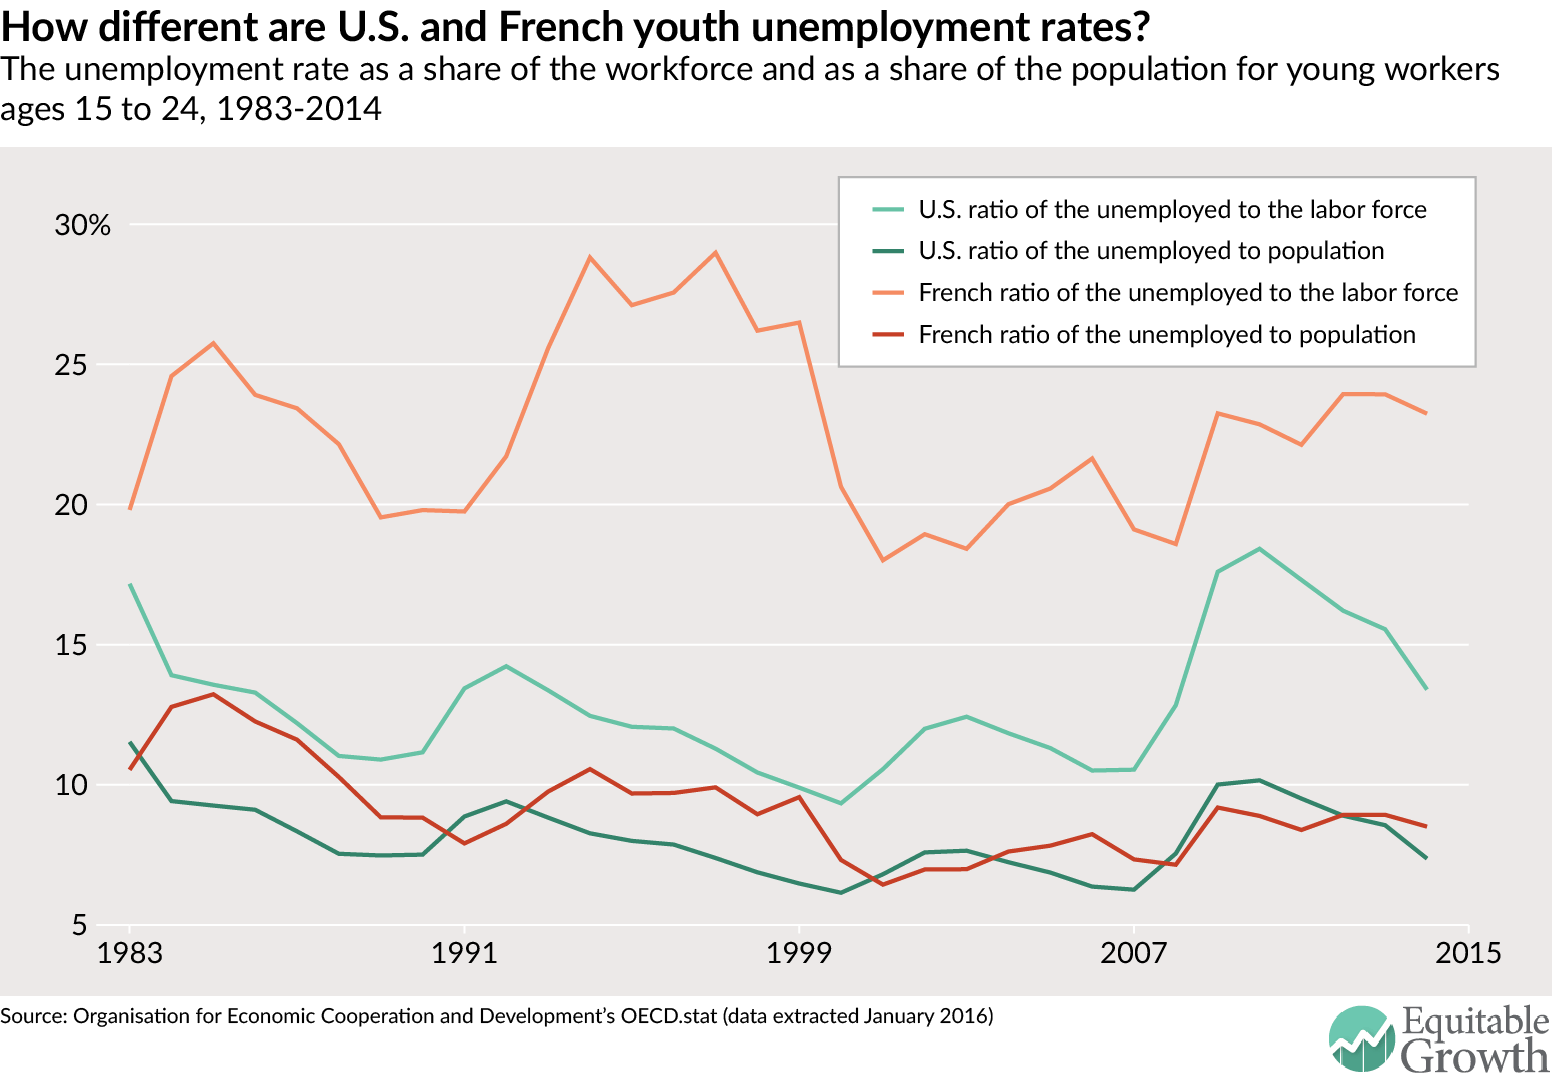
Indeed, Howell argues, “it’s worthwhile to look at the experiences of other advanced economies of the world.” In another analysis for Equitable Growth, he looks at lessons from other rich countries.10 He examines an array of data to show that the United States is at the low end of the minimum-wage level in terms of the median wage and purchasing power, pointing in particular to the purchasing power of a McDonald’s Corp. restaurant employee in select advanced countries. (See Figure 6.)

Figure 6

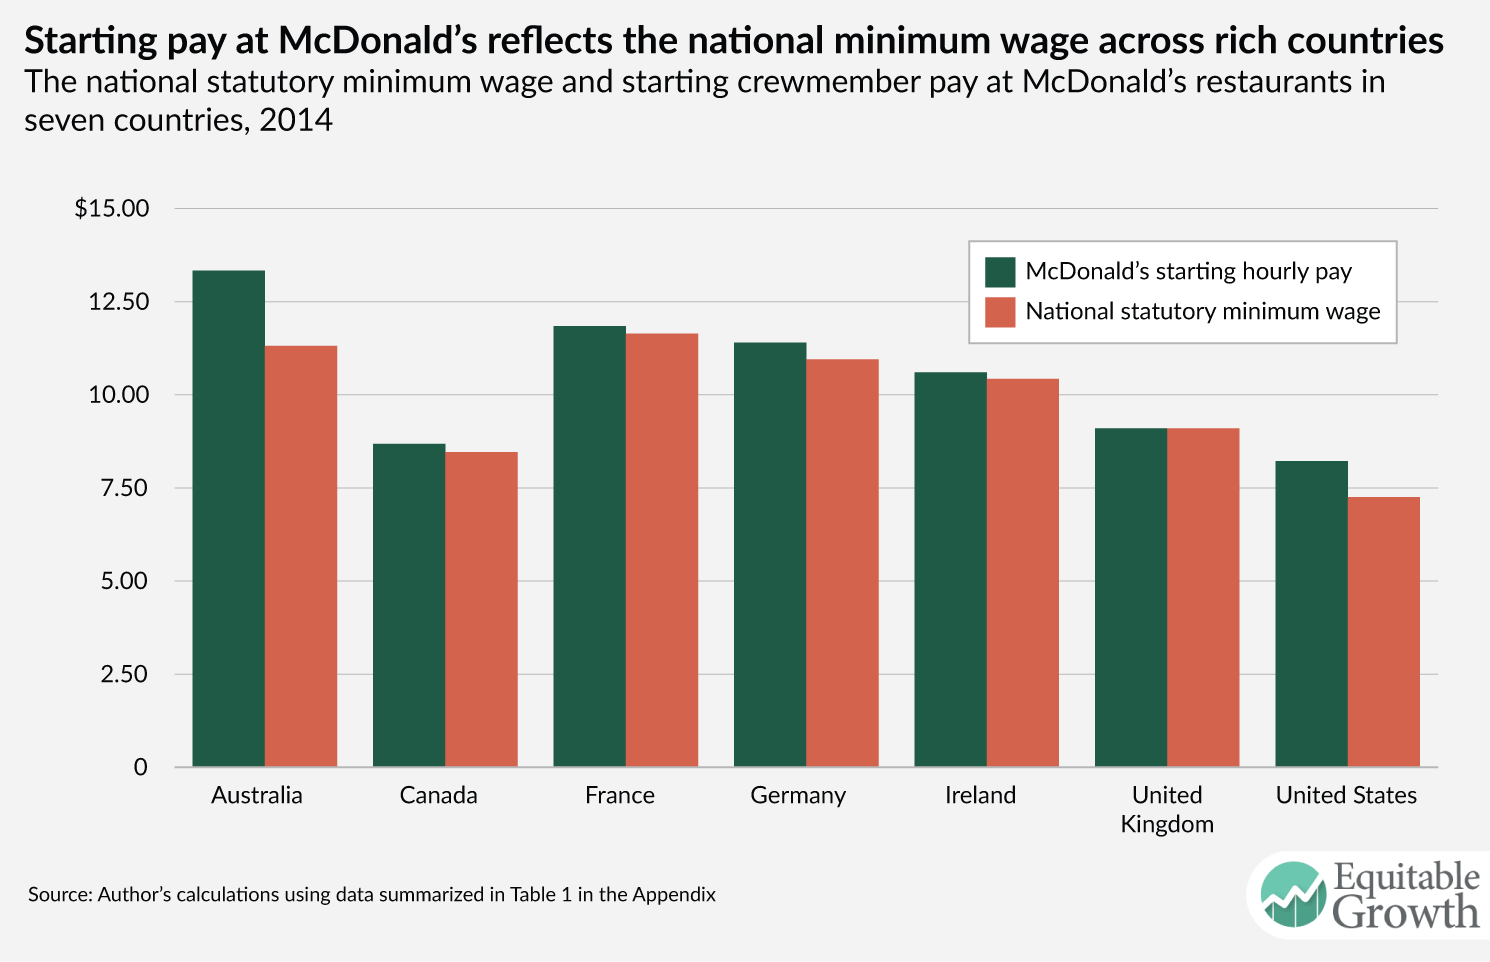
He concludes this research with the finding that “properly designed and implemented, much higher living standards are possible for working families in the United States by setting the federal minimum wage far above the current level of $7.25 without affecting overall employment opportunities for minimum-wage workers.”

How would indexing the minimum wage affect hourly workers?

Zipperer notes that “economic research on the minimum wage shows that between 1979 and 2012, more than 38 percent of the rise in inequality between the wage paid to the 10th percentile wage (the bottom 10 percent of U.S. workers earn this wage or less) and the median wage is due to the minimum wage failing to keep up with the median wage.”11 By indexing the minimum wage to the median wage, he argues that policymakers would “help prevent widening disparities between those at the bottom and the middle of the wage distribution.”

Importantly, wage indexing allows the minimum wage to rise in ways that the labor market can easily accommodate. Indexing the minimum wage to the general wage level means that roughly the same proportion of workers will earn the minimum wage year after year when the minimum wage rises, says Zipperer. As long as underlying wage inequality does not change too much, fixing the distance between the minimum and median wage will keep constant the share of workers earning at or near the minimum wage.

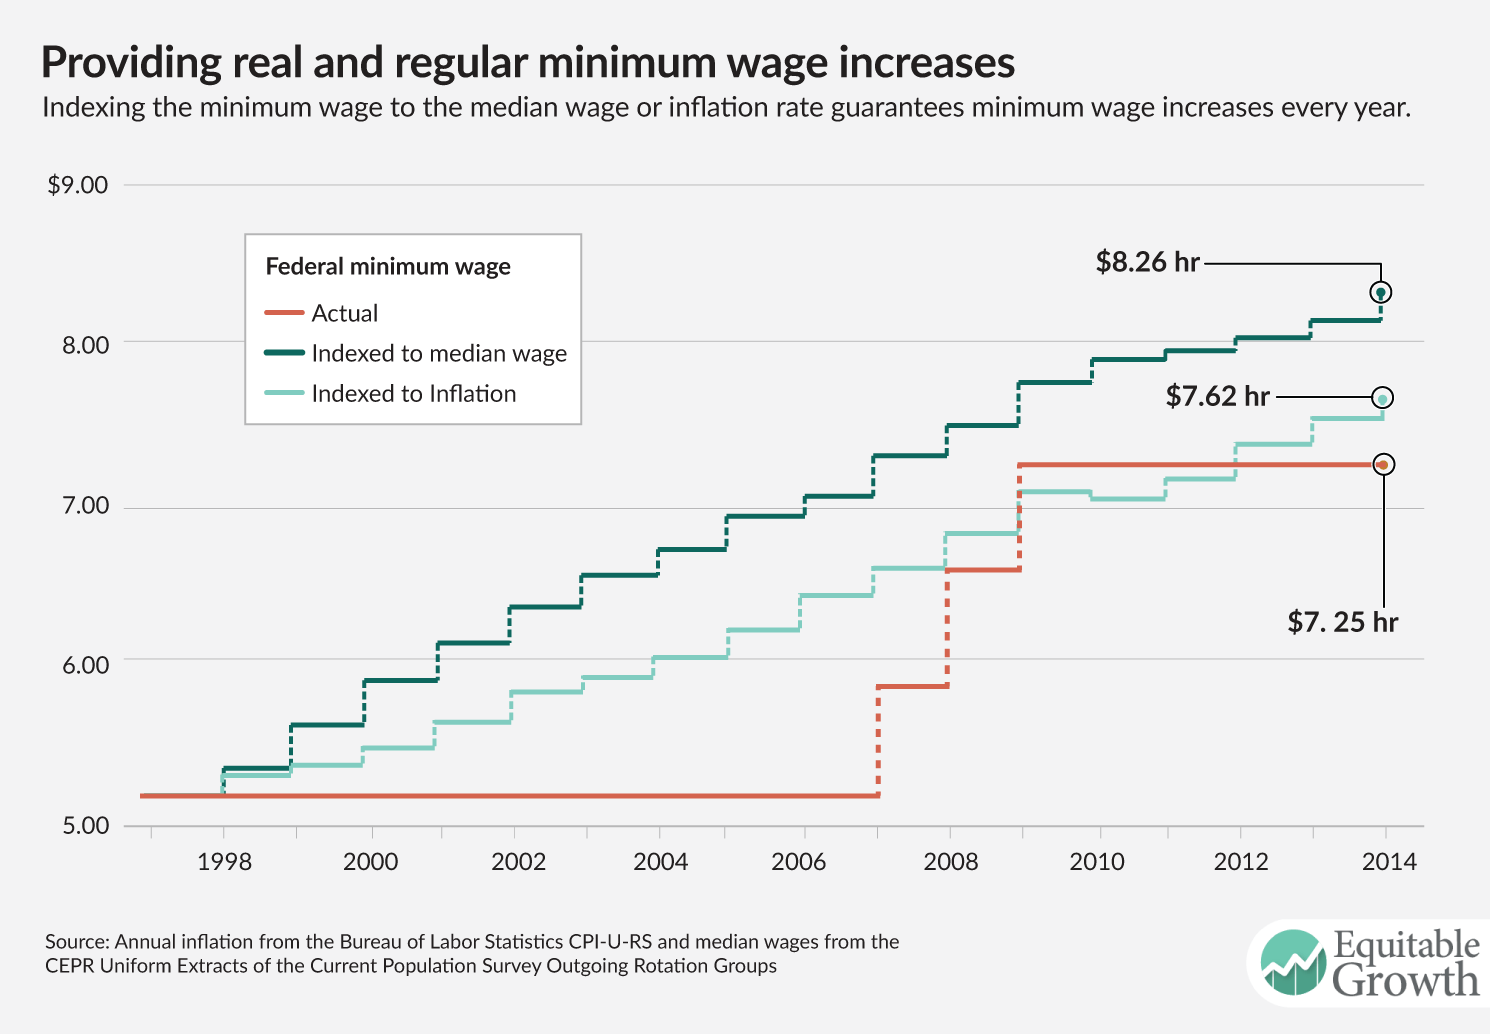
Because a regularly indexed minimum-wage increase will not substantially alter the share of workers earning the minimum wage, employers will more easily adjust to these indexed increases than they would to the irregular and larger increases typical of the current federal procedure and many of the state and local procedures, Zipperer says. Indexing to the median wage would require employers to raise wages for roughly the same proportion of their employees each year, whereas failing to index typically results in employers being required to raise wages for a much larger share of their workforces on less predictable basis. Here’s how indexing the minimum wage to the median wage—or alternatively to the rate of inflation—would guarantee minimum-wage increases every year. (See Figure 7.)

Figure 7

Conclusion

In testimony by Equitable Growth Executive Director and Chief Economist Heather Boushey before the U.S. Senate Committee on Health, Education, Labor, and Pensions on “From Poverty to Opportunity: How A Fair Minimum Wage will Help Families Succeed,” Boushey pointed out the three overarching benefits of raising the minimum wage:12

  • It would reduce poverty. According to various economic estimates, raising the minimum wage would lift millions of working families out of poverty.
  • It would help family breadwinners support their children. The typical minimum-wage earner brings in half of their family’s income. Congress should also take care to make sure that other benefits for low-wage workers provide a full package for low-wage workers and their families, as families will also need help with access to affordable and quality health care, childcare, and housing, even at a higher minimum wage.
  • It would deliver positive economic effects above and beyond lowering the poverty rate. Economic research points to the conclusion that a higher minimum wage does not cause greater unemployment, boosts productivity, and addresses the growing problem of rising income inequality.

Boushey concluded her testimony by noting that “the minimum wage is not a silver bullet in the fight against poverty [yet] any effort to reduce poverty and increase economic mobility at the bottom rungs of the income ladder into the middle class needs to include an increase in the minimum wage.” She said that, “the weight of economic research shows that raising the minimum wage would reduce poverty and work in tandem with other poverty-reducing programs to promote income mobility from the bottom up. In the largest economy on the planet, we need to work harder to reduce poverty. Increasing the minimum wage needs to be part of that effort.”

What U.S. Labor Department appointee Puzder doesn’t know about the minimum wage and how labor markets work

When the U.S. Senate begins hearings on the appointment of Andrew Puzder—President Trump’s choice to head the Department of Labor—it is important to consider his qualifications for leading a federal agency tasked with overseeing and enforcing the nation’s labor laws. Beyond his experience as chief executive of CKE Restaurants Holdings Inc., the privately held owner of several fast-food chains (among them Carl’s Jr.), Puzder has been an outspoken critic of labor regulations including minimum wage laws, overtime protections, and health and safety regulations.

Through the record of his op-eds, lobbying work on the behalf of the National Restaurant Association, and blog posts, policymakers and the public can get a clear picture that some of his opinions and beliefs are simply at odds with the facts or at the very least ignorant of recent evidence. In this issue brief, I compare some of Puzder’s widely publicized claims about the very labor regulations he would be tasked with upholding and enforcing, should he be approved by the Senate.

Download File
U.S. Labor Department appointee, the minimum wage, and labor markets

Read the full PDF in your browser

Minimum wage

Claim: “Instead of creating a living wage, the fight for dramatic minimum-wage increases could leave millions with no wage at all.”13

Puzder has opined about the consequences of raising the minimum wage more than any other topic. In this statement above and others like it he claims that even moderate minimum wage increases will lead to massive jobs losses. Rather than offering credible academic evidence, he typically bases these claims on simple platitudes such as “make something more expensive and employers will use less of it.”14

Yet there is an emerging consensus among economists that moderate increases in the minimum wage have no detectable negative impact on employment. This finding stems from research that examined every state-level minimum wage increase since the early 1990s and compares what happens to employment in low-wage sectors such as restaurants and among teenagers in counties that lie along a state border (where the minimum wage went up) versus counties on the other side of the state border.15 This careful research design amounts to an apples-to-apples comparison and does not make the mistake of comparing employment trends across states that have dramatically different population trends and economic bases. Several additional papers find similar results.16

Similarly, a host of economists have offered more realistic models of the labor market—models that recognize the natural dynamism of the so called labor-matching process between workers and employers. One of the key reasons that economists believe that moderate minimum wage increases do not lead to job losses stems from the observation that the typical textbook model of the labor market where employers are simple price takers and instantaneously match perfectly observable supply and demand curves hardly approximates the “real world.” Indeed, under these same models, a minimum wage increase actually kills job vacancies rather than jobs because employees stay longer in their current positions rather than moving to other jobs across the street.

Instead, workers value their jobs more under a higher wage and put in more effort, resulting in higher productivity and a lower firing rate. Empirical research bears this out, as turnover-rates fall dramatically in the face of a minimum wage increase.17 Ultimately, Puzder’s views on the minimum wage do not take into account new and important credible economic research.

Healthcare

Claim: “The evidence that Obamacare is having a negative impact on hiring is unequivocal, abundant and consistent with common sense.”18

Puzder also has written extensively about the costs of the employer-mandate component of the Affordable Care Act. Not surprisingly, he opposes this regulation, basing his views on the burdensome costs that restaurant owners and other low-wage employers will have to pay. Yet in the course of his arguments he misrepresents some basic facts about employment data that are published by the U.S. Bureau of Labor Statistics, which is part of the Department of Labor that he seeks to lead.

Puzder erroneously claims that the vast majority of large employers are switching from hiring full-time workers to part-time workers to avoid the 30-hour-per-week threshold for the employer mandate to provide heath care under the Affordable Care Act. He looks at one six-month period of BLS data in 2014 and concludes that the only new jobs added were part time jobs.19 This claim seemed so unfounded that I simply looked at the record of job creation since the last quarter of 2013—the quarter in which the so-called “look back period” could plausibly begin before the mandate actually took effect at the beginning of 2014—through to the end of 2016. The data show just the opposite of what Puzder claims. (See Figure 1.)

Figure 1

More specifically, based on a basic interpretation of this data, we can see that contrary to Puzder’s claim, the pace of job creation was faster for full-time workers than part-time workers, growing 6.2 percent since the 4th quarter of 2013, compared to 1.7 percent, respectively. If employers were sharply shifting toward part-time work, then we would expect to see the opposite trend.

Even though the data betray the point the Puzder was trying to make, he still bases his opposition to the employer mandate based on a faulty and simplistic understanding of the labor market. He views workers as perfectly interchangeable units that lack the possibility for learning on the job or improving productivity. He writes:

“The logic for businesses is simple. If you have three employees working 40 hours per week they will produce 120 labor hours. Five employees working 24 hours per week also produce 120 labor hours. Employers must offer the three full-time employees health insurance or pay a penalty. They have no such obligation to the five part-time employees, making part-time employment less costly.”20

One reason why employers haven’t shifted completely away from full-time work is that full-time workers tend to be better, more experienced workers who, in return for more hours, are ultimately more productive.

Recent research in the very industry Puzder bases his expertise on bears this out. In a recent paper, I compared the labor practices of full-service restaurants in two metropolitan regions with vastly different labor regulations—San Francisco—which has a $15 minimum wage, an employer healthcare mandate, and paid sick leave—and the Research Triangle in North Carolina, where no local mandates are allowed.21 Based on interviews with restaurant owners and managers from a variety of sizes and price levels, several things stood out.

First, employers in San Francisco conducted more careful searches for highly skilled employees who invested in their own training and were ultimately more productive. Employers there were more likely to talk about their workers as professionals, rather than replaceable units. Turnover rates in San Francisco in the restaurant industry were markedly lower than in North Carolina as a result. Second, many employers in North Carolina, who are allowed to paid tipped workers a wage as low as $2.13 per hour, built a business model that accepts an extremely high turnover rate and invests little in improving worker productivity. Moreover, restaurant managers in North Carolina were more likely to view workers as disposable and easily replaceable.

The upshot: policymakers need to consider more carefully Puzder’s understanding of at least these two aspects of his prospective job heading up the Department of Labor—the importance of the minimum wage for broad-based wage growth in the U.S. economy, the very basic evidence about the impact of workers’ benefits on the creation of full-time and part-time jobs, and the importance of higher wages and benefits on economic productivity and employer profits.

—T. William Lester, Associate Professor of City and Regional Planning, University of North Carolina-Chapel Hill

U.S. homeownership tax policies are expensive and inequitable

The analysis “U.S. homeownership tax policies are expensive and inequitable,” contained errors that had been identified by Equitable Growth. Before the errors could be corrected, Congress enacted major tax legislation that substantially changed the policies discussed in the piece. As a result, Equitable Growth no longer plans to post a corrected version of the analysis and has removed the original.

The employment effects of a much higher U.S. federal minimum wage: Lessons from other rich countries

Overview

Not long ago, most U.S. economists agreed that a statutory minimum wage with any “bite”—any meaningful effect on wages at the bottom of the labor market—would cause job losses and lead to a reduction in aggregate employment opportunities for low-wage workers. But as a result of path-breaking research by leading economists (first David Card at the University of California-Berkeley and Alan Krueger at Princeton University, and then by Arindrajit Dube at the University of Massachusetts-Amherst and Michael Reich at University of California-Berkeley and their associates, that has changed. Today, a vast majority of economists now understand that modest increases in the (currently very low) federal minimum wage would have little or no effect on overall job opportunities for minimum wage workers.

Download File
The employment effects of a much higher U.S. federal minimum wage: Lessons from other rich countries

Read the PDF in your browser

But what about the effects of a sizable increase of, say, more than double the current federal $7.25-an-hour minimum wage? What would a wage floor of $15 an hour mean for low-wage workers and U.S. economic growth?

This policy brief documents big differences in the national statutory minimum wage floor across several other affluent countries compared to the United States. The analysis shows how these differences translate into very large consequences for the incidence of low pay and the buying power of low-wage workers—using a wide variety of data, including workers’ starting pay and the famous “Big Mac” index of burger prices at McDonald’s restaurants in these countries—and concludes by reporting evidence that these substantial differences in approaches to low pay across the rich world show no correspondence to standard indicators of employment performance.

In short: Neither employment nor unemployment rates reflect the vast gap between the United States and other rich countries that have all but outlawed the payment of extremely low wages by establishing legal wage floors far above the U.S. federal minimum wage.

The minimum wage landscape in affluent nations

Rich countries have taken dramatically different paths on setting a lower boundary for wages. Some, including Denmark and the Scandinavian countries, have relied on extensions of collective bargaining agreements to set legal wage floors. This obviously is not how the U.S. labor market operates, so the focus of this issue brief is on those nations with statutory national minimum wages.

First, consider France. The French minimum wage climbed from about 35 percent of the median wage for full-time workers in the 1960s to 61 percent in 2014. In contrast, the U.S. minimum wage floor was around 50 percent of the median in the 1960s but has since fluctuated between 35 percent by the late 1980s and 37 percent in 2014. Then there is Australia, where the minimum wage also fell—from 65 percent in the early 1990s to 53 percent in 2014—but only because the country’s median wage rose faster than the statutory wage. Canada’s minimum-to-median wage rate followed about the same trajectory as the United States from the 1960s to about 1990 and has since ranged between 40 percent and 45 percent of the median wage, where it is today—well above the United States. The United Kingdom introduced a statutory minimum wage only in 1999, and as the chart shows, its value has increased relative to the median from about 40 percent in 2000 (like Canada) to 47 percent in 2014 (slightly above Canada and far above the United States). (See Figure 1.)

Figure 1

Another way to compare the minimum wage across national borders is in terms of purchasing power. The minimum wage in Australia and France buys a lot more than in the United Kingdom and Canada, and substantially more than in the United States. In Australia and France, the purchasing power of their minimum wage was equivalent to $10.90 in 2015. The wage floors in the United Kingdom and Canada are much lower—about $8.15 in 2015—but still considerably higher than the United States, where the federal minimum wage was $7.24 (below $7.25 because the figure uses 2014 constant dollars and there was slight inflation between 2014 and 2015). (See Figure 2.)

Figure 2

But the take-home pay of minimum-wage workers depends on both taxes and the effects on eligibility for benefits. A recent report on the minimum wage by the Organisation for Economic Cooperation and Development put it this way:

Without effective co-ordination, minimum wage hikes may not result in significant income gains for the targeted individuals, especially in countries where tax burdens on low-wage earners are sizeable, or where means-tested out-of-work transfers provide a comprehensive income safety net.

The OECD’s estimates of the weekly working hours a minimum wage worker needs to keep a family out of poverty varies enormously, from 50-to-59 hours in the United States (depending on the type of family) to 31-to-38 hours in France, to just 7-to-19 hours in Australia. Given taxes and benefits, Canada and the Netherlands are more like the United States, Ireland and the United Kingdom are more like Australia, and France and Germany fall in the middle. A one-earner couple with two children in the United States, for example, would require 59 hours of minimum wage work a week to keep that family out of poverty compared to 53 hours in Canada, 41 hours in Germany, 38 hours in France, 20 hours in the United Kingdom, and 19 hours in Australia. (See Figure 3.)

Figure 3

We can also get a good idea of the relative purchasing power of the minimum wage in different countries by comparing the starting wages at McDonald Restaurants, which is closely associated with the national minimum wage in each country, and by calculating the number of Big Mac burgers a minimum wage worker can buy for an hours work (at the pre-tax wage). The starting pay for a crewmember in these fast-food restaurants is, indeed, highly correlated with the nation’s minimum wage. In 2014, for example, starting pay at the restaurant chain in Australia averaged $13.33 compared to the minimum wage $11.31. This compared with $11.84 (and $11.64) in France, and just $8.22 (and $7.25) in the United States. The takeaway is that, not surprisingly, starting pay for fast food workers is far higher in countries that have a higher national minimum wage. (See Figure 4.)

Figure 4

Not only is starting pay at McDonald’s extremely low in the United States compared to other rich countries, but so too is the price of a Big Mac relatively high in this country compared to other affluent countries. The combination of low pay and high prices means that the number of Big Macs a McDonald’s entry-level worker can buy is 3.8 in Australia, 2.5 in France and only 1.7 in the United States. The pattern is the same for workers’ ability to buy Big Macs at the national minimum wage: 3.3 in Australia, 2.4 in France, and 1.5 in the United States. (See Figure 5.)

Figure 5

The employment effects of the minimum wage in the United States and other affluent countries

According to conventional thinking, there are big wage-employment tradeoffs associated with a high minimum wage. As a result, while there may be some low-wage workers in Australia and France who will benefit from higher wages, many will be “priced-out” of a job. In this view, a higher minimum wage, together with higher rates of collective bargaining (among other factors) explains cross-country differences not only in the incidence of low pay, but in employment and unemployment rates for minimum wage workers.

If these so-called “labor market rigidities” price workers out of the labor market, then reducing the low-wage share of employment (via a higher minimum wage) should also reduce the low-education employment rate because young, less-educated workers should have a harder time finding and keeping jobs.

Yet the data offer little support for this orthodox tradeoff view. Rather, OECD data show that while there is a huge 14-percentage point gap in the low-wage share of employment between France (11 percent) and the United States (25 percent), the employment rates for young, less-educated workers are only moderately higher in the United States (57.4 percent compared to 54.9 percent). Similarly, Australia’s incidence of low pay is more than 10 percentage points below the U.S. level, but the low-education employment rate is more than 4 points higher, illustrating the lack of any statistical relationship across affluent countries between the incidence of low pay and the employment rate for less-educated young adults. (See Figure 6.)

Figure 6

But what about youth unemployment rates? There are two alternative unemployment rates that enable comparisons across countries. One is unemployment measured as a share of the labor force; the other is unemployment as a share of the working age population. Comparing these two measures in the United States and France and in the United States and Australia among young workers ages 15 to 24 shows no obvious correspondence between either measure and the level or trajectory of the national minimum wage.

First let’s look at the United States and France. If the conventional wisdom were correct, then United States-French youth unemployment rates should have sharply diverged. But what we see instead is considerable convergence. From 1997 to 2007 the French unemployment rate for 15-to-24 year olds fell dramatically, from 30 percent to 19.1 percent, while the U.S. rate increased from 11.3 percent to 12.8 percent, and France continued to close the unemployment gap between 2007 and 2010 (see Figure 7). This 1997-2007 convergence took place as the French minimum wage increased from 54 percent to 62 percent of the nation’s full-time median wage while U.S. federal minimum wage fell from 39 to 31 percent—exactly half the French ratio (see figures 1 and 2). Over the entire 1997-to-2014 period, the conventional French unemployment rate improved by 6.8 percentage points and the U.S. rate worsened by 2.1 points.

Figure 7

Figure 7 also compares France and the United States on a much better measure of youth unemployment: the unemployment-to-population rate. This indicator shows that these countries have tracked each other closely since 1983, with the rate in both countries fluctuating between 6 and 10 percent. In short, neither unemployment measure shows any evidence of the predicted divergence in French-U.S. employment performance.

Comparing these two unemployment-rate measures for Australia and France also fails to confirm the conventional tradeoff prediction. As in France, Australia has legislated a high minimum wage by international standards. (See Figures 1 and 2.) Yet, by both indicators, youth unemployment fell sharply between the early 1990s and the global 2008-2010 economic crisis—to levels below the United States. (See Figure 8.)

Figure 8

Other affluent countries provide much higher and more universal support for working families than the United States, in the form of health care, housing, education, and child subsidies. This means the legal wage floor must carry a much higher burden for maintaining minimally decent incomes for working families than in other rich countries.

Yet, as the data presented in this policy brief demonstrates, the United States is at the extreme low-end among affluent countries on the level of the minimum wage, whether measured in terms of buying power or relative to the median wage. (See Figures 1 and 2.)
As a result, after taking into account taxes and benefits, it typically takes a minimum wage worker six to seven times as many hours of work per week to keep a lone parent or two child family out of poverty compared to the United Kingdom or Australia (50 hours versus 7 or 8 hours). (See Figure 3.)

This gigantic gap in the payoff to working at the minimum wage for U.S. workers can also be illustrated by the much lower starting pay at McDonald’s franchises, and the far fewer Big Macs a U.S. worker at McDonald’s can buy with an hour’s work than her counterparts in other rich countries. (See Figures 4 and 5.) At the same time, standard measures fail to show the predicted worsening of youth employment performance between the United States and countries that set a much higher legal wage floor, such as Australia and France. (See Figures 6, 7, and 8.)

All of this international evidence strongly suggests that, properly designed and implemented, much higher living standards are possible for working families in the United States by setting the federal minimum wage far above the current level of $7.25 without affecting overall employment opportunities for minimum-wage workers.

—David Howell is a professor of economics and public policy at The New School in New York City. This note reflects and builds on the material that appears in the Washington Center for Equitable Growth working paper, “What’s the Right Minimum Wage? Reframing the Debate from ‘No Job Loss’ to a ‘Minimum Living Wage,” co-authored with Kea Fiedler and Stephanie Luce. Special thanks to Kea Fiedler for her work on the McDonald’s data.

Photo by Remy De La Mauviniere, Associated Press

The misplaced debate about job loss and a $15 minimum wage

Overview

The leading criticism of the “Fight for $15” campaign to raise the federal minimum wage to $15 an hour is the presumed loss of jobs. Employers, the argument goes, would eliminate some workers or reduce their hours in the short-term, and in the longer run, further automate their operations in order to ensure that they will need fewer low-wage workers in the future. For many leading minimum wage advocates, even a gradually phased-in $12 wage floor would take us into “uncharted waters” that would be “a risk not worth taking.”

On the other side is the long historical concern with making work “pay,” even if that means some job loss. In this view, the most important consideration is the overall employment impact on low-wage workers, after accounting for the additional job creation that will come with higher consumer spending from higher wages, which will almost certainly at least offset any direct initial job losses. And even more importantly, what really matters in this view are the likely huge overall net benefits of a large increase for minimum-wage workers and their families.

Download File
The misplaced debate about job loss

Read the PDF in your browser

If we are serious about job opportunities for low-wage workers then there are many effective ways to compensate those who lose their jobs, ranging from expansionary economic policy to increased public infrastructure spending, more generous unemployment benefits and above all, public-sector job creation. A related issue is whether it makes moral, economic and fiscal sense to maintain a low federal minimum wage and then ask taxpayers to subsidize the employers of low-wage workers by propping up the incomes of poor working families only via means-tested programs such as the Earned Income Tax Credit and supplemental nutrition assistance.

The debate has been, effectively, a stalemate, with the federal minimum wage set at extremely low levels ($7.25 since 2008) by both historical and international standards. Part of the explanation for our persistent failure to establish a minimally decent wage floor at the federal level has been the way the discourse has been framed—even by many of the strongest advocates for substantially higher minimum wage.

In recent years, the best evidence shows that moderate increases from very low wage floors have no discernible effects on employment, which has helped make the case for substantial increases in the minimum wage. But the very strength of this new evidence— research designs that effectively identify employment effects at the level of individual establishments—has contributed to the adoption of a narrow standard for setting the “right” legal wage floor—defined as the wage that previous research demonstrates will pose little or no risk of future job loss, anywhere. For all sides, the central question has become: Whose estimate of the wage threshold at which there is no job losses whatsoever is the most credible?

Some economists, for example, point to existing evidence that the effects on employment when the minimum wage is increased within the $6-to-$10 range are minimal. Yet other researchers continue to argue, with credible statistical support, that sizable increases within this $6-to-$10 range do cause at least some job loss in some establishments in some regions, even if limited to high-turnover teenagers.

But there certainly is no evidence that can be relied upon to identify the no-job-loss threshold for a legal wage floor that would apply to the entire United States—the wage below which it is known that there is little or no risk of job loss anywhere, and above which there is known to be a risk of job loss that is high enough to be not worth taking. The only truly reliable way to do this would be to regularly increase the federal minimum wage while carefully monitoring the employment effects, much as the United Kingdom’s Low Pay Commission has done for the minimum wage that was instituted there in 1999.

There are different stakeholders in this debate. On the one side, there are the academic economists who care deeply about empirical confirmation of price-quantity tradeoffs and restaurant owners who care equally as much about their profit margins. On the other side, there are workers and their advocates who desire the establishment of a minimum living wage. Given the many parties with a big stake in the outcome, relying on evidence-based criteria about job loss for setting the wage floor all but guarantees unresolvable controversy.

The methodological double bind in setting the minimum wage

Then there is the methodological problem—a classic case of “Catch 22.” Because the identification of the wage at which there is expected to be zero job loss must be evidence-based, there is no way to establish the higher nationwide wage floors necessary for empirical tests. There are other places that have enacted higher minimum wages—think Santa Monica, Seattle, New York state, France, Australia or the United Kingdom—but they would face the same problem if they relied exclusively on zero job loss as the criterion for the proper wage floor. In practice, high minimum wage locations have relied on other criteria when making the political choice to set the legal wage, namely a wage that more closely approximates a minimum living wage than what the unregulated market generates.

In practical terms, local and state government’s past reliance on statistical tests for other jurisdictions not only means that we must assume that they are directly applicable (why would evidence from Seattle, New York state or the United Kingdom be a reliable guide to the effects at the level of the entire U.S. labor market?), but also requires that places imposing a no-job-loss standard must always lag far behind the leaders, and effectively condemns them to setting the wage floor well below the actual wage that will start generating job loss. In short, the no-job-loss criterion cannot stand on its own as a coherent and meaningful standard for setting the legal wage floor, and by relying on old statistical results from other places, ensures a wage that is too low on it own terms.

Ignoring the net benefits of raising the minimum wage

When the criterion for raising the minimum wage is concerned only with the cost side of an increase, the costs of some predicted job losses are all that matters. If the wage floor is set above the no-job-loss level, what kind of jobs will be lost? Who will be the job losers? What alternatives were available to them? These are the kinds of questions that must be asked to determine the costs of minimum wage related job losses. But there are obviously benefits to raising the legal wage floor. Shouldn’t they be counted and compared to the costs?

Those benefits are evident directly for the workers receiving wage increases as a result of a rise in the minimum wage, either because they are earning between the old minimum wage and the new one (say, between $7.25 and $15) or because they earn a bit above the new minimum wage—because employers increase wages to maintain wage differentials among workers by skill or seniority. The benefits also are evident for taxpayers–with a much higher minimum wage there would be less need to rely on means-tested redistribution to increase the after-tax and benefit incomes of working families.

Forgetting the ethical and efficiency arguments for raising the minimum wage

Relaying on the no-job-losses criterion for setting an appropriate federal wage floor entirely ignores the main traditional justification for the minimum wage: The moral, social, economic, and political benefits of a much higher standard of living from work for tens of millions of workers. On both human rights and economic efficiency grounds, workers should be able to sustain at least themselves and ideally their families. And on the same grounds, it is preferable to do so from their own work rather than from either tax-based public spending or private charity.

It is hard to put this argument for a living wage better than Adam Smith did several centuries ago:

A man must always live by his work, and his wages must at least be sufficient to maintain him. They must even upon most occasions be somewhat more; otherwise it would be impossible for him to bring up a family…. No society can surely be flourishing and happy, of which the far greater part of the members are poor and miserable.

A public policy straightjacket

Determining a suitable federal minimum wage based solely on a zero job loss rule is a public policy straightjacket that would effectively rule out any significant raise of the wage floor above that which already exists. Yet from a historical perspective, strict adherence to such policymaking criteria would have also made it impossible to ban child labor (job losses!), as well as many critical environmental and occupational health and safety regulations. It would also foreclose any consideration of policies like paid family leave, which exists in every other affluent country.

Conclusion

Breaking out of this public policy straightjacket requires policymakers to rethink their criteria for raising the minimum wage. It also means that economists must shake off their fear of challenging the prevailing orthodoxy—a no-immediate-harm-to-anyone way of thinking—and see the longer-term benefits to millions of workers. It is estimated that the move to a $15 minimum wage by both California and New York state will directly raise the pay for over one-third of all workers.

If we really care about maximizing employment opportunities then we should not hold a decent minimum wage hostage to the no-job-loss standard. Rather, we should put a much higher priority on full-employment fiscal and monetary macroeconomic policy, minor variations of which would have massively greater employment effects than even the highest statutory wage floors that have been proposed.

But it is also well within our capabilities to counter any job loss that can be linked to the adoption of what the prominent University of Chicago economist J. B. Clark in 1913 called “emergency relief” such as extended unemployment benefits, education and training subsidies, and public jobs programs. A minimum living wage combined with other policies common throughout the affluent world, such as meaningful child-cash allowances, would put the United States back among other rich nations that promote work incentives while all but eliminating both in-work poverty and child poverty. It would put the country into waters that most other affluent nations have charted and are already navigating.

—David Howell is a professor of economics and public policy at The New School in New York City. This note reflects and builds on the material that appears in the working paper published by the Washington Center for Equitable Growth, “What’s the Right Minimum Wage? Reframing the Debate from ‘No Job Loss’ to a ‘Minimum Living Wage,’” co-authored with Kea Fiedler and Stephanie Luce.

Photo Uncredited, Associated Press

Equitable Growth in Conversation: An interview with Claudia Goldin

“Equitable Growth in Conversation” is a recurring series where we talk with economists and other social scientists to help us better understand whether and how economic inequality affects economic growth and stability.

In this installment, Equitable Growth’s Executive Director and Chief Economist Heather Boushey talks with economist Claudia Goldin about the gender wage gap and some of its implications. Read their conversation below.


Heather Boushey: I want to focus on your work on the gender wage gap. Lots of us have been thinking about this for a long time and noticed that you have gotten a lot of attention in the press for your recent research on this, so I wanted to ask you some questions teasing out both what it is and what some of the implications are.

In your paper, “A Grand Gender Convergence: Its Last Chapter“—and I love the title of that—you argue that the gender wage gap cannot be explained by differences in productivity between men and women. Instead, when we look at occupations, we see that there is a price paid for flexibility in the workplace. And given what people are thinking about in terms of policy, that seemed like a really good place to start our conversation today. Can you tell me a little bit more about this result?

Claudia Goldin: So the key finding is that there is a gender wage gap. But the question is why? We know from lots of people’s work that we used to be able to squeeze a lot of the gap away due to differences in education—differences in your college major, whether you went to college or not, whether you have a Ph.D., an M.D., whatever. We were also able to squeeze a lot away on the basis of whether you had continuous work experience or not.

Today, we are not able to squeeze much away. In fact, women on average have more education than men. The quantities [of women with college degrees] are higher, and even the qualities [of degrees] aren’t that much different anymore. And the extent of past labor force participation is pretty high. Lifecycle labor force participation for women is very, very high. So we can’t squeeze that much away anymore.

What’s also really striking is that, given lots of factors such as an individual’s education level, many occupations have very large gender gaps and some occupations have very small gender gaps. Looking at occupations at the higher part of the income spectrum, which is also the higher part of the education spectrum — so occupations where about 50 or 60 percent of all college graduates are—we see that the biggest gaps are in occupations in the corporate and finance field, in law, and in health occupations that have high amounts of self-employment. And the smallest gaps are found in occupations in technology, in science, and in lots of the health occupations where there is a very low level of self-employment.

That’s sort of a striking finding.

Then when we dig deeper and look at particular occupations—in law, for example, and in the corporate and finance field—we see a couple of things. We see that differences in hours have very high penalties even on a per hour basis. Differences in short amounts of time off have very high penalties, unlike in other fields. And many of the differences occur at the event of or just after the event of first birth. So there is something that looks like women disproportionately, relative to men, are doing something different after they have kids.

When we look at men and women in the finance and corporate fields who haven’t taken any time off and among the women who don’t have kids, we find that the differences are really tiny. So those are the differences that are coming about, not surprisingly, from the fact that women are valuing predictability, and flexibility, and many other aspects of the job that many men are not valuing.

So, looking at data for the United States, we find that this change from being an employee, a worker, and a professional, to being an employee, a worker, a professional, and a parent has a disproportionate impact on women.

Now one might say, isn’t that because the United States has really lousy coverage in terms of parental leave policy, and in terms of subsidized daycare? Well, there are two very interesting papers, one for Sweden and one for Denmark. Both countries have policies that are just about the best in the world, and these studies, using these extraordinary cradle-to-grave data that they have, look at the widening in the — what men are getting versus women is occurring at — they can do an event study at that [having a child].

And women are moving into occupations that have more flexibility, but they are working fewer hours and getting less per hour. And the same sorts of things are going on even in countries that have incredibly good parental leave policies, subsidized daycare, schools that appear to us to be better, and what we think of as social norms that are better.

Boushey: One of the things that you found in your research that you haven’t mentioned yet is this idea that some workers are more substitutable—this idea that the industries with a high level of self-employment play some role in the gender pay gap. Could you explain that a little bit?

Goldin: Well, it would be very nice for us to go to each one of these occupations and take part in each one of these occupations and learn something about them. We can’t do that so instead we use the O*NET database, which gives us a lot of information about what goes on in these occupations.

And in O*NET, there are certain characteristics of the occupations that seem to map very nicely into aspects that would appear to be important, such as how predictable the job is, what the time demands are, whether you have to deal with clients, or whether work relationships are important.

And much of that is related to the issue about whether if an individual wants to leave work at 11 o’clock in the morning but do the same task at 11 o’clock at night, whether that’s severely penalized. That would be penalized if the individual can’t easily hand off work to someone else if it is needed at 11 a.m. That would be important if the fidelity of the information would be altered, if the client would feel that the individual wasn’t a very good substitute, and so on.

So using this information from O*NET, I find that the occupations that have the largest gender gaps are those that have the least predictability and the greatest time demands. And the occupations that have the smallest gender gaps are on the other side. It’s not necessarily causal, but it’s pretty good evidence that there is something going on.

And then I drill down deeper into particular occupations, such as the work that I have done on MBAs in the corporate and finance sector, and the longitudinal information that exists on lawyers. And finally, there’s a very interesting occupation that went through tremendous change during the 20th century and into the 21st century, and that’s pharmacy.

Pharmacists used to own their own businesses by and large, and they hired other pharmacists to work with them, often part-time. Many of these part-time workers were women, but there were few women who were owners. Well, ownership involves lots of responsibility, and as the owner, you are the residual claimant [the person with the last claim to the firm’s assets]. So in 1970 or so, women got about 66 cents on the male dollar in terms of pharmacy. Today, women working full-time full-year get 92 cents on the male dollar, uncorrected for any other differences and a lot more adding other relevant factors.

There are three things going on here. One is that there is no longer a lot of self-employment. Pharmacists by and large are not working for independent pharmacies anymore. They are working for big chains, national chains, regional chains, world chains. So the residual claimant now is the owner of the stock. There is professional management, and then there are just people who work there who are pharmacists.

The second thing is that there is very good use of IT. Every pharmacist now knows all the prescriptions that you have under your health plan, not just the ones that were filled in that pharmacy. And the third thing is that the drugs themselves are highly standardized by and large, so it isn’t that you are very attached to a particular pharmacist because they fill your prescriptions better or because they know you better. Pharmacists are highly paid professionals, but they are very good substitutes for each other.

Boushey: I’m glad you brought that study up, because I was going to ask you about it. My great uncle was a pharmacist, so I also just find it personally a fascinating example.

If you look at O*NET and the kinds of things that you are measuring, it seems like there are some cases where it seems very logical—especially in the case of pharmacists—that the substitutability is related to the profitability of the firm. It seems like a real strong business case.

Have you found in your research examples where perhaps not the substitutability but the job requirements around predictability or schedules may be more about keeping some workers out than they are about what’s good for the firm?

Goldin: Well, I’m all ears. (Laughter.)

Boushey: Yeah, I don’t know that I have answers there. I just think it begs the question. And I don’t know if you have thought about how to discern that difference in terms of —

Goldin: It’s that firms are leaving very large amounts of money on the ground. And so, if they are able to do that, they are able to pay for their taste for discrimination, then they can [discriminate]. And so that’s what one would look for, whether there are invaders standing at the gates. And if there aren’t, then they can do that and get away with it.

But the question is, where are the invaders that should be standing at the gates?

Boushey: And if part of what you have found is that a lot of this happens right after a child, that’s an invader of a different kind, perhaps.

Goldin: What’s interesting in the case of the MBAs is that it’s not right after the kid. It’s like two years later.

Babies are easier to take care of than 2-year-olds, and so it’s not that the firm then says, “Aha, we have one of those that has kids. We’ll just make certain that she doesn’t get the clients.” And one hears a lot of those stories, and those are the ones that the HR people are always talking about and making certain that people in their firm don’t do that—don’t have sexist paternalism, as it’s called.

But that doesn’t seem to be what is going on. I’m not doubting that there isn’t some of that, but what seems to be going on is that the individual tries and tries—in our data at least, in the Chicago Booth [School of Business] data—and eventually it’s just too much. There are too many demands, so they decide to scale back somewhat.

Boushey: Then I guess there are two questions. It sounds like it is that scaling back that causes the gender pay gap, right?. And what can we do about it?

Goldin: If a firm somehow believes, or it’s the case that right now, its production function is such that working 80 hours a week is worth a lot more than having two workers work 40 hours a week, then that produces non-linearities in pay and it leads to exactly what we are seeing. End of story.

Boushey: And on the policy side, it sounds like there isn’t a lot of incentive from the firm’s side to fix that

Goldin: No, there’s a lot of incentive on the firm’s side. If I’m paying someone more than twice as much to work 80 hours a week than I’m paying two people to work 80 hours a week, then I should think about ways of reducing my costs.

And if I am working people 80 hours a week and that leads people with skills, very expensive skills, to leave, then I should want to do something to keep them there and to figure out how to make certain that they aren’t working 80 hours a week.

I often hear how the CEO of a company has said, “We really want to keep our talent—women as well as men who don’t want to work 80 hours a week, who don’t want the pressure of being called up when they are at a soccer game with their kids, on a Sunday or a Saturday or an evening, or whatever.” The CEO will set down a policy to ensure that doesn’t happen, but then there are a lot of managers who don’t hear that or who claim they don’t hear that. So lots of firms hire HR people to go around and make certain that this is policed.

And these issues are present even in the military. Some time ago at a conference on workplace flexibility, Adm. Mike Mullen, former Chairman of the Joint Chiefs of Staff, essentially said “I’m having trouble doing it, and I’m the head of the entire military.”

So there are principal-agent problems that firms would like to rein in. So they are losing money.

Boushey: Yeah. Well, the federal government implemented a “right to request” policy in one of the agencies—I believe it was OPM, the Office of Personnel Management. I talked to them when they were starting to implement that and the folks we were talking to were super excited, and then they told me, “Oh, yeah, we had some problems with middle management actually implementing it.” And then they stopped the experimenting and I never heard about it again.

Goldin: Yeah.

Boushey: And I think it’s a real challenge how firms are making that connection between that profit motive that the big guys are thinking about and what’s actually happening.

Goldin: Right. But there are lots of firms that have what they call work-life balance, or work-family balance; where, if you work at 11 at night versus 11 in the morning, that’s perfectly fine with them.

I was talking with a very senior partner at a well-known consulting firm once and I asked, “Well, what do you do when clients [call people up at 11 p.m.]?” And she said, “I call up the clients and I say, I have staff and they are not your slaves.” Well. (Laughter.)

Boushey: Good for her.

Goldin: Good for her, and right. But let’s just say that there are cases in which we don’t want someone to have a perfect substitute. I do not want my president, for example, to turn around and say, “oh, by the way, I really don’t like this unpredictability business. You know? That little red button on the phone—every now and again, I say, you know, I’m really not here right now.” (Laughter.)

Because there are cases in which that person better be on 24/7 and that’s it. And we know that in the world of work, those people get higher pay—or, in the case of our president, just get better ratings.

So there are going to be cases in which individuals who are willing to work long hours, work unpredictable hours, be on call, whatever we want to call it, are going to get more. And they are not going to be substitutable. And information is not going to flow perfectly, with total high fidelity.

The question is, what fraction of the occupations in the economy are like that? And I think you and I would agree that the fraction is probably a lot lower than appears to be the case right now.

Boushey: So what should folks who are thinking about policy do about this? Is there a role for us, or is this just a business case? Do they all have to learn this lesson on their own, or is there something policymakers can do?

Goldin: Yeah, we have a policy. It’s called public schools. We’ve had it for a very, very long time. We have public schools that get out nationwide at about 2:30 or 3:00, that end sometime in June, that begin school at 5 years old or 6 years old. None of that was ever discussed as being the optimal way to run schools.

It is suboptimal with respect to individuals who have kids, because kids are not one- or two-year capital goods. Family leave policy is not the only thing that’s going to help families with kids, because the kids live, I hope, for many, many years after they are 2 years old. That’s the policy.

Boushey: I love it. That’s a fantastic way to end this interview, and something I will take with me in my travels here in Washington. Thank you so much, Claudia.

Goldin: Thank you.

This interview has been edited for length and clarity.

Comments on proposed U.S. overtime regulation

Photo of clock by A. Strakey, flickr, cc

In the Notice of Proposed Rulemaking (NPRM) RIN 1235-A111, DOL proposes to increase and automatically update the salary threshold for exemptions from overtime protections under the The Fair Labor Standards Act (FLSA). I observe in the comments below that DOL understates the economic benefits of the proposed threshold and that the proposed level is consistent with the historical growth in prices and economic output.

In its analysis of the effect of the proposed rule on hours worked, DOL understates the benefits to the workforce by failing to account for employers’ tendency to hire additional workers and to schedule non-overtime work in response to the rule change. Footnote 120 of the NPRM acknowledges that the substitution of overtime hours to non-overtime hours is a possibility, and that DOL understandably “did not have credible evidence to support an estimation of the number of hours transferred to other workers.” Yet it should be noted that this possibility is actually an implication of the fixed-wage model that partially underlies DOL’s analysis.

Ignoring this consequence of the economic model underlying DOL’s analysis causes the NPRM to overestimate the total reduction in economy-wide hours due to the proposed rule, at least in the short run. In particular, when the overtime premia threshold is raised, employers will substitute away from overtime hours and either hire additional workers or schedule additional hours for workers below the 40-hour threshold. Indeed, the fact that there is a spike of 40 hours in the distribution of weekly hours is consistent with the idea that firms substitute away from overtime hours. Moreover, private-sector analyses such as those by the National Retail Federation (2015) and Goldman Sachs (2015) predict increases in employment as employers hire additional workers to work non-overtime hours. This substitution toward non-overtime hours is necessarily implied by the fixed-wage model when output is constant, say in the very short run or in an economy with a large degree of excess capacity. Any offsetting increase in non-overtime hours will be smaller over the medium- to long-term, when both output and capital adjust more easily.

The possibility that some individuals will see increased employment through the extensive or intensive margins has important welfare considerations ignored by the NPRM. Based on empirical evidence describing the extent of overwork in the United States, the NPRM correctly concludes that the proposed rule may improve welfare because it “may result in increased time off for a group of workers who may prefer such an outcome.” At the same time, although many workers in the United States are overworked, a sizable portion of the labor force does not work as many hours as desired (Golden and Gebreselassie 2007; Jacobs and Gerson 2005). Footnote 135 of the NPRM states that the lack of existing scholarly studies precludes quantifying any increase in employment or hours due to the rule, but DOL should make clear that under certain conditions the fixed-wage model underlying their analysis implies that some workers will see an increase in hours. If these workers are under-employed, the shift in the composition of those hours from over-worked to under-worked employees will be a welfare-improving consequence of the proposed rule.

In its calculation of the monetary benefits of reducing hours, the NPRM fails to account for significant externalities associated with high levels of hours worked. The NPRM approximates the benefit an affected worker receives for an hour of additional leisure by the average hourly wage, but this approximation understates the social benefits when the social and private costs of work differ. Some empirical work calculates that longer work hours entail greater energy consumption and consequentially more environmental damage (Rosnick and Weisbrot 2006). And economic theory suggests that long work hours may be detrimental both within and outside of the household (Gersbach and Haller 2005; Folbre, Gornick, Connolly, and Muzni 2013). In a separate section on health benefits of the proposed rule, the NPRM also effectively acknowledges the existence of these externalities cited above, stating that the rule will not only benefit the worker’s welfare through its positive health effects but also “their family’s welfare, and society since fewer resources would need to be spent on health.” Although the NPRM states that its wage-based approximation may overestimate the social benefits of fewer hours worked because not all workers will prefer to reduce their hours, the exclusion of important externalities causes the NPRM to underestimate some benefits of reducing hours.

The NPRM also understates benefits by excluding the possibility that an updated salary threshold will improve pay for hourly workers who are not paid overtime, even when they should be. Rohwedder and Wenger (2015) find that 19 percent of hourly workers are not paid a premium for working overtime hours. While it is unclear if all of these workers are legally required to receive overtime payments (due to occupational exemptions), many of them are not receiving pay promised under the FLSA. The proposed, transparent update to the salary threshold will provide employers an opportunity to revisit whether their employees are paid according to the law.

Finally, the proposed threshold for the overtime weekly salary exemption appears to be consistent with a range of economically appropriate levels. The NPRM proposes raising this threshold to approximately $921, or the 40th percentile of the weekly earnings distribution of salaried employees working full-time. This level is appropriate because it is similar to the exemption threshold that already applied in 1975, after adjusting for inflation ($250 in 1975 dollars, or approximately $1,000 per week in 2014 dollars.). Yet if the labor market’s capacity to bear this regulation is determined by productivity, then this threshold is almost certainly too low. Since 1975, real productivity has grown by more than 72 percent, suggesting an overtime weekly salary threshold of at least $1,720, well exceeding the proposed rule.


Ben Zipperer

Research Economist

Washington Center for Equitable Growth

1333 H St., NW

Washington, DC  20005


References

Folbre, Nancy, Janet Gornick, Helen Connolly, and Teresa Munzi. 2013. “Women’s Employment, Unpaid Work, and Economic Inequality,” in Janet Gornick and Markus Janti, editors, Income Inequality: Economic Disparities and the Middle Class in Affluent Countries, Redwood City CA: Stanford University Press.

Golden, Lonnie and Tesfayi Gebreselassie. 2007. “Overemployment mismatches: the preference for fewer work hours.” Monthly Labor Review. April.

Gersbach, Hans and Hans Haller. 2005. “Beware of Workaholics: Household Preferences and Individual Equilibrium Utility.” IZA Discussion Paper. February. http://ftp.iza.org/dp1502.pdf

Goldman Sachs Global Macro Research. 2015. “The New Federal Overtime Rules: A Greater Effect on Payrolls than Pay.” July 7.

Jacobs, Jerry, and Kathleen Gerson. 2005. The Time Divide: Work, Family, and Gender Inequality. Cambridge MA: Harvard University Press.

National Retail Federation. 2015. “Rethinking Overtime.” https://nrf.com/sites/default/files/Documents/Rethinking_Overtime.pdf

Rohwedder, Susann and Jeffrey B. Wenger. 2015. “The Fair Labor Standards Act: Worker Misclassification and the Hours and Earnings Effects of Expanded Coverage.” http://www.rand.org/content/dam/rand/pubs/working_papers/WR1100/WR1114/RAND_WR1114.pdf

Rosnick, David and Mark Weisbrot. 2006. “Are Shorter Hours Good for the Environment? A Comparison of U.S. & European Energy Consumption.” Center for Economic and Policy Research. December. http://www.cepr.net/documents/publications/energy_2006_12.pdf

The intellectual history of the minimum wage and overtime

The rapid growth of the “Fight for $15” minimum wage movement and President Barack Obama’s changes to overtime regulations have sparked new rounds of debate over the economic consequences of an increased overtime pay threshold and a higher minimum wage. Advocates of overtime and wage hikes argue these policies protect workers from exploitation and improve job quality. Opponents insist these regulations will hurt workers in the long run, as they will inflict a burden on companies that will be forced to cut jobs. These concerns are nothing new—this debate dates back to the early 20th century, before the minimum wage even existed in the United States and when overtime pay was unheard of.

At the end of the 19th century, economists such as John Bates Clark preached that markets, if left to their own devices, would function at equilibrium levels with the best possible distribution of resources. Rapid industrialization created the Gilded Age of American wealth, and people credited the free market with their increased prosperity. But along with increasing growth, industrialization also sharpened economic inequalities and made certain groups particularly vulnerable to exploitation. Debates over hour and wage limits focused on which groups required labor protections and the best mechanisms for protecting these groups.

Download File
History of the Minimum Wage

Read the full PDF in your browser

Labor regulations began in the 1890s as state-level maximum hour and minimum wage protections, which the U.S. Supreme Court repeatedly struck down. Federal standards were not created until four decades later, when president Franklin Delano Roosevelt and his Secretary of Labor, Frances Perkins, guided the Federal Labor Standards Act into law. (See Figure 1). This issue brief details the arguments that shaped hour and wage limits in the early 20th century.

Figure 1

Women’s maximum hours

U.S. legal historians usually describe the beginning of the 20th century as the “Lochner Era,” a 32-year period characterized by the Supreme Court’s attempt to protect the free market through its constant repeal of labor laws. The Supreme Court actually was discriminatory in its protection of the free market—although it consistently blocked labor laws that applied to men, the high court allowed restrictions on women’s employment. The Supreme Court passed distinct rulings for men and women by emphasizing different doctrines for the two sexes. For men, the court consistently upheld freedom of contract; for women, the court privileged police powers.

The Supreme Court’s gender discrimination began with cases concerning maximum hour limits. In Lochner v New York (1905), the namesake of the Lochner Era, the court justified its decision to strike down the 1895 Bakeshop Act—which placed hour limits on New York bakers—with the freedom of contract doctrine. Freedom of contract comes from the due process clause of the Constitution, which says that no person shall be “deprived of life, liberty, or property without due process of law.” At the time, justices interpreted due process to mean that individuals should be free from restraint except to guarantee the same freedoms to others, and that government could not restrict people’s ability to acquire future property. Limiting the hours that New York bakers worked, proponents argued, took away their liberty to choose the terms of their employment and limited the money they could earn, so maximum hour laws violated freedom of contract.

Just three years later, the Supreme Court set a different standard for women. In Muller v Oregon (1908), it upheld a 1903 Oregon law that prohibited women from working more than 10 hours a day. The court argued that women’s freedom to contract was superseded by the police powers doctrine, which allows government regulation for the purpose of promoting health, safety, morality, and the general welfare of the public. The court found that “as healthy mothers are essential to vigorous offspring, the physical wellbeing of woman is an object of public interest.” In other words, protecting women’s reproductive health was more important than respecting their freedom to contract. Women were also seen as fragile, vulnerable, and lacking the skills necessary to effectively bargain for wages and working conditions, and therefore unable to exercise their freedom of contract. These sex-specific discussions about government-imposed hour limits set the stage for a new conversation: the passage of state minimum wages.

Women’s minimum wages

In 1912, Massachusetts became the first state to pass a minimum wage law that applied only to women and children. Thirteen more states (along with DC and Puerto Rico) followed in the next 11 years. These legislatures passed a patchwork of legislation with a range of wage limits and enforcement mechanisms. States such as Massachusetts created wage commissions to determine industry-specific minimum wages and enforced standards through public shaming, publishing the names of companies that did not comply with the regulations. In contrast, states such as Arkansas set two cross-industry minimum wages for women: experienced women were paid $1.25 a day while inexperienced women only got $1.

The police powers doctrine justified minimum wages for women, but said nothing about how they affected industries. To justify minimum wages on the industry side, academics used the parasitic industries argument. Originally developed by the British economists Beatrice and Sidney Webbs in the late 19th and early 20th centuries, the parasitic industries argument says that businesses who focused on short-term profit maximization instead of long-term efficiency tend to pay workers unlivable wages. Workers receiving these sweatshop wages become a burden to society, since they have to rely on charity or other family members for subsistence. To fix the problem, companies have to either amend their practices to consider the long-term welfare of the company and the workers, or exit the market.

Women’s minimum wage laws grew out of gender norms supporting women’s protection, but at the same time, racial biases led to laws that neglected women of color. Because minimum wage legislation was usually industry-specific, industries such as domestic work, agriculture, retail, and laundry—all dominated by African American workers—were often excluded from regulation. One case in point: The Wage Board in the District of Columbia set a weekly rate for laundry workers that was $1 lower than the across-the-board minimum adequate weekly wage of $16 it has previously chosen. The board explained that since 90 percent of laundry workers were African American, “the lower rate was due to a crystallization by the conference of the popular belief that it cost colored people less to live than white.” By not extending equal minimum wage protections to African American women, minimum wage laws reinforced their lower economic status.

In the next decade, legal changes in women’s status, paired with the economic optimism of the Roaring Twenties, brought a big shift in minimum wage legislation. Ratified in 1920, the 19th Amendment granted Women’s Suffrage. Shortly after, in a victory for more equal gender standards but a loss for labor protections, the Supreme Court issued a ruling that struck down women’s minimum wage laws across the country. In Adkins v Children’s Hospital (1923), the court overturned the 1918 law that created D.C.’s Wage Board, which had set minimum wages for women employed in laundries and food-serving establishments. Reasoning that women were now politically empowered to advocate for themselves in the free market, the Court privileged freedom of contract over police powers and nullified minimum wage laws in the United States.

This optimism about the competitiveness of the free market did not last long. Once the Great Depression hit, people lost faith in the fairness of the U.S. economy. The failure of the banks cultivated distrust of large corporations. People were afraid that business concentration hurt competition and created unfair trusts. The new popular economic narrative of economists such as Joan Robinson and Edward Chamberlain said that imperfect and monopolistic competition dominated the market. This unfair competition gave businesses a huge advantage, which they used to exploit labor. Public opinion shifted toward seeing government intervention not as redistribution but rather as reestablishing a competitive market.

The Fair Labor Standards Act

In this rapidly shifting political and economic climate Franklin D. Roosevelt won the 1932 elections and appointed Frances Perkins as his Secretary of Labor. With decades of experience advocating for labor rights as a social worker and later as Roosevelt’s Secretary of Labor when the future president was governor of New York, Perkins accepted the federal cabinet office on the condition that Roosevelt would commit to supporting her reform platform, which included hour limits and minimum wages for both women and men. Perkins’ platform originally appeared in the National Industrial Recovery Act, which tried to improve working conditions through voluntary industrial participation. Under the proposed law, industries would be able to form alliances, which previously violated anti-trust laws, if they complied with maximum hour and minimum wage standards. In return, participating companies could display a Blue Eagle emblem in their stores, brandishing their patriotism and commitment to post-Great Depression recovery. In Schechter Poultry Corp. v United States (1935), however, the Supreme Court struck down the law, drawing the ire of Roosevelt and forcing Perkins to find a new way to pass labor reform.

Out of growing frustration with the Supreme Court’s challenges to his policies, Roosevelt came up with a plan to pack the court. He set off a campaign to reform the Supreme Court so he could appoint additional members to the court who would vote in line with his New Deal reforms. Faced with this existential threat and greater public support for labor laws, in 1937 the Supreme Court ruled in favor of Washington state’s minimum wage law for women in West Coast Hotel Co. v Parrish. The court’s ruling de-emphasized the freedom of contract, reversing its 1923 decision and opening the door for future minimum wage legislation.

Following the Supreme Court decision, Perkins and Roosevelt sent a maximum hour and minimum wage bill to Congress. The original draft of the bill had called for industry-specific, regionally variant minimum wages to account for regional differences in prices and cost of living. As the bill made its way through Congress, two more opposition groups emerged: unions and northern industries. Unions feared that government-imposed wage and hour restrictions would undermine their influence in collective bargaining. Northern industries opposed regionally specific wages for fear that industries would follow the cheap labor south. To appease these two groups, Roosevelt and his Democratic allies in Congress tweaked the bill to make it more popular. Roosevelt appeased the unionists’ fears in his State of the Union address by emphasizing that more desirable wages should continue to be the responsibility of collective bargaining. Lawmakers suggested a national minimum wage to satisfy northerners, but set the wage low enough to appease southerners.

In its final form, the Fair Labor Standards Act of 1938 mandated a 44-hour workweek, scheduled to decrease to 40 hours in three years, with time-and-a-half overtime wages. The new law also created a minimum wage of 25 cents an hour, set to increase by 5 cents a year to reach 40 cents an hour by 1945. The original law was not universal. It included exemptions for agricultural, domestic, and some union-covered industries—once again, mostly industries dominated by African Americans. Since the law lacked a mechanism for automatically increasing wages beyond 1945, it has been updated over the decades to increase wages and broaden industry (and racial) coverage. In the most recent revision to the Fair Labor Standards Act in 2009, the federal minimum wage was increased to $7.25 an hour.

Conclusion

The intellectual history of maximum hours and minimum wages is a story of debates over which groups should be protected from exploitation and what form this protection should take. Concerns over women’s health, ambivalence toward African American rights, and advocating for unorganized workers dominated the debate at different points. As social views changed, so did economic policies. Today, women account for two-thirds of minimum wage earners and people of color account for two-fifths. Studying the history of the minimum wage should compel policymakers to question how social priorities influence different groups, who is considered worthy of protection, and to what extent their welfare is considered. By implementing effective maximum hour and minimum wage regulations, policymakers can protect vulnerable workers’ standard of living to encourage productivity, push companies to increase their efficiency, and consequently cultivate long-term equitable growth.

-Oya Aktas is a Summer 2015 intern for the Washington Center for Equitable Growth 


The cruel game of musical chairs in the U.S. labor market

Musical chairs by Paolo, flickr, cc

Last year, our colleague Elisabeth Jacobs referred to the fate of young people in today’s slack labor market as “a cruel game of musical chairs” because there aren’t enough jobs to employ everyone at their full earning potential. Workers with college degrees tend to win out in the competition for the few jobs that are available, but many must settle for lower-paying jobs than similarly credentialed workers entering the workforce in previous decades. Those without college degrees, in turn, are driven into even lower paying work or pushed out of the labor market entirely. Economists refer to this phenomenon as “filtering-down,” with the best-educated workers increasingly filling jobs lower and lower on the job ladder.

The dire experience of these workers with college degrees displacing workers with less formal education stands in strong contrast to the widelyheld view in economic and policymaking circles that the main problem facing the U.S. economy is a shortage of highly-educated workers. If college-educated workers were in short supply, then we would expect their wages to rise as employers attempted to lure them away from their competitors. Yet the inflation-adjusted value of the wages of college-educated workers has barely increased in the 21st century.

What’s more, between 2000 and 2014 (the last year for which complete data are available), the employment of college-educated workers has increased much more rapidly in low-earning industries than in high-earnings ones. If there weren’t enough college graduates to go around, then the opposite should be happening because high-earnings industries would presumably be outcompeting low-earnings industries to hire college-educated workers. Our new analysis of the data from the U.S. Census Bureau’s Quarterly Workforce Indicators strongly suggests that college-educated workers are more likely to “filter down” the job ladder than to climb it.

The QWI dataset is a comprehensive administrative source for information on flows in and out of employment, collecting information on total employment, hires, “separations” (workers either quitting their jobs, getting laid off, or fired for cause), and earnings. The data are disaggregated along many dimensions, including workers’ education level and the industries where they work. We can, for example, look at the share of employees in restaurants and bars that have a Bachelor’s degree or more, or the share of workers on Wall Street who have less than a high school degree.

Our analysis examines the average earnings of workers in the 91 industry groups—identified by their 3-digit coding in the North American Industrial Classification System–which together account for nearly all employment in the United States, alongside the share of workers in each industry with a college degree or more. While not definitive, the most striking finding is that the industries with the lowest earnings for all employees are experiencing the largest increases in the share of workers with a college education or higher. Our analysis, for example, finds that 16.3 percent of all workers who work in restaurants and bars in the United States have attained a Bachelor’s degree or more, compared to 14.2 percent in 2000. In contrast, high-paying industries such as the financial sector saw their share of college-educated workers decrease, from 65.2 percent in 2000 to 56.1 percent in 2014 (See Figure 1).

Figure 1

08XX15-filtering-down-01-3

This “filtering down” trend in the employment of college-educated workers is even more acute when we look at recent hires rather than overall employment. The trend line over 2000-2014 is even more steeply downward sloping for hires than for all employees, highlighting the cruel game of musical chairs. In short, a college degree is becoming increasingly less predictive of employment in a high-earnings industry. (See Figure 2.)

Figure 2

If instead of plotting the change in employment of college-educated workers or the change in recent hires of college-educated workers on the vertical axis—as we have done in Figures 1 and 2—we had alternatively plotted the share of college-educated workers in total employment, or the share of college-educated workers in recent hires, then we would see that industries with higher average earnings tend to employ more credentialed workers. In other words, the trend line we would see in the alternative charts would slope up, not down. Findings of that kind, which depict the higher average earnings of college-educated workers, are typically trumpeted as evidence that the only thing preventing young, under-employed workers from finding a good job is their lack of a Bachelor’s degree. But what our analysis demonstrates is that this relationship has gotten less positive since 2000. (See the data appendix below for a complete description of the data and our methodology.)

This means that the changing share of workers with a college degree or more across industries is unlikely to be due to “skill-biased technical change” in low-earnings industries, since by and large workers in those industries are less prone to technological substitution. Think bartenders and busboys. Those workers perform what economists call “non-routine, manual” tasks that can’t easily be performed by pre-programmable machines. Nor does the rise in the share of college-educated workers in lower-paying industries merely reflect that there were fewer such workers in these industries prior to 2000, because the same trend is true among recent hires as among employees overall.

Finally, the increased hiring of workers with college degrees has not boosted the relative pay in those low-paying industries. The patterns are quite similar whether we calculate industry average earnings in 2000 or in 2014 because average earnings across industries haven’t changed very much. What’s changed is the education mix of workers.

The implication of all of these findings is that the U.S. labor market doesn’t lack for college-educated workers. Workers who have degrees are already taking jobs further and further down the job ladder. Encouraging or subsidizing higher education attainment will not solve the fundamental problem facing workers in the current job market: There are not enough jobs.

Data appendix

The U.S. Census Bureau’s Quarterly Workforce Indicators is a comprehensive administrative dataset of employment “matches,” meaning labor market relationships between employers and employees. The existence of a match (employment), the beginning of a match (hires), and the end of a match (separations) are observed in a given quarter, along with average earnings of workers in each group of hired workers, employed workers, and separated workers. The QWI is disaggregated by geography, industry, and many demographic characteristics, including, for our purposes, education attainment (discussed more completely below).

There are two predominant underlying sources of the QWI data: U.S. Census data and state unemployment insurance filings by businesses. QWI is the publically available version of a dataset called Longitudinal Employer-Household Dynamics, or LEHD, which follows individual workers from job to job over the course of their careers. QWI, however, does not track individual workers over time. Instead, quarter-by-quarter, it counts up all the flows described in the previous paragraph, for each detailed sub-population and employer category.

Because state-provided data from the unemployment-insurance system are critical to constructing LEHD and hence the QWI, and because states only began to participate in the LEHD at different points in time, the data are available as an unbalanced geographic panel. Every state except Massachusetts is currently providing data to the program, but the start dates vary by state. Enough states have joined by about 2000 that the literature has labeled QWI nationally representative from that point forward, which covers all the data reported in this exercise. We aggregate the data across states to create our industry-education disaggregation.

LEHD does not actually observe the education levels of most workers. For those it does not observe, education is imputed from other worker characteristics using Census Bureau microdata (mostly from the 2000 Decennial Census). That is the most likely reason why the QWI-reported share of college-educated workers has decreased by slightly more than one percentage point overall, and by substantially more in some industries. The imputation procedure works best around the date when its source data was collected (2000), and increasingly less well as we get further away from that date. The Current Population Survey, a representative sample of the population collected continuously, reports that the overall share of college-educated workers in the economy increased by approximately five percentage points between 2003 and 2012, and has only declined by a small amount in a very few industries.

The education imputation in QWI complicates the inference from exercises such as the one we present here, because the whole point of our interpretation is that educational attainment has become less predictive of workers’ experience in the labor market, and in particular, of their earnings, as better-educated workers are forced to take worse jobs. The effect of the data imputation, however, is most likely to mute the phenomena we highlight: if credentialed workers are taking jobs further down the labor market hierarchy, then workers who take jobs further down the hierarchy than they did in the past would be more likely to be misidentified as lacking educational qualifications. For that reason, we believe the imputation of education data means that our results understate the effect of filtering-down.

Tentative confirmation for this can be found in a regression of the change in the share of young workers on industry average earnings, which yields an even-more-sharply negative slope than Figures 1 and 2. In other words, young workers are filtering down the labor market even more starkly than BA-educated ones, according to QWI. Since young workers are more likely to have college degrees than retirees, the education-based regressions we present here probably understate the cruelty of the cruel game of musical chairs.

In order to construct Figures 1 and 2, we use a NAICS 3-digit Industrial Sector disaggregation of the QWI’s 2015Q3 Sex by Education files with all firm size and age categories for all available states and the District of Columbia. The data are smoothed using a four-quarter moving average, and nominal earnings are adjusted for inflation (to 2014 dollars) using the Consumer Price Index for all Urban Consumers, or CPI-U. We use the “stable jobs” concept, meaning only “full-quarter employment” is counted. A worker is “full-quarter employed” at a given match if and only if that worker has positive earnings from that match in the quarter itself and (at least) the ones preceding and subsequent. (Similarly, a “full-quarter hire” is one in which positive earnings are observed in the preceding, current, and subsequent quarters but not two-quarters-ago.)

The dependent variables in the regression are calculated from either EmpS or HiraS (for employment and hires respectively), and the dependent variables are correspondingly EarnS or EarnHiraS. We use the education category corresponding to a “BA or more” to calculate college-educated shares of employment and hires, and we exclude workers aged 24 or under since QWI does not report education attainment for that age group. (See Figure 3.)

Figure 3

The raw data and the Python script we used to clean and reshape the raw data are available at Equitable Growth’s GitHub.

Puerto Rico’s predicaments: Is its minimum wage the culprit?

Puerto Rico today faces a serious debt crisis, recently defaulting on a bond payment. The proximate cause is a slowdown in economic growth since the mid-2000s, which has reduced tax revenues, and a declining labor market, where employment growth has been mostly in the red since 2007.

Figure 1

puerto-rico-fig-01

There are many explanations for the economic downturn and the resulting fiscal crisis, but some commentators have incorrectly blamed the island’s high minimum wage. To be sure, the federal minimum wage—which has applied to Puerto Rico since 1983—is much more binding there than it is on the mainland. Because hourly wages are substantially lower in Puerto Rico compared to the U.S. mainland, the federal minimum wage policy affects more of the workforce there. In 2014, for example, the federal minimum wage stood at 77 percent of the median hourly wage in Puerto Rico, compared to 42 percent in the United States. For comparability with existing estimates, if we consider wages of full time workers only, these figures are approximately 70 percent in Puerto Rico and 38 percent in the United States, respectively. Finally, the minimum wage stands at 56 percent of the wage earned by production workers in manufacturing, compared to 38 percent in the United States. Clearly, the Puerto Rico’s minimum wage exceeds the cautious rule-of-thumb of 50 percent of median wage of full-time workers suggested by one of us in previous work.

But does that make it a probable culprit for the island’s current debt and economic troubles? The short answer is: not very likely. The major problem with a minimum wage-centric explanation is timing. There has been no change in the relative minimum wage between Puerto Rico and the mainland over the past 32 years. And since the federal standard has not kept up with wage growth on the island, the bite of the minimum wage in Puerto Rico has eroded over this period.

First, the current inflation-adjusted value of the federal minimum wage is not higher than it was when Puerto Rico first adopted it. Puerto Rico’s minimum wage is worth slightly less today than in 1983, even though its economy, in terms of GDP per capita, has grown by 72 percent.

Second, real wages in Puerto Rico were lower three decades ago. As a result, if we measure the bite of the minimum wage as the ratio of the minimum wage to the average manufacturing wage, the bite was closer to 70 percent when Puerto Rico first adopted the federal minimum wage, much higher than it is today, at 53 percent. (We use the manufacturing wage for this comparison because the median wage series is not available over as long a historical period, to the best of our knowledge.)

Figure 2

puerto-rico-fig-02

Additional evidence suggests the current minimum wage in Puerto Rico is also less consequential today than it was during the 1980s. In 1983 the share of Puerto Rico’s workers affected by the minimum wage was around 44 percent, but by 2010 this share had fallen to around a third. It is difficult to explain the economic crisis in Puerto Rico starting in the mid-2000s with a minimum wage that is, if anything, on the wane.

Finally, we should note that some recent reports have also incorrectly measured the level of the minimum wage in Puerto Rico, stating that a full-time minimum wage worker in Puerto Rico earns 77 percent of the nation’s per capita income, as opposed to 28 percent in the United States. Data from the World Bank suggests that although the ratio of 28 percent is correct for the mainland, the statistic for Puerto Rico is closer to 53 percent as of 2013, the last year in which complete data are available.

Does this mean the island’s minimum wage has no negative consequences? It’s possible that the minimum wage led to somewhat lower levels of employment than would otherwise occur. After all, the minimum wage is much higher in Puerto Rico than the kind of increases we have studied elsewhere in the United States, where we find employment effects that are small and often indistinguishable from zero.

But clear evidence of job losses due to Puerto Rico’s relatively high minimum wage remains elusive. The two main scholarly papers on the topic reach different conclusions when analyzing the original Puerto Rican introduction of the federal minimum wage in 1983. In their 1992 paper, “When the Minimum Wage Really Bites: The Effect of the U.S. Level Minimum on Puerto Rico,” economists Alida Castillo-Freeman at the National Bureau of Economic Research and Richard Freeman at Harvard University found evidence of moderate-sized job losses by comparing unemployment trends over time, and by comparing wages and employment across industries on the island.

Yet in a careful reanalysis of the same data in 1994, Princeton University economist Alan Krueger found that some of the findings by Castillo-Freeman and Freeman proved fragile. One case in point: the more negative estimates from cross-industry comparisons were in part driven by the over-representation of many narrow manufacturing industries in their sample. And there was some indication of the effects occurring, implausibly, prior to the actual increases in the minimum wage. Finally, while some of the episodes of minimum-wage increases on the island were associated with higher unemployment, the opposite was true during other episodes.

Control groups for the Puerto Rican case are not easy to find, and so it is difficult to decipher what would have happened if the minimum wage in Puerto Rico were much lower. But, while there may be disagreement on whether the Puerto Rico’s minimum wage has caused the unemployment rate to be somewhat higher, both Professors Freeman and Krueger are in complete agreement today that it is unlikely either to be a major factor behind the current economic crisis, or an important part of the solution.

Indeed, the long-run decline in the bite of the minimum wage presents a serious challenge for those arguing otherwise, since the timing of the crisis is inconsistent with minimum wage having played a real role in it. Reasonable people may differ on the costs and benefits of applying the federal minimum wage to Puerto Rico. But it would be misguided to expect minimum wage policy to provide a cure for the island’s ailments.

Arindrajit Dube is an associate professor of economics at the University of Massachuetts-Amherst. Ben Zipperer is an economist at the Washington Center for Equitable Growth.