Testimony by Jonathan Fisher before the House Select Committee on Economic Disparity and Fairness in Growth
Statement for the Roundtable Meeting of the Committee on “Measuring Economic Disparity” House Select Committee on Economic Disparity and Fairness in Growth
November 17, 2021
I am Jonathan Fisher, the research advisor at the Washington Center for Equitable Growth, a nonprofit research and grantmaking organization dedicated to advancing evidence-backed ideas and policies that promote strong, stable, and broad-based economic growth. I have written this statement in partnership with Austin Clemens, Equitable Growth’s director of economic measurement policy.
This Select Committee’s charge is to “develop solutions to the key economic issue of our time: the yawning prosperity gap between wealthy Americans and everyone else.” I am here to discuss today the state of inequality measurement in the United States and steps the committee can support to help better define the problem and better understand the effects of potential policy interventions. What is the current state of inequality? How will you know if the solutions your committee develops and the government implements are successful at reducing disparity and increasing fairness? And how will future Congresses know the state of the U.S. economy in real time to craft well-calibrated policy?
It is important to measure and understand inequality because economic inequality harms the economy. Inequality today is high, close to its peak, using before-tax and before-transfer income, and increasing. When taking into account taxes and transfers, inequality is just below its 2006 peak, and only lower because of the health insurance provided through the Affordable Care Act.1This inequality constricts growth by:
- Obstructing the supply of people and ideas into our economy and limiting opportunity for those not already at the top, which slows productivity growth over time
- Subverting the institutions that manage the market, making our political system ineffective and our labor markets dysfunctional
- Distorting demand through its effects on consumption and investment, which both drags down and destabilizes short- and long-term growth in economic output
Today, I describe four key shortcomings of the federal statistical system, or the federal agencies that provide essential statistical information when it comes to measuring disparities.2
- The products of the Bureau of Economic Analysis, such as Gross Domestic Product, lack a distributional component, leaving policymakers, businesses, the media, and the American people in the dark about to whom economic growth is accruing.
- A significant lag in the creation of distributional measures hinders Congress’ ability to know, in real time, the state of the economy and disparities in growth.
- The system fails to measure multidimensional inequality and poverty, and it lacks a standardized definition of income, consumption, and wealth for the purposes of measuring poverty and inequality.
- Federal statistics conceal substantial variation by race, gender, and ethnicity.
I will then discuss four concrete steps Congress should take to address these shortcomings and help improve measurement within the federal statistical system. It is important that these efforts reside within the federal statistical system. The federal statistical agencies act as the neutral arbiter and can adopt the best practices developed across researchers and other countries’ statistical agencies.
Critiques of the federal statistical system for inequality measurement
The federal statistical system today is insufficient for Congress, the business community, and for the American people. The economic stress during the coronavirus recession and amid the continuing pandemic makes clear the need for more consistent and more timely estimates regarding the health of the economy and growing inequalities.
Gross Domestic Product lacks a distributional component
One of the most-commonly referenced statistics from the federal statistical system is Gross Domestic Product, or GDP, and Personal Income. GDP measures the total final goods and services produced in the United States. Personal Income measures the income that people receive from wages and salaries, government benefits, dividends and interest, business ownership, and other sources. These measures are published quarterly.
This committee’s name references fairness in growth, but the federal statistical system generally only reports growth statistics in the aggregate. GDP growth was once a reasonable proxy for the economic fortunes of families because growth in the U.S. economy was broad-based. But growth over the past four decades has increasingly accrued to the top of the income distribution, creating a disconnect between headline GDP growth and the fortunes of families in the United States. (See Figure 1.)
Figure 1
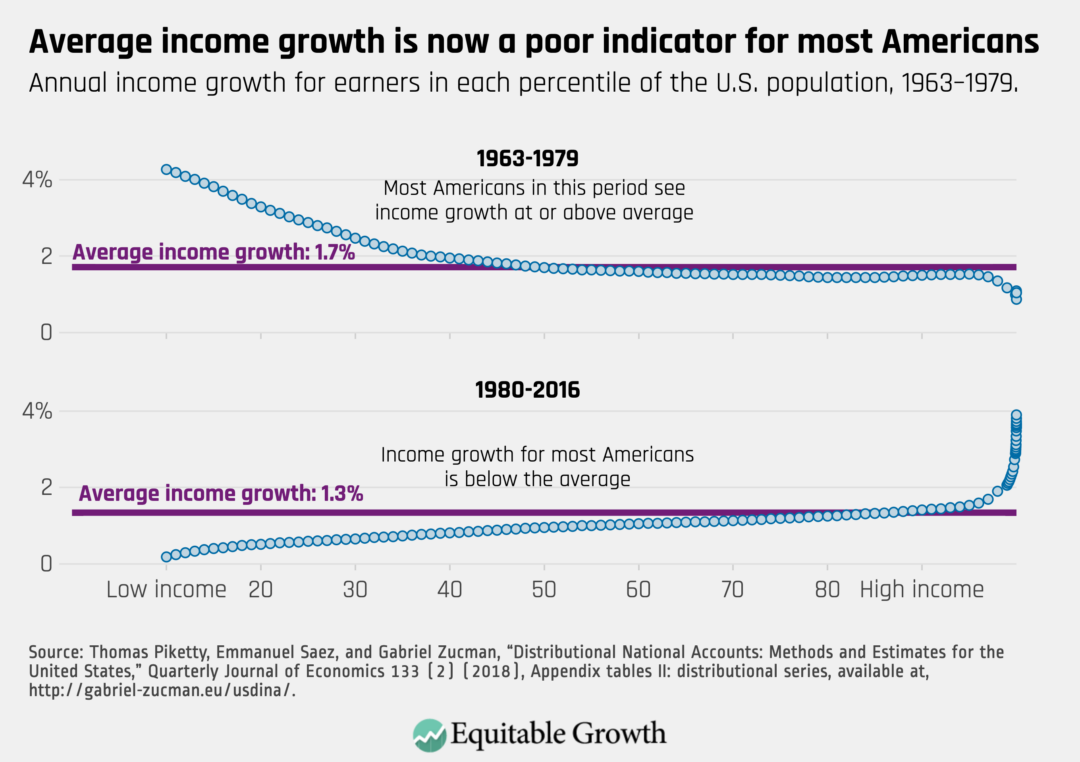
It is helpful to understand first why current measures of economic growth can be so misleading. Let’s say 20 people live in a country, and everyone has $50,000 in income. National income is $1 million. Now, let’s say one person inherits $1 million from a relative living in a different country. National income is now $2 million. The Bureau of Economic Analysis would report that national income doubled. But only one person in the entire economy benefited. The headline growth number promises a massive increase in economic well-being that is illusory for 95 percent of the country.
Political scientists have found this effect can be significant. The tone of news coverage of the U.S. economy is closely correlated to GDP growth. Newspapers tend to see GDP growth as especially newsworthy, and this is reflected in reporting where GDP growth is often used as a proxy for the health of the entire economy. This has ill effects. Because GDP growth is no longer closely tied to income growth for most people, the overall tone of economic news is unrelated to income movement for all Americans outside the top 1 percent. Put another way, when GDP is used as a proxy, the economic news of today is largely just news about how the very richest Americans are doing.3 And because the public relies on the news to form their own assessment of the economy, headline GDP distorts economic perceptions across society.
A GDP measure that reflects the entire economy by reporting disaggregated statistics can better inform the media, policymakers, and businesses. Businesses can use disaggregated GDP to understand the income dynamics of the consumers they serve. A business that primarily sells to lower-income households, for example, will want to know the income dynamics of that population, which an improved measure of GDP and Personal Income will allow.
Lack of standardized definitions of income and long lag in measuring poverty
While the current GDP measure does not inform about inequality and poverty, the U.S. Census Bureau publishes poverty and inequality statistics annually in September, reporting these statistics for the previous calendar year. The Census Bureau uses an imperfect definition of family income—what it calls money income—to measure poverty and inequality. Money income includes earnings, unemployment compensation, Social Security, interest income, child support, and other money income sources.
But money income excludes taxes and tax credits, such as the Earned Income Tax Credit and the home mortgage interest deduction, and it misses economic stimulus payments such as the recent Economic Impact Payments. It also excludes noncash transfers, such as the Supplemental Nutrition Assistance Program, or SNAP, and housing assistance. Finally, money income also excludes capital gains. Furthermore, the Current Population Survey, or CPS, which the Census Bureau uses to estimate poverty and inequality, overestimates the extent of poverty through underreporting of income,4 and underestimates the concentration of income at the top of the distribution because of survey nonresponse.5
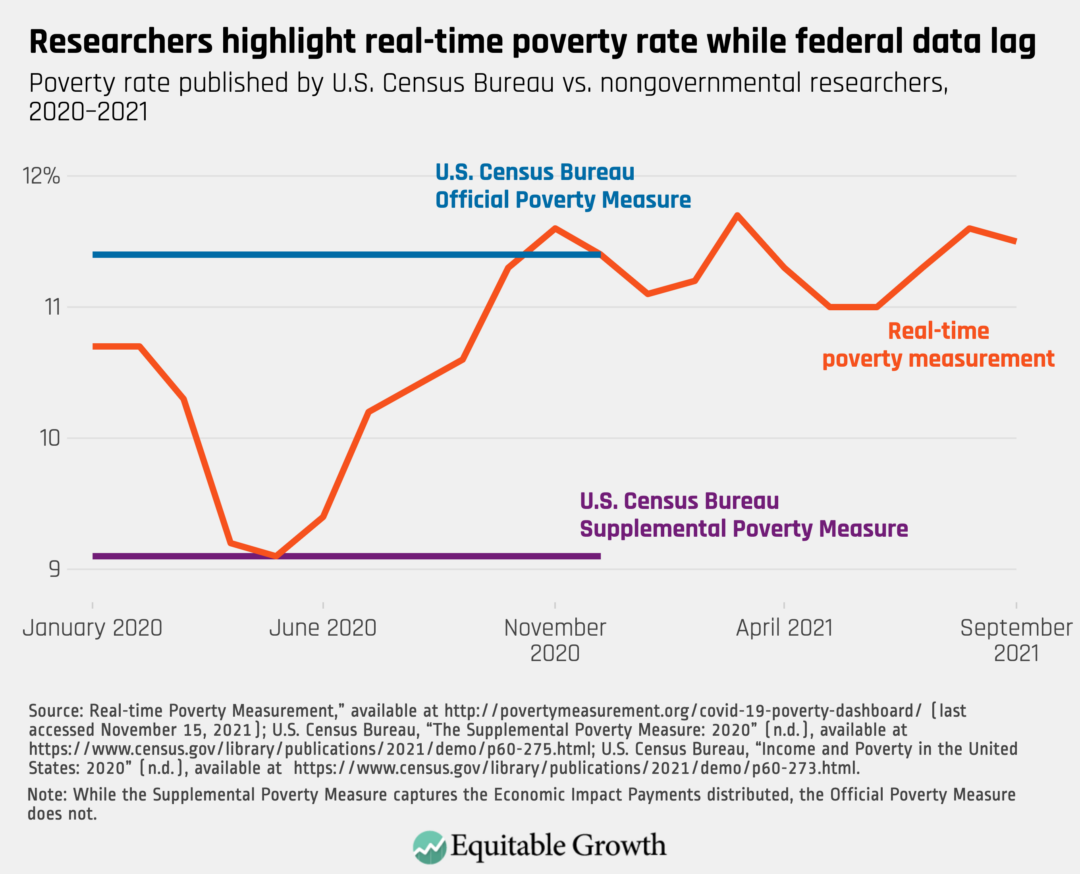
Because of the well-documented weaknesses of the Official Poverty Measure, the Census Bureau publishes a Supplemental Poverty Measure that improves upon the Official Poverty Measure in several ways. First, the Supplemental Poverty Measure includes noncash benefits, taxes, and tax credits. The poverty threshold is based on current spending patterns, while the Official Poverty Measure uses spending patterns from 1963, adjusted for inflation. The Supplemental Poverty Measure also adjusts the poverty threshold geographically, recognizing that the cost of living is different across the country. The Supplemental Poverty Measure can be used to indicate how much certain programs or policies affect poverty. The 2020 Supplemental Poverty Measure, for example, indicates that 11.7 million people were kept out of poverty because of the two Economic Impact Payments made in 2020.6
Poverty statistics also take significant time to be released. The poverty rate for 2020 was not released until September 2021. One recent innovation measures poverty in close to real time. The researchers use the monthly Current Population Survey poverty rates, with just a short lag in reporting.7 The real-time poverty measure shows how poverty fell in the months around the Economic Impact Payments in April 2020 and January 2021.8 Conversely, the official poverty measure and supplemental poverty measure summarize poverty in 2020 with a single number each. (See Figure 2.)
Figure 2
Lack of standard definitions of inequality
Various government agencies use different inequality measures. The Census Bureau uses its money income definition to publish inequality statistics, such as the Gini coefficient, a single number that measures income dispersion, and share of income received by different percentiles of the population. While not a statistical agency, the Congressional Budget Office, or CBO, publishes its own inequality statistics.9 CBO receives a sample of tax return data from the Internal Revenue Service about 2 years after the tax year ends, and CBO statistically matches the tax data and the Current Population Survey.
The Congressional Budget Office also adjusts for underreporting of benefit receipt and imputes the value of health insurance provided. For Medicaid, CBO assigns each household receiving Medicaid the average dollar cost to the government by subgroup. CBO uses administrative total Medicaid payments to a subgroup divided by the number of people in that subgroup.10
The measures of income used in estimating inequality by the Congressional Budget Office and the Census Bureau represent just two ways of doing so. Both ways show an increase in inequality over the past 40 years when using the Gini coefficient or when using the share of resources going to the top of the income distribution. Inequality researchers sometimes use other definitions of income, such as before-tax income from tax returns, which also shows increasing inequality.11 Almost universally, these different inequality measures show increasing inequality.
The only measures that won’t show increasing inequality over the past 40 years, or very little increase in inequality, are those that ignore the top of the distribution, such as the 90/10 ratio. The 90/10 ratio calculates the income of the household at the 90th percentile and divides it by the income of the household at the 10th percentile. Inequality over the past 40 years is driven by the top 10 percent, and even the top 1 percent. Using the 90/10 ratio as the measure of inequality excludes the portion of the distribution that is driving inequality.
Failure to capture multidimensional inequality
Another issue with official government statistics is that they fail to capture the multidimensional nature of poverty and inequality. Income, consumption, and wealth each convey important information.12 Income is how much money is coming into households. Consumption describes families’ standard of living. And wealth details the cushion that households have against hard times, which is especially for low-income households. Those who are poor measured by income may not be poor measured by consumption or wealth.
As with income, researchers use different definitions of consumption and wealth, and they use different inequality measures. Using consumption, one measurement disagreement regards the inclusion of education expenses. Some researchers exclude education spending on the argument that education spending is an investment.13 Others include education spending as part of consumption. Inequality is lower when excluding education expenses because of higher education spending by higher-income households, but inequality increased since 1984 using both consumption measures.14
Research using wealth to measure inequality typically uses either the Federal Reserve Board’s Survey of Consumer Finances, or it uses tax data. Regardless of data source or wealth definition, researchers find increasing inequality.15
Inequality in two and three dimensions is growing, and growing faster than inequality in any single dimension. In 1989, 1.7 percent of Americans were in the top 5 percent of the income, consumption, and wealth distributions. In 2007, 2.5 percent of Americans were in the top 5 percent of all three resource measures, indicating that the country is becoming more stratified across all three measures. While the percentages in the top 5 percent of all three have fallen since the Great Recession of 2007–2009, it still exceeds the 1989 levels.16 Those who are at the top of the income distribution are more likely to also be at the top of the wealth distribution and the top of the consumption distribution today than they were in 1989. (See Figure 3.)
Figure 3
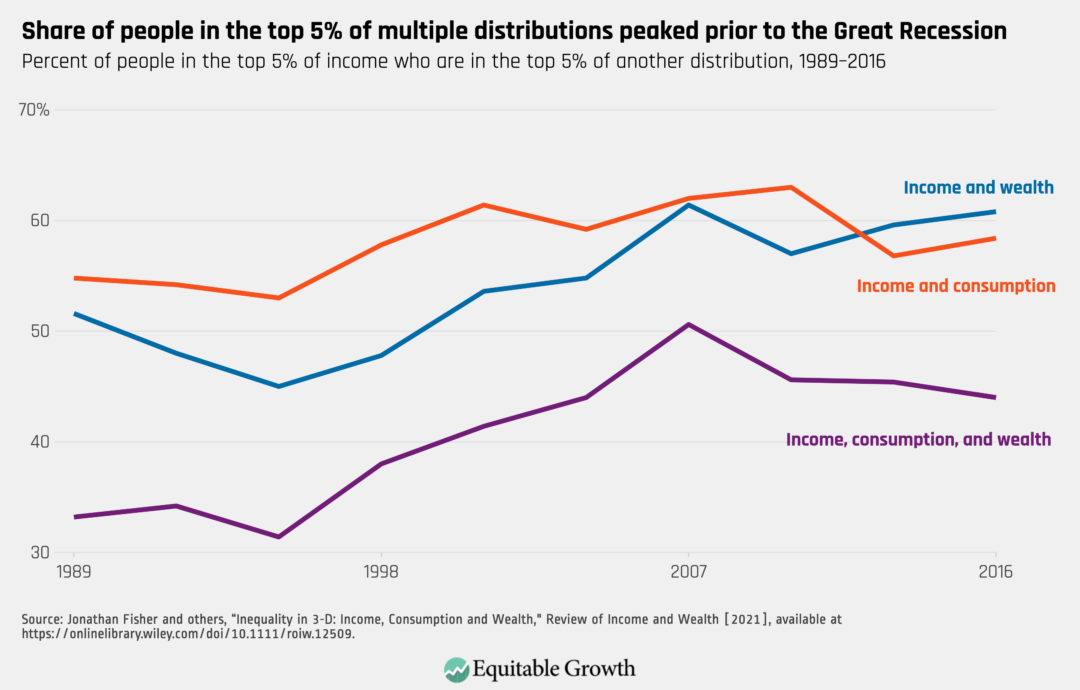
This work was only feasible by imputing consumption to the Survey of Consumer Finances, or SCF. The SCF captures income and wealth but has very little on consumption. In addition, the SCF is collected by the Federal Reserve Board, which is not a statistical agency. It would be better for the data to be collected and distributed through the federal statistical system. The Survey of Income and Program Participation, or SIPP, captures income and some wealth elements. No federal survey collects all three measures.
Federal statistics conceal substantial variation by race, gender, and ethnicity
The federal statistical system cannot represent the full dimensions of inequality and poverty by race, gender, ethnicity, and other important characteristics. The American Community Survey, or ACS, surveys the largest number of households, including households on Indigenous lands and households in Puerto Rico. The ACS surveys more than 2 million households per year. But the ACS misses many relevant income sources and has little on consumption and wealth. The Current Population Survey, or CPS, is used for income poverty and inequality calculations and provides comprehensive income measurement, but it only surveys around 50,000 households. The Survey of Income and Program Participation, or SIPP, is also a fantastic data source that captures income and some elements of consumption and wealth, but the SIPP only interviews around 40,000 households as well. The CPS and SIPP lack the sample size to produce statistics about smaller populations.
Small sample sizes inhibit our ability to understand differences between groups in a timely manner. Statistical agencies typically combine groups such as Asian American, Native Hawaiian, and Pacific Islander people, or AANHPI, into one group because of small sample sizes, but this group is not homogenous. In aggregate, AANHPI men and women do have higher average earnings than men and women of the other major racial and ethnic groups. (See Table 1.)
Table 1
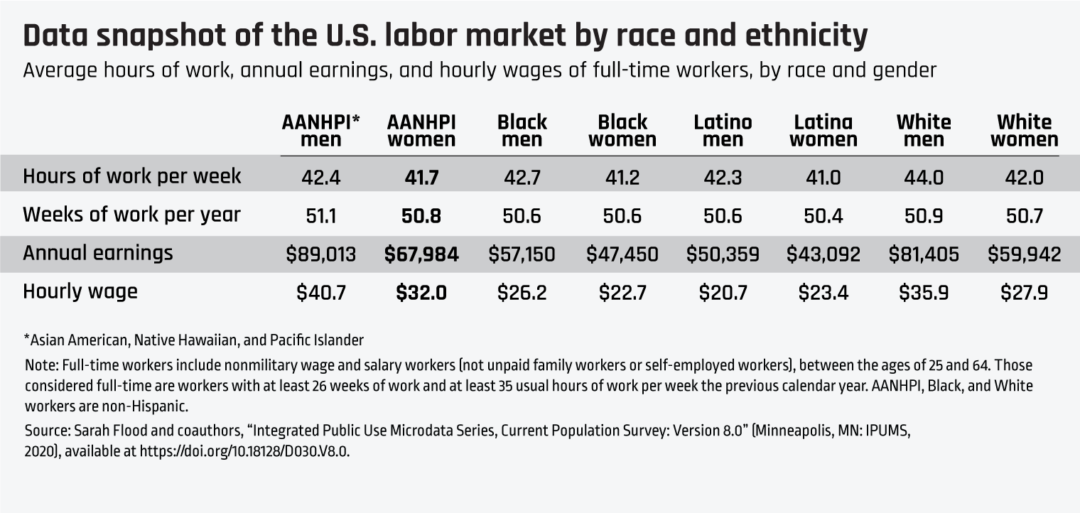
Yet these aggregate statistics mask important inequities within the AANHPI community.17 Research by Rakesh Kochhar and Anthony Cilluffo of the Pew Research Center, for example, shows that income is more unequally distributed among the Asian American and Pacific Islander population than among any other major racial or ethnic group, with Asian American and Pacific Islander families in the top 10 percent of the income distribution earning 10.7 times as much as those in the bottom 10 percent.18
In the case of AANHPI women specifically, disparities in U.S. labor market outcomes are evident in their overrepresentation in both high- and low-wage occupations. An analysis by the National Women’s Law Center shows, for example, that Asian American and Pacific Islander women make up about 3 percent of the U.S. workforce, yet they represent 4.2 percent of all workers in the highest-paying jobs and 4.3 percent of all workers in the lowest-paying jobs in the U.S. economy.19
Policy recommendations
In which direction should the federal statistical system move to help understand whether the important work of this committee will be successful? We describe four important steps that should be taken.
GDP 2.0
Gross Domestic Product needs an upgrade. Rather than ignore distributional differences, what if the federal statistical agencies pursued what the Washington Center for Equitable Growth calls GDP 2.0? GDP 2.0, which is referred to as Distributional National Accounts by academic economists, is the idea that we should add to our national accounts a breakout of growth for different populations. In our earlier hypothetical example of an economy with 20 individuals, one of whom inherited $1 million, using GDP 2.0, the Bureau of Economic Analysis would report that income increased 20-fold for the top of the distribution while it was unchanged for the bottom of the distribution. Everyone in the economy would then understand what happened much better.
Encouragingly, the Bureau of Economic Analysis has recently produced prototype statistics that distribute personal income growth. Personal income is a measure of total output, analogous to GDP, that requires fewer assumptions to distribute. Currently, this prototype data series distributes growth for each decile of the income distribution.
To see how a permanent, real-time version of this prototype could be useful in understanding and responding to recessions, we used the recently developed BEA prototype, produced with a 2-year lag, to chart growth in income during and after the Great Recession.20 The policy response to the Great Recession left millions of low- and middle-income families struggling while wealthy families saw significant additions to their incomes.
Consider the cumulative growth in disposable personal income of high- and low- or moderate-income Americans. High-income households in the top 10 percent initially suffered a steep drop in income at the onset of the Great Recession due primarily to the collapse of income from assets such as stocks and bonds, which cratered early in the economic downturn, alongside business income losses. Low- to middle-income households in the bottom half of the income distribution did not initially suffer as dramatic a fall. (See Figure 4.)
Figure 4
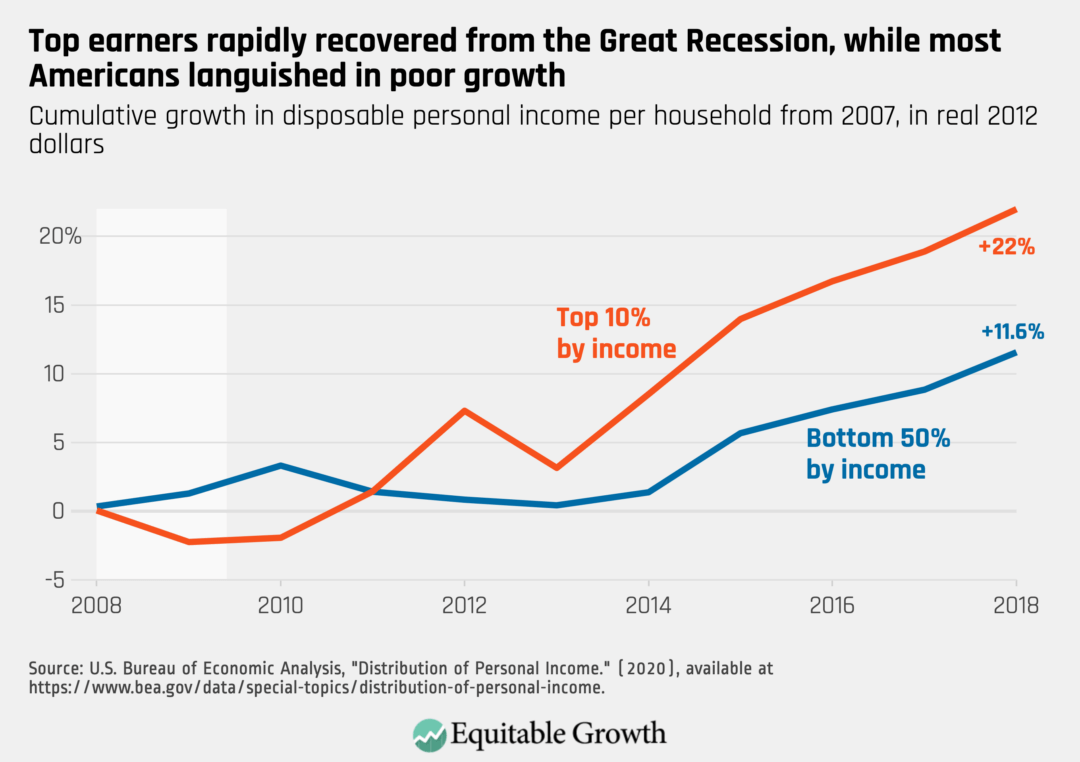
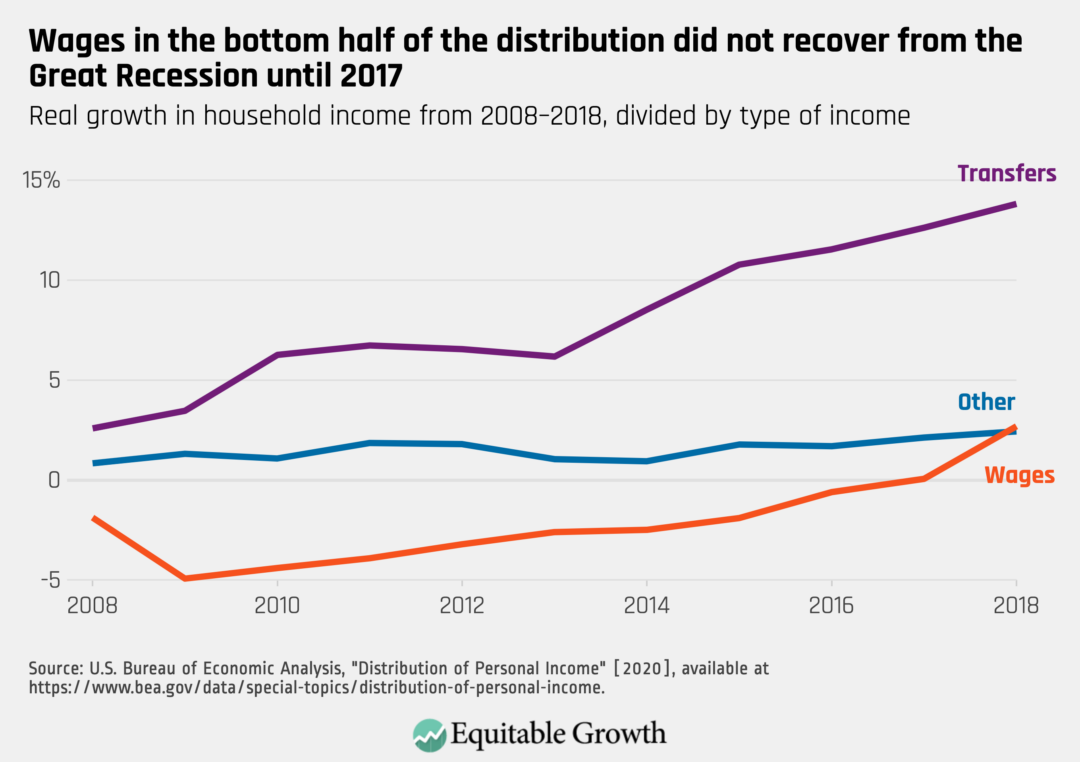
One reason for the less dramatic shock to income seen in Figure 1 among households in the bottom 50 percent was that disposable personal income incorporates transfers from the federal government to households, so losses in this group were partially compensated for by rising Unemployment Insurance payments, Supplemental Nutrition Assistance Program benefits, and other government benefits. But this group then became mired in years of stagnant, or even declining, income as these benefits ended amid a still-tepid economic recovery and did not experience substantial income gains until 2015. In fact, the bottom 50 percent did not recover all that was lost in wages in the Great Recession until 2017. (See Figure 5.)
Figure 5
By comparison, households in the top 10 percent of income recovered almost immediately after the end of the Great Recession and ended 2018 up 22 percent, compared to 2007. Importantly, the jump in top incomes in 2012 and steep decline in 2013 seen in Figure 3 does not represent a real decline. Rather, it is the result of households retiming their income to occur in 2012 so they could avoid rising top-income tax rates in 2013, as a result of the expiration of high-income tax cuts first enacted during the George W. Bush administration.
BEA’s dataset makes it clear that the labor market had not recovered by 2010 and that households in the bottom half of the distribution were in recession well into 2015. Although some U.S. labor market statistics hinted at this weakness, the relatively healthy headline GDP growth of 2010 convinced legislators in both parties to “pivot to austerity” in an attempt to reduce deficits. This pivot had a disastrous human cost, as many families saw their incomes dip as the government ratcheted down spending.
Had federal statistical agencies instead focused on the distribution of growth, then the public, the media, and policymakers alike would have been better informed. And policymakers might have greatly helped American families by passing stimulus targeted at this bottom 50 percent group instead of cutting programs.
In addition to reporting growth by level of income, GDP 2.0 also might eventually include reporting on growth for rural residents, Americans in marginalized groups, and so on.
Here are concrete steps Congress can take to improve the reporting of economic growth.
- The BEA data series remains a prototype. Congress should give BEA a mandate and the necessary resources to expand and improve upon this product. Currently, it is released only annually and with a significant time lag. Congress should pass the Measuring Real Income Growth Act, which would require BEA to include distributional analysis with each GDP report.21 BEA also needs additional resources to create the necessary high-frequency and low-lag data series.
- Congress should implement the administration’s proposal in the FY 2022 Treasury Green Book that would expand access to federal tax information to the Bureau of Labor Statistics, or BLS, and BEA.22 This expansion would not impact the privacy of tax data and would remedy a longstanding problem that has harmed the accuracy of BLS and BEA data series and prevented these agencies from pursuing promising areas of research.
FAIR Scoring Act
We want to highlight one related measure Congress should consider taking to achieve fair growth. The Fiscal Analysis by Income and Race, or FAIR, Scoring Act, would direct the Congressional Budget Office to prepare distributional analyses by race and income for all legislation with substantial budgetary effects.23 This bill is, in some ways, the other side of the GDP 2.0 coin. GDP 2.0 will help us assess, in retrospect, how policy is impacting the distribution of economic resources. The FAIR Scoring Act would help legislators understand the disparate effects of legislation in advance of passing it. Under the proposed bill, CBO would report not simply the expansion costs of the Child Tax Credit, for example, but would also note the benefits—a 50 percent decrease in child poverty that was previously only reported by independent analyses.
These scoring improvements would allow members of Congress to target particular economic disparities and fine-tune legislation to address them. Many members of Congress have expressed a desire to address the vast wealth divide between White and Black families. If the FAIR Scoring Act were implemented, then forecasts would show how much legislation would widen or narrow this divide.
Need for integrated and expanded data from the federal statistical system
To improve measurement of disparities for smaller subpopulations and disparities across income, consumption, and wealth, Congress should support the Census Bureau and Bureau of Labor Statistics working together to develop one survey that can:
- Measure income, consumption, and wealth. Having all three measures in one survey would decrease academic disagreement on the proper survey or definitions to use.
- Reconcile the reporting of these measures, so that they are close to agreement. Income and consumption are often underreported in surveys. Asking survey respondents to reconcile their income and consumption can help reduce underreporting.
- Link to administrative records, such as tax data. Linkage to administrative data can also help with underreporting. In addition, linkage allows researchers to virtually follow respondents before and after the respondents actually participate in the survey. Linkage also would allow for more detailed study of intergenerational mobility.
- Have a small longitudinal component. Income and consumption volatility harm the well-being of households, especially among low-income households.24 A survey that can track this volatility by surveying the same households over multiple years will allow for further study of volatility and the role fiscal policy plays in exacerbating or alleviating volatility.
- Capture differences by race, ethnicity, and gender. This can be done by increasing the sample size and oversampling small subpopulations.
Next steps
The federal statistical system fails to provide the necessary information to Congress, the media, and the American people on the state of the economy and the extent of inequality. These four steps can improve the federal statistical system.
- Congress must give the Bureau of Economic Analysis the resources to expand and improve upon its current Distribution of Personal Income product, what Equitable Growth calls GDP 2.0. Currently, it is released only annually and with a significant time lag. Congress should pass the Measuring Real Income Growth Act, which would require BEA to include distributional analysis with each GDP report. BEA also needs additional resources to investigate the creation of a high-frequency and low-lag data series.25
- Congress should also implement the administration’s proposal in the FY 2022 Treasury Green Book that would expand BLS and BEA access to federal tax information. This expansion would, without impacting the privacy of tax data, remedy a longstanding problem that has harmed the accuracy of BLS and BEA data series and prevented these agencies from pursuing promising areas of research that will help policymakers, business, and the American people.
- Congress should pass the FAIR Scoring Act. This bill would direct CBO to prepare distributional analyses by race and income for all legislation with substantial budgetary effects. This bill is, in some ways, the other side of the GDP 2.0 coin. GDP 2.0 will help us assess, in retrospect, how policy is impacting the distribution of economic resources. The FAIR Scoring Act would help legislators understand the disparate effects of legislation in advance of passing it.
- Congress should support the Committee on National Statistics, which is part of the National Academies of Science, Engineering, and Medicine, and its push for an integrated statistical system that can measure income, consumption, and wealth poverty and inequality for the same households. This integrated statistical system should oversample smaller subpopulations, allowing for a more detailed understanding of which subpopulations are impacted or not impacted by fiscal policies.
Lastly, it is important that these efforts reside within the federal statistical system. BEA should continue to research and improve its GDP 2.0 efforts. BEA acts as the neutral arbiter among academics and can adopt the best practices developed among researchers and among other countries’ statistical agencies. The integrated statistical system should also live at a statistical agency, such as the Census Bureau or Bureau of Labor Statistics. These agencies contain the expertise to collect the surveys and design the questionnaires.
End Notes
1. Congressional Budget Office, “The Distribution of Household Income, 2018” (2021), available at https://www.cbo.gov/system/files/2021-08/57061-Distribution-Household-Income.pdf.
2. See Federal Committee on Statistical Methodology at https://nces.ed.gov/fcsm/agencies.asp.
3. Alan Jacobs and others, “Whose News? Class-Biased Economic Reporting in the United States,” American Political Science Review 115 (3) (2021), available at https://doi.org/10.1017/S0003055421000137.
4. Bruce Meyer and Nikolas Mittag, “Using Linked Survey and Administrative Data to Better Measure Income: Implications for Poverty, Program Effectiveness, and Holes in the Safety Net.” Working Paper 21676 (National Bureau of Economic Research, 2015), available at https://www.nber.org/papers/w21676.
5. Jonathan Rothbaum and Adam Bee, “Coronavirus Infects Surveys, Too: Survey Nonresponse Bias and the Coronavirus Pandemic.” Working Paper SEHSD WP2020-10 (U.S. Census Bureau, 2021), available at https://www.census.gov/library/working-papers/2020/demo/SEHSD-WP2020-10.html.
6. U.S. Census Bureau, The Supplemental Poverty Measure 2020 (2021), available at https://www.census.gov/library/publications/2021/demo/p60-275.html.
7. Jeehoon Han, Bruce Meyer, and James X. Sullivan, “Income and Poverty in the COVID-19 Pandemic” (Washington: Brookings Institution, 2020), available at https://www.brookings.edu/wp-content/uploads/2020/06/Han-et-al-conference-draft.pdf.
8. “Near Real Time COVID-19 Income and Poverty Dashboard,” available at http://povertymeasurement.org/covid-19-poverty-dashboard/ (last accessed November 15, 2021).
9. Congressional Budget Office, “The Distribution of Household Income, 2018.”
10. Bilal Habib, “How CBO Adjusts for Survey Underreporting of Transfer Income in Its Distributional Analysis.” Working Paper 2018-07 (Congressional Budget Office, 2018), available at https://www.cbo.gov/system/files/2018-07/54234-workingpaper.pdf.
11. Thomas Piketty and Emmanuel Saez, “Income Inequality in the United States, 1913-1998,” Quarterly Journal of Economics 118 (1) (2003): 1–40, available at https://doi.org/10.1162/00335530360535135.
12. Equitable Growth recently helped organize a planning meeting with the National Academies of Science, Engineering, and Medicine through the Committee on National Statistics on measuring multidimensional inequality and poverty. The planning meeting included such experts in inequality and poverty measurement as Nobel Prize in Economics winner Angus Deaton, Janet Gornick, William Darity, Hilary Hoynes, and Bruce Meyer. Jonathan Fisher presented at the meeting while still working at Stanford University. The work of the planning meeting coincides with recent international efforts by the Organisation for Economic Co-operation and Development, or OECD, and Eurostat, the European Union’s statistical agency to measure multidimensional inequality and poverty. Fisher is part of the OECD and Eurostat’s Expert Group on Measuring the Joint Distribution of Household Income, Consumption and Wealth at the Micro Level.
13. Bruce Meyer and James Sullivan, “Consumption and Income Inequality and the Great Recession,” American Economic Review 103 (3) (2013): 178–183.
14. Jonathan Fisher, David Johnson, and Timothy Smeeding, “Inequality of Income and Consumption in the U.S.: Measuring the Trends in Inequality from 1984 to 2011 for the Same Individuals,” Review of Income and Wealth 61 (4) 2015, available at https://doi.org/10.1111/roiw.12129.
15. Using survey data, see Jonathan Fisher and others, “Inequality in 3-D: Income, Consumption and Wealth,” Review of Income and Wealth (2021), available at https://onlinelibrary.wiley.com/doi/10.1111/roiw.12509. Using tax data, see Emmanuel Saez and Gabriel Zucman, “Wealth Inequality in the United States since 1913: Evidence from Capitalized Income Tax Data,” Quarterly Journal of Economics 131 (2) (2016), available at https://doi.org/10.1093/qje/qjw004.
16. Fisher and others, “Inequality in 3-D: Income, Consumption and Wealth.”
17. Kate Bahn and Carmen Sanchez Cumming, “The Intersectional Wage Divides Faced by Asian American, Native Hawaiian, and Pacific Islander Women in the United States” (Washington: Washington Center for Equitable Growth, 2021), available at https://equitablegrowth.org/the-intersectional-wage-divides-faced-by-asian-american-native-hawaiian-and-pacific-islander-women-in-the-united-states.
18. Rakesh Kochhar and Anthony Cillufo, “Income Inequality in the U.S. is Rising Most Rapidly Among Asians” (Washington: Pew Research Center, 2018), available at https://www.pewresearch.org/social-trends/2018/07/12/income-inequality-in-the-u-s-is-rising-most-rapidly-among-asians/.
19. Jasim Tucker, “Equal Pay for Asian American and Pacific Islander Women” (Washington: National Women’s Law Center, 2020), available at https://nwlc.org/wp-content/uploads/2019/03/AAPI-EPD-1.30.2020.pdf.
20. U.S. Bureau of Economic Statistics, “Distribution of National Income” (n.d.), available at https://www.bea.gov/data/special-topics/distribution-of-personal-income.
21. House Committee on Oversight and Reform, “Chairwoman Maloney Introduces Bill to Improve Transparency of Economic Growth by Income Level,” Press release, May 10, 2021, available at https://oversight.house.gov/news/press-releases/chairwoman-maloney-introduces-bill-to-improve-transparency-of-economic-growth-by.
22. U.S. Department of the Treasury, General Explanations of the Administration’s Fiscal Year 2022 Revenue Proposal (2021), available at https://home.treasury.gov/system/files/131/General-Explanations-FY2022.pdf.
23. Office of Sen. Elizabeth Warren, “Warren, Bennet, Khanna, Phillips to Introduce the CBO FAIR Scoring Act,” Press release, August 11, 2021, available at https://www.warren.senate.gov/newsroom/press-releases/warren-bennet-khanna-phillips-to-introduce-the-cbo-fair-scoring-act.
24. For earnings instability, see Emily Wiemers and Michael Carr, “Earnings Instability and Mobility over our Working Lives: Improving Short- and Long-term Economic Well-Being for U.S, Workers” (Washington: Washington Center for Equitable Growth, 2020), available at https://equitablegrowth.org/earnings-instability-and-mobility-over-our-working-lives-improving-short-and-long-term-economic-well-being-for-u-s-workers/. For consumption instability, see Jonathan Fisher and Bradley Hardy, “Money Matters: Consumption Volatility Across the Income Distribution.” Working DP 2021-02 (University of Kentucky Center for Poverty Research, 2021), available at https://cpr.uky.edu/sites/ukcpr/files/research-pdfs/DP2021-02a.pdf/.
25. U.S. Bureau of Economic Analysis, “Distribution of Personal Income.”