(This column is based on a presentation to the 2016 New Hampshire Fiscal Policy Institute conference.)
New Hampshire is a relatively high-wage state: Its median wage for full-time workers of $20.38 an hour ranks 13th in the United States. But it also has the lowest minimum wage—$7.25 an hour—in the nation. As a result, New Hampshire has more opportunity now than most other states to raise its minimum wage.
To evaluate what would be an appropriate minimum wage for New Hampshire, we can look at the ratio of the minimum wage to the state’s median wage for full-time workers. How this measure of the “bite” of the minimum wage has ranged over time gives us a good sense of how far the minimum wage has cut into the state’s underlying wage distribution. Assuming underlying inequality stays the same, higher minimum-to-median-wage ratios indicate that any earnings and employment effects of minimum-wage increases could be larger, since a greater share of the workforce would be affected by the minimum wage.
Figure 1 shows how the minimum-to-median wage ratios in both New Hampshire and the United States as a whole have changed since 1979, the earliest point for which we have comparable data. Today, the bite of the minimum wage is lower in New Hampshire than in most states. New Hampshire’s minimum-to-median wage ratio last year was 35.6 percent, below the national average ratio of 41.2 percent. With relatively high median wages but following the lowest, federal minimum wage, New Hampshire’s minimum-to-median wage ratio is the fourth-lowest of any state.
Figure 1
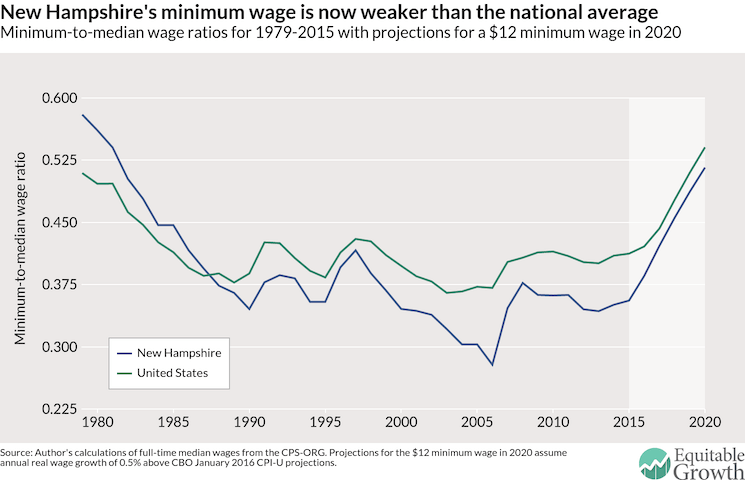
But as Figure 1 illustrates, this was not always the case. In the late 1970s and early 1980s, relatively low wages in New Hampshire caused the state’s minimum wage to bind much more strongly—that is, to be closer to the median wage. New Hampshire’s minimum-to-median wage ratio in 1979 was 58 percent, well above the national ratio at that time of 50.9 percent.
A low bite now and a high bite in the past suggests that New Hampshire has more room to raise minimum wages than other states. Figure 1 also shows what future minimum-to-median wage ratios would look like were the nation and New Hampshire to adopt a $12 minimum wage by 2020. (Since we don’t know what wage growth will be over the next five years, these projections assume annual wage growth of 0.5 percent above the Congressional Budget Office’s projected inflation.) The bite of the minimum wage would rise substantially in New Hampshire to 51.6 percent, significantly below the state’s bite in 1979 and similar to the national bite at that time. These figures suggest that New Hampshire has already experienced minimum-to-median wage ratios equivalent to what the state would see with a $12 minimum wage in 2020.
Since we don’t have a solid handle on the effects of high minimum wages in the 1970s, we can turn to a different evidence base that many economists hold as a standard for evaluating the causal effects of minimum wage policies. A set of papers by Arindrajit Dube of the University of Massachusetts Amherst, Michael Reich of the University of California, Berkeley, and T. William Lester of the University of North Carolina at Chapel Hill makes careful comparisons between areas with different minimum wages by contrasting nearby counties that straddle state borders and therefore have different minimum wages. Using the cross-border county research design, these studies estimate employment effects for teens and restaurants that are small and statistically indistinguishable from zero.
We can use the range of the bite in these border counties to understand which minimum-to-median wage ratios overlap the evidence base that shows no significant trade-off between raising wages and employment. (See Figure 2.)
Figure 2
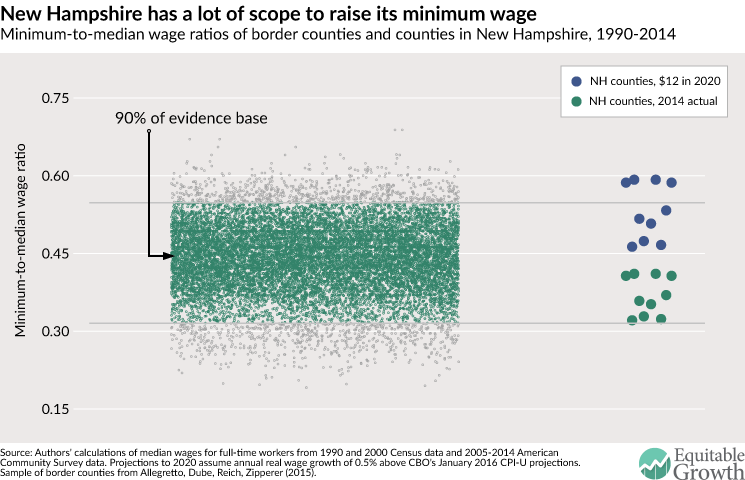
The left side of Figure 2 illustrates the set of minimum-to-median wage ratios during 1990 to 2014 for counties in cross-border discontinuity studies of restaurant employment. These range from about 19 percent to 69 percent, but 90 percent of the sample falls between about 32 percent and 55 percent. The right side of Figure 2 displays minimum-to-median wage ratios for New Hampshire’s 10 counties in 2014—the latest year for which data are available—as well as their bite in 2020 under a $12 minimum wage. Under this policy, New Hampshire’s counties would rise from having a bite at the low end of the spectrum to having a high bite relative to the 1990–2014 evidence base. Ranging from 46.3 percent to 59.2 percent, a majority of counties would fall squarely within the range of minimum-to-median wage ratios, but some low-wage counties have bites that fall above the bulk of the evidence base.
Compared to the longer, historical evidence in Figure 1, all of the New Hampshire counties with a $12 minimum wage in 2020 have minimum-to-median wage ratios near or substantially below the state ratio of 58 percent in 1979. New Hampshire’s labor market therefore has a great deal of room to accommodate much higher minimum wages.