Expand Social Security

AP Images

About the author: Jesse Rothstein is a professor of public policy and economics and Director of the Institute for Research on Labor and Employment at the University of California-Berkeley.

The economic security of the broad middle class in the United States has eroded in recent decades, with stagnating wages, vanishing job security, and necessities such as child care, higher education, and healthcare becoming less and less affordable. Restoring economic security should be the center of the next Administration’s domestic agenda.

One area that needs to be rethought is retirement. This was traditionally seen as a three-legged stool, with retirees relying in roughly equal parts on Social Security benefits, employer-provided pensions, and private savings. This was never the universal reality—even 30 years ago, barely half of workers nearing retirement participated in employer-based plans.1 But today, all three legs of the stool have been whittled away to almost nothing:

  • Defined-benefit pensions have largely disappeared. In 2010, only 22 percent of full-time, private-sector employees had a defined-benefit retirement plan,2 and public-sector pension funds (along with remaining private-sector funds) face serious financing shortfalls.
  • Less than 60 percent of near-retirement-age households have any retirement savings,3 and among those the median balance is only $91,000.4 This would purchase an annuity (at age 65) of only $5,000 per year.
  • Fewer and fewer Americans—about half in recent Gallup polling5—believe that Social Security will be there for them in retirement.

In this environment, only the wealthiest Americans can feel any sense of confidence about their retirement. Policy changes that strengthen the retirement system have tremendous promise to improve people’s feelings of security—not just retirees but also people in the prime of their lives.

Fortunately, the solution is simple. Our efforts should focus on strengthening and growing the part of the system that works well: Social Security. Fixing the financing shortfall and growing the system to provide real economic security in retirement, on its own, are affordable and feasible, and should be an important part of the middle class security agenda.

The problem:
Inadequate retirement security

Nearly every retiree receives Social Security benefits—about 40 million retired workers, plus millions more of their spouses, their other dependents, and survivors of those who die early.6 These benefits average under $1,350 per month,7 with 30 percent of retirees receiving less than $1,000 per month.8 This is not enough on its own to finance a decent standard of living.

Delivering equitable growth

Previous article: Early childhood development, Ariel Kalil
Next article: Unemployment insurance reform, Till von Wachter

Unfortunately, the other two legs of the three-legged stool, pensions and private savings, are no longer reliable. Half or less of workers nearing retirement age participate in employer-based retirement plans,9 and among full-time, private-sector workers with plans, most have only a defined-contribution plan, such as a 401(k); only about one-third have a defined-benefit plan (a traditional pension).10 As for private saving, less than 60 percent of near-retirement-age households have any savings in retirement accounts (including employer-based accounts).11 For those that do have savings, the median balance is only $91,000.12 If this were all converted to an annuity at age 65, it would provide less than $5,000 per year in retirement income. While a very small number of high-income retirees have substantial savings, this is very much not the norm.

Accordingly, Social Security makes up a very large share of most retirees’ incomes. For nearly half of married retirees and nearly three-quarters of unmarried retirees, Social Security benefits provide more than half of the household’s income.13 Over one-fifth of married retirees and nearly half of unmarried retirees rely on the program for fully 90 percent of their income.14 These benefits are not enough to support a comfortable retirement. Nine percent of seniors live in poverty.15 Using the U.S. Census Bureau’s new supplemental poverty measure that accounts for medical costs, geographic differences, and transfer payments, the proportion in poverty grows to 15.8 percent.16

No real prospect of restoring security
via pensions or private savings

Traditional, employer-provided pensions fit poorly with today’s labor market, where few workers can expect to remain at a single employer their whole careers. Moreover, in today’s financialized world employers find it too easy to renege on commitments to their past workers, leaving the government holding the bag and retirees without the pensions they were promised. Many private pension funds have gone broke; others have been closed to new enrollees. In the public sector, where it is harder for governments to slip out of past commitments, many public pension funds face serious gaps between promised benefits and funds with which to pay them, putting severe stress on state and local budgets.

Efforts to shore up the old pension system have had little success. Coverage rates, especially in the private sector, have plummeted. Recent efforts have focused on designing portable pensions that are not tied to specific employers. These efforts, while worthy, face fundamental challenges of financial viability, administrative complexity, and legal constraints. They are unlikely to reach many workers in the short run.

Efforts to promote retirement savings in defined-contribution plans, including IRAs and 401(k)s, have by and large been unsuccessful. Tax subsidies for retirement saving largely serve to induce households that would have saved anyway to shift from unsubsidized to subsidized accounts, with little impact on overall savings.17 While some “nudge” programs have been found to have larger effects,18 decades of policy and research work have failed to dent the problems of low participation rates and low balances among those who save.

For those who do manage to save, private accounts are a poor solution. Savers pay high fees on their investments, and often make bad investment decisions (in many cases under instruction from advisors facing serious conflicts of interest). Even wise investment plans expose savers to substantial market risk, as many Baby Boomers discovered in 2008.

Moreover, private savings plans have not solved the fundamental challenge of retirement savings—the need to insure the individual against uncertainty over the length of the retirement period and over investment returns. While retirees are often advised to buy annuities, these are very expensive and few retirees purchase them. Absent annuities, the only way individuals can be confident that they will not outlive their savings is to save much more than they will likely need, and to limit their drawdown, to preserve money that they will likely never spend. While some wealthy individuals may want to leave substantial bequests for their heirs, most would be better off under a retirement system that allowed them to spend down their savings during their lives, confident that they would be protected if they lived longer than expected.

The solution is simple:
Expand Social Security

Fortunately, it is possible to dramatically expand retirement security without fixing the problems with employer-provided pensions and private savings. Social Security has worked for decades and can easily be scaled up to fill in the holes in the retirement puzzle.

As a social insurance program, Social Security builds in protection against longevity and earnings risk, and shields retirees—most of whom have no interest in or capacity to participate in financial markets—from bad markets and unscrupulous or incompetent investment advisers. Its funding is not tied to the continued viability of any single employer, and while occasional adjustments are needed as demographic and economic realities diverge from earlier projections, these are small relative to the volatility faced by pension funds or private savings.

Policymakers should therefore pursue a major expansion of Social Security. There are a number of attractive ways to do this. I articulate three principles that should guide such an expansion, then describe three options that would satisfy the following principles:

  • Social Security benefits should be enough for retirees to live on, on their own
  • The features that have made the program such a success to date, including its universality and its dedicated, untouchable financing stream, should be preserved
  • The existing program’s long-term financing shortfall should be closed via new revenues rather than benefit cuts, with the pain of this offset by real, visible benefits in the form of higher payments to retirees

The following three policy options are consistent with these principles

Three policy changes
to expand Social Security

Expand the program via proportionate increases to tax rates and to all recipients’ benefits

A modest increase in the payroll tax rate of less than one percentage point—from 6.2 percent to 7.2 percent, respecting the current taxable earnings cap—on both workers and employers would finance a 15 percent benefit increase for all current and future retirees as well as survivors and disabled workers. This could (and should) be scaled to provide larger increases—for example, a 2 percentage point increase in the tax rate would finance a 30 percent increase. If disabled workers’ benefits were excluded from the expansion, the benefit increase would be larger, 18 percent per percentage point on the tax rate.

Eliminate the current taxable earnings cap, and split the revenues among increasing benefits for those who pay higher taxes, closing the financing gap, and increasing benefits for the lowest earners

Earnings above $118,500 per year are exempt from Social Security taxes, specifically the Federal Insurance Contributions Act, or FICA, taxes. Only 6 percent of workers earn more than this amount, but the share of wages above the threshold has grown as these income earners have pulled away from the rest of the workforce.19 Eliminating the cap, without increasing benefits, would yield more than enough revenues to close the 75-year projected finance shortfall for Social Security and Social Security Disability Insurance.20

More consistent with the principles above would be to use some of the revenues to increase benefits for high earners in order to preserve the program’s universality while imposing a reasonable cap on the size of the individual benefit. Another portion should go toward increasing benefits for lower-earning recipients. This would help promote retirement security and would create a constituency to support the cap elimination. The remainder could still make a substantial down-payment toward eliminating the financing gap.

If earnings were subject to taxes without a cap but non-wage income remained exempt, many high earners might reclassify their earnings as capital gains or business income. To prevent evasion while being consistent with the overall structure of the program, the FICA tax might be applied to all personal income above the taxable earnings cap, regardless of whether that income comes as earnings or in another form. This would raise dramatically more money, more than enough to close the entire financing gap and support larger benefit increases for low-income retirees. While a few very high-income individuals would face sharply increased tax bills under this proposal, dedicating the revenues to the Social Security trust fund, just as FICA taxes are today, would promote the tax increase’s political viability and protect it from attack.

Create an optional extra tier of Social Security, into which workers could contribute in order to purchase extra benefits when they retire

Some higher-income workers may want more retirement consumption than even an expanded Social Security benefit can support. As discussed above, pervasive market failures make private retirement saving very inefficient. The government can solve this problem by allowing savers to use the existing Social Security infrastructure, with its built-in mechanisms, to pool and share risks at much lower “load” than any private savings vehicle.

Pricing of optional add-on benefits would need to account for a modest degree of adverse selection, as those with longer life expectancies would be somewhat more likely to participate. It would also be more expensive to administer than the current system, though likely much less so than existing private annuity products given the existing infrastructure to track contributions and benefit eligibility. But even with pricing that accounts for these extra costs—set to ensure that the new tier of optional add-on benefits is entirely self-financing—this would be a very attractive option relative to the private annuity market. Participants would contribute throughout their careers, with no need to make investment decisions, pay fees, or face market risk. In return, they or their survivors would receive higher benefits when they retired, became disabled, or died.

Other proposed changes that are similarly consistent with the principles enumerated above are also worthy of consideration. It is noteworthy, however, that recent discussions have moved away from the ideas of pre-funding Social Security benefits and investing trust funds in equities. These do nothing to address the above principles, and only expose the program (and the retirees it supports) to political and market risk.

Countering the objections
to expanding Social Security

There are three primary objections to the above proposals. None are compelling.

The first is that Social Security would be too expensive. It is undeniable that larger Social Security benefits would require correspondingly more revenue. But there is no way to support higher consumption for retirees—no way to address the retirement security problem—without in some way directing additional resources to these retirees. Any alternative would impose equal or higher costs, if not as higher payroll taxes than as higher diversion of before- or after-tax income into private savings or pension funds. It is much more efficient to route the needed resources through Social Security. Moreover, taxpayers see Social Security taxes as worth paying, tied as they are to eventual benefits.

The second objection is that higher tax rates would reduce the incentive to work. Again, Social Security expansions would not dramatically change the effective “wedge” between earnings and consumption—the money that would be collected through higher payroll taxes either represents new additions to the taxpayer’s consumption possibilities in retirement or merely displaces private savings with, if anything, a positive impact on retirement consumption. Thus any labor supply impacts would be very small.

The above proposals to uncap income subject to FICA taxes, while capping benefits, would expand the wedge for the highest-income workers. There is little evidence that these workers’ labor supply is very responsive to taxes, and the scope for evasion (which is more responsive) could be minimized by assuming that tax increases apply to a broad income base. In any case, this objection applies equally to any proposal to increase top income tax rates, a move that is likely inevitable as the share of national income accruing to the top 1 percent continues to grow.

The third objection is that expanding Social Security would crowd out private saving and reduce national savings. This is a prediction of standard economic models. But these models do not reflect reality. In fact, most workers have very little savings to be crowded out, and those who do save are not primarily saving for retirement (though they may store their savings in retirement accounts in order to obtain tax benefits).

Regardless, the national savings rate is simply not a first-order policy concern today. Finance is increasingly global, and profitable U.S. investments can be financed by savers elsewhere. Moreover, concerns about promoting saving are yesterday’s problem. Today, the evidence indicates that the nation and the world face a serious savings glut, not a shortfall. In today’s world, there is little if any reason to prefer prepaid to pay-as-you-go retirement systems.

Confronting neighborhood segregation

AP Images

About the author: Patrick Sharkey is a professor of sociology at New York University.

In 1970, 15 percent of families in the United States lived in neighborhoods where most of their neighbors were either extremely rich or extremely poor. By 2012, the percentage of families in such neighborhoods had more than doubled. More than a third of families now live in neighborhoods that can be thought of as mostly affluent, or mostly poor.21 As the level of economic inequality has risen over the past several decades, families of different economic classes have begun to move away from each other, literally, into separate communities.

And as our nation’s cities and communities have become more stratified, the life chances of those within the richest and poorest neighborhoods have become more unequal. Over the past decade or so, research from several different types of studies carried out in entirely different settings shows that growing up in a disadvantaged residential environment hurts the academic progress of children and reduces their chances to move upward in the income distribution.

This research comes from housing mobility programs such as the Dispersed Housing Program in Denver, the Moving to Opportunity program in five different cities, and the Ethel Lawrence Homes development in Mt. Laurel, New Jersey, all of which showed that when children are given the chance to leave communities with concentrated poverty and violence they benefit substantially in the long run.22 And it comes from natural experiments that reveal when children are able to attend high-quality schools with diverse student populations, their academic performance begins to steadily improve.23

Delivering equitable growth

Previous article: Geography of economic inequality, Kendra Bischoff

Most recently, the work of Stanford University economist Raj Chetty and his co-authors sheds light on the tremendous variation in economic opportunity across U.S. counties and commuting zones.24 This research is powerful because it makes the impact of place glaringly visible, and it demonstrates persuasively that our economic outcomes are driven not just by individual traits and skills, and not just by our parents and families, but also by the communities in which we spend our lives.25

Any agenda for economic mobility has to consider ways to confront residential segregation in America. There are two sets of approaches to confronting economic segregation and its impacts. The first set focuses on ways to invest in neighborhoods in order to make the consequences of segregation less severe, and the second set focuses on ways to reduce the level of segregation in American neighborhoods directly.

Invest in neighborhoods
where poverty is concentrated

Neighborhoods of concentrated poverty have never received the basic investments that are taken for granted in most communities across the country. While programs that confront urban poverty have come and gone, our most consistent, expensive housing investments are programs such as the home mortgage interest deduction, a tax subsidy that disproportionately goes to high-income homeowners in the nation’s wealthiest communities.26

The first approach to confronting economic segregation is to minimize its consequences by shifting investments into every low-income community across the country. Three types of investments are supported with strong evidence:

  • Provide work supports for individuals and families in high-poverty communities
  • Invest in evidence-based programs for young people
  • Identify or establish a “community quarterback” in every low-income neighborhood

Let’s examine each of these briefly in turn.

Provide work supports for individuals and families in high-poverty communities

The New Hope program provided work supports, wage supplements, and temporary, guaranteed public service jobs for low-income individuals in low-income neighborhoods of Milwaukee who were willing to work at least 30 hours per week. A randomized evaluation found that participants had higher rates of employment and higher earnings while the program was in operation. Further, children of families who took part performed better in school and showed improvements in behavior as well.27

The Jobs Plus program, carried out in five cities, provided a range of services to residents of public housing developments in order to improve their capacity to obtain and retain employment over time. The program also provided rent incentives designed to encourage work. The sites that offered the full range of services increased employment of residents by roughly 10 percent and increased earnings of participants by between 8 percent and 19 percent.28

Invest in evidence-based programs for young people

Recent demonstrations show that high-quality programs targeting youth in disadvantaged communities can have enormous impacts on their academic success and their involvement in violence. The Becoming A Man program in Chicago provides cognitive behavioral therapy combined with sports activities and lessons. Students randomly assigned to take part are more engaged in school and registered a greater than 40 percent reduction in arrests for violent crimes.29 A randomized trial providing “high-intensity” tutoring for one hour a day led to improvement in math scores equal to “an extra one to two years of learning.”30

What’s more, multiple randomized trials of summer jobs programs show that giving young people the chance to take on meaningful work in the summer, when violence is at its peak, produces substantial effects on violence and academic outcomes.31

Identify or establish a “community quarterback” in every low-income neighborhood

Stories of communities that have transformed over time, such as East Lake in Atlanta, always begin with one strong, stable institution that takes ownership over the community and takes responsibility for all of the residents within it. Purpose Built Communities—an organization that has most successfully worked to turn communities around across the country, including East Lake, calls this type of institution the “community quarterback.”32

To begin a process of change, federal resources should be combined with resources from foundations and the private sector to identify or establish a community quarterback in every low-income community across the country, so that everyone within that neighborhood knows that there is going to be an institution serving them for the long haul and will have resources sufficient to bring about long-term change.

Expand and preserve affordable housing
and provide access to areas of opportunity

The problem of affordable housing has become a crisis in cities across the country, exacerbating the consequences of concentrated poverty and creating severe hardship for low-income families. The instability at the bottom of the housing market makes it extremely difficult for families to have any chance of finding stable employment, to raise their children in stable homes and find quality schools, and to move upward in the income distribution.33

At the same time, families receiving housing assistance tend to churn through a small segment of neighborhoods that are characterized by segregation and that offer few opportunities for upward mobility.34 New approaches to housing assistance are needed in order to address the affordability crisis while also providing families with the capacity to make moves into neighborhoods and cities of opportunity.

This second set of approaches is designed to confront segregation directly, by addressing the affordability crisis while also taking active steps to create economically diverse communities at the bottom and at the top of the housing market. Specifically, this approach calls for

  • Expanding the supply of housing vouchers
  • Providing support to allow families to access opportunity neighborhoods
  • Providing incentives and regulations to preserve and expand affordable housing in exclusive markets
  • Establishing a long-range mobility bank

Each of these approaches are briefly detailed below.

Expanding the supply of housing vouchers

Only 1 in 4 families with income low enough to quality for housing assistance actually receive any form of assistance, as the supply of vouchers is nowhere near sufficient to meet the needs of low-income renters.35 A first step in addressing the problem of neighborhood segregation is to take active steps to create affordable housing. Expanding the number of housing-choice vouchers available to very low-income American families so that affordable housing is an entitlement is one straightforward policy option that has received bipartisan support.36

Providing support to allow families to access opportunity neighborhoods

Even when families do receive housing assistance, they are often left on their own to navigate the housing market without the support and information needed to find housing options in communities that may offer greater opportunities. Evidence from the Baltimore Housing Mobility Program shows that when housing assistance recipients are supported for long periods of time they are able to find and to stay in communities that offer higher-quality schools and greater economic opportunities.37 New resources are necessary to change the way housing assistance is supplied so that residents are provided support in finding units in new communities and continue to have support, for up to two years, which allows them to navigate their new environments, find transportation to new job opportunities, and locate the right schools for their children.

Providing incentives and regulations to preserve and expand affordable housing in exclusive markets

Growing demand in select U.S. cities, combined with rigid restrictions on real estate development, have created soaring housing prices in some cities and made it difficult for middle- and low-income families to take advantage of new opportunities in hot markets. To preserve affordable housing in such cities, the federal government can provide incentives for local cities and organizations to take active steps to utilize creative ways to take housing out of the market and keep it affordable.

Two approaches are community land trusts and inclusionary zoning. Community land trusts are sections of land that are owned by non-profit organizations and can be sold or rented to families at prices below the local market rate. The federal government also can provide incentives for local jurisdictions to implement mandatory inclusionary zoning plans, which require developers to include a percentage of affordable units in any new development.38

Both community land trusts and inclusionary zoning are designed to maintain mixed-income communities in markets where housing prices are rising rapidly. In other jurisdictions that have never provided affordable housing, the federal government must continue efforts begun under the Obama Administration to assist local jurisdictions in their efforts to comply with the rule requiring comprehensive plans for affirmatively furthering fair housing. The effort to gradually enforce compliance with this longstanding rule is crucial to breaking down barriers to economically diverse communities in jurisdictions that have resisted the requirement to provide affordable housing.39

Establishing a long-range mobility bank

Long-range residential mobility, which brings families into different parts of the country with greater economic opportunities, has always been a mechanism for upward mobility. Yet migration into new parts of the country has declined over time, particularly for black Americans. Jens Ludwig at the University of Chicago’s Harris School of Public Policy and Steve Raphael at the University of California-Berkeley’s Goldman School of Public Policy propose the idea of a “mobility bank” to encourage long-range moves that are risky to individuals and families, and exceedingly uncommon.40 The mobility bank would provide loans for individuals and families that allow them to make long distance moves away from distressed areas and into places that offer greater opportunities.

Addressing income volatility in the United States: flexible policy solutions for changing economic circumstances

AP Images

About the author: Bradley L. Hardy is an assistant professor in the Department of Public Administration and Policy at American University

Many low-income individuals and families also have highly unstable incomes between weeks, months, and years.41 This “income volatility” is an economic phenomenon driven largely by earnings, with a tendency to rise during recessions,42 and is attributed to short-term economic shocks such as job loss as well as larger, permanent structural changes throughout the economy,43 including the decline of blue-collar manufacturing jobs and the emergence of part-time and contingent work arrangements.44

Survey-based data suggest that volatility has been on the rise for most families, and I argue that this warrants concern for three reasons related to imperfections in the economy and social welfare policy:

  • The poorest families face the highest volatility
  • Low-wage workers and their families have limited credit market access and savings
  • Low-income workers with children face a weakened cash-based safety net

This essay examines these three issues and then offers several different policy solutions to the problems.

The poorest families face
the highest volatility

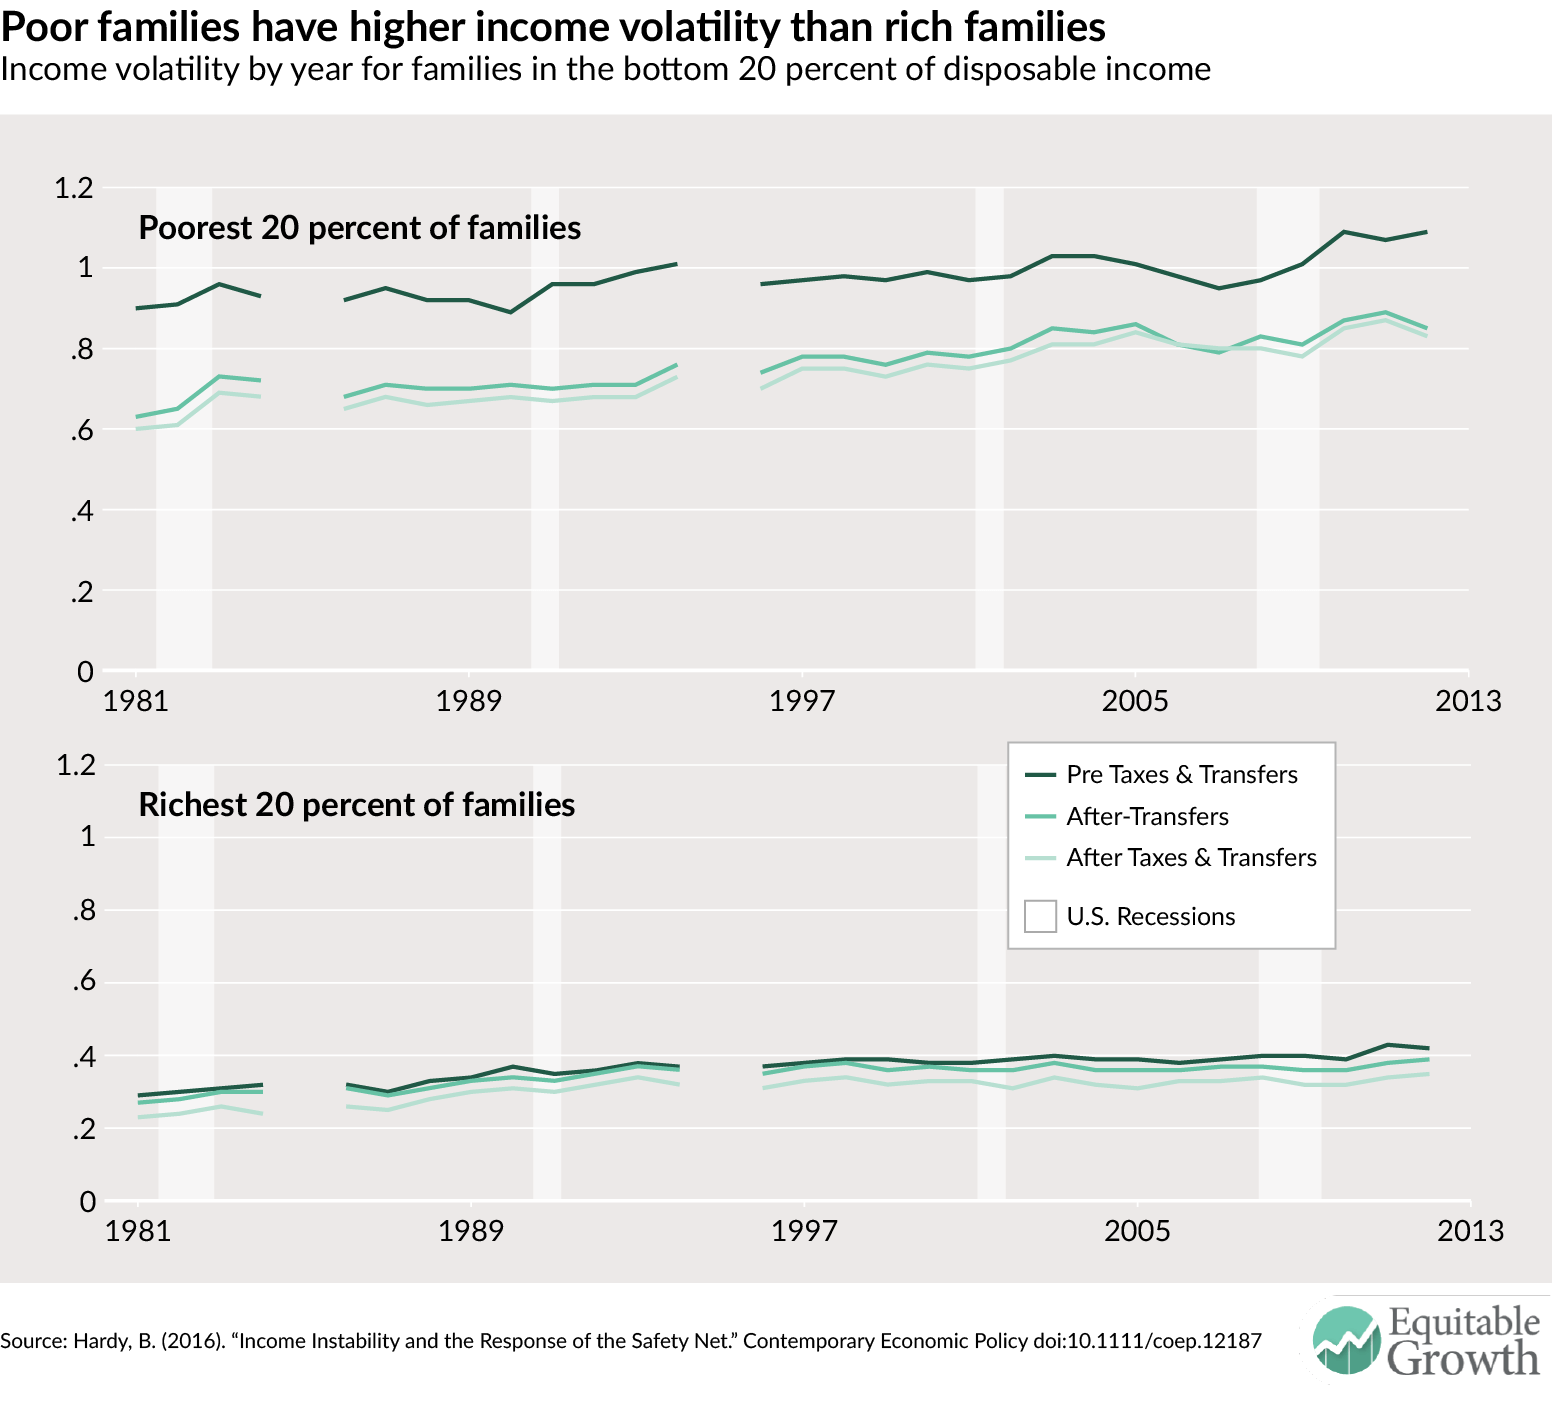
Over the past 30 years, income volatility45 is highest among the nation’s poorest families. Tabulations in Figure 1 using the U.S. Census Bureau’s 1980-2013 Current Population Survey show that income volatility is highest for low-income families—those in the bottom 20 percent of the income distribution. Higher income households, in the top 20 percent of the income distribution, in turn have the lowest levels of volatility. Thus, poor families are effectively stuck with the worst possible financial portfolio—one with a low mean and high variability. While transfer policies could perform better, they do benefit low-income families by reducing income volatility, whereas higher income families are buffered from income volatility by the tax system. (See Figure 1.)

Figure 1

Low-wage workers and their families have
limited credit market access and savings

Delivering equitable growth

Previous article: The tipped minimum wage, Sylvia A. Allegretto
Next article: Early childhood development, Ariel Kalil

Many low-wage workers and their families lack access to savings and also face imperfect capital markets and limited access to loanable funds.46 Such families may be denied loans or credit cards that allow for consumption smoothing against negative income shocks—perhaps the first solution many households pursue when faced with an unanticipated expense or income shortfall. Whether due to displacement from employment altogether or unpredictable hours, credit and loan denials can lead to far costlier alternatives such as payday lenders. Such financial streams provide financial assistance for low-income families facing liquidity constraints, but they do so at interest rates that can exceed 100 percent and cause longer-term damage to borrowers.47

This stands in contrast to the predictions derived from standard economic models which perhaps better characterize the circumstances of higher income families in a position to save more and then draw upon those same savings in the event of an unanticipated negative income shock. Similarly, higher income families possess greater access to credit markets that can serve the same purpose in response to temporarily low income.

Low-income workers with children
face a weakened cash-based safety net

Low-income workers with children face higher income volatility on average, and are less likely to have affordable access to credit markets. These families are increasingly underserved by the nation’s welfare program—Temporary Assistance for Needy Families, or TANF. This program could be altered to be more responsive for low-income workers with volatile income. Returning to Figure 1, the after-transfer reduction of income volatility from safety net programs is somewhat diminished in the post-1996 years, coincident with the new welfare reform law enacted at the time. This appears to be the case as well for female-headed families, and black families.48

This is consistent with the dramatic fall in TANF caseloads since the middle 1990s. The program today provides less in cash assistance per case than in the 1980s and 1990s, and appeared to be unresponsive during the Great Recession of 2007-2009.49 The welfare reform law that created TANF occurred amid a large economic expansion, and the program should be adjusted to reflect new realities.

Flexible policy solutions to address
income volatility and job displacement

Income volatility is driven by a combination of aggregate macroeconomic shifts alongside individual-level events such as job losses and gains. Especially for low-income and less-educated workers, this volatility is indicative of a riskier labor market. With these conditions in mind, the first set of solutions presented below are the most ambitious and call for reforms to TANF and the Supplemental Nutrition Assistance Program, or SNAP. The reforms would enhance job training in sectors of high local-labor demand, providing both financial and employment support, suspend time limits on TANF assistance, create minimum state requirements for the provision of TANF cash assistance, and increase SNAP generosity.

The remaining solutions presented below would provide families with greater liquidity to buffer against economic risk and uncertainty through an expanded Unemployment Insurance system. These reforms also would reconsider program recertification periods and re-introduce advance Earned Income Tax Credits (as an elective option for tax filers. Below, I summarize each of these policy solutions.

Ambitious policy solutions

Broader education and training as work-related activities within the Temporary Assistance for Needy Families program

As a share of gross domestic product, the United States lags several other developed countries’ investments in job training.50 I recommend expanding allowable work-related activities to include education and job training with cash assistance during the training period, up to 3 years.51

Following the spirit of recent reform proposals by Georgetown University public policy professor Harry J. Holzer related to community colleges,52 such training programs would include community college career training, and would be coordinated with Workforce Innovation and Opportunity Act providers and, as a result, be deemed by WIOA providers as subject-training areas of high local-labor demand to ensure trainees have strong employment prospects.53 States would be encouraged to include non-custodial parents in such training programs, and job-seekers within TANF would be eligible for public-sector employment and infrastructure jobs as they become available.54 Due to years of under-investment, there are labor shortages and opportunities to train workers in local sectors with high demand, including healthcare as well as elements of the nation’s aging transportation, water, and electricity infrastructure-related trades.

Conditional TANF time limit suspensions

Income volatility is a reflection of an increasingly competitive, dynamic, and at times unpredictable employment situation in the United States, particularly among low-income and less-educated workers. The Temporary Assistance for Needy Families program can help buffer against this risk by suspending time limits under qualifying circumstances while maintaining work requirements. Approved education and training would be permitted to occur full time and without work/job search, and would not count against the 5-year federal time limit—stopping the clock. Adults who satisfactorily complete TANF- and WIOA-approved education and training and/or engage in continuous job search efforts would receive assistance, even if they breach the time limit.

Next, states would be required to allow qualifying recipients to remain on welfare for the entire 5-year federal time limit—the current policy sets five years effectively as a maximum with a state option to provide extended benefits, but this would now be a minimum standard. Finally, following the recommendations of Marianne Bitler at the University of California-Davis and Hilary Hoynes at the University of California-Berkeley,55 time limits would be suspended during periods of high local unemployment or joblessness, much like the allowable suspension for high local unemployment in the Supplemental Nutrition Assistance Program for able-bodied adults.

Importantly, work requirements would remain in place, and TANF participants would still be subject to sanctions and removal via administrative rules and/or rules violations. This modified version of TANF—with its work requirements and rules—retains a design promoting temporary participation relative to the predecessor policy, whereas time limits in their current form in some states potentially undermine the capacity of the program to respond to changing economic circumstances.

Increase TANF cash spending and responsiveness

Welfare reform had unintended consequences, one of which was the dramatic decline in cash benefits. While there is fairly broad consensus that the program rightly emphasizes employment, many states have done so at the expense of maintaining a cash safety net for vulnerable families with children. In some instances, states are merely responding to financial incentives from the block-grant design of TANF to plug a variety of budgetary holes where available, and spending has moved from cash assistance to non-assistance in the post-welfare reform era.56

Following the recommendations of Bitler and Hoynes, I recommend that states be required to spend at least 25 percent of their TANF funds on cash assistance.57 Increasing cash assistance will help to ensure that the nation’s most vulnerable families are better protected against negative income shocks.

Food stamp reforms, work requirements, and time costs

Workers with low, volatile income are increasingly reliant on programs such as SNAP and the Earned Income Tax Credit. Recent evidence suggests that caseload declines throughout 2016 are being driven in part by states that are implementing the 3-month SNAP time limit for so-called ABAWDs—able bodied adults without dependents.58 I and my co-authors in a 2015 working paper show that SNAP participation is increasingly predicted by structural economic variables such low wages and the decline of full-time employment.59 To account for this, the work requirement for ABAWDs could be lowered to 10 hours per week, from 20 hours. These low-wage workers are also more likely to face long, costly commutes that preclude the most time consuming, cost efficient forms of food preparation. With this in mind, I follow the recommendations of University of Kentucky economist James P. Ziliak for SNAP benefits to be increased to account for higher food preparation costs and transportation costs.60

Buffer policy solutions

Optional year-round Earned Income Tax Credit

The Earned Income Tax Credit is the largest cash transfer for the working poor. While the EITC program has well-documented employment and anti-poverty benefits, it is not constructed to address income volatility in its current form. First, the refund occurs as a lump sum at tax time. While this benefits families as a form of precautionary savings, those that face weekly or monthly income shortfalls do not benefit from support that is backloaded until tax season.

Re-introducing an optional Advance EITC, whereby filers could elect to have the EITC distributed paycheck-to-paycheck over the entire year, would provide families with several thousand dollars of immediate income support.61 Hybridized versions similar to the Advance EITC would allow a portion of the full EITC to be made available throughout the year.62 Although participation in the Advance EITC program was low prior to being discontinued in 2011, employers and human resources professionals could more aggressively promote it as a financial tool.

Expanded Unemployment Insurance coverage for part-time and less experienced workers

The Earned Income Tax Credit is of little or no use for low-income individuals who are jobless—by design EITC receipt is predicated on labor market earnings.63 At the same time, a growing share of workers are part-time and many have work-history gaps leaving them uncovered by the current Unemployment Insurance system.

Rachel West and her co-authors at the Center for American Progress offer a range of suggested reforms to the Unemployment Insurance system that would provide financial incentives for workers who find new employment in a lower paying job—from covering part-time workers to covering workers with less than five quarters of work history.64 These workers, varying state-to-state, generally lack protection via the unemployment insurance system. Many hold more than one part-time job, and do so in the absence of access to stable, full-time employment. Such reforms can provide an important buffer in the event of earnings loss due to unemployment, and would reflect the modern growth in part-time, contingent work arrangements. In the absence of substantial Unemployment Insurance reform, the aforementioned TANF solutions loom especially large—many individuals are currently underserved by both programs.

Longer and clearer program re-certification

In some states, low-income families participating in SNAP, TANF, Medicaid, and low-income housing assistance are required to provide eligibility verification, by program, throughout the year. As a consequence, many such households flow in and out of eligibility for these programs, raising the possibility that families lose out on benefits when they find themselves to be temporarily in need—or when complexity in the renewal process causes qualifying families to cycle off the program. Currently the typical program requires re-certification at a rate of every six months to one year. I recommend extending recertification periods to once per year while simplifying and aligning recertification across safety net programs.

Conclusion

Income volatility is highest among lower income and less-educated Americans. While the safety net provides some buffer against volatility, changes can be made to better address the reality of low and volatile income. Some firms see this need, and are introducing flexible pay plans that allow workers to withdraw their earned income on a daily basis to meet immediate consumption needs that arise between pay periods.65 Still, such private initiatives are working at the margins of a larger challenge—many workers find themselves unemployed or under-employed in sectors of the economy offering low, unpredictable earnings.

Moreover, many families lack the resources to buffer against negative and unanticipated economic shocks. To address this, the safety net can provide greater cash assistance via TANF and SNAP, including financial assistance to support families while they participate in approved job training as well as during periods of high unemployment. Such assistance would operate in part through a conditional suspension of time limits in TANF. In addition, part-time and less-experienced workers should have greater access to the unemployment insurance system, and the working poor and near poor could benefit from an optional Advance EITC that spreads the credit over the year.

Taken together, the policy recommendations put forth in this essay aim to address income volatility among low-income workers by providing greater liquidity and insurance against negative shocks while providing a wider range of job training opportunities to move workers into higher demand, stable employment opportunities. These policies retain the values of work that are embedded in the current set of programs while providing a pathway for workers to respond to economic risks that characterize today’s dynamic, globally competitive economy.

Geography of economic inequality

AP Images

About the author: Kendra Bischoff is an assistant professor of sociology at Cornell University.

Why does it matter where you live? Or where a child grows up? Neighborhoods are a primary non-familial context by which lives are shaped—residential context plays a significant role in access to education and other public services, opportunities for social interactions, labor market prospects, the frequency and nature of encounters with the police, and the freedom enabled by one’s real or perceived physical safety.

The geography of economic inequality refers to the spatial sorting of individuals by income, and the correlated patterning of economic resources and opportunities. The ability to pay has always determined the latitude of one’s residential choices as well as one’s capacity to afford certain neighborhoods. Research shows, however, that residential sorting by income has significantly increased over the past 45 years.66 This sorting has resulted in more Americans living in communities that represent the poles of the income distribution rather than the middle. In 1970, two-thirds of families in large metropolitan areas lived in middle-income neighborhoods. By 2012, just 40 percent of families lived in such neighborhoods.

Similarly, the percentage of families living in affluent or poor neighborhoods more than doubled from 15 percent to 34 percent over that same time period.67 This pattern is particularly problematic for lower income individuals. The most recent American Community Survey data show that approximately 12 percent of all poor individuals, and nearly a quarter of poor individuals in urban areas, live in “distressed” neighborhoods, defined as census tracts with poverty rates greater than 40 percent. This means that more than five million Americans face the double disadvantage of individual and contextual poverty.68

What are the causes and consequences
of spatial economic inequality?

The spatial sorting of economic resources results from many regional factors, including income inequality, suburbanization patterns, the age and quality of housing stock, school and municipal boundaries, zoning and land-use regulation, and current and historical housing policies.69 Income segregation is more pronounced among families with children than it is among the general population, and most of the increase in income segregation that has occurred since 1990 can be accounted for by the residential choices of parents.70 This means that children, in particular, experience stratified residential contexts, and that parents are increasingly choosing to live with others similar to themselves.71

It is common sense that the lived experiences of people in neighborhoods characterized by high poverty rates, low employment rates, and routine violence are dramatically different than those of people in wealthy, protected neighborhoods. The concentration of social, financial, and environmental resources and hazards form the context in which children develop and adults live, which not only affects day-to-day experience but also is thought to affect educational achievement and attainment, adult earnings, mental and physical health, and attitudes toward society and the government.

In addition to the direct effects of neighborhood conditions, highly segregated neighborhoods make it less likely that advantages afforded by those with more resources will be shared, or will spill over, to those who are less fortunate. Economically heterogeneous schools, for example, ensure that the time and money that middle- and upper-class families have to invest in their children’s schools, such as through the parent-teacher association, fund-raising, event planning, and curricular decisions, will also benefit children with fewer resources who share that educational environment.

Delivering equitable growth

Previous article: Home mortgages, Atif Mian and Amir Sufi
Next article: Neighborhood segregation, Patrick Sharkey

There is great interest among social scientists and policymakers in understanding how residential context matters, especially for the trajectory of children. Understanding the link between neighborhoods and individual or distributional outcomes is challenging—people are not randomly assigned to residential location, and the degree of segregation in a city or metropolitan area is likely related to characteristics of the area itself. But using high-quality research designs such as controlled and natural experiments, longitudinal analyses, and carefully crafted observational studies, there is an ever-growing and improving body of evidence on whether, how, and under what conditions neighborhoods affect individual and distributional outcomes, net of personal characteristics. In these studies, disadvantaged neighborhood contexts are defined by the concentration of poverty, but also sometimes by other indicators of neighborhood advantage or disadvantage, such as rates of unemployment, educational attainment, family structure, and welfare receipt.

Educational outcomes are probably the most-frequently studied outcome relating to neighborhood composition. In these studies, the authors seek to understand how neighborhood poverty affects the lives of individuals (as opposed to trying to understand the effect of the distribution of income across neighborhoods). Evidence suggests that exposure to a disadvantaged neighborhood context negatively affects educational outcomes such as high school graduation rates and test scores, and reduces children’s verbal ability by as much as one year of learning.72 Long-term residence in the most disadvantaged neighborhoods, as compared to the most advantaged ones, severely reduces the odds of graduating from high school, and these conditions have a larger depressive effect on educational attainment for African American children than they do for other children.73 The effects of neighborhood disadvantage on high school graduation rates appear to be especially acute during adolescence, and are most harmful for those children who face the double disadvantage of family and neighborhood poverty.74 A number of other studies have shown that episodes of neighborhood violence reduce performance on academic tests and diminish the attention span and impulse control of children.75

Experimental evidence from housing programs on the effect of neighborhood composition has been more mixed. The well-known Moving to Opportunity study, for example, offered a random sample of participants a voucher to induce them to move to more advantaged neighborhoods. Comparisons between those who received the voucher and those who did not showed few long-term differences, which led people to conclude that neighborhoods, in and of themselves, had limited effects on individuals.76

Yet recently completed, longer-term evidence from the Moving to Opportunity data show that children who moved to low-poverty neighborhoods before the age of 13 have reaped significant benefits. They were more likely to attend college, had significantly higher earnings by their mid-20s, and lived in less disadvantaged neighborhoods as adults—all compared to those who did not receive the voucher in the experimental project. Results for children who moved after the age of 13 were nil or even negative, suggesting that stability and consistent social environments may be more important in late adolescence.77

Finally, a study of a housing program in Montgomery County, MD found significantly higher academic achievement among low-income students who lived in low-poverty school zones, compared to similar peers in high-poverty school zones.78 Taken together, there is a fairly strong body of evidence supporting the fact that childhood neighborhood context matters for contemporaneous and long-term outcomes, but that the effects differ by family income, race/ethnicity, and age.

There is less evidence on the consequences of economic segregation itself, a characteristic not of individual neighborhoods but of the arrangement of neighborhoods in a city. The existing research has demonstrated that metropolitan- and state-level income segregation increases inequality of educational attainment and infant health outcomes and shows that income segregation in U.S. metropolitan areas weakens economic mobility, establishing an important link between the geography of economic inequality and intergenerational mobility.79

Concluding thoughts and
policy directions

The spatial dimension of economic inequality is a persistent feature of U.S. cities and communities. The magnitude of residential sorting continues to increase, closely tracking the steady rise in income inequality. Over one third of all families in large metropolitan areas now live in relatively poor, or relatively affluent, neighborhoods—neighborhoods that affect our understanding of America as a country of the middle class. Three additional points bear mention in this short brief.

First, neighborhood disadvantage is durable. Segregated neighborhoods are difficult to escape, especially for African Americans. Nearly three quarters of African American children who grow up in America’s poorest neighborhoods live in similar neighborhoods as adults.80 A lack of sufficient resources in the poorest neighborhoods, such as high-quality schools, contributes to the intergenerational transmission of individual poverty and neighborhood disadvantage.81

Second, the concentration of affluence deserves more attention. The geographic isolation of the affluent is connected to the geographic isolation of the poor. Recent American Community Survey data show that, nationally, the school district at the 10th percentile of the income distribution has a median household income of $34,000 while the 90th percentile district has a median income of $74,000. The median household incomes in the very wealthiest districts exceed $200,000, and fall below $20,000 in the very poorest.82 These income gaps are not the whole story, but the gaps are representative of bundles of advantages and disadvantages comprised of parental education levels and employment status, teacher quality, school facilities, and safety. This matters, in part, because children from poor and affluent neighborhoods are competing for the same seats at elite colleges and universities, and for the opportunity to be leaders in politics, business, academic research, and the arts. The presence of highly polarized neighborhoods ensures that children spend important developmental years in severely unequal environments.

Third, the vast majority of research on the causes and consequences of neighborhood poverty and economic segregation relies exclusively on income as a metric for financial resources. Wealth data are harder to obtain, but it is even more unequally distributed than income and it can be a major factor in residential choice. In 2010, 44 percent of all income in the United States went to the highest-earning 10 percent of the workforce, whereas the top 10 percent of wealth holders controlled 74 percent of all U.S. wealth. Similarly, the income-based Gini coefficient (a widely used measure of inequality in which 1 signifies absolute inequality and zero absolute equality) was 0.55 but the wealth-based figure was 0.87.83 Wealth segregation may be relatively severe due to the extreme level of wealth inequality in the United States, but less is known about the degree to which families are spatially separated by wealth.

How can public policy address the geography of economic inequality? I offer two brief comments. First, economic segregation and the concentration of poverty are not narrowly local issues. They are regional issues that need regional solutions. This may require collaboration across multiple municipalities, or the formation of regional governance structures that have the authority and mandate to address the division of resources that occurs through municipal fragmentation. Policy tack and the appropriate level of government intervention depend on the boundaries of the geographic inequality—across neighborhoods within a municipality, across schools within a school district, across municipalities and school districts within a metropolitan area, or even between cities or counties within a state or nationwide.

Second, there are remedies for the problem itself, and there are ways to mitigate its negative effects. Policies that encourage mixed-income communities or reduce income inequality refer to the former, while school integration programs and monetary redistribution refer to the latter. These types of policies are not mutually exclusive—society can both pursue bold long-term plans to equalize children’s neighborhood contexts while also embracing short-term programs to mitigate the effects of segregation and concentrated poverty.

International trade and U.S. worker welfare: understanding the costs and benefits

FILE - In this June 12, 2013, file photo, workers assemble Volkswagen Passat sedans at the German automaker's plant in Chattanooga, Tenn. AP Photo/ Erik Schelzig, file)

AP Images

About the author: David Autor is the Ford professor of economics at the Massachusetts Institute of Technology

Economists have long recognized that free trade has the potential to raise living standards in all trading countries. The logic is sound and simple. A given country, say the United States, will want to buy goods from another country, say China, only if the United States receives goods from China that are worth more to it than the goods it is trading in return. Similarly, China will want to trade with the United States only if the goods it receives in return are more valuable to it than the goods it is trading. That is, countries trade if they both view themselves as getting the better end of the bargain. How can it be that both get the better end of the deal? When the United States sells China civilian aircraft and buys Chinese-made apparel and consumer electronics, the United States and China each end up with a bundle of goods (aircraft, apparel, consumer electronics) that it prefers to the goods it had originally. In this sense, trade among nations is akin to a vast open-air market: each country displays its wares and makes mutually beneficial swaps with other countries.

Countries do not simply sell the surplus stuff that they have on hand, however; they make goods specifically for trading. And this adds to the gains from trade. Knowing that there is a vast world market, countries focus their resources on making the goods that they are best at making. They then swap these goods for the items that other countries are best at making. It is no accident, of course, that the United States is exporting aircraft and importing footwear. As a technologically advanced, high-skill nation, the United States can make aircraft better, cheaper, and faster than other countries. In economic lingo, it has a comparative advantage in producing aircraft. China, as a rapidly developing country with an abundance of capable but not (yet) highly educated workers, has a comparative advantage in making labor-intensive goods such as apparel, footwear, and assembled electronics. Thus, both gain from trade.

This logic offers a strong prima facie case for why policy makers should foster free trade. Lifting quotas and tariffs and removing artificial trade barriers abets national growth by lowering consumer and producer prices and permits countries to specialize in doing what they do best. Trade raises gross domestic product whether countries run trade deficits or surpluses; whether countries specialize in high-tech or low-tech goods; and whether trade is among rich countries (the United States and Germany), among poor countries (Zimbabwe and Mozambique), or among rich and poor countries (the United States and Bangladesh). It is not an overstatement to say that trade among consenting nations raises GDP in all of them.

Winners and losers

What applies to the welfare of a country in aggregate, however, does not necessarily apply to all of the citizens within a country. Consider again the case of aircraft and apparel. As the United States opened to trade with China, it began producing more planes and fewer articles of clothing than it otherwise would have done. Employment rose in the domestic aircraft industry, accordingly, and fell in the domestic apparel industry (again, relative to what would have occurred). If workers in apparel and aircraft had identical skillsets and, moreover, lived and worked in the same towns, then displaced apparel workers might quickly be rehired in aircraft manufacturing, perhaps at better wages. All good!

In reality, there are two reasons why this all-good scenario will not happen in practice. First, workers cannot change jobs at no cost. Decades of economic research demonstrate that workers who are involuntarily displaced from career jobs—particularly manufacturing jobs—suffer substantial earnings losses. These losses average one-and-a-half to nearly three years of annual earnings over the following 20 years, with the deepest scars felt by workers who are displaced during recessions.

Delivering equitable growth

Previous article: U.S. labor market mobility, Abigail Wozniak
Next article: Supply chains, Susan Helper

Even more fundamentally, trade integration reshapes labor markets in a way that is likely to be permanently beneficial for some skill groups and permanently harmful to others. The reason is that when the United States integrates with large, labor-intensive countries such as China, the aircraft-apparel parable plays out on a vast scale. The United States gains employment in numerous skill-intensive sectors, such as aircraft, pharmaceuticals, passenger vehicles, integrated circuits, and high-tech metals. It simultaneously loses employment in many labor-intensive sectors, such as apparel, footwear, furniture and bedding, toys and sports equipment, and assembled electronics. The aggregate contraction in labor-intensive production depresses the employment-and-earnings opportunities of workers who compete most directly with Chinese workers, typically high-school educated workers, many of them males and minorities.

Meanwhile, the expansion of skill-intensive production raises the real earnings of highly educated workers, those who might design and build the high-tech products that the United States exports. And there’s the rub—even as trade increases the size of the national pie, it shrinks the slices received by some citizens, most especially, blue-collar, non-college workers.

This analogy also suggests its own solution. If trade makes the pie larger then isn’t it feasible in principle to restore every slice to its original size and still have some extra pie left over to share? And the answer is emphatically yes: because the pie is bigger it is possible for every person to have a bigger slice. But this will not happen without policy intervention. Absent active redistribution, trade will create both winners and losers—larger and smaller slices.

The evidence

That’s the theory. What is the evidence? For the first three or four decades of the post-war era, there was little occasion to scrutinize the benefits of trade. Most goods flowed “North to North,” that is, between nations with relatively similar average incomes, which helped to subdue distributional impacts. When U.S. inequality began to rise in the 1980s, economists vigorously renewed their study of the impacts of trade on labor markets. They found, reassuringly, that trade had not had substantial adverse distributional effects, either for low-skill workers specifically or for import-competing industries more generally. The broad sentiment that emerged at that time was that the rise of earnings inequality was primarily attributable to technological changes that complemented high-skill workers and reduced labor demand in manufacturing. The impact of international trade seemed to be modest, at best.

Just as the economics profession was reaching consensus on the consequences of trade for wages and employment, an epochal shift in patterns of world trade was gaining momentum. China was finally emerging as a great power after decades as an economic laggard, toppling established patterns of trade accordingly. China’s rise has provided a rare opportunity for studying the impact of a large trade shock on labor markets in developed economies.

The advance of China also toppled much of the received economic wisdom about the impact of trade on labor markets:

  • The consensus that trade could be strongly redistributive in theory but was relatively benign in practice has not stood up well to these new developments.
  • The belief that trade adjustment is relatively frictionless, with impacts that diffuse over large skill categories rather than being concentrated among groups of workers in trade-competing industries or locations.

After quantifying these impacts and adjustment frictions, current research finds that the short- and medium-run adjustment costs demanded by large trade shocks are sizable entries in the accounting of gains from trade.

What these findings mean in practice is that not only does trade create winners and losers but also the losses are much more concentrated than economists had previously understood. They are borne most heavily by workers originally employed in import-competing sectors, such as those footwear workers, secondarily by the surrounding local labor market in which those employers are housed, and only thirdly by the overall “skill group” to which displaced workers belong. Concretely, employment at U.S. textile plants has fallen by nearly two-thirds (from more than 700,000 to less than 250,000) over the past 20 years as fabric production and apparel manufacturing shifted overseas in search of lower labor and production costs.84 The elimination of nearly half-a-million textile jobs appears enormous, but it is actually a drop in the bucket for a U.S. labor market of 150 million workers—and hence unlikely to substantially affect earnings opportunities for blue-collar workers nationwide. But this contraction constitutes a powerful and sustained blow to the regions of the United States that formerly engaged heavily in textile production. In 2000, half of U.S. textile and apparel production was located in just eight southeastern states (Alabama, Georgia, Kentucky, Mississippi, North Carolina, South Carolina, Tennessee, and Virginia). And within those states, productions was heavily concentrated in counties where it constituted more than 15 percent of employment.85 And within those counties, the workers employed in career textile jobs were most adversely affected.

Main implications

There are seven main implications:

  1. Trade among consenting nations raises GDP in all of them. Policymakers should always be looking for ways to take advantage of the opportunities that trade offers.
  2. Because trade grows the national pie, it creates an opportunity for every citizen to acquire a modestly larger slice. No one necessarily need have a smaller slice.
  3. Absent policy intervention, trade will almost necessarily shrink some slices of the pie even as it causes the pie to grow.
  4. The benefits from trade tend to be small at the individual level but broadly shared—that is, they are diffuse. Importing Chinese apparel rather than producing it domestically, for example, lowers the costs of clothing nationwide—and perhaps lowers it most for consumers who purchase clothing inexpensively from big box retailers and fast-fashion outlets. Aggregating across all goods, these benefits amount to one or two percentage points of annual income for most households. That’s meaningful, but it’s not life changing.
  5. Conversely, the adverse impacts of trade are highly concentrated among specific worker groups and locations. These losses can be quite sizable, as the apparel example highlights. Thus, it is entirely possible for trade to grow the size of the national pie by one percent or two percent while shrinking some individual slices by 20 percent or 30 percent.
  6. Recognizing these points, policymakers should refrain from asserting that ‘everyone wins’ from trade. When rich countries primarily traded among themselves in the first few decades after World War II, trade likely had very modest distributional costs in rich countries—that is, there were many winners and few losers. That era is behind us. Over the past two decades, trade integration between the developed and developing world—most particularly between China and the West—has produced large aggregate gains in GDP in rich and poor countries alike. It also has generated concentrated economic costs for low-skill workers in wealthy countries. Those harms have not been offset either by lower consumer prices (cheaper apparel) or by the very modest set of policy tools that the United States has used to assist workers adversely affected by trade.
  7. While discussion of trade policy has entered U.S. politics with a ferocity not seen in decades, this discussion is largely reactive and backward looking. Looking forward, the great China trade shock may soon be over, if it is not already. China is moving beyond the period of catch up associated with its market transition and becoming a middle-income nation. Rapidly rising real wages (after accounting for inflation) indicate that the era of cheap labor in China is no more. China’s comparative advantage in the future will likely be less about making cheap goods and more about making high-quality products that compete with those made by middle- and high-income countries such as Japan, South Korea, Mexico, and the United States. Absent any change in U.S. trade policy, the next decade of trade integration will be far less dramatic and wrenching than the two decades that preceded it.

Policy options

There is no magic policy that can fully shield workers from the challenges of trade adjustment while simultaneously allowing the nation to realize all of the benefits that come from trade integration. When industries contract or shut down—due either to trade, technological advances, or even to shifts in consumer tastes—workers in those industries typically experience real and sustained economic losses. These losses are larger among less-educated workers, who tend to lack the skills and flexibility to quickly adapt to new circumstances, and these losses are larger when they occur during recessions because workers tend to remain involuntarily employed for extended durations.86 The following policy ideas address some of those costs.

Increasing the accessibility and flexibility of Trade Adjustment Assistance

The current U.S. Trade Adjustment Assistance program is difficult to access and places artificial strictures on workers’ reemployment options. To access TAA, a group of workers (generally employees of the same firm) must petition the U.S. Department of Labor to recognize that they have experienced a reduction in employment or wages due to foreign trade. If their petition is granted after investigation, then the workers may access services that include job training, job search and relocation allowances, income support, and assistance with healthcare premium costs. In general, these services are only available while displaced workers are undergoing training and remain out of the labor market. If a displaced worker wanted instead to take a new job at a lower wage soon after losing her original position, TAA would not provide assistance.

Providing wage insurance

Workers displaced from career jobs typically have trouble getting back into the labor market. One psychic barrier is that the jobs available to displaced workers often pay less than their previous work. Concretely, consider what occurs when an apparel factory shuts down. Because of widespread contraction of the apparel sector, displaced apparel workers are unlikely to find equally well-paid jobs nearby. But many displaced workers will be reluctant to immediately take a large pay cut, locking in a lower standard of living and, arguably, acknowledging economic defeat.

But waiting is costly. The longer workers spend unemployed, the harder they find it to get a new job. Economic research demonstrates that employers are reluctant to hire the long-term employed. And when workers are unemployed for extended periods of time, they may lose confidence and motivation. Thus, getting displaced workers back into the game is potentially valuable—even if it means taking a pay cut.

In January of 2016, the Obama administration proposed a so-called wage insurance policy that was intended to facilitate this goal.87 The president’s plan would provide workers with an insurance policy that would replace half of lost wages, up to $10,000 over two years. Displaced workers making less than $50,000 who were with their prior employer for at least three years would be able to leverage these resources to help them get back on their feet and on the way to a new career.

The simple idea of wage insurance is to ease the economic and psychic pain of transitioning to a new line of work. If a displaced worker must take a pay cut to get reemployed then the wage insurance policy would meet them half way. Once reemployed, workers may find that they are able to move quickly up the wage ladder, in which case, the wage insurance policy would not make further payments. If this doesn’t occur, however, then workers would be afforded up to two years to make other adjustments.

Of course, a policy as generous as the president’s proposed wage insurance plan must also be carefully targeted, otherwise the fiscal cost would be prohibitive. The need for careful targeting has costs—it makes the program difficult to access and may deter deserving beneficiaries. Moreover, a policy targeted only at trade adjustment does not assist workers displaced by other exogenous economic events such as firm failure or technological advances that make their skills redundant, the latter of which is surely even more important than trade for job loss over the longer run.

Extending the Earned Income Tax Credit to workers without qualifying children

The Earned Income Tax Credit is among the nation’s most significant tools for reducing poverty and encouraging people to enter the workforce. In 2014, the EITC and the refundable Child Tax Credit supported 32 million working families, many with children. Because receipt of the EITC is contingent on work, much reputable economic research confirms that the EITC increases both income and employment.

Workers without qualifying children, however, miss out on the anti‐poverty and employment effects of the EITC. In 2015, workers with three-plus dependent children could receive up to $6,242 in EITC income from the federal government. By contrast, adults without children and non-custodial parents could receive at most $503 in EITC income—which in economic parlance is bubkas. As such, the EITC provides little cash assistance or employment incentive to childless workers and non-custodial parents.

Many of the individuals who do not qualify for EITC due to childlessness or non-custodial status are low-educated males and minority males. Ironically, low-education and minority males are also disproportionately likely to be impacted by adverse shocks to manufacturing.88 Thus, unintentionally, the EITC appears targeted to not help the group that is arguably most sorely in need of such assistance.

The White House proposed in 2014 to expand the EITC to cover childless workers and non-custodial parents.89 This is an excellent idea. In addition to facilitating trade adjustment, the proposed EITC expansion would ameliorate another pressing economic problem: the declining labor force participation rate of prime-age males in the United States. Since 1990, the United States has experienced the second-largest decrease in prime-age male participation among all the developed or leading developing member nations of the Organisation for Economic Cooperation and Development. At present, the United States has the third-lowest labor force participation rate in this group. The fall in participation for prime-age men has largely been concentrated among those with a high school degree or less, and participation rates have declined more steeply for black men than for white men. Expanding the EITC may help to stem or even reverse this ill tide.90

The proposed EITC expansion would also assist workers suffering adverse employment consequences from any of multiple causes—trade exposure, technological displacement, and general declines in economic conditions—all of which are economically damaging, and most of which are outside of workers’ individual control.

While there is no magic policy that makes trade adjustment painless, the policy options above are better than the ones that the United States is currently pursuing. Moreover, the natural alternative policies of either restricting trade or refusing to acknowledge the distributional costs of free trade are the worst options of all. Restricting trade and rejecting forward-looking trade deals such as the Trans Pacific Partnership would reduce long-run U.S. prosperity and cause considerable collateral damage to U.S. allies. (It bears note that China would likely be delighted if the TPP were scrapped.) The latter idea—insisting that “everyone wins” from trade—is also counterproductive. Indeed, the Pollyannaish boosterism surrounding past trade agreements is arguably one key reason why trade deals have become increasingly unpopular.

Placing China’s growth in
historical and global context

It is fair to say that China’s rise has likely done more to alleviate global poverty and reduce world inequality than any single economic event occurring in centuries. China’s economic growth has lifted hundreds of millions of individuals out of poverty. The resulting positive impacts on the material well-being of Chinese citizens are abundantly evident. Just consider Beijing’s seven ring roads, Shanghai’s sparkling skyline, and Guangzhou’s multitude of export factories—none of which existed in 1980 and all of which are indicative of China’s success. China’s growth generated a commodity boom that spread prosperity across South America and the commodity-producing regions of South Asia and Southeast Asia. China also has emerged as Africa’s largest trading partner, providing demand for the continent’s energy and minerals. China’s newfound wealth has permitted it to make large direct investments in Africa, often in some of the poorest countries from which Western investors have historically shied.91

Politicians should not lose sight of these enormous gains in world welfare when lamenting the comparatively modest adverse impacts felt by some U.S. workers. China is right to suspect that many U.S. politicians would rather see China’s billion citizens face economic stagnation rather than allowing a comparatively small set of American manufacturing workers face new competitive challenges.

Shared responsibility mortgages

AP Images

About the authors: Atif Mian is a professor of Economics and Public Affairs at Princeton University and Director of the Julis-Rabinowitz Center for Public Policy and Finance at the Woodrow Wilson School at Princeton University. Amir Sufi is the Bruce Lindsay Professor of Economics and Public Policy at the University of Chicago’s Booth School of Business.

The mortgages that are predominantly used in U.S. housing finance, and explicitly promoted by the federal government, place an undue amount of risk on families who own their homes. Our main policy recommendation is to encourage the Federal Housing Finance Agency to declare more “equity-like” mortgages as mortgages conforming to the federal government’s securitization guidelines. This would enable these mortgages to be securitized by the federal housing finance giants Fannie Mae and Freddie Mac, which would promote their growth in the home mortgage marketplace.

The widespread use of such mortgages will protect families from unforeseen downturns in the housing market, and will reduce the painful boom-and-bust episodes that have characterized housing markets in recent years. The economic benefits are large. We believe that the Federal Housing Finance Agency must play a critical role in overseeing and enforcing the use of such equity mortgages.

Why debt mortgages are problematic

A home mortgage that currently satisfies the conforming mortgage definition is a standard debt contract, which places a great deal of risk on the homeowner. Suppose a homeowner buys a home for $100,000, using an $80,000 debt mortgage. The homeowner has $20,000 of equity in the home. If house prices drop by 20 percent then the home is worth only $80,000. But the interest payments on the mortgage and the mortgage balance remain the same. House prices fall during economic downturns, which make homeowners less able to pay the mortgage payments. Further, if the homeowner sells the home for the new price of $80,000 then the homeowner must pay the $80,000 mortgage and is left with nothing. The homeowner loses 100 percent of her equity even though house prices dropped only 20 percent.

This is the effect of debt. Debt contracts force losses on the homeowner before the lender bears any loss. This makes no economic sense. The average homeowner in the United States is far less able to bear house-price risk than the investors putting money into the financial system. The use of debt contracts means homeowners are bearing this risk when it would be far better for investors to bear that risk.

Delivering equitable growth

Previous article: Monetary policy, Alan Blinder
Next article: Geography of economic inequality, Kendra Bischoff

In our 2014 book, “House of Debt: How They (and You) Caused the Great Recession and How We Can Prevent It from Happening Again,”92 we show that the use of debt contracts in housing finance amplifies housing price booms, and makes housing price busts painful for the entire economy. Research shows that severe economic downturns are preceded by mortgage debt-financed housing booms. When house prices fall, the losses are born disproportionately by middle- and low-income homeowners. Further, foreclosures skyrocket, which depresses house prices even for those that continue to pay their mortgage. Homeowners reduce spending dramatically in response to the decline in housing wealth. The sharp drop in consumer spending sends the economy into a tailspin. This cycle explains the Great Depression in the 1930s and the Great Recession of 2007-2009 in the United States as well as the severe economic downturns seen in Ireland and Spain during the previous decade.

The financial system must overcome its addiction to mortgage debt. By uniquely allowing straight debt mortgages to be securitized by Fannie Mae and Freddie Mac, the federal government encourages the exact type of mortgages that we know are bad for homeowners and the overall economy. The government should instead push for more equity-based mortgages, which would provide relief to the homeowners that most need it in case of a downturn in the housing market.

What is an “equity-like” mortgage
and why would it help?

How does a more “equity-like” mortgage work? The mortgage contract we promote in our book is the Shared Responsibility Mortgage. In this mortgage, the principal balance of the mortgage and the interest payments are linked to a local house price index that measures the average value of houses in the zip code of the purchased home. If house prices in the neighborhood fall, the principal balance and interest payments automatically adjust downward. This provides relief to the homeowner exactly when it is most needed: when difficult economic circumstances arise in the neighborhood.

In our book, we use the example of a mortgage in which the principal balance and interest payments adjust downward by the same percentage point as the fall in house prices. So if a homeowner has a monthly payment of $1,000 and house prices in the zip code fall by 20 percent then the monthly payment automatically adjusts downward to $800. If house prices rise once again, the monthly payment will increase up to $1,000, but the payment can never be higher than the original amount of $1,000 paid when the home was purchased, no matter how high house prices go in the neighborhood.

In return for the protection against house price declines, the lender who provides the mortgage is given an extra payment in case house prices rise and the homeowner sells the home. So, for example, if the home increases in value from $100,000 to $120,000 and the owner sells the home, then a part of the capital gain of $20,000 would be paid to the lender. We calculate that only 5 percent to 10 percent of the capital gain would need to be paid to ensure the lender is properly compensated for the downside protection. In this example, this implies a payment of $1,000 to $2,000 out of the $20,000 capital gain.

An interesting related idea is the ratchet mortgage by housing finance specialists Bert Ely and Andrew Kalotay. It is essentially a one-way adjustable rate mortgage where the interest rate paid by the borrower is tied to a long-term government bond rate such as the 10-year Treasury bond. The key characteristic is that interest rates only adjust downward: if the reset formula yields a higher interest rate than the current rate paid by the borrower then the current rate prevails. Interest rates tend to fall in recessions, which would provide automatic savings to homeowners exactly when they need it. Further, homeowners would not bear the risk that interest rates rise in the future. Of course, the initial interest rate on a ratchet mortgage would be higher than a fixed-rate mortgage, but the protection offered would be advantageous to the homeowner and to the broader economy.

Both of these types of mortgages more equitably share house price risk than traditional mortgages. This has large benefits for the economy. When house prices fall, middle- and low-income homeowners using an equity-like mortgage would not bear the lion’s share of the burden. Their interest payment would automatically decline, and their housing wealth would be preserved. As a result, they would not cut spending so dramatically. Equity-like mortgages provide exactly the type of automatic stabilizer the economy needs to avoid severe recessions.

Further, tying mortgages explicitly to house prices would lessen the likelihood of unsustainable bubbles emerging in the first place. Research shows that debt fuels bubbles by engendering false security among lenders. Lenders feel they are immune to the bubble when providing debt financing because homeowners bear almost all of the risk. Explicitly tying house prices to mortgage payments would force lenders to think twice about lending into an unsustainable housing boom.

Are “equity-like mortgages” feasible
in today’s mortgage market?

Yes.

PartnerOwn, a firm based in Chicago, is commercializing a version of the Shared Responsibility Mortgage. Their work has given context to the theoretical benefits for mortgage borrowers, lenders, and investors while also highlighting some of the remaining obstacles.

PartnerOwn’s surveys show that mortgage borrowers prefer the Shared Responsibility Mortgage relative to current mortgage product offerings. In a sample of 40 borrowers at Chicago Housing and Urban Development Homebuyer Workshops, 80 percent preferred it to a 30-year fixed rate mortgage after watching a 15-minute in-person presentation. Sixty percent of online respondents similarly preferred the Shared Responsibility Mortgage after watching a 3 minute-video about the product. Perhaps most encouraging, 80 percent of respondents were able to correctly articulate the payoff structures in multiple scenarios of the product. Millennials, a demographic that is often priced out of more “price stable” neighborhoods, have been among the most interested groups.

Regional banks have been receptive to the Shared Responsibility Mortgage for ensuring the stability of the local market that they serve, and PartnerOwn has begun work on a fund that sources capital from multiple regional banks to provide liquidity for the new home mortgage product. The Federal Reserve Bank of Chicago recently highlighted it in its publication ProfitWise as a tool for Community Reinvestment Act: Shared Responsibility Mortgages, it said, “would also provide benefits to the bank or institution that holds the mortgage, such as helping expand lending to new potential borrowers who are concerned about house price volatility, and potentially helping lenders earn CRA credit for serving LMI [low-to-moderate income] communities.”

Institutional investors are encouraged by the new mortgage’s incorporation of frictionless modifications for mortgage borrowers and the reduction in defaults at a portfolio level. The Great Recession revealed that various government programs, such as the Home Affordable Modification Program and Home Affordable Refinance Program, showed the strains that take place when developing modification rules and applying these on behalf of investors in mortgage-backed securities amid an economic downturn. The Shared Responsibility Mortgage provides modifications when they are needed in a local economy to help keep mortgages performing, and the resultant effects from fewer defaults and streamlined modifications ultimately trickle up to institutional investors.

PartnerOwn’s biggest task is now in ensuring compliance with the various regulatory agencies for residential mortgages, consumer finance, and banking to provide mortgage lenders with regulatory assurance should they become Shared Responsibility Mortgage lenders.

Why does the federal government
need to be involved?

The federal government has been incredibly influential in the U.S. mortgage market since the Great Depression by serving as a provider of liquidity to mortgage lenders and by lowering the cost of funding mortgages. This consideration is even truer today since 94 percent of residential mortgage-backed securities are issued by Fannie Mae and Freddie Mac.93

The two housing giants also have historically defined what mortgages are available to market participants. In the 1970s, their standardized mortgage contracts, such as the 30-year fixed rate mortgage, became available for resale to institutional investors. More recently, the Consumer Financial Protection Bureau has defined a “qualified mortgage” to provide clarity to mortgage-market participants about the rules governing various mortgage products to prevent the more outrageous terms and practices that contributed to the debt buildup that led to the Great Recession.

The government should be involved in promoting the use of mortgage contracts that have better economic properties. We give three specific reasons for government involvement below.

First, by securitizing debt mortgages and not securitizing Shared Responsibility Mortgages, the federal government through Fannie Mae and Freddie Mac provide a huge cost advantage to debt mortgages that meet the definition of a conforming mortgage. The government currently tilts the game toward the mortgages that have bad economic properties. The Federal Housing Finance Authority should even the playing field by declaring the Shared Responsibility Mortgage a conforming mortgage.

Second, the economic benefits of Shared Responsibility Mortgages may not be reflected in private market pricing because of externalities. More specifically, research shows that debt contracts have large negative externalities on the economy that are not properly priced among private parties. The most obvious example is foreclosures. Foreclosures are the direct result of mortgage debt contracts that force the homeowner to bear the losses when house prices decline; a foreclosure has negative effects on house prices throughout the neighborhood. The entire neighborhood is made better off if the lender and any given homeowner agree on an Shared Responsibility Mortgage instead of a debt mortgage. Because such externalities are present, the government should play an important role in promoting this new home mortgage product.

Third, the Federal Housing Finance Authority, and potentially the Consumer Financial Protection Bureau, should play an important role in setting the terms for Shared Responsibility Mortgage contracts, which are more complex than the 30-year fixed rate mortgage contract—and more complexity often comes with manipulation and misleading practices by financial intermediaries. We show in our book that a Shared Responsibility Mortgage with an equivalent interest rate as a 30-year fixed rate mortgage should only require the homeowner to pay the lender 5 percent to 10 percent of the capital gain at sale. One worry would be that a financial intermediary would take advantage of the complexity of the new mortgage product by offering contracts that take much more of the capital gain than is fair. We believe the Shared Responsibility Mortgage has large economic benefits, but the complexity comes with the need of oversight.

A more stable housing market

Housing is crucial to sustaining a strong middle class, but the current mortgage finance system encourages volatility and excessive risk-bearing by homeowners. More equity-like mortgages such as the Shared Responsibility Mortgage would stabilize the housing market and protect homeowners against economic downturns. The benefits would accrue to the entire economy.

Two and a half decades: Still waiting for change

AP Images

About the author: Sylvia A. Allegretto, Ph.D. is an economist and Co-chair of the Center on Wage and Employment Dynamics at the Institute for Research on Labor and Employment, University of California-Berkeley.

Over the past few years, minimum wage policy has been propelled to the forefront of the economic debate boosted by “Occupy Wall Street,” the “Fight for $15,” and other pro-worker campaigns. One result has been the adoption of numerous minimum wage policies at state and local levels that increased wages for many of our lowest-paid workers. Much action on the minimum wage front is owed to the discussion on inequality as it relates to decades of stagnating or falling wages at the bottom end of the pay scale coupled with the long erosion of the federal minimum wage. Often overlooked in wage policy is the recognition that the federal subminimum wage received by tipped workers has been frozen at $2.13 since 1991.94 There is often confusion and misinformation around the sub-wage floor, the workers who earn it, and the two-tiered system that makes it possible. Future debate and policy consideration on wage floors must include the often forgotten subminimum wage workforce.

Delivering equitable growth

Next article: Income volatility, Bradley Hardy

This essay shows that tipped workers are overwhelming female who typically earn low wages. They also have few workplace benefits, live disproportionately in poverty, and experience high rates of sexual harassment—especially in states that set their sub-wage floor at $2.13. These workers also face workplace challenges unique to tipped workers such as unreliable shifts that result in extreme fluctuations in pay. Importantly, the full-service restaurant industry that employs most of the tipped workforce is rapidly growing and is becoming a larger share of the overall workforce—this is the case even in the states that do not allow for a subminimum wage.95

A bit of history will lend some perspective. In 1938 the Fair Labor Standards Act, a New Deal initiative, was signed into law. The new law banned oppressive child labor, set the maximum workweek at 44 hours, and established the first minimum wage at 25¢ an hour. But the law applied to few industries whose combined employment represented about one-fifth of the labor force. The 1966 amendment extended protections to hotel, restaurant, and other service workers who had previously been excluded. At the same time it punctured a permanent hole in the law’s umbrella via the introduction of a “subminimum wage” to be paid to workers who “customarily and regularly receive tips” —otherwise, most of the newly covered workforce.96

The two-tiered system is dependent upon the tip-credit provision—in other words, the amount of the wage bill an employer can pass on to customers in the form of tips. Thus tips are, at least in part, a wage subsidy provided by customers to employers and the subsidy has grown considerably over time. Both wage floors, after adjusting for inflation, are trending downward over time—the difference between them is the allowable federal tip credit. Customers now pay the lion’s share (71 percent) of a tipped worker’s wage bill—while employers pay a base wage that is just 29 percent of the regular minimum wage. (See Figure 1.)

Figure 1

There is a sort of quasi-natural experiment being conducted across the country as there are three general state policy scenarios regarding tipped wages. Additionally, each state’s regular minimum wage is set at the federal policy of $7.25 or above.97 There are 18 states that follow the federal policy of $2.13 (that is, they take advantage of the full tip credit provision) and most also have a $7.25 minimum wage. On the other end of the spectrum there are seven states that do not allow for a subminimum wage (states without a tip credit provision)—all seven also have regular minimums above the $7.25 federal level including $10.00, $9.75, and $9.50 in California, Oregon and Minnesota, respectively. In between there are 25 states and the District of Columbia that pay tipped wages above $2.13 but below their state regular minimums, which take advantage of a large range of partial tip credit provisions. (See Figure 2.)

Figure 2

The majority of these states also have minimums above the federal rate. The largest tip credit is $8.73 in Washington DC, where the minimum wage is $11.50 and the tipped wage is $2.77, meaning customers pay 76 percent of the wage bill for tipped staff.

Subminimum wage workers

A common misconception is that wait staff and other tipped workers make “a lot” of money; thus there is no need for concern. Sure, there are some workers in fine dining restaurants where large bills may result in generous tips and decent annual earnings, but this is the exception. Tipped workers are most commonly working at modest establishments—think of those working at a Denny’s in Alabama, a diner in rural Pennsylvania, or at a 24-hour truck stop in Texas.

Here I draw from an issue brief on tipped workers and the tip credit as well as a published peer-reviewed academic paper on the wage-and-employment effects of subminimum wages in the United States to bring some salient facts to light.98 Tipped workers, like minimum wage workers, are often thought of as young workers just getting a foot in the door of employment. The reality is that 63 percent of tipped workers are at least 25 years old, the vast majority (67 percent) are women, and among female workers, one in three have children. The typical hourly wage of tipped workers in the United States is $10.55 including tips. For wait staff and bartenders, who represent the largest share of the tipped workforce, it is $10.44. Importantly, average hourly earnings of tipped workers is about 21 percent higher in states that do not have a sub-wage floor compared to states that follow the federal $2.13 policy.

The norm is that workers in tipped occupations are overwhelmingly low-wage earners.99 Even as the tipped workforce in states without a sub-wage floor has relatively higher earnings, those working full-time, full-year, are typically earning just around $24,000 annually. Low wages translate into low family incomes for many tipped workers. About 30.5 percent of all U.S. workers are in families that earn less than $40,000. That share jumps to 47.2 percent for all tipped workers and 49.9 percent for waiters and bartenders (52 percent for female waiters and bartenders).100

Tipped workers and their families experience elevated rates of poverty. The U.S. poverty rate of non-tipped workers is 6.5 percent, while it is 12.8 percent for the tipped workforce, and 14.9 percent for waiters and bartenders.101 Importantly, poverty rates for non-tipped workers do not vary much by state tipped-wage policies. (See Figure 3.)

Figure 3

Yet for tipped workers, and particularly for waiters and bartenders, the negative correlation between low-tipped wages and high poverty rates is dramatic. Among wait staff and bartenders, for example, 18.0 percent are in poverty in states that follow the $2.13 subminimum wage, compared with 14.4 percent in medium-tipped-wage states, and 10.2 percent in states without a sub-wage floor. This pattern strongly suggests that higher tipped wages mitigate poverty to some extent, yet it is still the case that poverty among tipped workers is far too high even in states that do not allow for a subminimum wage.

Unique challenges
facing tipped workers

For any job, overall job quality is important and goes beyond wages to include benefits such as paid sick leave, paid vacation, health insurance, and retirement. Job quality also includes other important issues such as workplace conditions, worker voice, and scheduling practices. In previous work I documented that tipped workers are far less likely to receive even the basic benefits such as paid sick leave let alone benefits such as retirement or disability.102 For instance, the problem of sick restaurant workers handling food is real—just 23 percent of all workers in the Accommodation and Food Services industry are offered paid sick leave compared to 61 percent of the private sector workforce. This low figure includes managers and supervisors and is undoubtedly much lower for tipped staff.103 Many workers simply cannot afford to take leave when they are sick.

Many tipped workers, especially in states with the $2.13 sub-minimum wage, effectively go home after each shift with the tips they are left with after they “tip-out” other staff such as hostesses, bartenders, bar backs, and bus persons. These workers also owe taxes on tips and their hourly base pay—which means they are often without a regular pay check. Thus pay is often based solely on tips that vary tremendously by the day of the week and the time of a scheduled shift. Schedules can vary down to an hourly basis at the whim of an owner or manager, as restaurants and bars are intense users of “just-in-time” employment practices. This means that many workers cannot even rely on the hours of a pre-scheduled shift, as restaurants and bars often utilize a “first one in, first one out” practice determined solely by customer demand. Constantly changing shifts make it difficult to have a second job or to plan for childcare.

As mentioned earlier, in states that allow for a subminimum wage, a worker’s tips plus their tip wage must equate to at least the regular state minimum wage. If not, the employer must make up the difference. This poses several problems. First, if the law is even known, it often puts the onus of enforcement on tipped workers who may not feel comfortable confronting management about whether they were shorted on wages, to remedy the situation. Additionally, this regulation is difficult to implement in practice. First, it is logistically difficult as many tipped workers work irregular schedules. Second, a portion of tips are often given to secondarily tipped workers. Third, management would need an accounting system to keep track of pay, hours, and actual tips. And finally, at what point does an employer stop the clock to tally up hours, tips, and base wages?

Time and again, where there is adequate monitoring by regulators, they find that non-compliance is an issue especially in the full-service restaurant industry. A 2010–2012 compliance sweep of nearly 9,000 full-service restaurants by the U.S. Department of Labor’s Wage and Hour Division found that 83.8 percent of investigated restaurants had some type of violation. In total, the federal government recovered $56.8 million in back wages for nearly 82,000 workers, assessing $2.5 million in civil money penalties. Violations included 1,170 tip-credit infractions that resulted in nearly $5.5 million in back wages.104 Most states do not have adequate investigators to monitor sufficiently the tipped wage workforce and the two-tiered system.

Research shows that the practice of tipping is often discriminatory and harmful to workers. For instance, white service workers receive larger tips than black service workers for the same quality of service.105 Michael Lynn, and expert on tipping and the Burton M. Sack Professor in Food & Beverage Management at the Cornell University’s School of Hotel Administration, reports on a range of aspects regarding tipping, such as how tips vary by race, physical appearance, and religious affiliation.106 The worker advocacy group Restaurant Opportunities Centers United has published numerous testimonies that echo what I have found in much of my work. Their reports, based on worker surveys, document an array of problems from low earnings and low-to-no benefits, to overtime violations, working off the clock, and issues of safety.107

Of particular importance, given the overwhelmingly female-dominated tipped employee workforce, is the incidence of sexual improprieties. Restaurant Opportunities Centers United reports that in the states with the $2.13 subminimum wage tipped female workers are twice as likely to experience sexual harassment compared to those working in states that pay the full minimum wage to all workers.108 In fact, all workers in these $2.13 states, including men, reported higher rates of sexual harassment, indicating that the sub-wage floor may perpetuate incidences of sexual harassment.

The protections of union representation could help many workers with issues of pay, benefits, scheduling, and unfair and dangerous working conditions. Yet just 1.9 percent of workers in food services and drinking places are represented by a union.109 This is one reason why worker organizations, such as Restaurant Opportunities Centers United, exist—to help to give workers justice and a fair voice in the workplace.

Policy action

The most basic question concerning the tipped wage is who should pay the workers—employers who hire them or by means of customer tips? The quasi-natural wage floor experiment going on across the county is proof at the very least that the $2.13 federal subminimum wage can easily and without undue economic harm be increased.110 The restaurant industry is booming in states that do not allow for subminimum wages—and those no-tip-credit states also have regular minimums significantly above $7.25. Lending credence to the immediacy of policy action are the low wages, low-to-no benefits, and high poverty rates of tipped workers, especially acute for women in states that follow the federal $2.13 sub-wage floor.

Furthermore, 46 percent of tipped workers and their families rely on public assistance to make ends meet—compared to 35.5 percent of the non-tipped workforce.111 It is good policy that low-wage workers can turn to public assistance for help, but these programs were not designed to serve as a permanent wage subsidy or part of the business strategy for low-wage employers.

Relevant to all low-wage workers, and even to middle-tier workers, is an imperative to increase wage growth, enforce and strengthen labor protections, and provide a seamless path to unionize. We also need to upgrade workplace benefits and scheduling practices. How can it be that of all advanced economies in the world, it is the U.S. worker who, regardless of anything, gets no mandated paid time off? After a quarter of a century, the time is past due to raise the federal subminimum wage (along with the minimum wage) and have a discussion about the merits of complete abolishment of this sub-wage floor. A stronger wage policy would be a start to address two of the biggest problems in our economy—growing inequality and poverty among the working poor.

How economic inequality affects children’s outcomes

AP Images

About the author: Ariel Kalil is a professor of public policy at the Harris School of Public Policy Studies, University of Chicago.

What happens in the home is paramount to children’s early development. Economically disadvantaged children’s limited access to cognitively enriching home environments may help drive growing gaps in cognitive and non-cognitive skills, producing a feedback cycle that leads to low socioeconomic mobility and further grows inequality. Research increasingly suggests that policy should identify new targets for programs aimed at enhancing parent-child interactions in low-income families, such as Early Head Start and Healthy Families America. All parents want to help their children flourish, but low-income parents often lack the resources to achieve their parenting goals. Parents are children’s first teachers and, to equalize the playing field, governments need to invest in parents so that they, in turn, can better invest in their children.

Background

Economic growth for much of the 20th century supported America’s promise of offering opportunities to both parents and their children. It is well known, however, that income inequality increased dramatically in the United States beginning in the 1970s.112 Greg Duncan and Richard Murnane illustrate how increasing family income inequality may affect access to high-quality child care, neighborhoods, schools, and other settings that help build children’s skills and educational attainments.113 Changes in these social contexts may in turn affect children’s skill acquisition and educational attainment directly as well as indirectly by influencing how schools operate.

Growing income inequality also increases the gap in the resources high- and low-income families can spend on enrichment goods and services for their children.114 For instance, Sabino Kornrich and Frank Furstenberg show that spending on child-enrichment goods and services jumped for families in the top quintiles but increased much less—in both absolute and relative terms—for families in bottom-income quintiles, as reflected in four large consumer expenditure surveys conducted between the early 1970s and 2005-2006. In 1972-1973, high-income families spent about $2,700 more per year on child enrichment than did low-income families. By 2005-2006, this gap had nearly tripled, to $7,500.115

As the incomes of affluent and poor American families have diverged over the past three decades, so too has the educational performance of the children in these families. Sean Reardon documents substantial growth in the income-based gap on the test scores of children born since the 1950s. Among children born around 1950, test scores of low-income (10th income percentile) children lagged behind those of their better-off (90th income percentile) peers by a little over half a standard deviation, or about 50 points on an SAT-type test. Fifty years later, this gap was twice as large. Family income is now a better predictor of children’s success in school than race.116

At age four, children from families in the poorest income quintile score on average at the 32nd percentile of the national distribution on math, the 34th percentile in a test of literacy, and at the 32nd percentile on a measure of school readiness compared with children in the richest quintile, who scored at the 69th percentile on math and literacy and at the 63rd percentile on school readiness.117 Gaps in conduct problems and attention/hyperactivity also are apparent albeit less pronounced. On measures of hyperactivity, for instance, children from families in the poorest income quintile score on average at the 55th percentile of the national distribution (in this case, higher scores indicate higher levels of behavior problems) compared with children in the richest quintile, who scored at the 44th percentile.118

Delivering equitable growth

Previous article: Income volatility, Bradley Hardy
Next article: Social Security, Jesse Rothstein

Using data from the 1979 and 1997 National Longitudinal Surveys of Youth, Martha Bailey and Susan Dynarski show that graduation rates for children born into high-income families jumped 21 percentage points (from 33 percent to 54 percent) between the early 1960s and the early 1980s. The corresponding increase for children born into low-income families was only four percentage points (from 5 percent to 9 percent). A little less than half of the gap between rich and poor in college graduation rates can be explained by differences in college enrollment rates, with the rest explained by differences in students’ persistence in completing their degrees.119 Phillipe Belley and Lance Lochner show that high family income has become a substantially more important determinant of college attendance and college quality in recent years, particularly for those youth with the lowest skills.120

Drivers of the socioeconomic
status-based gaps in child outcomes

Rising gaps in children’s skills and attainments cannot be attributed to rising income gaps alone, however.121 In fact, Reardon estimates that only about half of the rising income-based gap in test scores can be attributed to rising income inequality.122 Parents invest more than money in their children’s development. Through their time and attention parents can provide a cognitively stimulating and emotionally supportive home environment that promotes children’s early learning and behavioral adjustment. Economically advantaged parents differ from their less advantaged peers on many relevant dimensions of parenting.123

Mounting evidence suggests that socioeconomic status-based gaps in parenting and children’s early developmental outcomes have grown alongside increasing economic inequality in family conditions.124 The demography of family structure, for example, has changed in ways that favor the socioeconomically advantaged and their ability to invest parental time and resources in their children’s development. Between 1980 and 2010, the share of children living with college-educated mothers who were married remained at about 90 percent. In contrast, the share of children living with mothers who lacked a high school degree and who were married decreased from about 73 percent to about 66 percent.125 Two-biological-parent households not only enjoy greater economic well-being but also demonstrate higher levels of parental time investment in children than do single-parent households.126

Trends in maternal age at first birth also have changed in important ways that may favor the parenting environments provided by mothers with high socioecoconomic status. Comparing data on U.S. births in 1970, 1989 and 2006 by age of mother and maternal schooling reveals that the maternal age gap between children born to high school dropouts and college graduate mothers grew by nearly 3 years—from 4.3 years to 7.1 years.127 Positive parenting behaviors increase in maternal age at first birth whereas negative parenting behaviors decrease in maternal age at first birth.128

Finally, how parents think about parenting has changed dramatically over the past century. In 1900, parenting experts emphasized nutrition, medical care, and fresh air as the key inputs into child development, according to a comprehensive analysis of magazine articles containing parenting advice. By the 1980’s, intellectual stimulation and social/emotional development had replaced nutrition and fresh air as key topics of concern along with medical care.129 Yet economically advantaged parents, more so than their disadvantaged counterparts, may have responded more quickly to this advice, thus widening the parenting gap.

Why parents matter

Economically advantaged parents display more of the behaviors deemed supportive of children’s development across a range of parenting domains. Economically advantaged parents display more authoritative (versus authoritarian) parenting styles,130 engage in more sensitive and responsive mother-child interactions,131 use greater language stimulation,132 and use greater levels of parental management and advocacy.133 A famous example of differential parenting by socioeconomic status is the study by Betty Hart and Todd Risley, who intensively observed the language patterns of 42 families with young children. They found that in professional families, children heard an average of 2,153 words per hour, while children in working class families heard an average of 1,251 words per hour, and children in welfare-recipient families heard an average of 616 words per hour. By age four, a child from a welfare-recipient family could have heard 32 million words fewer than a classmate from a professional family.134

One of the most important parenting differences between advantaged and disadvantaged parents is in how much time the parent spends with the child. Annette Lareau’s qualitative study of family life reported that middle-class parents target their time with children toward developmentally enhancing activities. In her study, middle-class families (whose jobs, by her definition, require college-level skills) engage in a pattern of “concerted cultivation” to actively develop children’s talents and skills. By contrast, in lower-class families, Lareau identified a pattern that she calls “the accomplishment of natural growth,” wherein parents attend to children’s material and emotional needs but presume that their talents and skills will develop without concerted parental intervention.135

Numerous quantitative studies not only show large differences in the time investments of advantaged and disadvantaged parents but also that these gaps remain large even when other differences across families, such as employment hours and schedules, are accounted for.136 Work by Ariel Kalil, Rebecca Ryan, and Michael Corey further shows that highly educated mothers are more “efficient” in their parental time investments by tailoring their specific activities to children’s developmental stage. This research also shows that with respect to total childcare time, the educational gradient is most apparent in households with the youngest children, a point also made by Erik Hurst, Daniel Sacks, and Betsey Stevenson.137 Economically advantaged mothers, more so than their less advantaged counterparts, may have learned the message that parental investments in early childhood are key ingredients in children’s long-run success.138

High-income parents appear to be investing more parenting time than ever before in their children’s cognitive development and educational success.139 This increase may mean that high-skilled parents are responding to the increased returns to having high-skilled (highly educated) children.140 Work by Erik Hurst , Daniel Sacks, and Betsey Stevenson further show that all of the increase in childcare time between 1985 and 2003 has come from households with children ages 5 and younger, and Evrim Altintas shows that the growing education gap in time with young children is driven by time in educationally enriching activities.141

Increases in the parenting gap are expected to be relevant for socioeconomic status-based gaps in children’s development. Observational research suggests that the quality of the home learning environment as measured by the HOME score accounts for up to half of the relationship between socioeconomic status and disparities in children’s cognitive test scores.142 In a descriptive analysis of U.S. data from the Early Childhood Longitudinal Study-Birth Cohort, Jane Waldfogel and Elizabeth Washbrook conclude that parenting style (in particular, mothers’ sensitivity and responsiveness as well as the home learning environment) is the most important factor explaining the poorer cognitive performance of low-income children relative to middle-income children, accounting for between a quarter and a third percentage of the gaps in literacy, mathematics, and language.143

What’s the role for
public policy?

Few trends are more ominous than the increases in both the class gaps and achievement gaps between low- and high-income children in the United States. The rising income-based achievement gaps call into question whether the American Dream of intergenerational mobility is now beyond the reach of many children raised in low-income families.144

Policy approaches to addressing increasing disparities in outcomes for children from low- and high-income families can take a number of forms. Some of these will boost families’ economic security, others can help support parents’ engagement in their children’s development, and others can provide educational supports directly to children. Such approaches can be pursued simultaneously. These include policies such as the Earned Income Tax Credit that redistributes income and relies on parents to use the added income to promote their children’s development; policies such as the Nurse Family Partnership that teach high-risk parents about positive parenting practices and about the nature of early childhood development; polices such as Pell Grants that encourage would-be parents to acquire post-secondary schooling; and policies such as state pre-Kindergarten programs that provide educational services directly to young children.145

Given the importance of parental engagement in children’s development, it may be especially fruitful for policies to focus on boosting parents’ ability to provide a cognitively stimulating and emotionally supportive home environment. Gaps in children’s skills could be narrowed if less-advantaged parents adopted the parenting practices of their more-advantaged peers. Notably, a leading family intervention for low-income children—the Nurse-Family Partnership program—is being targeted for substantial expansion by the federal government from the Administration on Children and Families’ Maternal, Infant, and Early Childhood Home Visiting Program demonstration. The program provides weekly in-home visits by trained nurses from pregnancy through the child’s second birthday.

One mission of the Nurse-Family Partnership program is to improve children’s health and development by helping young, economically disadvantaged parents provide more competent care. Some experimental evaluations of the program show it reduces child maltreatment. In one study, mothers in the treatment group who received nurse visits during their pregnancy and the child’s infancy had 0.29 substantiated reports of child abuse and neglect at some point before the child turned 15. Mothers in the control group, in contrast, had on average 0.54 such reports.146 This is important because child maltreatment is costly for the individual affected and for society.147

The Nurse-Family Partner program also yields long-run benefits for some children. By age 19, girls in the treatment group had fewer arrests and convictions; a subset of these girls had fewer children and less Medicaid use than their comparison group counterparts.148 Although there is room for improvement in the design and delivery of this and similar intervention programs, research underscores the merit of the new federal emphasis on supporting parenting in educationally disadvantaged families.

Important new evidence also is emerging that suggests that low-cost “light-touch” efforts can be highly successful in helping low-income parents support their young children’s learning and development.149

Conclusion

The United States has made little progress toward narrowing the achievement gap between advantaged and disadvantaged children. This is in part because public policy has neglected the critical role of parenting in children’s development. Parents do more than spend money on children’s development; they also promote child development by spending time in cognitively enriching activities and by providing emotional support and consistent discipline.

All parents want the best for their children, but the “parenting divide” between economically advantaged and disadvantaged children is large and appears to be growing over time.150 The main barrier to designing and scaling up parenting interventions nationwide is the currently limited understanding of the key ingredients of successful programs. Policymakers need to become better informed on effective interventions that can motivate and support parents to engage effectively in their children’s development.

The “silver spoon” tax: how to strengthen wealth transfer taxation

""

About the author: Lily L. Batchelder is a professor of law and public policy at New York University School of Law.

 Wealth transfer taxes are a critical policy tool for mitigating economic inequality, including inequality of opportunity. They are also relatively efficient. This essay summarizes why and how wealth transfer taxes should be strengthened. Reform options that our next President should consider include increasing the wealth transfer tax rate, broadening the base, repealing stepped-up basis, addressing talking points against wealth transfer taxes with little or no factual basis, and converting the estate and gift taxes into a direct tax on the recipients of large inheritances.

Why wealth transfer taxes should be preserved and expanded

For those concerned about economic inequality, taxing wealth transfers is a critical policy tool, mitigating inequality in ways that other taxes cannot. Inheritances represent roughly 40 percent of all wealth151 and about 4 percent of annual household income.152 Bequests alone total about $500 billion per year.153

There are two types of inequality that policymakers should care about. The first is within-generation disparities in income, wealth, or other measures of economic well-being. Both income and wealth inequality are extremely high in the United States. The top 1 percent of households receives 15 percent of all income and holds 35 percent of all wealth.154 Wealth transfers increase within-generation inequality on an absolute basis (See Figure 1), but not on a relative basis. This is because of what economists call regression to the mean.155 Someone who earns $100 million per year, for example, is likely to have a child whose income is slightly lower, even including the child’s inheritance. Conversely, someone who earns $10,000 per year is likely to have a child whose income is slightly higher than her own.

Figure 1

But equally important is a second type of inequality: inequality of economic opportunity. A child whose parents earn $100 million will, on average, be radically better off than a child whose parents earn $10,000. The United States has one of the highest levels of opportunity inequality among its competitors.156 In the United States, a father on average passes on roughly half of his economic advantage or disadvantage to his son. Among most of our competitors, the comparable figure is less than one-third, and for several it is less than one-fifth.157

Delivering equitable growth

Previous article: Consumer credit, Kyle Herkenhoff and Gordon Phillips
Next article: Monetary policy, Alan Blinder

Financial inheritances worsen this inequality of life chances dramatically. Indeed, 30 percent of the correlation between parent and child incomes—and more than 50 percent of the correlation between the wealth of parents and the wealth of their children— is attributable to financial inheritances.158 This is more than the impact of IQ, personality, and schooling combined.

Increasing the progressivity of income and payroll taxes would go a long way toward addressing both of these types of inequality.159 But it would leave significant holes if not accompanied by stronger taxes on wealth transfers. Under current law, for example, if a wealthy individual bequeaths assets with $100 million in unrealized gains, neither the donor nor the heir ever has to pay income or payroll tax on that $100 million gain. In addition, the recipients of large inheritances never have to pay income or payroll tax on the value of inheritances they receive, whether attributable to unrealized gains or not.160

Some argue that any income or payroll tax previously paid by a wealthy individual on gifts and bequests they make should count as tax paid by the heir. But they are two separate people. When a wealthy individual pays his assistant’s wages out of after-tax funds, we don’t think the assistant has thereby paid tax on their own wages. In short, today the income and payroll taxes effectively tax unearned income in the form of inheritances at a zero rate.

Wealth transfer taxes play an important role in partially addressing this inequity of excluding inherited income from the income and payroll tax bases.161 But inherited income is still taxed at less than one-quarter of the rate on income from work and savings. (See Figure 2.)

Figure 2

A fairer tax system would tax income in the form of large inheritances at a higher rate than income from work. Recipients of large inheritances are better off than people who earn the same amount of money by working. In economist-speak, they have no “opportunity cost;” they have not had to give up any leisure or earning opportunities in order to receive the inheritance. All else equal, it is therefore fairer for them to pay more taxes, not less. But all else is not equal. Heirs of large inheritances also typically have a huge leg up in earning income if they choose to work—with access to the best education, influential family friends, interest-free or low-interest loans, and a safety net if they take risks that don’t pan out. This further strengthens the case for taxing inheritances at a higher rate.

More progressive income and payroll taxes cannot address this inequity in the tax system and ensure that large inheritances are taxed at higher rates than wage income.162 The same is true of proposals to adopt a tax on wealth as opposed to wealth transfers.

Importantly, bipartisan experts agree that wealth transfer taxes are largely borne by the heirs of large estates, not their benefactors.163 As a result, it would be more accurate to call wealth transfer taxes “silver spoon” taxes, not “death” taxes as their opponents prefer.

In addition to playing a critical role in making the tax system fairer, wealth transfer taxes are relatively efficient. It is an article of faith among estate tax opponents that wealth transfer taxes harm the economy because they discourage work and saving among very wealthy individuals. But in order to have these effects, the wealthy would need place a high value on the amount their heirs will inherit after-tax when making work and saving decisions. In fact, a large body of empirical research finds this is not the case, and that the amount that the affluent accumulate for wealth transfers is relatively unresponsive to the wealth transfer tax rate.164

People with very large estates typically have saved for multiple reasons. They may enjoy being wealthy, with the prestige and power that it confers while they are alive. They may have saved to have enough for their retirement needs, including unanticipated health expenses. And they may, of course, have saved to give to their children. But the empirical evidence to date suggests the first two motivations are so strong that the wealthy do not reduce their saving by all that much if they expect their estate to be taxed at a high rate. Put differently, a lot of the reason why people save is to have wealth while they are alive, which wealth transfer taxes do not affect.

Moreover, any negative incentive effects of wealth transfer taxes on wealthy donors are at least partially offset by their positive incentive effects on the next generation. Such taxes induce heirs to work and save more because heirs do not have as large an inheritance to live off of as a result.165 Wealth transfer taxes also improve business productivity. Several studies have found that businesses run by heirs perform worse because nepotism limits labor market competition for the best manager.166

For all these reasons, wealth transfer taxes may be more efficient than comparably progressive income and wealth taxes167—in addition to playing a unique role in mitigating inequality of economic opportunity.

How to strengthen wealth transfer taxes

There are two main components of the wealth transfer tax system: the estate tax on bequests and the gift tax on wealth transfers made during life.168 In 2016, transferors are entitled to a lifetime exemption of $5.45 million ($10.9 million per couple). If their combined gifts and bequests exceed this threshold, the excess is taxed at a rate of 40 percent. Transferors also can exclude $14,000 in gifts each year to a given heir from ($28,000 per couple), meaning such gifts don’t even count toward the lifetime exemption. Currently only 0.2 percent of estates owe any estate tax.169

Option #1: raise the rate

The simplest way to strengthen wealth transfer taxes would be to raise the rate. Restoring the 2009 estate tax parameters (a $3.5 million exemption and a 45 percent rate) would raise $160 billion over 10 years.170 Also raising the rate to range from 50 percent to 65 percent to the extent that estates exceed $10 million to $1 billion would raise about $235 billion over 10 years instead.171

At a minimum, large inheritances should be taxed at the top marginal tax rate that applies to labor income—roughly 50 percent when one includes state and local income taxes.172 But a higher rate would be fairer and more efficient. The optimal tax rate on extremely large inheritances is estimated to be between 50 percent and 80 percent.173

Reducing the lifetime exemption amount also is worth considering, but it should be a lower priority. A higher rate focuses wealth transfer taxes on the wealthiest heirs and limits compliance costs.

Option #2: replace the estate and gift taxes with an inheritance tax

A more fundamental improvement would be to replace the estate and gift taxes with an inheritance tax. The lifetime exemption for the estate and gift taxes applies to the amount transferred, not the amount inherited by the heir. Suppose Richie Rich is an only child and receives $5 million in bequests from each of his parents and stepparents. Under current law, the $20 million he inherits is exempt from estate and income taxes because each bequest is under the exemption. But under an inheritance tax, the exemption would be based on how much he receives instead.

I propose requiring heirs of large inheritances to pay income tax plus an inheritance surcharge on amounts they inherit above a large lifetime exemption. If the lifetime exemption were $2.1 million and the surcharge were 15 percent (roughly equal to the maximum payroll tax rate) then such an inheritance tax would raise roughly $200 billion more over 10 years than the current estate tax. Dialing the rates up or the exemption amount down could raise more revenue. (See Figure 3.)174 To state the obvious, $2.1 million is a lot of money. An individual who inherits $2.1 million at age 21 can live off her inheritance for the rest of her life without anyone in her house ever working and, on average, her annual household income will still be higher than about 7 out of 10 American families.175

Figure 3

There are several advantages of an inheritance tax relative to an estate tax. First, it would more equitably allocate wealth transfer taxes among heirs. Both types of taxes are borne by wealthy heirs and not their benefactors. But not all large inheritances come from the largest estates, and some small inheritances come from relatively large estates.

In addition, the type of inheritance tax outlined here would apply different rates to heirs based on their total income. As a result, about 30 percent of the burden of the inheritance tax in dollar terms would fall on different heirs than under a revenue-equivalent estate tax.176 While roughly one-third of heirs burdened by the estate tax have inherited less than $1 million, none would owe any inheritance tax.177

These differences should not be taken as a fundamental critique of the estate tax. It is overwhelmingly borne by the recipients of large inheritances: Less than 4 percent of the revenue comes from individuals inheriting less than $1 million. Its burdens are just allocated among the recipients of large inheritances less precisely than under an inheritance tax.

A second, and perhaps even more important, advantage of an inheritance tax is that it could better align public understanding of wealth transfer taxes with their actual economic effects. The structure of an estate tax makes it easy for opponents to characterize it as a double tax on the frugal, generous entrepreneur who just wants to take care of his family after his death. In fact, nothing could be further from the truth. The estate tax is actually the only tax that that ensures wealthy heirs pay at least some tax on their large inheritances—even if at a much lower rate than their personal assistants. But this imagery is powerful. Perhaps as a result, most countries around the world that historically had estate taxes have repealed them, while those with inheritance taxes have not.178

The structure of an inheritance tax makes the inequities of our current system clearer. It simply requires wealthy heirs to pay income tax on their large inheritances just as all American workers pay tax on their earnings. Even with a surcharge, wealthy heirs would still typically pay a lower rate of tax on their inherited income than workers pay on a similar amount of labor income because of the large exemption, which workers cannot claim on their wages.

There are ancillary advantages of an inheritance tax as well. It would be simpler because it permits a wait-and-see approach for split and contingent transfers, rather than requiring taxpayers and the Internal Revenue Service to guess upfront what portion of the transfer will ultimately go to tax-exempt individuals or charities. At the margin, it could induce the wealthy to share their estates more broadly. And it is clearly administrable. Inheritance taxes are far more common than estate taxes cross-nationally.179

Option #3: repeal stepped-up basis

Regardless of whether the estate tax is expanded or replaced with an inheritance tax, policymakers should repeal stepped-up basis.180 This is the provision that completely exempts all accrued gains on bequeathed assets from income and payroll taxes, by “stepping up” the basis of asset to its fair market value when it is transferred.

President Obama has proposed repealing stepped-up basis, subject to several carve-outs including an exemption for the first $100,000 in accrued gains ($200,000 per couple).181 Together with raising the capital gains rate to 28 percent, this proposal would raise $210 billion over 10 years and significantly more over time as it fully phases in.182 While not technically an estate or gift tax reform, repealing stepped-up basis would accomplish all the same objectives as strengthening those taxes. It is highly progressive because inheritances are distributed so unequally and accrued gains are distributed even more unequally.183

The U.S. Department of the Treasury estimates that 99 percent of the revenue raised would come from the top 1 percent and 80 percent from the top 0.1 percent.184 It helps ensure that large inheritances are taxed at a rate closer to income from working. And it is highly efficient. Indeed, repealing stepped-up basis is even more efficient than raising wealth transfer tax rates because it reduces current law’s “lock-in” incentives to hold on to underperforming assets purely for tax reasons.

If repealing stepped-up basis is not an option then the next best solution would be to apply carryover basis to bequests.185 This would allow heirs to delay paying income tax on accrued gains on their inheritances indefinitely. But heirs would at least need to pay the associated income tax when they ultimately sell the asset. As a result, it would reduce lock-in incentives, but not by nearly as much as stepped-up basis repeal. It would also raise significantly less revenue.186

Option #4: broaden the wealth transfer tax base

A number of smaller reforms to broaden the wealth transfer tax base should also be pursued. Many of these proposals, such as limiting gaming around grantor-retained annuity trusts, are in President Obama’s budget. Together, these budget proposals would raise $17 billion over 10 years.187 The next President should also finalize the current Administration’s recently issued regulation addressing loopholes using valuation discounts, and ensure that Congress does not repeal it.188

An additional option worth considering is harmonizing the tax treatment of gifts and bequests. Currently gifts are often tax-advantaged because of the annual gift tax exclusion, the lack of present-value adjustments when calculating the lifetime exemption, and the fact that the top rate on very large gifts is effectively 29 percent, compared to 40 percent for bequests.189 Cutting the other way, bequests are tax-advantaged because they are eligible for stepped-up basis while gifts are not. These countervailing incentives create substantial tax planning costs, traps for the unwary, and inequities between similarly situated heirs. These problems could be largely addressed by repealing stepped-up basis, indexing the value of gifts to a market interest rate when calculating the lifetime exemption, and taxing gifts at the same rate as bequests.190

Option #5: address strawman arguments against wealth transfer taxes

Finally, policymakers should consider addressing talking points against wealth transfer taxes that resonate but have little or no basis in fact. A prime example is family farms. A principal rallying cry against the estate tax has long been that it forces families to sell their farms. But neither the American Farm Bureau nor The New York Times has been able to identify a single instance of this happening, even when the exemption was much lower.191

To counter this argument, one option is to adopt the proposal by former Senate Finance Committee Chairman Baucus (D-MT) to allow taxpayers to defer indefinitely any estate tax payments due on farm land at a market interest rate, provided the farm continues to be actively managed by the family.192 Because it is so rare for such farms and ranches to be subject to the estate tax, the proposal would only cost $5 billion over 10 years.193

To be clear, this proposal should only be considered if it is includes all the guardrails in the full Baucus proposal and interest accrues at a market interest rate. Otherwise, it could become a large loophole and reduce the number of farms owned and actively managed by families as opposed to passive investors in large corporations.

Conclusion

Wealth transfer taxes play a critical role in mitigating economic disparities, especially inequality of opportunity. The proposals offered here would soften the relative advantages of being born at the very top while leaving more than 99 percent of financial gifts and bequests unaffected.194

At the same time, these reforms options would raise a significant amount of revenue that could be used to mitigate the barriers to economic mobility that children from low- and middle-income families face. Effectively, they could fund a form of social inheritance through investments that partially make up for such families being unable to fund large financial wealth transfers to their children. The hundreds of billions of dollars raised could be used to fund universal pre-Kindergarten, expand the child tax credit for low- and middle-income working parents with young children, or increase the wage subsidy provided by the Earned Income Tax Credit for childless, frequently young adults. These proposals are estimated to significantly improve infant health, heighten academic achievement, boost labor force participation, and increase lifetime earnings for children from relatively disadvantaged backgrounds.195

President Franklin Delano Roosevelt once said “inherited economic power is as inconsistent with the ideals of this generation as inherited political power was inconsistent with the ideals of the generation which established our government.” The same could be said today. Rather than falling near the bottom among our competitors on this score, we can recommit to creating a society where one’s financial success depends relatively little on the circumstances of one’s birth. A first step is to start taxing extraordinarily large inheritances like we tax good, old hard work.

(I am grateful to Len Burman, Michael Graetz, Chye-Ching Huang, and Wojciech Kopczuk for helpful suggestions. All errors are mine.)

Must-Read: Economist: Hands off

Must-Read: News magazines that have spent all of the current millennium so far making excuses for Britain’s Conservative and Unionist Party have been playing with fire. Now there is some sign they are aware of just how badly they and Britain are getting burned. Let us hope that it is not too late, and that they do not backslide:

Economist: Hands off the Bank of England: “Politicians who casually attack the central bank’s integrity are playing with fire…”

Buttonwood: Central banking and the press: Anatomy of a stupid rumour: “MARK Carney, the governor of the Bank of England, has upset many people in the Conservative party because of his warnings about the economic impact of Brexit…

…This political pressure on an independent central bank governor is a great mistake. On the day after the referendum vote, the prime minister resigned and Brexit campaign leaders were nowhere to be seen; it was Mark Carney who stepped forward to calm the markets. He was the only grown-up in the room. Now the stories are circulating that Mr Carney might resign, with some even suggesting that it could happen as soon as this week. But… the British press starts to chase its own tail…. This whole affair just shows how careful one must be in a world of 24-hour news and social media. A throwaway remark in one piece becomes a source in another story and then an authoritative looking statement in a national newspaper; Chinese whispers in the internet age. 

It’s not 24-hour news and social media that’s the problem: it’s Buttonwood having in interest in pretending that the tackiest of hacky hacks write for “a national newspaper” that makes things that are for no substantive reason classified by Buttonwood as “authoritative looking statement[s]…”