New wealth data show that the economic expansion after the Great Recession was a wealthless recovery for many U.S. households

Overview
The Federal Reserve’s 2019 Survey of Consumer Finances, or SCF, released last week, shows that the wealth of many U.S. households never recovered from the shock of the Great Recession more than a decade ago. Although mean (average) wealth of all households in 2019 exceeded mean wealth in 2007 by 9 percent, median (midpoint) wealth declined by 19 percent over the same time period. If housing wealth is excluded, the median wealth of all households in 2019 is about equal to median wealth in 2007.
These several data points show that U.S. households barely recovered their levels of nonhousing wealth over the more than 10 years of economic expansion since the Great Recession of 2007–2009, compared to pre-Great Recession levels. And the data show that households are now less likely to have a home to leverage as a financial asset.
Moreover, disaggregating the data by demographic characteristics shows that many of these households fared worse than the average. Whiter, wealthier, and more educated households fared better, although even these struggled to recover their pre-Great Recession levels of wealth, demonstrating just how broadly felt the slow recovery of wealth has been.
That so many of these households would soon enter the coronavirus recession, which began in February 2020, in worse condition than they entered the Great Recession is a dire warning. This current recession is already deeper and families have fewer resources to draw on to protect themselves from its effects. The upshot: Further aid from Congress is critical to avoid repeating the mistakes made as the United States recovered from the Great Recession.
Disaggregating the 2019 SCF data to discover what kinds of households entered the coronavirus recession with the resources to insulate themselves from job losses, furloughs, or ill health caused by COVID-19, the disease caused by the virus, would help policymakers understand what kinds of households need help now to weather this economic and public health crisis. Notably, however, sample sizes in the Survey of Consumer Finances are not large enough for Hispanic and Black communities to support the fine levels of disaggregation necessary for policymakers to target aid effectively and efficiently.
Furthermore, sample sizes for Asian Americans and Pacific Islanders are so small that the Federal Reserve has to withhold these data from public disclosure entirely, grouping them into a catch-all “other” category to protect the privacy of these households. This is why the Fed should consider oversampling these communities.
The analyses below compare 2007 levels of wealth, from before the Great Recession, to 2019 levels of wealth, and represent peak-to-peak comparisons that tell us whether households with particular demographic characteristics are better- or worse-positioned for the current recession than they were in 2007 for the Great Recession. Most graphs in this column include shaded 95 percent confidence intervals to show levels of statistical uncertainty for these calculations.
White households had a stronger recovery of wealth
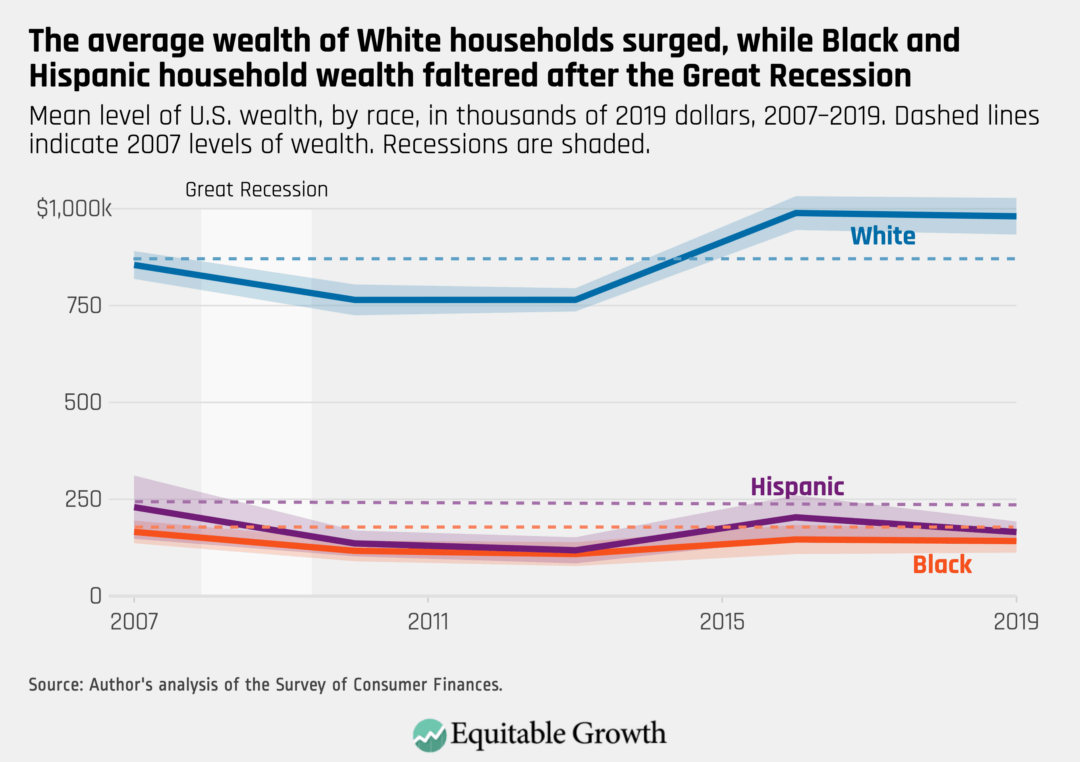
Households that fully recovered their pre-Great Recession levels of wealth are overwhelmingly White. While White households, on average, have 15 percent more wealth in 2019 than in 2007, Black households have 14 percent less wealth, and average wealth for Hispanic households declined by 28 percent. (See Figure 1.)
Figure 1
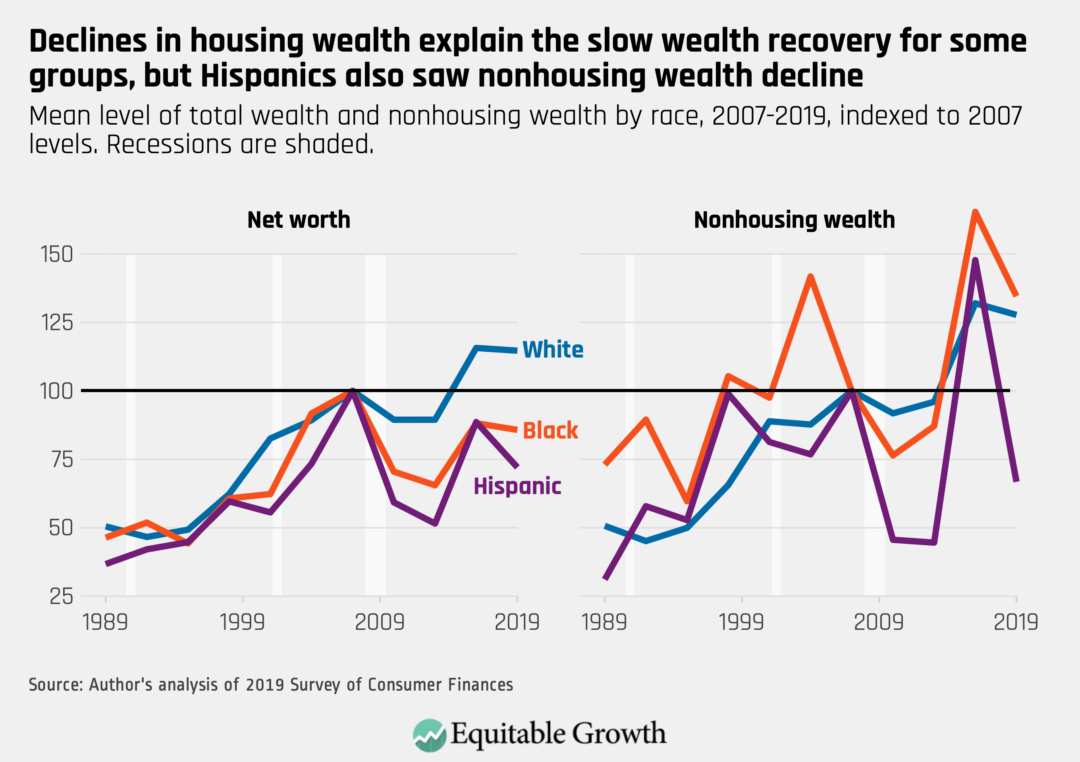
Declines in housing wealth in the United States are responsible for a significant portion of wealth declines since before the Great Recession, but they are not the whole story. The nonhousing wealth of White households between 2007 and 2019 increased by 28 percent after the Great Recession, while it surged 35 percent for Black households and dropped 33 percent for Hispanic households. That average Black wealth declined even though nonhousing wealth surged in the group indicates how important housing wealth is to Black households. (See Figure 2.)
Figure 2
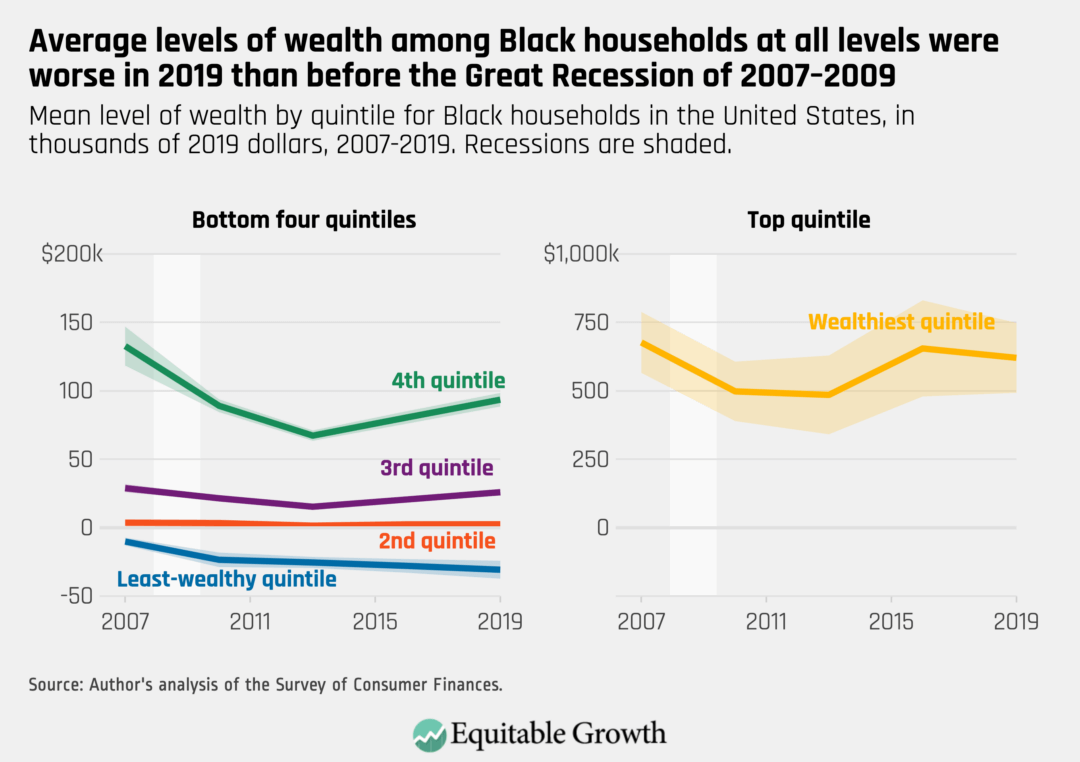
Even high-income Black households did not fully recover what they lost during the Great Recession. Classified by wealth, every quintile of Black households saw declines in their net worth. Middle-quintile Black households saw their net worth decline by 10 percent between 2007 and 2019, for example. (See Figure 3.)
Figure 3
Wealthier households had the strongest recoveries of wealth
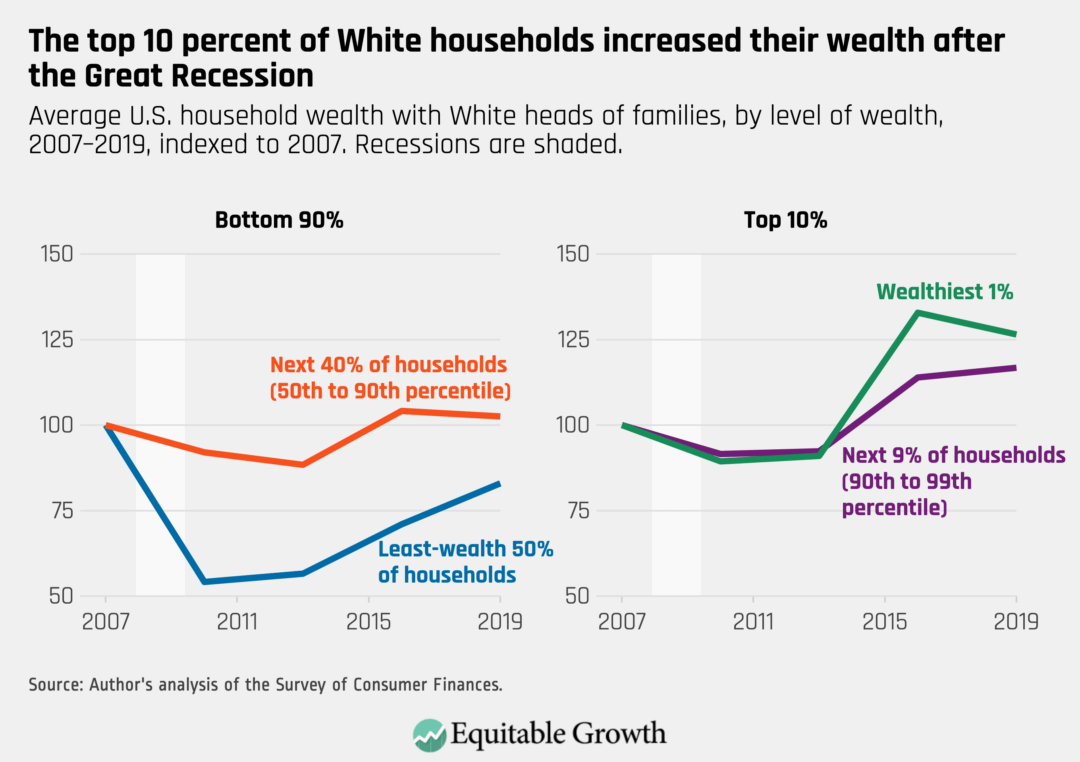
U.S. households headed by White people were more likely to recover or exceed their pre-Great Recession levels of wealth, with much of this growth happening at the top of the wealth distribution. In contrast, households outside the top 10 percent experienced relatively weak recoveries.
In fact, White households in the bottom half of the wealth distribution only recovered about 83 percent of their pre-Great Recession wealth peak. Those in the next 40 percent of the wealth distribution (from the 50th percentile to the 90th percentile) saw very modest gains of about 2.5 percent. Those at the top, however, built a significant amount of wealth. The top 1 percent increased their wealth by 26 percent during the post-Great Recession economic recovery. (See Figure 4.)
Figure 4
Less-educated households struggled to build wealth in the recovery
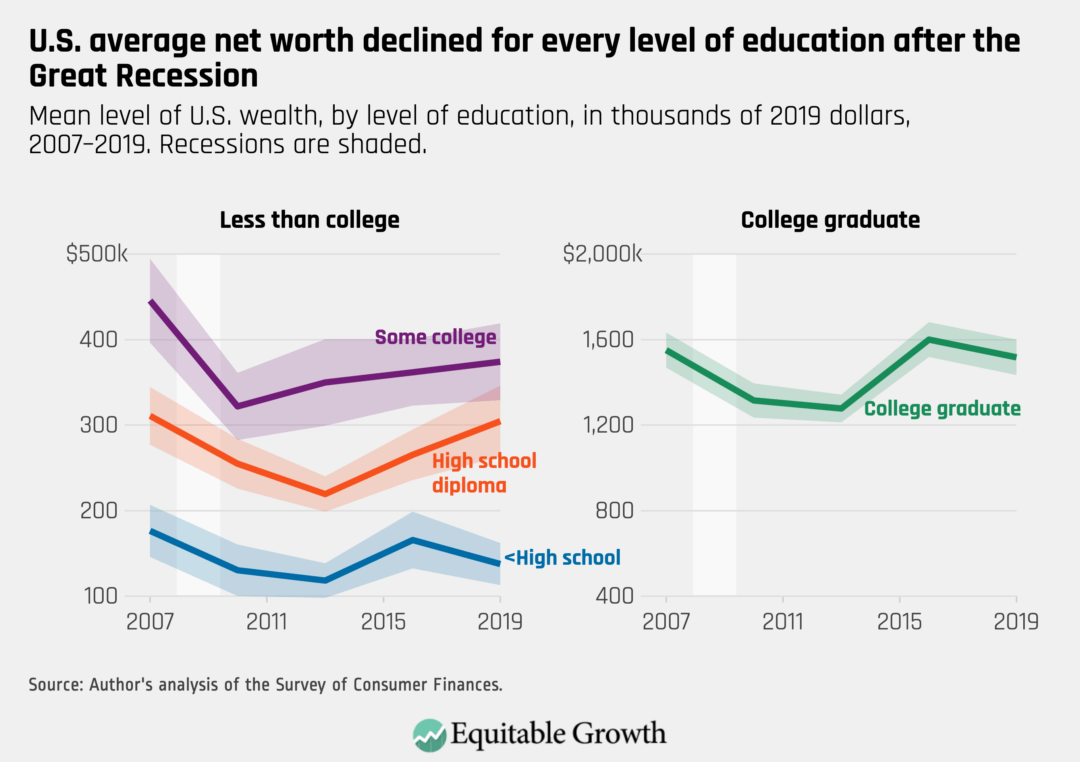
Americans grouped by education experienced a similar divide before and after the Great Recession. Those with a bachelor’s degree or more just barely recovered their pre-Great Recession levels of wealth. But Americans in every other educational group saw significant declines in their wealth, although Americans with high school diplomas came closest to recovering. (See Figure 5.)
Figure 5
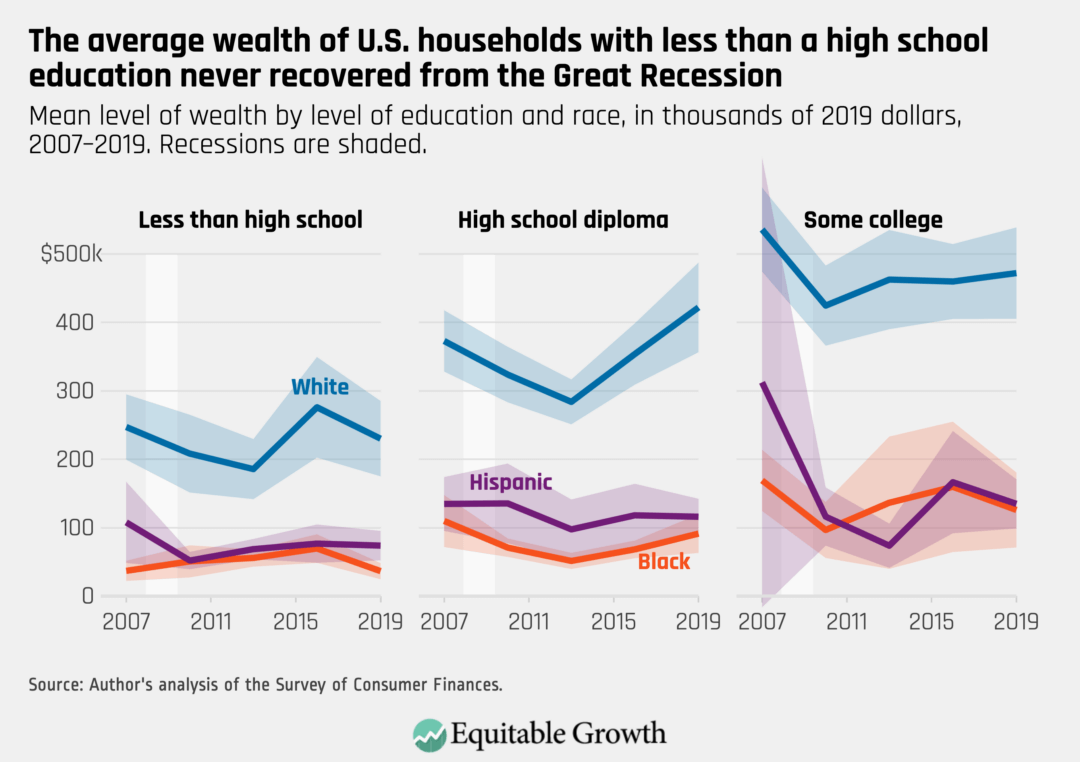
This is true even for White households at lower levels of education. Those White households with a head of the family who had less than a high school diploma or with a GED or high school diploma only narrowly recovered their 2007 levels of wealth by 2019. Sample sizes for White households with a head of the family who had some college experience are relatively small, and it is difficult to draw inferences in this group.
Again, the differences are more stark for households of color. White households with less than a college degree saw their wealth increase by 3 percent between 2007 and 2019. But Black households without a college degree entered 2020 and the coronavirus recession two months later with an average of 17 percent less wealth than what they had in 2007. (See Figure 6.)
Figure 6
Younger Black households built wealth during the recovery but continue to have very low levels of wealth
From a generational perspective, Black households have levels of wealth far lower than even the youngest White households. A White household where the head of the family was born between 1970 and 1990 had average wealth of about $500,000 in 2019, whereas even the oldest Black households only had average wealth of around $200,000.
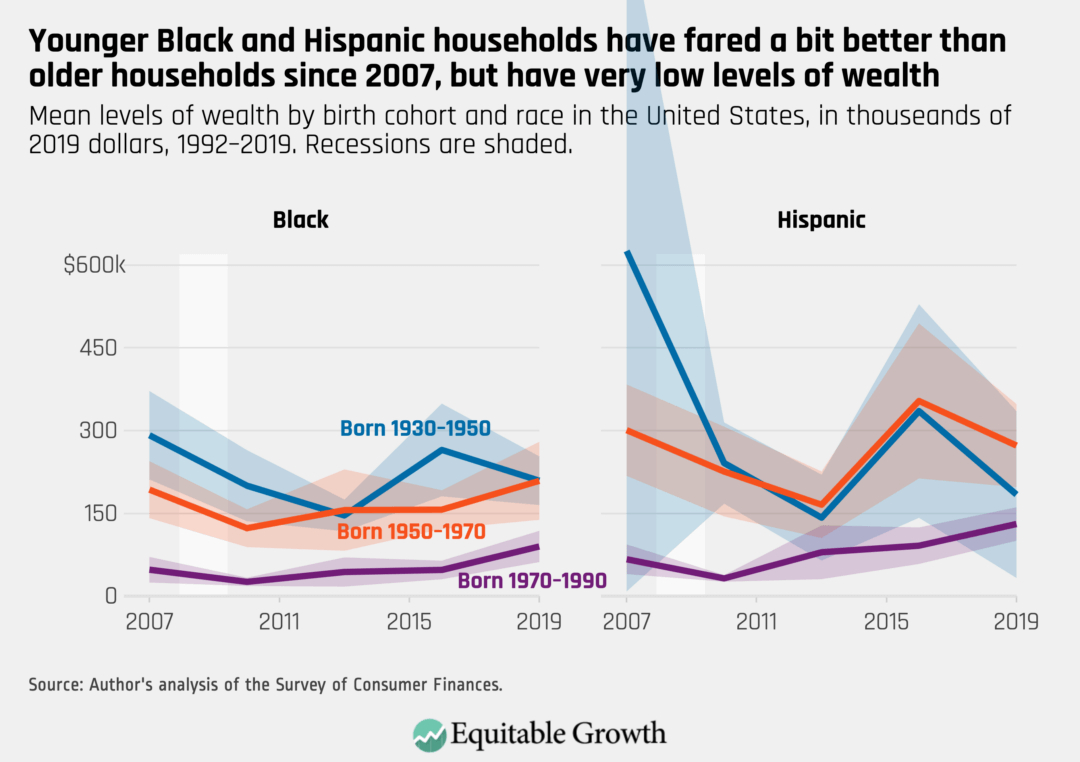
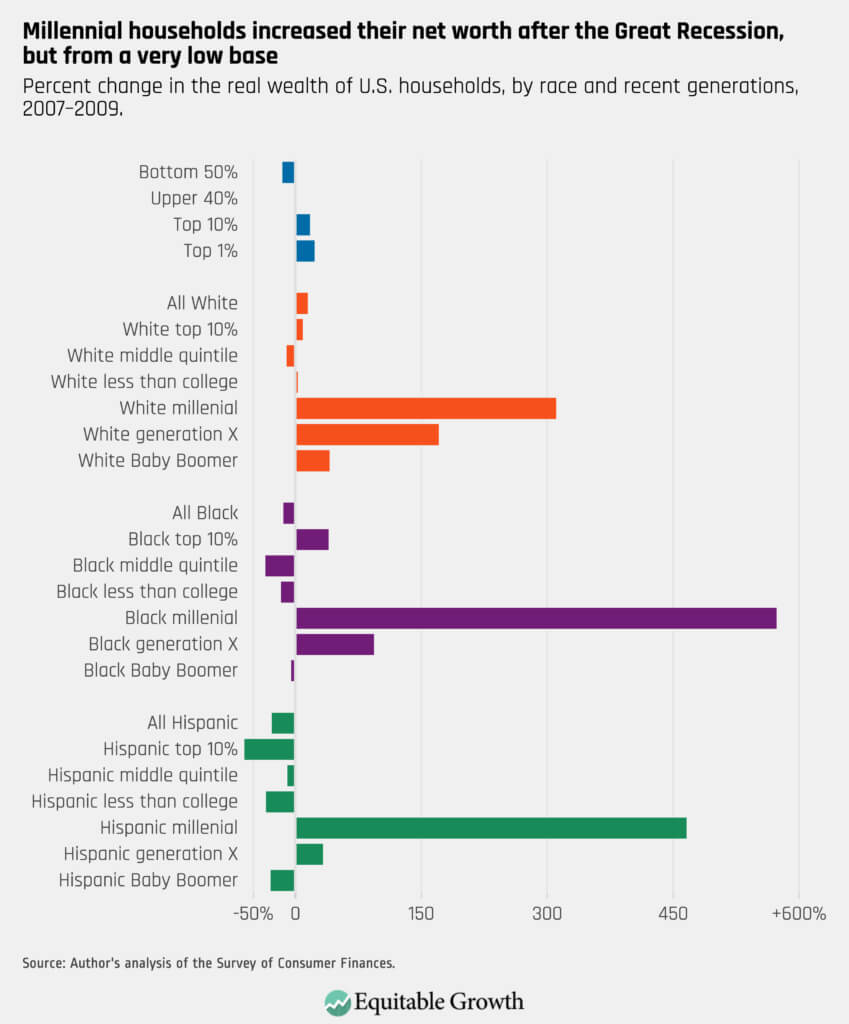
Black and Hispanic households of any age had very low levels of wealth entering the Great Recession. But younger generations of both Black and Hispanic households fared better over the course of the recovery after the Great Recession. Black households with heads of families born between 1970 and 1990 increased their wealth by 65 percent between 2007 and 2019, but nonetheless still have very low levels of wealth. (See Figure 7.)
Figure 7
The wealth of many U.S. households is lower entering the coronavirus recession than right before the Great Recession of 2007–2009
Despite the record-long economic expansion of more than 10 years following the Great Recession, many households never fully recovered, pointing to weaknesses in wage growth and in the availability of high-quality jobs that dogged the recovery for nearly its entire length. Notably, millennial households built a considerable amount of wealth during that recovery, but only because they started with very low base levels of wealth, and they had less housing wealth to lose during the Great Recession. (See Figure 8.)
Figure 8
Conclusion
The lessons learned about U.S. household wealth across a variety of measures after the Great Recession demonstrate that the relative paucity of policymaker action after the economic gains from the American Recovery and Reinvestment Act of 2009 fed into the U.S. economy led to an overall weak recovery in U.S. household wealth. Today, that leaves many Americans struggling through the coronavirus recession. And that’s why Congress should not repeat the mistakes made by past Congresses, but rather continue to act forcefully to make sure there is a robust recovery.
Another important takeaway from the data in the Federal Reserve’s 2019 Survey of Consumer Finances is that the huge error bars around Hispanic and, to a lesser extent, Black household estimates of wealth in the graphs above demonstrate how uncertain these estimates become when analyzing the data at the intersection of race and education, age, gender, or other demographics. To support better decomposition of groups, the Federal Reserve should consider instituting oversamples of households of color.


