The analysis “U.S. homeownership tax policies are expensive and inequitable,” contained errors that had been identified by Equitable Growth. Before the errors could be corrected, Congress enacted major tax legislation that substantially changed the policies discussed in the piece. As a result, Equitable Growth no longer plans to post a corrected version of the analysis and has removed the original.
Category: Research & Analysis
What have we learned about geographic cross-sectional fiscal multipliers?
The limits of monetary policy during the Great Recession pushed fiscal policy back to the forefront of macroeconomic policy discussions in the United States. Yet empirical estimates of the effects of fiscal policy vary. Two main challenges dominate economic thinking. First, fiscal policy can respond to a changing economic trajectory, as when the American Recovery and Reinvestment Act of 2009 increased spending precisely because unemployment was already rising. Second, changes in spending often coincide with changes in taxes or other policies. Both challenges mean that the naïve relationship between government spending and subsequent outcomes may not measure the true causal impact.
The past several years delivered up a wave of new research using geographic variation in spending to better understand the employment and output effects of fiscal policy. By definition, a geographic cross-sectional fiscal multiplier uses variation in fiscal policy across distinct geographic areas within a single period of time to measure the effect of an increase in spending in one region in a monetary union. This cross-sectional approach has the advantage of identifying much greater variation in policy across space than over time, and variation more plausibly exogenous with respect to the no-intervention paths of outcome variables.
In a new review paper, I assess what we have learned from this research wave. I conclude the cross-sectional evidence implies a national multiplier of about 1.7 or above when monetary policy is constrained. This magnitude falls at the upper end of the range suggested by earlier studies using time series variation only, and suggests that fiscal policy can play an important role in the management of business cycles when monetary policy has reached its limits. (See Figure 1.)
Figure 1
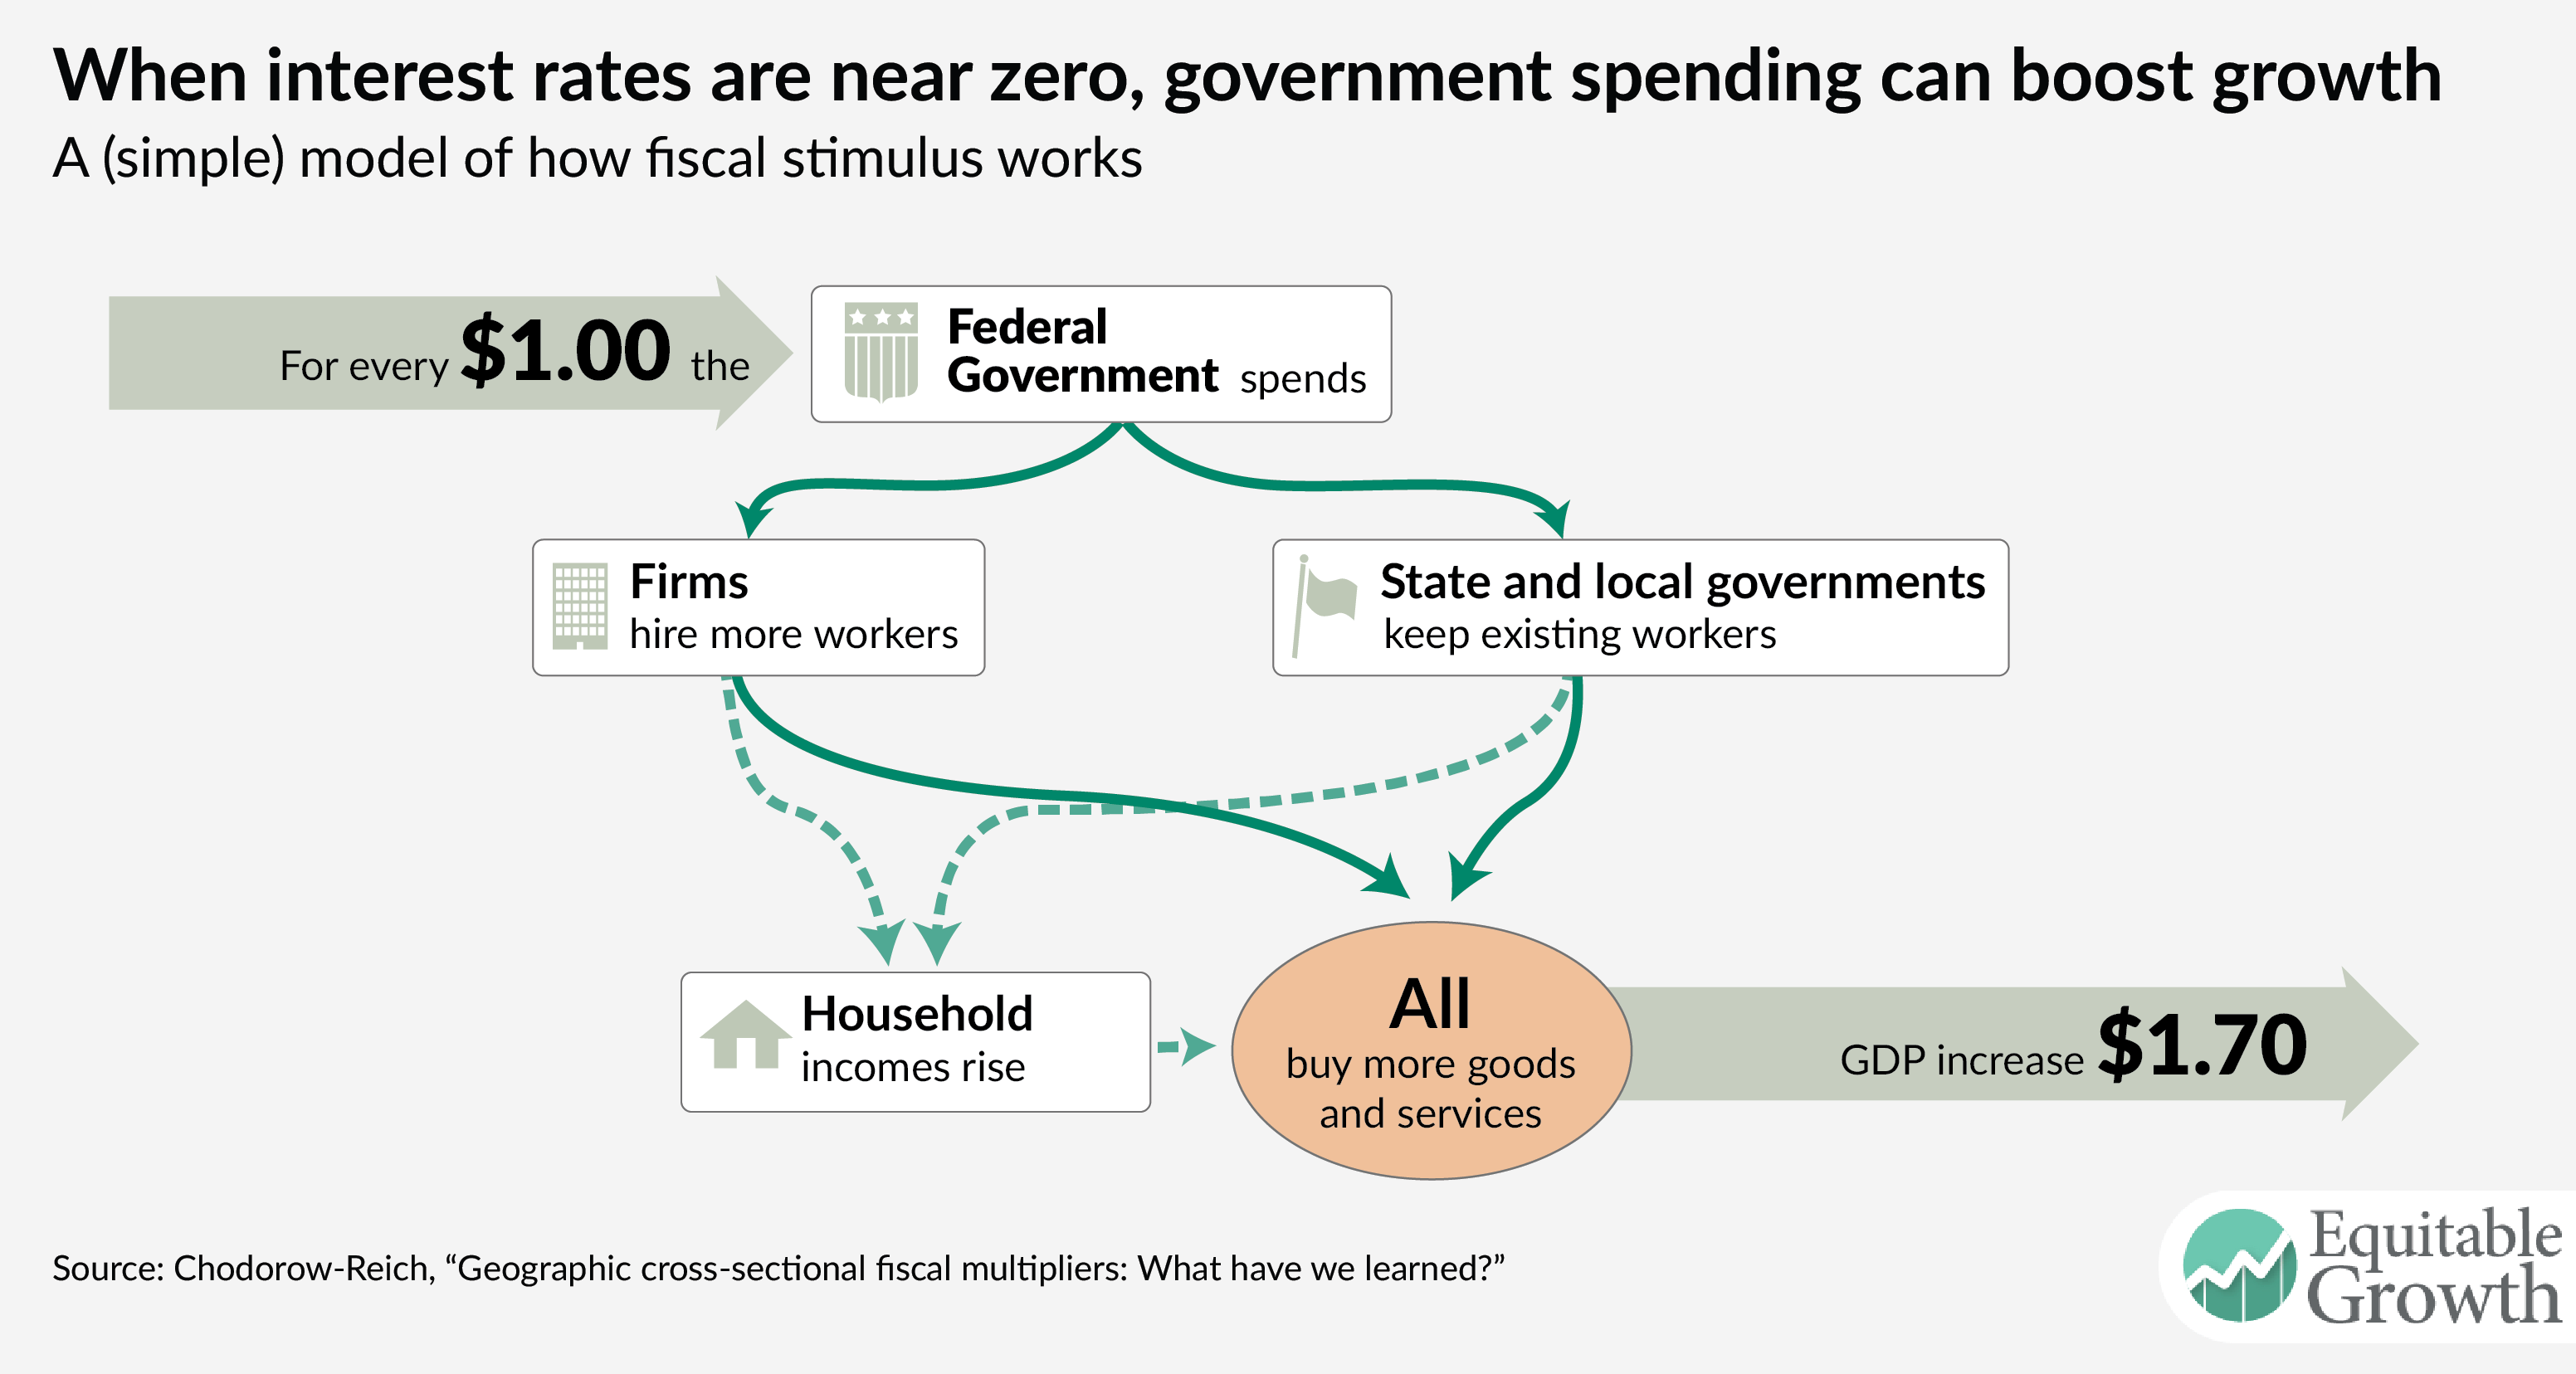
An example based on three papers studying the effects of the Recovery and Reinvestment Act makes clear the meaning of a cross-sectional multiplier. These papers exploit variation in the non-discretionary, formulaic component of the distribution of ARRA funds, due to factors such as pre-recession Medicaid spending or the number of lane miles of federal highway. I combine the spending variation in the three studies and use updated employment data and new state output data to estimate cross-sectional instrumental variable regressions of the cumulative increase in employment and output during 2009 and 2010 as a function of ARRA spending in a state. I find a cross-sectional “cost per job” of roughly $50,000 and output multiplier of roughly 1.75.
A review of the recent empirical literature broadly confirms the lessons from this example. One strand of this literature examines various components of the Recovery Act. The cost-per-job across these studies ranges from roughly $25,000 to $125,000, with around $50,000 emerging as a preferred number. Using a production-function approach, this magnitude translates loosely into an output multiplier of about 2. Another set of recent papers uses variation from historical episodes or other countries, many quite creatively. The diversity of outcome variables and policy experiments makes reaching a synthesized conclusion across these studies harder. Nonetheless, those papers that estimate a cost-per-job find numbers of around $30,000, and (with one or two notable exceptions) those which estimate income or output multipliers find numbers in the range of 1.0 to 2.5.
Research into the mapping between cross-sectional multipliers and national multipliers also has advanced. Three main differences can arise, depending on who pays for the spending, what monetary policy does, and the different openness of regions and the country as a whole.
Starting with the first, in many cross-sectional multiplier studies the spending does not affect the present value of local tax burdens, for example, because the spending is paid for by the federal government. Standard economic theory, however, suggests that such outside financing can have a small effect on local output. Fully rational, forward-looking, liquidity unconstrained households (sometimes denoted as so called “Ricardian agents”) will increase their private spending by only the annuity value of the outside transfer, which for transitory spending implies a small increase relative to the direct change in government purchases, while spending by fully “rule-of-thumb” or “liquidity-constrained” agents does not depend at all on the present value of the tax burden. In either case, the fact that the financing of the spending comes from outside the region adds little to the local private-spending response.
Monetary tightening in response to higher spending may reduce the output impact. Therefore, cross-sectional multipliers best help to characterize national multipliers when monetary policy is constrained, for example, by a zero lower bound on interest rates. Finally, expenditure switching and import leakage exert a downward influence on regional multipliers relative to the aggregate multiplier.
Combining these three arguments, the cross-sectional multiplier offers a rough lower bound for a national multiplier as long as the spending is relatively transient and monetary policy is constrained. These conditions appear likely to hold in many empirical settings, including during the implementation of the Recovery Act.
Combining the empirical evidence and the recent theory, the cross-sectional studies suggest a closed economy, constrained monetary policy, deficit-financed multiplier of about 1.7 or above. This magnitude falls at the upper end of the range suggested by earlier studies using time series variation only.
The cross-sectional literature and my review essay have focused their attention most on understanding what cross-sectional multipliers imply about national multipliers. Other lessons also emerge. Foremost, many of the cross-sectional studies test for and find evidence of higher multipliers or less crowd-out in regions and periods with more unused resources. These results suggest multipliers may be larger during downturns and for reasons beyond constraints on monetary policy.
I conclude this summary with a comment on research practices. In the wake of the Great Recession of 2007-09, many have criticized the economics profession and macroeconomists in particular. The foray into cross-sectional multipliers offers a positive example of economists directing their research toward understanding newly relevant policy levers. Necessarily, the effort involved both empirical and theoretical advances. As a result, I believe we have a better grasp of the efficacy of fiscal policy than we did before the Great Recession started.
— Gabriel Chodorow-Reich is an assistant professor of economics at Harvard University. His research focuses on macroeconomics, finance, and labor markets. His working paper upon which this column is drawn can be found here.
Are we better off than our parents?
The data that underscores the fading “American dream”
Every parent hopes that their children will have a better standard of living than their own: it is a defining feature of the American Dream. Yet this opportunity is fading for many Americans. New research by Raj Chetty, David Grusky, and Maximillian Hell (Stanford University), Nathaniel Hendren and Robert Manduca (Harvard University), and Jimmy Narang (University of California-Berkeley) shows that “absolute income mobility”—the fraction of children that are earning more than their parents—has declined over the past half century due to rising inequality. Here are some key facts from their analysis.1
Download FileThe-fading-American-dream
Absolute income mobility has declined for Americans across the entire income spectrum
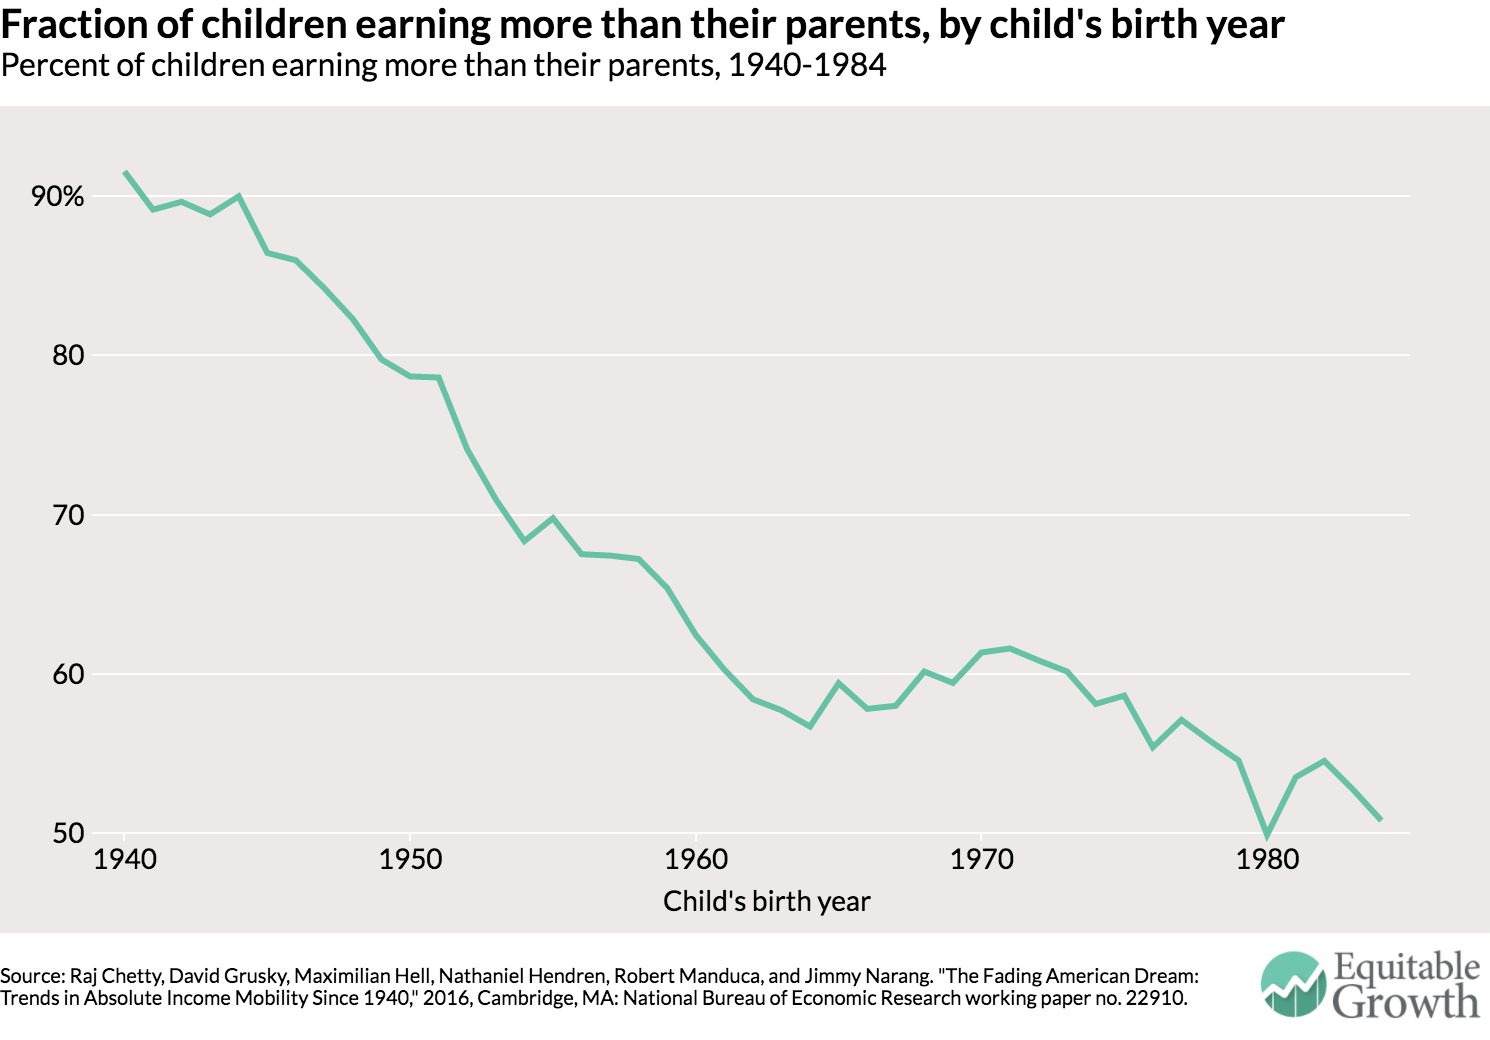
Rates of absolute income mobility in the United States have fallen sharply since 1940. Ninety-two percent of children born in 1940 earned more than their parents in inflation-adjusted terms. In contrast, only 50 percent of children born in 1984 earned more than their parents. (See Figure 1.) The downward trend in absolute mobility persists when using alternate inflation adjustments, accounting for taxes and transfers, measuring income at later ages, and adjusting for changes in household size.
Figure 1
The middle class saw the largest rate of decline. Absolute income mobility fell across the entire income spectrum, but the middle class experienced the largest declines in the likelihood of children earning more than their parents.
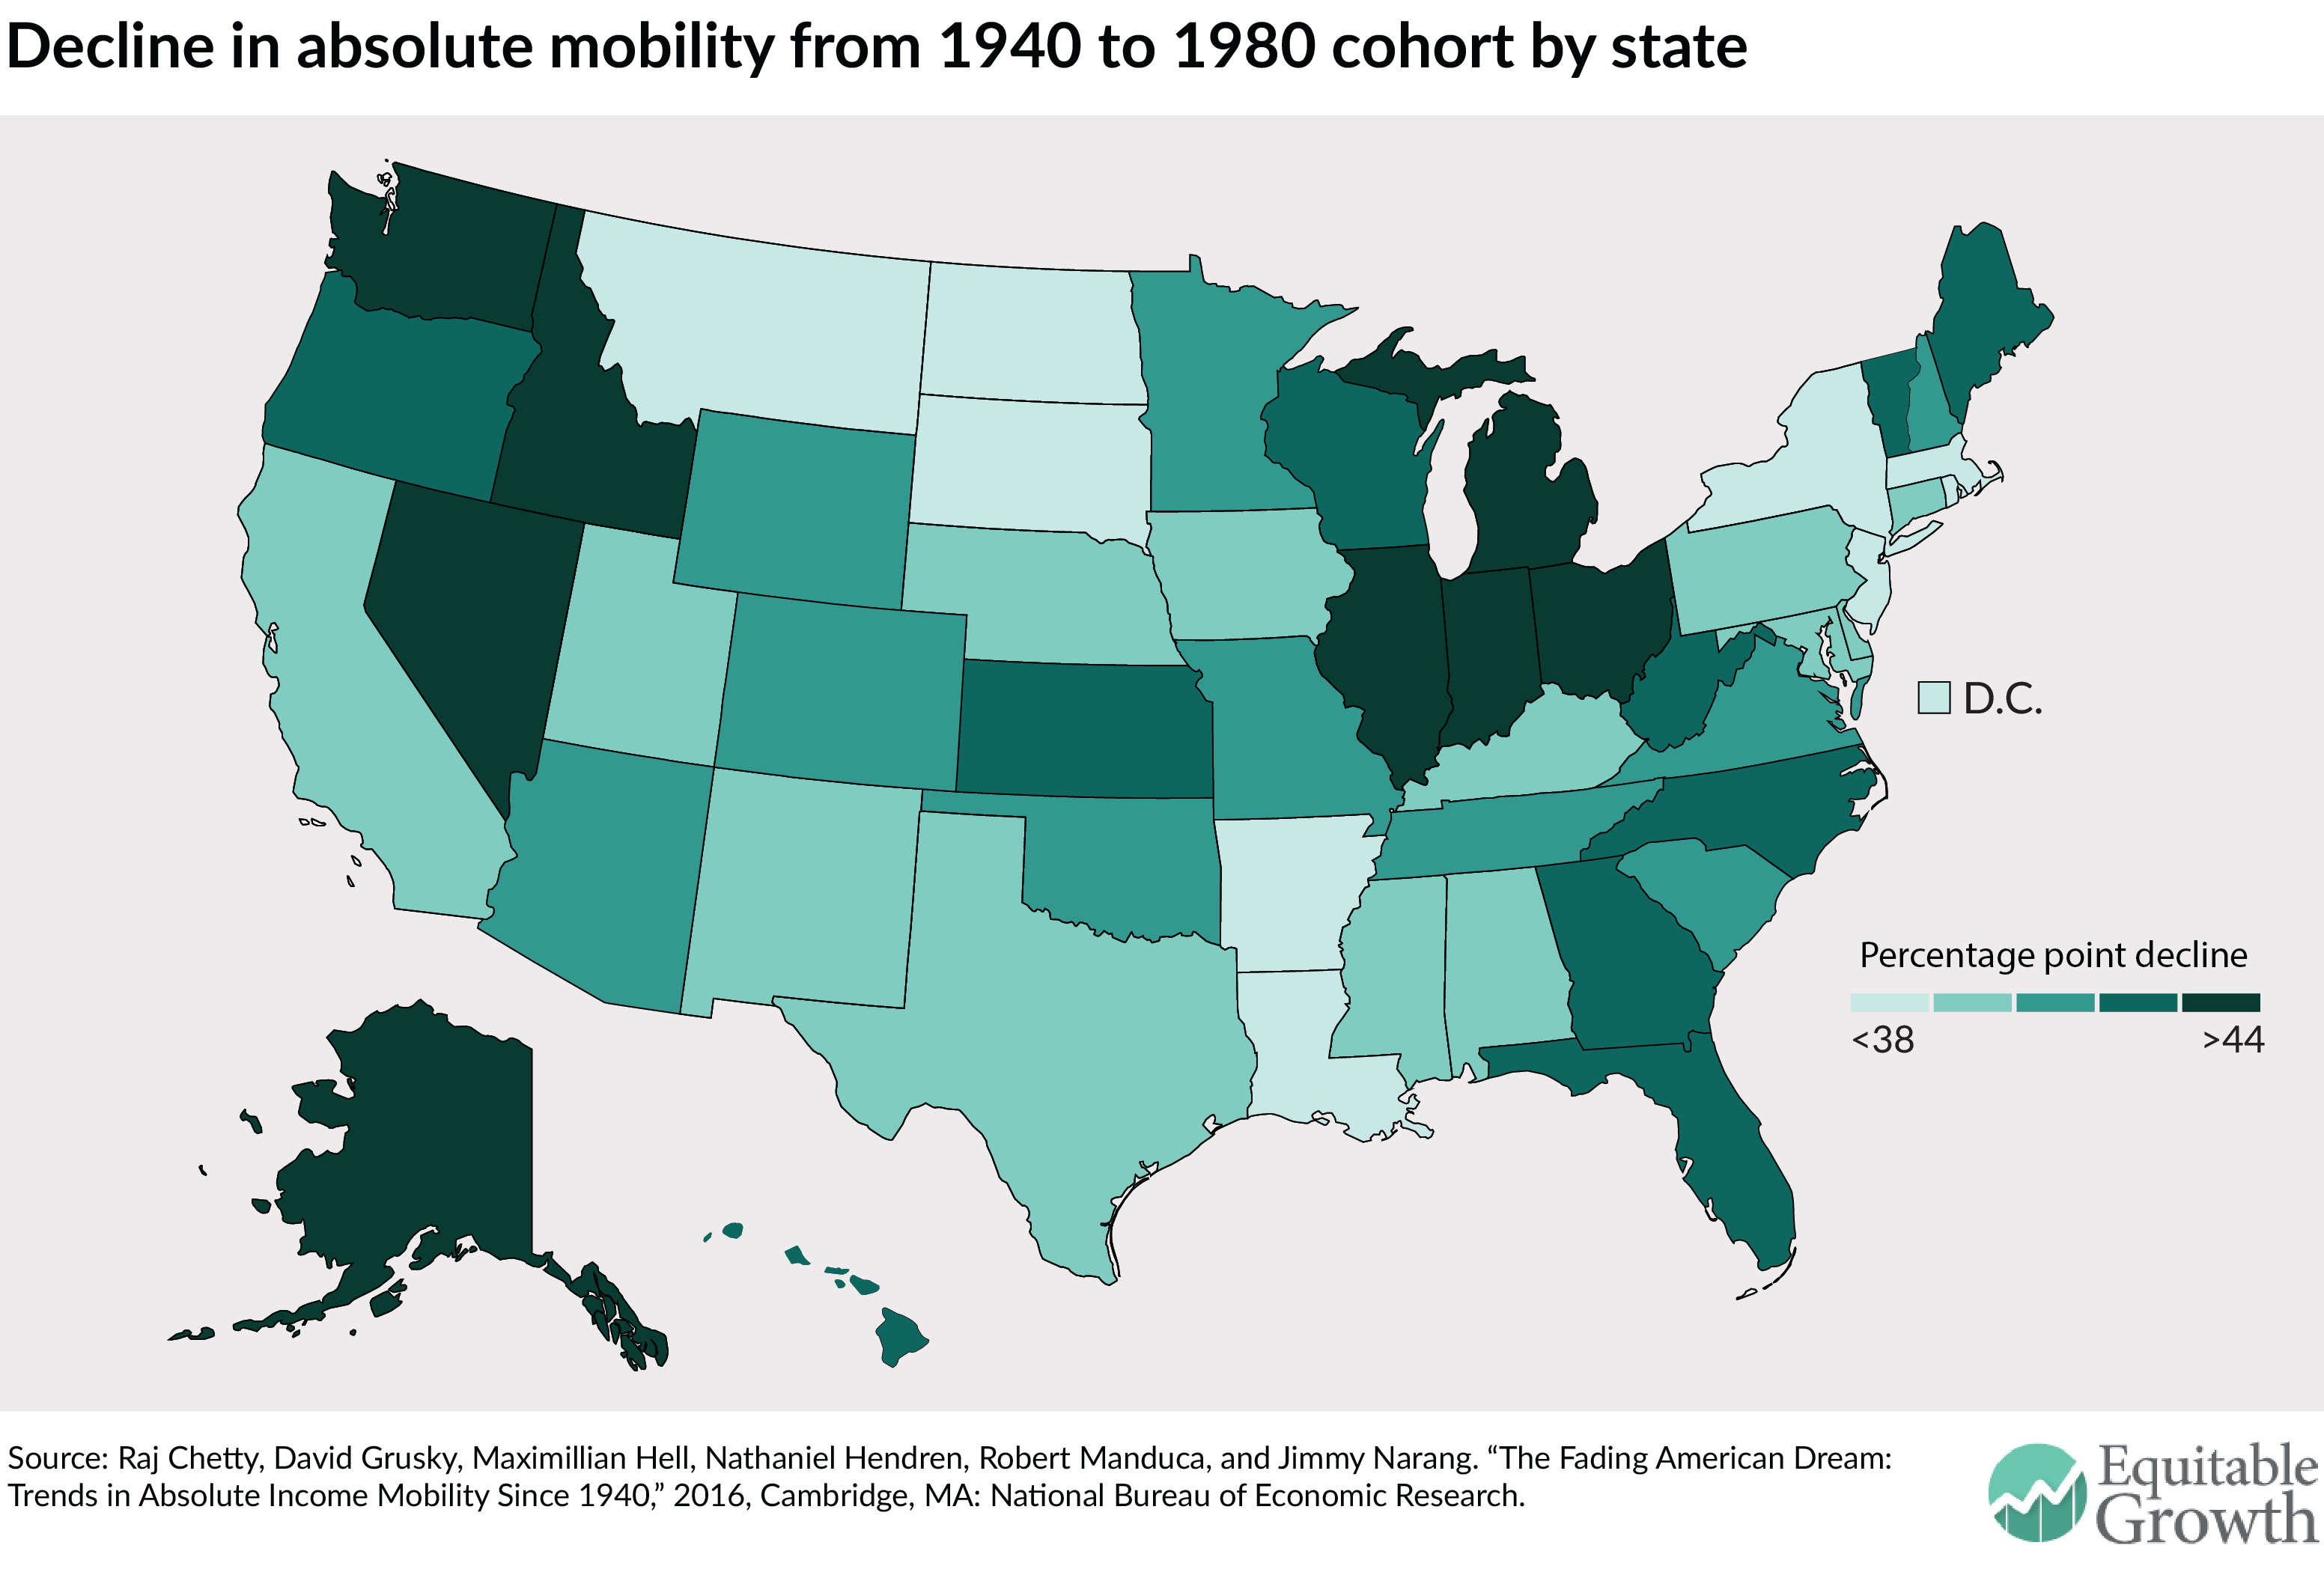
The largest declines are concentrated in Rust Belt states. Absolute income mobility fell in all 50 states and the District of Columbia, but the largest declines were concentrated in the Rust Belt states, such as Michigan and Indiana (which registered 49 and 46 percentage-point declines, respectively). The smallest declines occurred in Massachusetts, New York, and Montana, which recorded absolute mobility declines of approximately 35 percentage points. (See Figure 2 and table, below.)
Figure 2
Men’s economic prospects declined dramatically. Ninety-five percent of men born in 1940 earned more than their fathers compared to 41 percent in 1984 (a 54 percentage-point decline). The fraction of daughters earning more than their fathers fell from 43 percent of women born in 1940 to 26 percent of women born in 1984.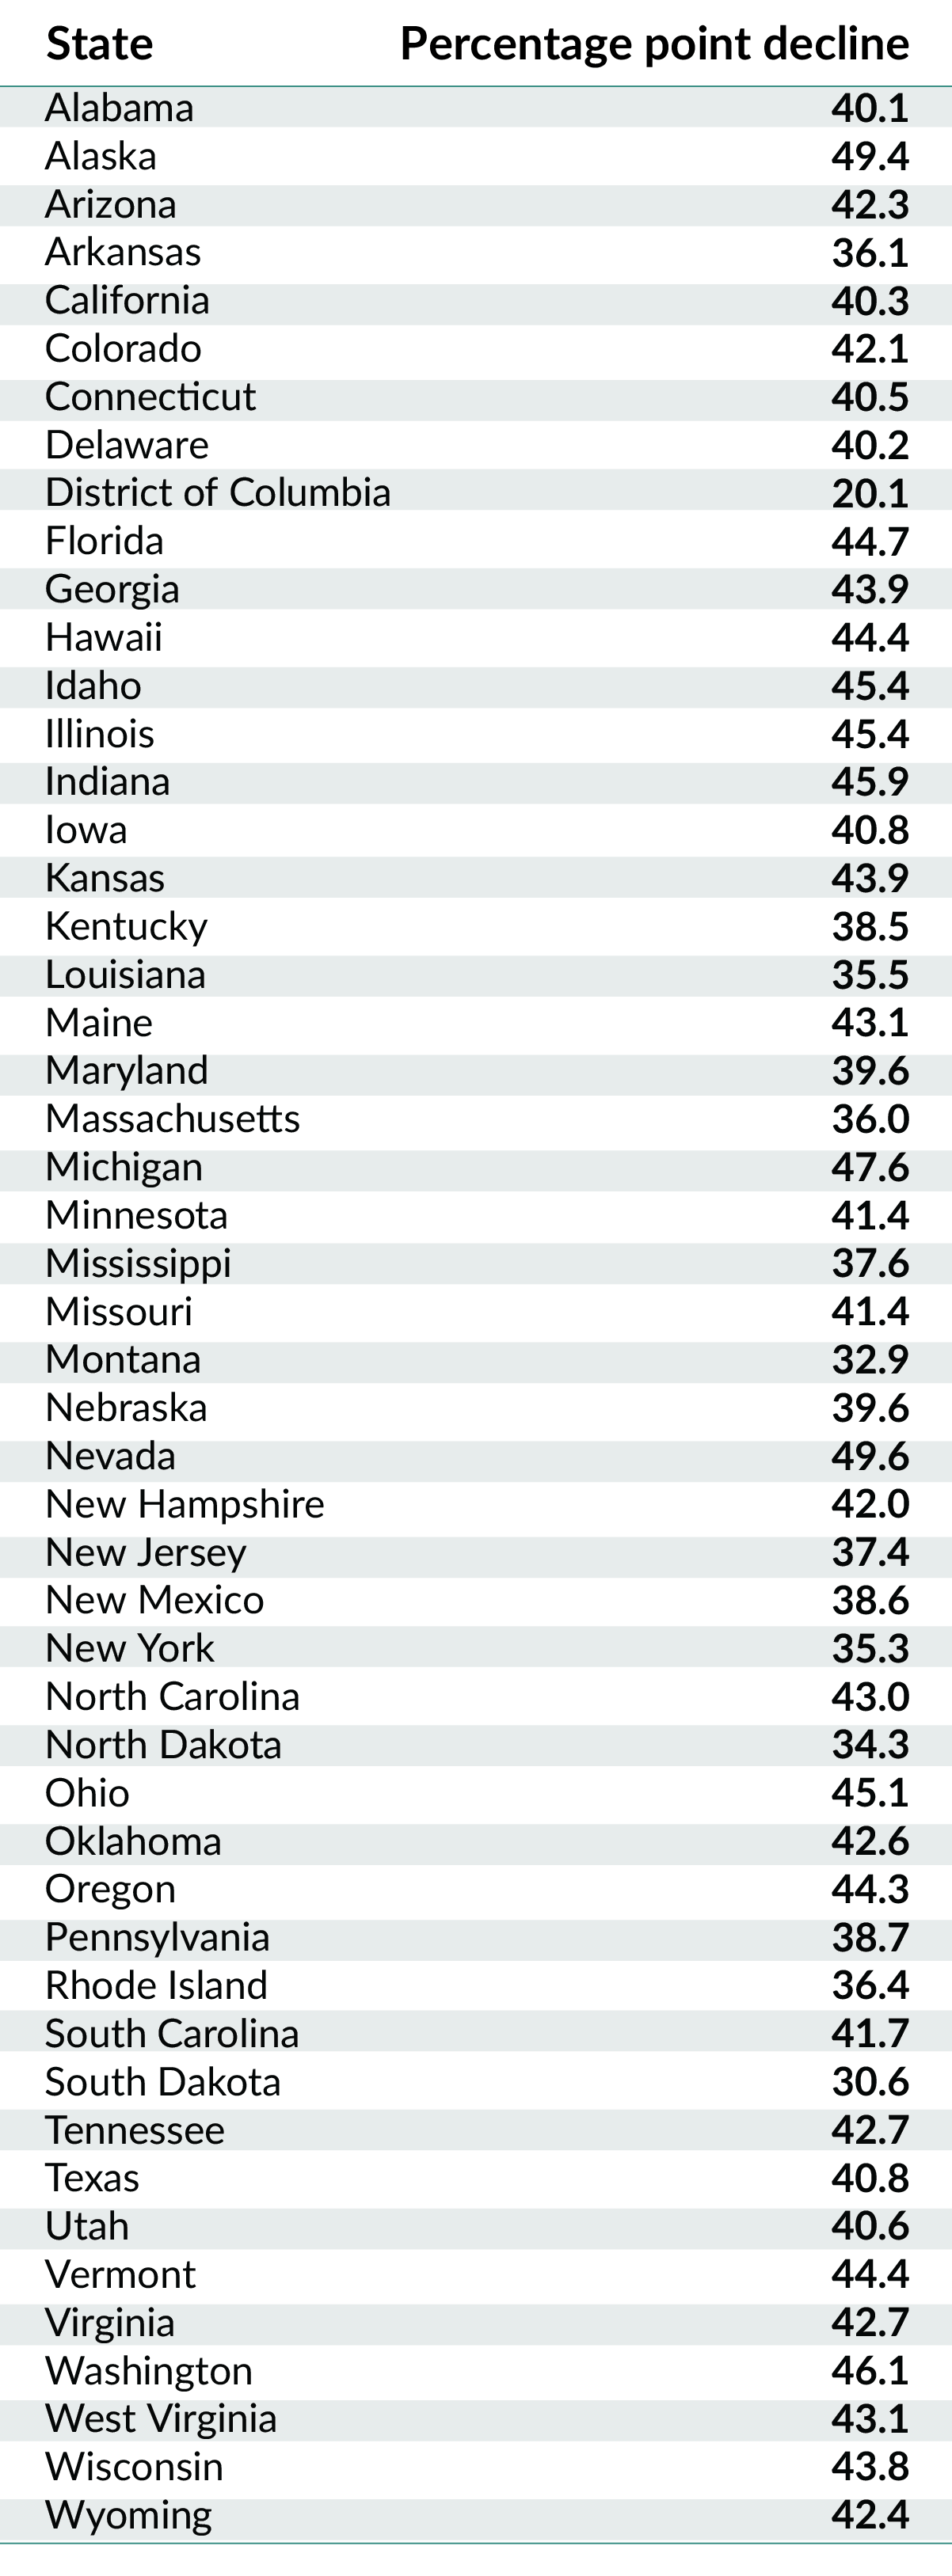
In order to revive the American dream, we must address inequality
The decline in absolute mobility is driven by inequality and the unequal distribution of economic growth. Children born in 1980 experienced lower growth in gross domestic product, the broadest measure of economic growth, compared to those in the 1940s and 1950s, but the authors find that the decline is absolute income mobility was driven primarily by the increasingly unequal distribution of GDP growth rather than by the slowdown in aggregate economic growth.
Higher growth rates alone are insufficient to restore absolute mobility. Because a large fraction of economic growth goes to a smaller fraction of high-income households today compared to the 1940s and 1950s, higher GDP growth does not automatically increase the number of children who earn more than their parents.
Maintaining GDP growth at its current level but distributing it as it was distributed for children born in the 1940s would increase the likelihood that children earn more than their parents to 80 percent, thereby reversing more than two-thirds of the decline in absolute mobility.
Economic growth in the United States: A tale of two countries

Overview
The rise of economic inequality is one of the most hotly debated issues today in the United States and indeed in the world. Yet economists and policymakers alike face important limitations when trying to measure and understand the rise of inequality.
One major problem is the disconnect between macroeconomics and the study of economic inequality. Macroeconomics relies on national accounts data to study the growth of national income while the study of inequality relies on individual or household income, survey and tax data. Ideally all three sets of data should be consistent, but they are not. The total flow of income reported by households in survey or tax data adds up to barely 60 percent of the national income recorded in the national accounts, with this gap increasing over the past several decades.2
This disconnect between the different data sets makes it hard to address important economic and policy questions, such as:
- What fraction of economic growth accrues to those in the bottom 50 percent, the middle 40 percent, and the top 10 percent of the income distribution?
- What part of the rise in inequality is due to to changes in the share of national income that goes to workers (labor income) and owners (capital income) versus changes in how these labor and capital incomes are distributed among individuals?
A second major issue is that economists and policymakers do not have a comprehensive view of how government programs designed to ameliorate the worst effects of economic inequality actually affect inequality. Americans share almost one-third of the fruits of economic output (via taxes that help pay for an array of social services) through their federal, state, and local governments. These taxes collectively add up to about 30 percent of national income, and are used to fund transfers and public goods that ultimately benefit all U.S. families. Yet we do not have a clear measure of how the distribution of pre-tax income differs from the distribution of income after taxes are levied and after government spending is taken into account. This makes it hard to assess the extent to which governments make income growth more equal.3
In a recent paper, the three authors of this issue brief attempt to create inequality statistics for the United States that overcome the limitations of existing data by creating distributional national accounts.4 We combine tax, survey, and national accounts data to build a new series on the distribution of national income. National income is the broadest measure of income published in the national accounts and is conceptually close to gross domestic product, the broadest measure of economic growth.5 Our distributional national accounts enable us to provide decompositions of growth by income groups consistent with macroeconomic growth.
Related
How to deliver equitable growth: 14 strategies for the next administration
In our paper, we calculate the distribution of both pre-tax and post-tax income. The post-tax series deducts all taxes and then adds back all transfers and public spending so that both pre-tax and post-tax incomes add up to national income. This allows us to provide the first comprehensive view of how government redistribution in the United States affects inequality. Our benchmark series use the adult individual as the unit of observation and split income equally among spouses in married couples. But we also produce series where each spouse is assigned their own labor income, allowing us to study gender inequality and its impact on overall income inequality. In this short summary, we would like to highlight three striking findings.
Our first finding—a surge in income inequality
First, our data show that the bottom half of the income distribution in the United States has been completely shut off from economic growth since the 1970s. From 1980 to 2014, average national income per adult grew by 61 percent in the United States, yet the average pre-tax income of the bottom 50 percent of individual income earners stagnated at about $16,000 per adult after adjusting for inflation.6 In contrast, income skyrocketed at the top of the income distribution, rising 121 percent for the top 10 percent, 205 percent for the top 1 percent, and 636 percent for the top 0.001 percent. (See Figures 1 and 2.)
Figure 1
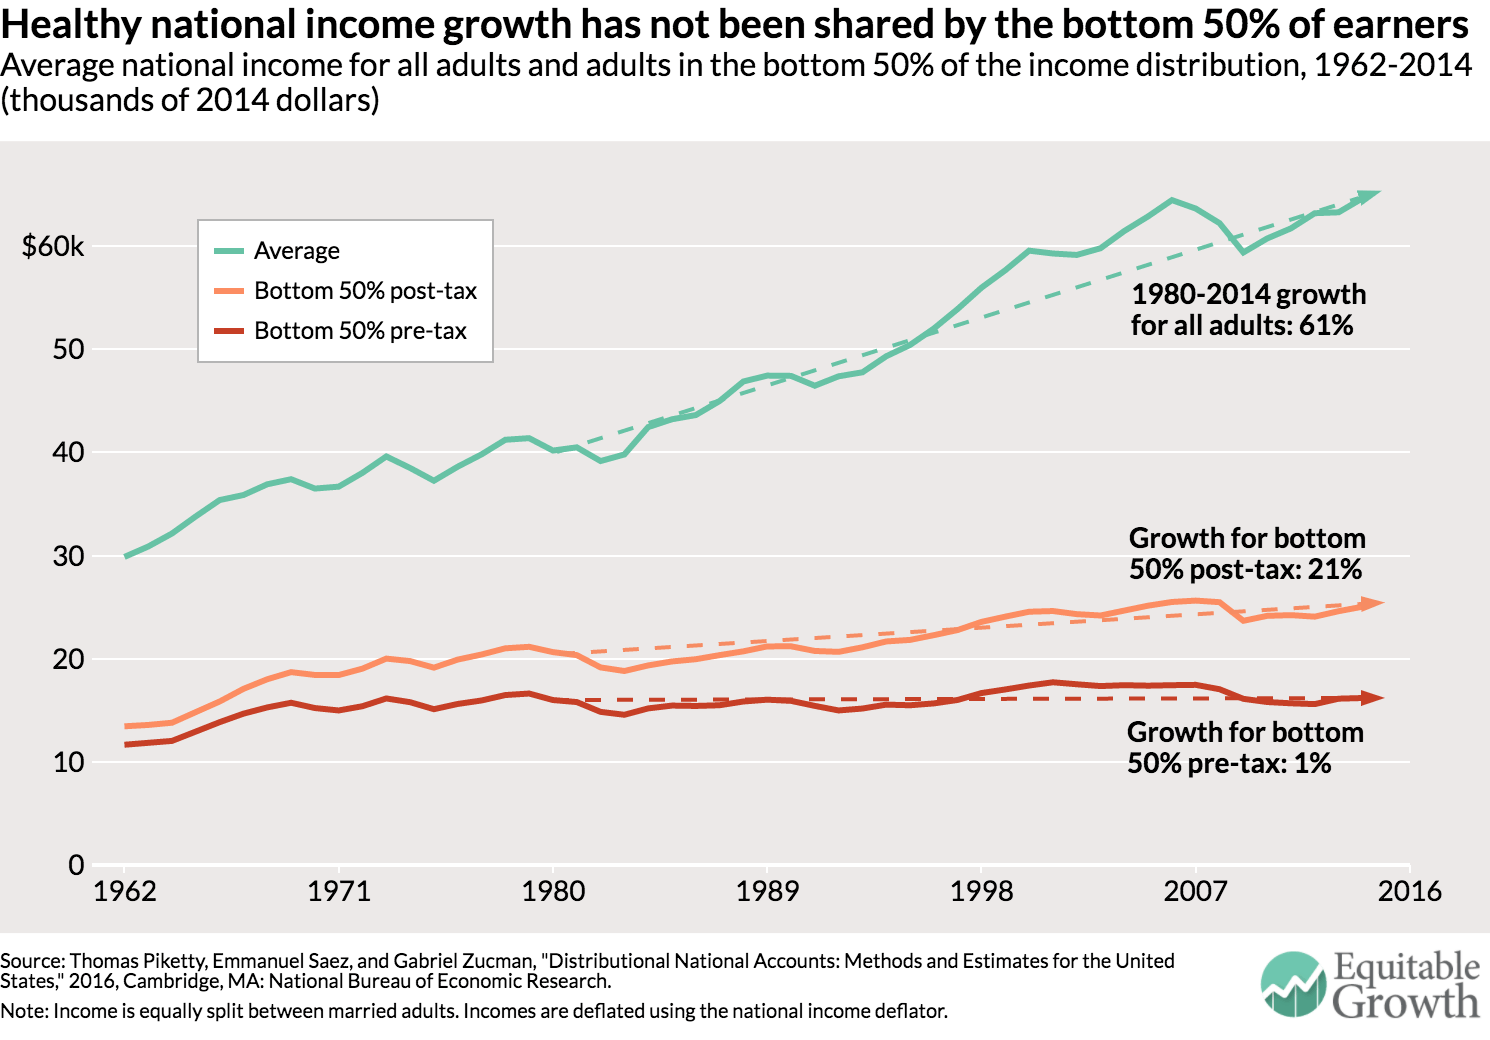
Figure 2
It’s a tale of two countries. For the 117 million U.S. adults in the bottom half of the income distribution, growth has been non-existent for a generation while at the top of the ladder it has been extraordinarily strong. And this stagnation of national income accruing at the bottom is not due to population aging. Quite the contrary: For the bottom half of the working-age population (adults below 65), income has actually fallen. In the bottom half of the distribution, only the income of the elderly is rising.7 From 1980 to 2014, for example, none of the growth in per-adult national income went to the bottom 50 percent, while 32 percent went to the middle class (defined as adults between the median and the 90th percentile), 68 percent to the top 10 percent, and 36 percent to the top 1 percent. An economy that fails to deliver growth for half of its people for an entire generation is bound to generate discontent with the status quo and a rejection of establishment politics.
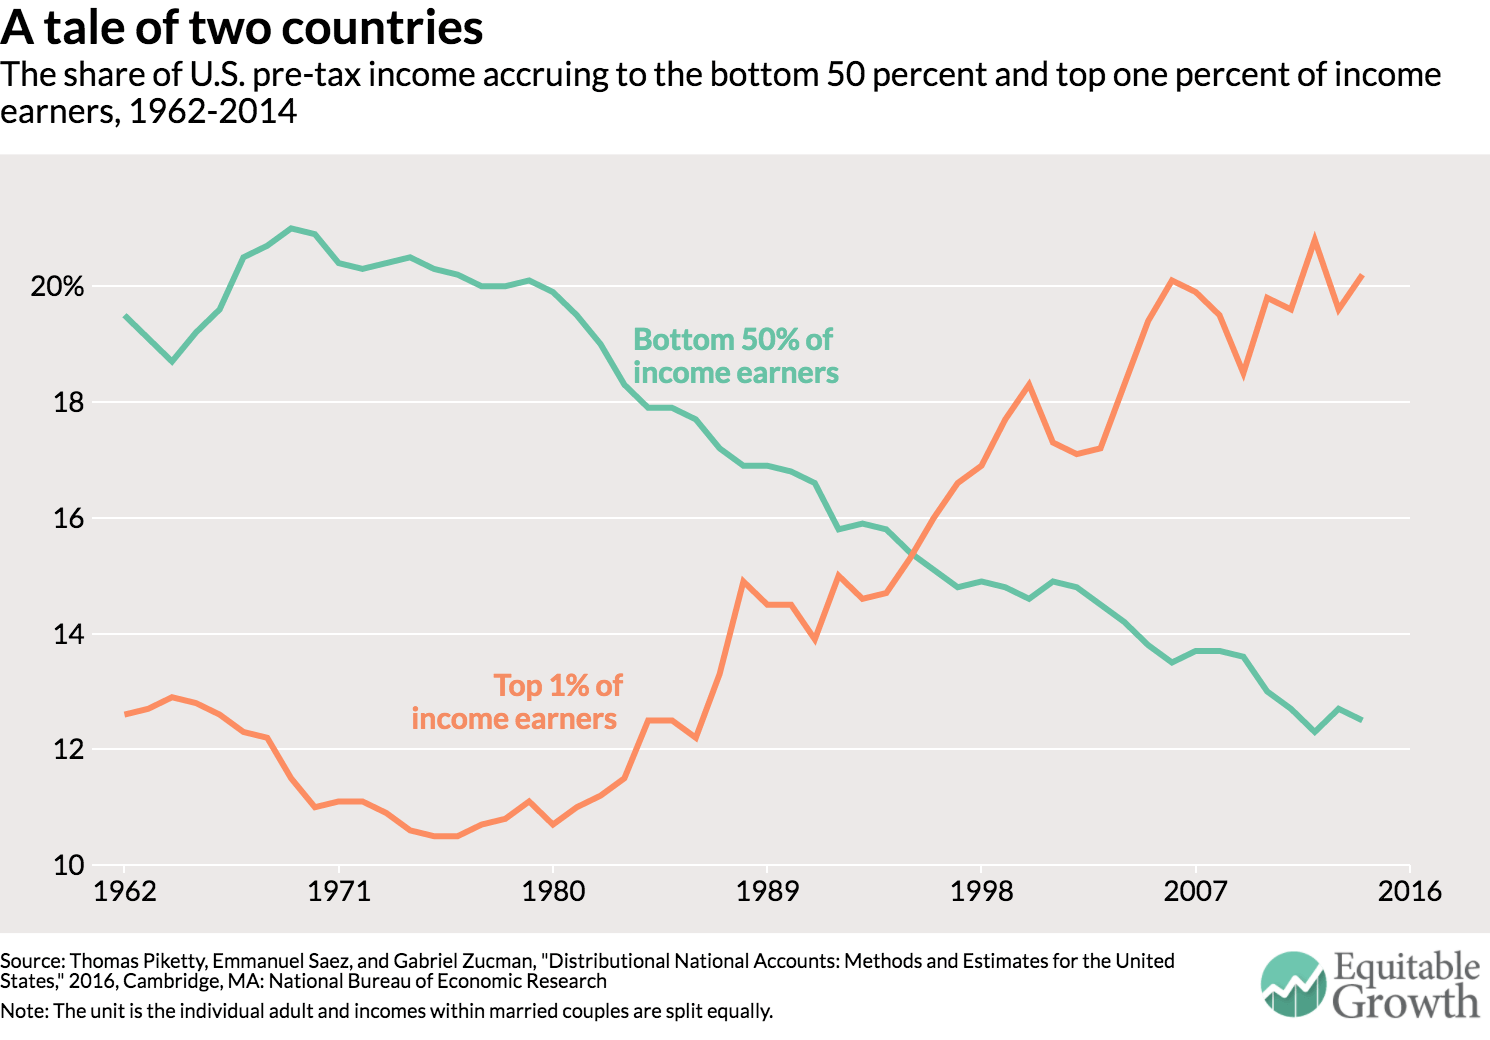
Because the pre-tax incomes of the bottom 50 percent stagnated while average national income per adult grew, the share of national income earned by the bottom 50 percent collapsed from 20 percent in 1980 to 12.5 percent in 2014. Over the same period, the share of incomes going to the top 1 percent surged from 10.7 percent in 1980 to 20.2 percent in 2014.8 As shown in Figure 2, these two income groups basically switched their income shares, with about 8 points of national income transferred from the bottom 50 percent to the top 1 percent. The gains made by the 1 percent would be large enough to fully compensate for the loss of the bottom 50 percent, a group 50 times larger.
To understand how unequal the United States is today, consider the following fact. In 1980, adults in the top 1 percent earned on average 27 times more than bottom 50 percent of adults. Today they earn 81 times more. This ratio of 1 to 81 is similar to the gap between the average income in the United States and the average income in the world’s poorest countries, among them the war-torn Democratic Republic of Congo, Central African Republic, and Burundi. Another alarming trend evident in this data is that the increase in income concentration at the top in the United States over the past 15 years is due to a boom in capital income. It looks like the working rich who drove the upsurge in income concentration in the 1980s and 1990s are either retiring to live off their capital income or passing their fortunes onto heirs.
Our second finding—policies to ameliorate income inequality fall woefully short
Our second main finding is that government redistribution has offset only a small fraction of the increase in pre-tax inequality. As shown in Figure 1, the average post-tax income of the bottom 50 percent of adults increased by only 21 percent between 1980 and 2014, much less than average national income. This meager increase comes with two important limits.
First, there was almost no growth in real (inflation-adjusted) incomes after taxes and transfers for the bottom 50 percent of working-age adults over this period because even as government transfers increased overall, they went largely to the elderly and the middle class. Second, the small rise of the average post-tax income of the bottom 50 percent of income earners comes entirely from in-kind health transfers and public goods spending. The disposable post-tax income—including only cash transfers—of the bottom 50 percent stagnated at about $16,000. For the bottom 50 percent, post-tax disposable income and pre-tax income are similar—this group pays roughly as much in taxes as it receives in cash transfers.
Our third finding—comparing income inequality among countries is enlightening
Third, an advantage of our new series is that it allows us to directly compare income across countries. Our long-term goal is to create distributional national accounts for as many countries as possible; all the results will be made available online on the World Wealth and Income Database. One example of the value of these efforts is to compare the average bottom 50 percent pre-tax incomes in the United States and France.9 In sharp contrast with the United States, in France the bottom 50 percent of real (inflation-adjusted) pre-tax incomes grew by 32 percent from 1980 to 2014, at approximately the same rate as national income per adult. While the bottom 50 percent of incomes were 11 percent lower in France than in the United States in 1980, they are now 16 percent higher. (See Figure 3.)
Figure 3
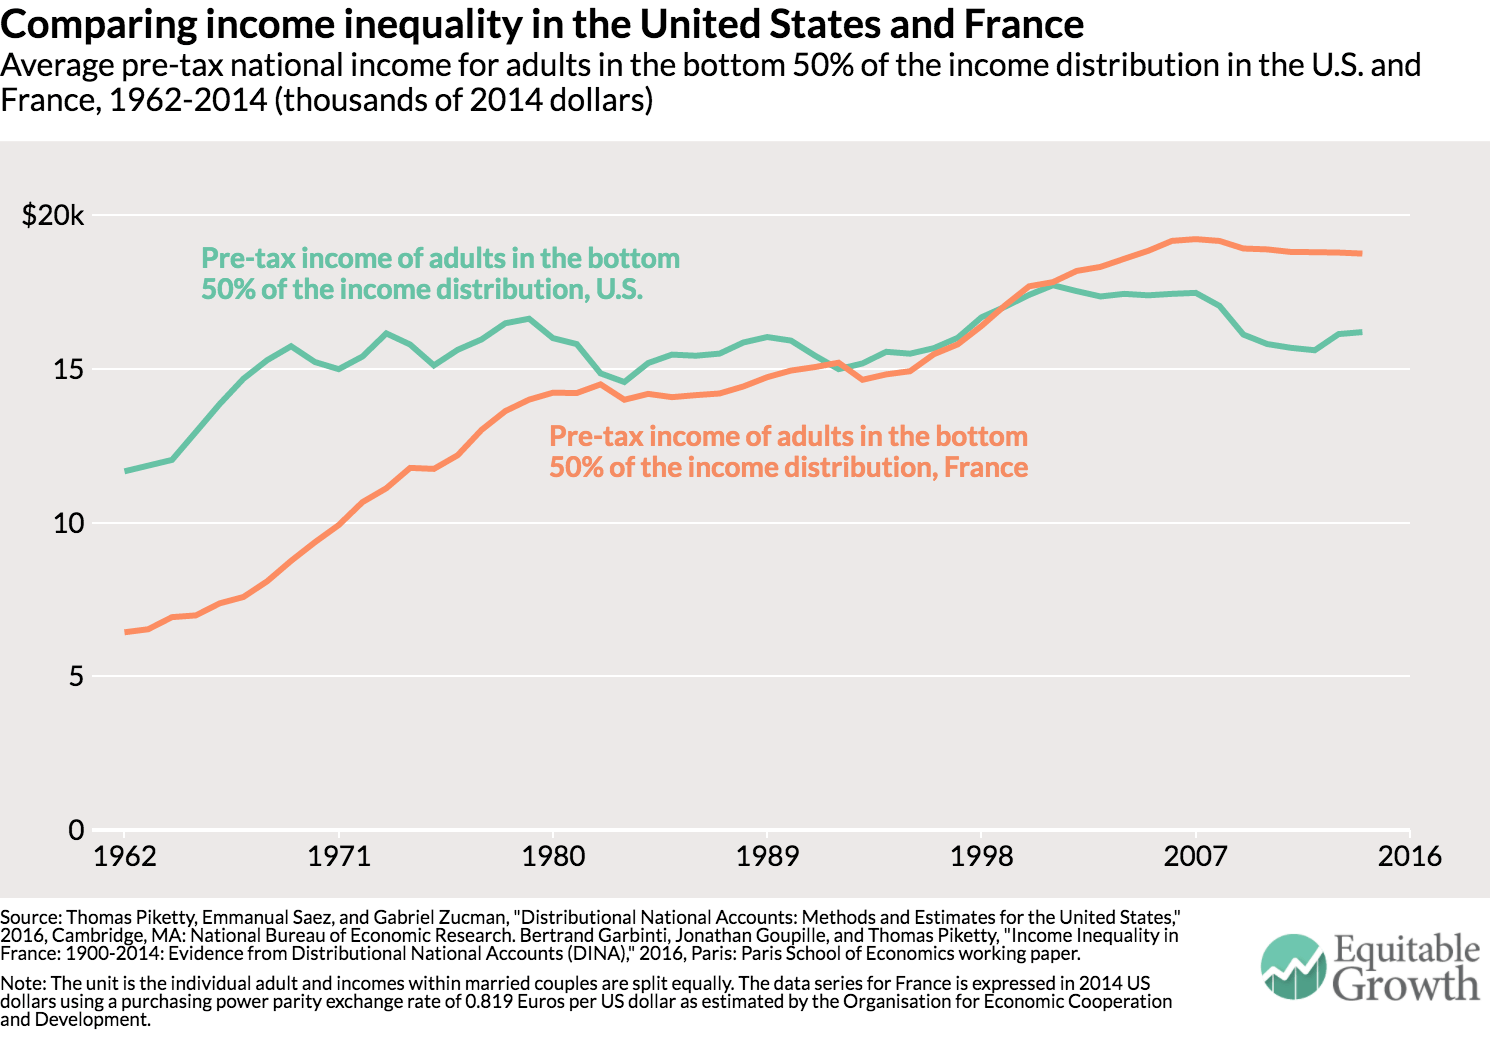
The bottom 50 percent of income earners makes more in France than in the United States even though average income per adult is still 35 percent lower in France than in the United States (partly due to differences in standard working hours in the two countries).10 Since the welfare state is more generous in France, the gap between the bottom 50 percent of income earners in France and the United States would be even greater after taxes and transfers.
The diverging trends in the distribution of pre-tax income across France and the United States—two advanced economies subject to the same forces of technological progress and globalization—show that working-class incomes are not bound to stagnate in Western countries. In the United States, the stagnation of bottom 50 percent of incomes and the upsurge in the top 1 percent coincided with drastically reduced progressive taxation, widespread deregulation of industries and services, particularly the financial services industry, weakened unions, and an eroding minimum wage.
Conclusion
Given the generation-long stagnation of the pre-tax incomes among the bottom 50 percent of wage earners in the United States, we feel that the policy discussion at the federal, state, and local levels should focus on how to equalize the distribution of human capital, financial capital, and bargaining power rather than merely the redistribution of national income after taxes. Policies that could raise the pre-tax incomes of the bottom 50 percent of income earners could include:
- Improved education and access to skills, which may require major changes in the system of education finance and admission
- Reforms of labor market institutions to boost workers’ bargaining power and including a higher minimum wage
- Corporate governance reforms and worker co-determination of the distribution of profits
- Steeply progressive taxation that affects the determination of pay and salaries and the pre-tax distribution of income, particularly at the top end
The different levels of government in the United States today obviously have the power to make income distribution more unequal, but they also have the power to make economic growth in America more equitable again. Potentially pro-growth economic policies should always be discussed alongside their consequences for the distribution of national income and concrete ways to mitigate their unequalizing effects. We hope that the distributional national accounts we present today can prove to be useful for such policy evaluations.
We will post online our complete distributional national accounts micro-data. These micro-files make it possible for researchers, journalists, policymakers, and any interested user to compute a wide array of distributional statistics—income, wealth, taxes paid and transfers received by age, gender, marital status, and other measures—and to simulate the distributional consequences of tax and transfer reforms in the United States.
—Thomas Piketty is a professor of economics at the Paris School of Economics. Emmanuel Saez is a professor of economics and director of the Center for Equitable Growth at the University of California-Berkeley. Gabriel Zucman is an assistant professor of economics at the University of California-Berkeley. They are co-directors of the World Wealth and Income Database, together with economists Facundo Alvaredo at the Paris School of Economics and Anthony Atkinson at Oxford University.
A Child Tax Credit primer
The analysis “A Child Tax Credit primer” contained errors that had been identified by Equitable Growth. Before the errors could be corrected, Congress enacted major tax legislation that substantially changed the policies discussed in the piece. As a result, Equitable Growth no longer plans to post a corrected version of the analysis and has removed the original.
Taxing the rich more—evidence from the 2013 federal tax increase

One of the most contentious aspects of the tax policy debate in the United States today is the proper level of taxation of the rich. In the current presidential election contest, Hillary Clinton proposes to increase taxes on the rich while Donald Trump proposes to cut taxes on the rich. This policy decision is particularly important because the concentration of income at the top is extremely high. The share of total pre-tax income earned by the top 1 percent of families has more than doubled from 8.9 percent in 1975 to 22 percent in 2015.
Progressive taxation historically is the most powerful tool to reduce income concentration. The classic counter argument is that higher top tax rates might discourage economic activity among the rich. In a recent paper, I analyze the effects of the 2013 federal income tax increase on the behavior of top income earners to cast light on this issue.
In 2013, a surtax on high earners was levied to help pay for the Affordable Care Act at the same time as the 2001 tax cuts for high-income earners that were signed into law by President George W. Bush expired. The 2013 tax increase on high earners was the largest since the 1950s, and larger than the previous increase of the top tax rate by the Clinton administration in 1993. The 2013 tax increase is concentrated among the top 1 percent of income earners. The Congressional Budget Office statistics show that the average federal tax rate—comprised of all federal taxes (individual, corporate, and payroll)—on the top 1 percent of income earners rose by 5 points, from 29 percent before 2013 to 34 percent in 2013.
Besides this direct increase in their tax burden, how did the 2013 tax increase affect the behavior of the rich and the pre-tax incomes they reported on their tax returns? The relevant concept for behavioral responses to taxation is the marginal tax rate, which measures how much you have to pay in taxes on an extra dollar of earnings. At a marginal tax rate of 40 percent, for example, you would have to pay $40 extra in taxes if you earn $100 or more. The 2013 tax increase raised the top marginal tax rate on capital income (including realized capital gains, dividends, and other forms of taxable capital income) by about 9 points, and on labor income (wages and salaries, and self-employment income) by about 6 points. The accompanying chart, which depicts the top 1 percent’s share of pre-tax income since 1975, answers two important tax policy questions about the effects of the 2013 tax increase on pre-tax incomes reported by the rich in the short term and the medium term. (See Figure 1.)
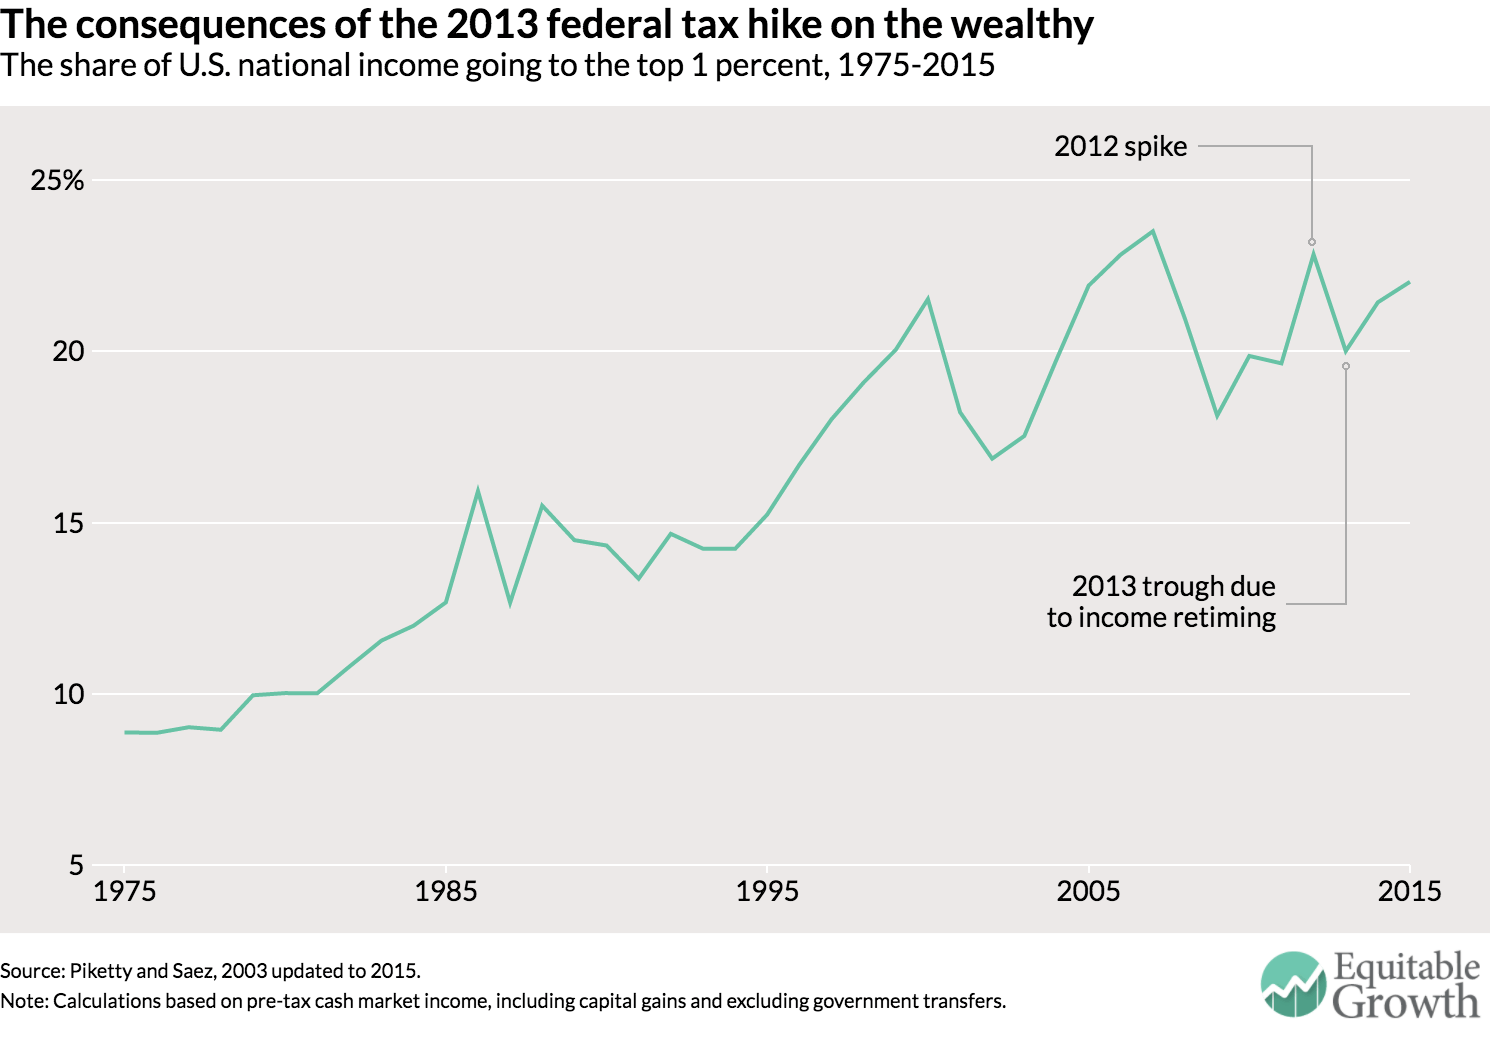
First, in the short-term, there is a clear surge in reported top incomes in 2012 in anticipation of the 2013 tax increase. The top 1 percent’s income share increases sharply, from 19.6 percent in 2011 to 22.8 percent in 2012—the largest year-to-year increase over the past 25 years—before falling sharply back to 20 percent in 2013. The stock market booms of the late 1990s and mid-2000s, and economic downturns of the early 2000s and late 2000s, produced large fluctuations in the top 1 percent’s share of national income. But this cannot be the explanation for the 2012-2013 pattern, as the U.S. economy was growing at a modest but regular pace between 2011 to 2015 and stock prices were increasing steadily during all of these years.
That unusual pattern in those two years is due to behavioral responses to taxation, in the form of income retiming. After President Obama was re-elected in early November 2012, it was virtually certain that top income tax rates would go up in 2013. For the rich, shifting $100 of income from 2013 to 2012 saves $9 in taxes for capital income (and $6 for labor income), which means the rich had strong incentives to accelerate their incomes into 2012 to benefit from the lower 2012 tax rates and avoid the higher 2013 tax rates.
Consistent with this explanation, further analysis shows that the spike in 2012 is due primarily to realized capital gains, which taxpayers can retime easily. But there is also retiming for other income categories, notably dividend income and to a lesser extent wages and salaries and business profits. This retiming response is large—income earners in the top 1 percent shifted about 10 percent of their income from 2013 into 2012. Lost government tax revenues, however, were modest as income shifted into 2012 still were taxed at the 2012 rates, which were about three-quarters of the 2013 tax rate. I estimate that, combining 2012 and 2013 federal individual income tax revenue, the government lost only about 20 percent of the projected revenue increase for 2013 due to these retiming responses.
What happened to top incomes in the medium-term? Figure 1 shows that the share of national income going to the top 1 percent income resumed its upward trend after 2013. By 2015, that share is back up to 22 percent. This means the 2013 tax increase depressed pre-tax top incomes only temporarily in 2013. This finding presents two important consequences. First, it means that raising taxes on the rich is an efficient way to raise additional revenue, as the rich do not respond much to the higher tax rates in the medium term. I estimate that only about 20 percent of the projected revenue increase from the 2013 tax hike is lost due to the behavioral responses over the medium term. Second, by itself, the 2013 tax increase will not be sufficient to curb the extraordinarily high level of pre-tax income concentration in the United States.
These findings echo the findings of earlier work analyzing the 1993 Clinton era tax increase, which also generated short-term retiming of top incomes into 1992 but did not prevent top income shares from surging in the mid-to-late 1990s. It is also striking that the best growth experience for the bottom 99 percent of income earners over the past 25 years took place in the mid-to-late 1990s and between 2013 and 2015—after tax increases on the rich. This suggests that taxing the rich more does not have detrimental effects on the broader economy; quite the contrary.
—Emmanuel Saez in a professor of economics at the University of California-Berkeley and a member of the Washington Center for Equitable Growth’s steering committee
Equitable Growth in Conversation: an interview with the OECD’s Stefano Scarpetta

“Equitable Growth in Conversation” is a recurring series where we talk with economists and other social scientists to help us better understand whether and how economic inequality affects economic growth and stability.
In this installment, Equitable Growth’s executive director and chief economist Heather Boushey talks with Stefano Scarpetta, the Director of Employment, Labour and Social Affairs at the Organisation for Economic Cooperation and Development in Paris, about how high levels of inequality are affecting economic growth in the organization’s 35 member countries and possible policy responses.
Read their conversation below
Heather Boushey: The OECD has been doing really interesting work over the past few years looking at how and whether inequality affects macroeconomic outcomes or outcomes more generally. A lot of questions are circling around the report that came out last year titled “In It Together: Why Less Inequality Benefits All.” One thing that really strikes me is that inequality isn’t a unitary phenomenon. It’s not just one thing. You can have inequality increasing at the top of the income spectrum, you can have something happening in the middle, you could have something happen in the bottom. But these are different trends and they may affect economic growth and stability in different ways because of their effects on people or on consumption or on what have you. That’s one of the things that I really enjoyed about that OECD report is that you used multiple measures of inequality; you didn’t just stick with one. So, I wondered if you could talk a little bit about that.
Stefano Scarpetta: Sure. Some indicators of income inequality, such as the Gini coefficient, of course don’t tell us exactly what’s happening with different income groups. So, much of the work we have done at the OECD is to look at the income performance of different groups along the distribution. And one of the findings that is emerging, not just in the United States but also across a wide range of advanced and emerging economies, is that income for those at the top 10 percent, and in many cases actually the top one percent, has been growing very rapidly. At the same time the income of those on the bottom—not only the bottom 10 percent but actually sometimes the bottom 40 percent—has been dragging, if not declining, in some countries.
This fairly widespread trend becomes very important when we think about policies to address inequalities, but also when you want to look at the links between inequality and economic growth. As you know, there are at least two broad strands of theory about the links between inequality and growth. A traditional theory focuses on economic incentives. Some inequality, especially in the upper part of the distribution, is needed to provide the right incentives for people to take risk, to invest, and innovate. An alternative theory instead focuses on missing opportunities associated with high inequality: it focuses more on the bottom part of the distribution, and stresses that high inequality might actually prevent those at the bottom of the distribution from investing in, say, human capital or health, thus hindering long-term growth..
We have done empirical work looking at the links between inequality and economic growth. This is very difficult, and though we have used some state-of-the-art economic techniques, we still have a number of limitations. We have looked at 30 years of data across a wide range of OECD countries. And basically, the bottom line of this analysis is that there seems to be clear evidence that when inequality basically affect the bottom 40 percent [of the income distribution], then this leads to lower economic growth. These results are fairly robust, but what’s the mechanism behind this effect? That’s what we’ve been doing as well.
Potentially there are different types of mechanisms. We have investigated one of them in particular: the reduced opportunities that people in the bottom part of income distribution have to invest in their human capital in high-unequal countries. The OECD has coordinated the Adult Skills Survey, which assesses the actual competencies of adults between the ages of 16 and 65 in 24 countries along three main foundation skills: literacy, numeracy and problem solving. Thus the survey goes beyond the qualification of individuals and allows us to link actual competencies with their labor market status. The survey actually measures what people can do over and above their qualifications. Then we looked at whether educational outcomes, not only in terms of qualifications but also actual competencies, are related to the socioeconomic backgrounds of the individuals themselves, and also whether the relationship between the socioeconomic backgrounds of individuals and the education outcomes vary depending on whether the individuals live in low- or high-inequality countries.
What emerges very clearly from the data—and these are micro data of a representative sample of 24 countries—is that there is always a significant difference or gap in the educational achievement of individuals, depending on their socioeconomic background. So individuals coming from low socioeconomic backgrounds tend to have worse outcomes whether we measure them in terms of qualifications, or even more importantly in terms of actual competencies — actual skills, if you like. The interesting result is that the gap tends to increase dramatically when we move from a low-inequality to a high-inequality country. The gap tends to be much, much bigger. The difference in the gap between those with intermediate or median socioeconomic backgrounds and those with high socioeconomic backgrounds is fairly stable across the income distribution level of inequality of these countries. But when we look at the highly unequal countries there is a drop, particularly among those coming from low socioeconomic backgrounds
One way to interpret this is that if you come from a low socioeconomic background, your chances of achieving a good level of education are lower. But if you are in a high-unequal country, the gap tends to be much, much larger compared to those coming from an intermediate or high socioeconomic background. And the reason is that in high-unequal countries it’s much more difficult for those in the bottom 10 percent —and indeed the bottom 40 percent— to invest enough in high-quality education and skills.
HB: That’s very consistent with research by [Stanford University economist] Raj Chetty and his coauthors in the United States on economic mobility, noting in U.S. parlance that the rungs of the ladder have become farther and farther apart. Would you say that these are consistent findings? One thing inequality does is it makes it harder to get to that next rung for folks at the bottom or even the mid-bottom of the ladder.
SS: Precisely, that’s exactly the point. The comparisons of the gap in educational achievements between individuals from different socio-economic backgrounds across the inequality spectrum suggest that the gap widens when you move from qualifications to actual competencies. So, basically, it’s not just a question of reaching a certain level of education, but actually the quality of the educational outcomes you get. In highly unequal countries, people have difficulty not only getting to a tertiary level of education, but also accessing the quality of the education they need, which shows very clearly in terms of what they can do in terms of literacy, numeracy and problem solving. So, yes, high inequality prevents the bottom 40 percent from investing enough in human capital, not only in terms of the number of years of education, but also in terms of acquiring the foundation skills because of the adverse selection into lower quality education institutions and training.
HB: I want to step back just for a moment. To summarize, it sounds like the research that you all have done finds that these measures of inequality are leaving behind people at the bottom and that affects growth. Is there anything in your findings that talked about those at the very top, the pulling apart of that top 1 percent or the very, very top 0.1 percent? What did your research show for those at the very top?
SS: It’s well known that the top one percent, actually the top 0.1 percent, are really having a much, much stronger rate of income growth than everybody else. This takes place in a wide range of countries, not to the same extent, but certainly it takes place.
The other descriptive finding we have is that for the first time in a fairly large range of OECD countries, we have comparable data on the distribution of wealth, not just the distribution of income. And what that shows is that there is much wider dispersion of the distribution of wealth, which actually feeds back into our discussion about investment in education because what matters is not just the level of income, but actually the wealth of different individuals and households.
Just to give you a few statistics: in the United States the top 10 percent has about 30 percent of all disposable income, but they’ve got 76 percent of the wealth. In the OECD, on average, you’re talking about going from 25 percent of income to 50 percent of wealth. So, basically, the distribution of wealth adds up to create a deep divide between those at the top and those at the bottom. The interesting thing is that there are differences in the cross-country distribution of income and wealth. Countries that are more unequal in terms of income are not necessarily more unequal in terms of distribution of wealth. The United States is certainly a country that combines both, but there are a number of European countries, such as Germany or the Netherlands, that tend to be fairly egalitarian in terms of distribution of income, but much less so when you look at distribution of wealth.
I think that going forward, research has to take the wealth dimension into account because a number of decisions made by individuals rely of course on the flows of income, but also in terms of the underlining stock of wealth that is available to them.
Going back to your question: the fact that the top 10 percent is growing much more rapidly does not necessarily have negative impact on economic growth. What really matters is the bottom 40 percent, which as I said before justifies our focus on opportunities and therefore on education. And the work we are doing now at the OECD extends our analysis to look at access to quality health services. My presumption is that individuals in the bottom 40 percent, especially in some countries, might be not as able as others to access quality health. And therefore, this also affects the link between health, productivity, labor market performance, and so on. This might also be an effect that becomes a drag on economic growth altogether.
HB: One really striking finding that really struck me in the OECD report, as an economist who focuses on policy issues, is that your analysis doesn’t conclude the policy solutions are really in the tax-and-transfer system. As you’ve already said, it’s really thinking about education, perhaps educational quality, health quality—things that might be a little bit harder to measure in terms of the effectiveness of government in some ways. After all, it’s easier to know exactly how much of a tax credit you’re giving someone versus the quality of a school or health outcome. You can certainly measure these outcomes, but it’s more challenging. It seems to me that a lot of the conclusions of this research are that it’s not enough to focus on taxes and transfers, but rather that we have to focus on these things that are harder, in the areas of education and health outcomes, focusing on people and people’s development. Would that be a fair assessment of the emphasis that this research is leading you to?
SS: To some extent, because I think both are important. Let me try to explain why. The first point is that more focus should indeed go into providing access to opportunities. And these are not just the standard indicators of how much countries spend on public and private education and health, but actually how people in different parts of the distribution have access to these services, and the quality of the services they receive. So I think the focus should be on promoting more equal access to opportunities, which means going beyond looking at access and quality of the services that individuals receive, especially those from the bottom 10 percent to the bottom 40 percent of the income distribution. This is much more difficult to measure, but I think we have to consider fundamental investment in human capital. And a lot of the policies should move toward providing more equal access to opportunities, at least in the key areas of education, health, and other key public services.
Now, the other point is that if you don’t address the inequality of outcomes then you can’t possibly address the inequality of opportunities. In countries in which the income distribution is so unequally distributed it’s difficult to think that individuals, despite public programs, can actually invest enough on their own to have access to the right opportunities. So, the two things are very much linked. By addressing some of the inequality in outcomes, you’re also able to promote better access to opportunity for individuals. So, I think it’s really working on both sides.
We are not the only ones who have been arguing for years that the redistribution effort of countries has diminished over time. It has diminished over the past three decades because of the decline in the progressivity of income taxes and because the transfer system in general has declined in terms of the overall level, even though some programs have become more targeted. But we’re not necessarily saying spend more in terms of redistribution, but spend well in terms of benefit programs. So I think the discussion becomes: Focus more on opportunities, address income inequality because this is a major factor in the lack of access to opportunities, but be very specific in what you do in terms of targeted transfer programs. In particular, focus on programs that have been evaluated and showed that they actually lead to good outcomes.
HB: I’d also like to talk about gender- and family-friendly policies. I noticed in the report that you talked a lot about the importance of reducing gender inequality on overall family inequality outcomes but also on the opportunity piece. Could you talk a little bit about the importance of these in terms of the research that you found?
SS: One of the most interesting results of our analysis in terms of the counteracting factors of the trend increase in income inequality across the wide range of OECD countries—including a number of the key emerging economies—has been the reduction in the gender gaps. The greater participation of women in the labor market has certainly helped to partially, but not totally, alleviate the trend increase in market income inequality. But as we know, there are gender gaps not only in labor market participation, but increasingly also in the quality of jobs that women have access to compared to men. Depending on the country, of course, there are large differences.
In that context, I’m very glad we have been supporting the Group of 20 Australian presidency in 2014, which brought a gender target into the forum of the G-20 leaders. Now, they have committed to reducing the gender gap in labor force participation by 25 percent by 2025. It’s only one step into the process, but I think it’s an important signal. We at the OECD also have the “Gender Recommendation,” a specific set of policy principles that all OECD countries have engaged in, with a fairly ambitious agenda on gender equality, focusing on education, labor markets, and also entrepreneurship.
Ensuring greater participation of women in the labor market remains a very important objective, but looking more into the quality of jobs that women have access to, and making sure that policy can facilitate women entering the labor market and also having a career is very important. And also allowing women to reconcile work responsibility with family responsibility. In that context, what we are doing perhaps more than in the past is looking not only at what women should be doing or have to do, but also at what men can do and should do. At the OECD, for example, we are looking specifically at paternity leave, because many of the decisions at the household level are taken jointly by the father and the mother. And I think while we have made some progress in changing the behavior of mothers, much remains to be done to also change the behavior of fathers.
We are looking at some of the interesting policies that a number of countries are implementing to promote paternity leave, for example by reserving part of the parental leave only to the father. Either the father takes the leave or it is not given to the household. And there are a number of interesting results. Some countries, such as Germany, have reserved part of the parental leave going to the father and have been able to increase the number of fathers who take parental leave by a significant proportion. Again, the focus should certainly be on all the different dimensions of inequality, including gender inequality, in the labor market, but also look at the interactions of individual behaviors of men and women and those of the companies in which they work. We are doing interesting research in the case of two countries that have very generous paternity leave, Japan and South Korea: 52 weeks. Yet, only 3 percent of the fathers take paternity leave. For male workers in these countries, absence from work because of family reasons is perceived to be a lack of commitment to the firm and employer and thus may have a negative impact on their careers; not surprisingly only a few men actually take paternity leave.
HB: One thing I know from my own research is that United States, of course, is different in that we tie in the states that have family leave, such as California, New Jersey, and Rhode Island, with New York soon implementing it, to our federal unpaid family and medical leave, which is 12 weeks of unpaid leave and which covers about 60 percent of the labor force. At both the state and federal level, the leave is tied to the worker. So, we already have a “use it or lose it” policy in place. So for children who are born to parents California, both the mother and the father have an equal amount of leave, but if dad doesn’t take it then the family doesn’t get it.
We’ve seen from research that once the leave was paid; men are increasingly taking it up. If the OECD hasn’t been looking at this in a cross-national comparative way, it might be an interesting case study or research project that I’ll just put out there in terms of how the United States has done. That’s the only thing that we’ve done right on paid leave vis-a-vis other OECD countries.
My last question here. Going back to the beginning of our conversation, the OECD research found that the rise of inequality between 1985 and 2005 in 19 countries knocked 4.7 percentage points off of cumulative economic growth between 1990 and 2010. That’s a big deal. The policy issues that we’ve been talking about are wide-ranging and possibly expensive, but also very important, it seems, for economic growth.
From where you sit in Paris at the OECD, are you seeing policymakers both at the OECD but also in member countries that you work with, really taking this research seriously? And are there any big questions that you think an organization like the Washington Center for Equitable Growth should be asking in our research to help show people what the evidence says? Are there sort of big questions that policymakers say, “Oh, I’ve seen this report, Stefano, but I don’t believe this piece of it.” Are there any avenues that you think we need to pursue where people are perhaps a little bit more skeptical if they’re not taking it as seriously as this research implies?
SS: These are all extremely relevant and very good questions, Heather. Let me start with the first point you raised; over a 30-year period, and across a wide range of OECD countries, high and increasing inequality has knocked down economic growth. Obviously this is not the last word and further research is needed. As we discussed, the identification of the effect and the links are not straightforward. We have used what we think is the best state-of-the-art economic techniques, but of course it’s not the last word. It would certainly help to work along these lines with a number of researchers to gather more evidence.
But it also is important for researchers to look at the channels through which increasing high levels of inequality might be detrimental for growth: namely by under-investment in broadly-defined human capital of the bottom 40 percent and therefore long-term economic growth. I think this is certainly an area in which there is a lot of scope for doing more work. In particular, there’s a lot of space for doing serious micro-based analysis looking at the extent to which individuals with low socioeconomic backgrounds actually have difficulties investing in quality education, quality human capital, and other areas.
Now, in terms of the work we have done— and the work that was done also by the International Monetary Fund and others— I think we are contributing somewhat to changing the narrative about inequality. For decades, there was a field of research on the economics of inequality, but this was largely confined to addressing inequality for social cohesion —for social reasons. We hope that now we have brought the issue of growing inequality toward the center of policymaking because inequality might be detrimental to economic growth, per se. So, even if you just want to pursue economic growth, you might want to be careful about increasing income inequality in your country.
We are not there yet, but I think there are a number of signals that indicate growing dissatisfaction in many countries, at least in part be driven by the fact that people don’t see the benefits [of economic growth] even amid a recovery. One of the more clear signals is that now the issue of inequality is discussed more openly in our meetings with colleagues from the fianance and economy ministries. In fact, the broad economic framework we’re now using at the OECD is inclusive growth. I would say that these are not things that would have been possible a decade ago. There is now a fairly consistent narrative around the need to pursue inclusive growth. And there is a strong focus on employment and social protection, and on investments in human capital.
I think the research community really needs to feed this discourse. There might be still some temptation as soon as economic growth resumes to revert back to traditional economic growth focus. And because there are a lot of fears and concerns about secular stagnation, the thinking could focus on growth because we need growth back, and we will deal with the distribution of the benefits of growth at a later stage. But, we should really have a comprehensive strategy that fosters a process of economic growth that is sustainable and deals with some of the underlining drivers of inequality.
HB: Thank you. And I will note our very first interview for this series “Equitable Growth in Conversation” was with Larry Summers, who actually talked about the importance of attending to inequality if we want to address secular stagnation.
SS: Exactly.
HB: This has been so enormously helpful and so interesting. We here at Equitable Growth really appreciate the work that you all are doing at the OECD and find it incredibly illuminating. Thank you so much for taking the time to talk to us today.
SS: Thank you, Heather. Thank you very much. It’s been a pleasure.
Supply chains and equitable growth

AP Images
This article is part of our series: Delivering equitable growth: strategies for the next Administration.
About the author: Susan Helper is the Frank Tracy Carlton Professor of Economics at the Weatherhead School of Management at Case Western University.
The U.S. economy has undergone a structural transformation in recent decades. Large firms have shifted from doing many activities in-house to buying goods and services from a complex web of other companies. These outside suppliers make components, and provide services in areas such as logistics, cleaning, and information technology. Although this change in the structure of supply chains began decades ago, neither public policy nor business practice have adequately dealt with the challenges posed by this restructuring. As a result, weakness in supply chains threatens U.S. competitiveness by undermining innovation and contributes to the erosion of U.S. workers’ standard of living. This essay suggests policies to promote supply chain structures that stimulate equitable growth—that is, policies that both promote innovation and also insure that the gains from innovation are broadly shared.
![]()
The role of supply chains
in the U.S. economy
A supply chain links companies, often in multiple industries and multiple locations, to design, produce components, assemble and distribute a final product, such as a car, a computer, or a restaurant meal.11 For much of the 20th century, a significant part of the U.S. economy was characterized by supply chains that were vertically integrated.12 Beginning in the 1970s and 1980s, large firms in many industries began to sell off assets and outsource work. Today, a lead firm typically designs products and directs production by multiple tiers of suppliers in many locations, but does not own most of these suppliers.13
Delivering equitable growth
Previous article: Trade and worker welfare, David Autor
Next article: Consumer credit, Kyle Herkenhoff and Gordon Phillips
Supply chains made up of these financially independent firms are now the largest driver of firms’ costs. The average U.S.-based multinational firm buys intermediate inputs that comprise about 75 percent of the value of its output; a domestically owned firm buys intermediate inputs equal to about 50 percent of output value.14 Contrary to the common impression, most of these suppliers are domestic, even in manufacturing.15 These outsourced supply chains differ from vertical integration in that the lead firm does not own supplier facilities. The lead firm benefits from this arrangement by gaining access to products made by suppliers with experience in making similar products for multiple customers and by not being responsible for subsidiaries’ fixed costs.
These supply chains also typically differ from economists’ model of perfect competition, in which transactions between firms are at arm’s length and the only information that crosses firm boundaries is price information. In contrast, many suppliers make products specifically tailored to meet the needs of the lead firm and frequently exchange information with the lead firm regarding designs, production processes, and future plans. Lead firms find this arrangement advantageous because they are able to quickly obtain components tailored to their specific needs. The complementary disadvantage is that firms are often unable to change suppliers easily.
On one hand, sharing suppliers with other lead firms has significant benefits, such as shared knowledge across customers and reduced fixed costs. On the other hand, lead firms may lack incentive to invest in upgrading the supplier’s capabilities if that supplier may also use those capabilities to serve a competitor. Firms’ success depends upon having robust networks of suppliers, but no one firm is responsible for keeping these networks healthy.
![]()
Implications of supply chain
structure for innovation
Because innovation is concentrated in manufacturing—two-thirds of private-sector research and development is performed in manufacturing—this section looks at supply chains in manufacturing only (data is not readily available for innovation in other sectors.)16
Firms with fewer than 500 employees are an increasing share of manufacturing employment, accounting for 42 percent of such workers in 2012. These small firms struggle at each phase of the innovation process. They are only 15 percent as likely to conduct research and development as large firms. Small firms also struggle to obtain financing and a first customer to help them commercialize a new product or process. Finally, small manufacturers have trouble adopting new products or processes developed by others, due to difficulty in learning about and financing new technology. As a result, small manufacturers are only 60 percent as productive as large firms.17
A skeptic may ask why large lead firms cannot innovate enough to support their entire production network. But problems such as reducing the vibration of a wind turbine requires holistic problem-solving; a machine composed of many parts that exert strong forces on each other cannot simply be divided into one problem for the gearbox manufacturer to solve, one for the rotor manufacturer to solve, and another for the assembly team to solve. Limiting innovation to lead firms deprives the supply chain of insights that come from being very close to a particular type of production or use.18 In addition, long-term supplier-customer relationships built upon trust and collaboration best facilitate progress toward these goals; lack of such relationships accounts for many of the problems U.S. industries face in moving new technologies from lab to market.
![]()
Implications of supply chain
structure for job quality
Workers are employed in supply chains in a variety of ways. Instead of being hired directly by lead firms as regular employees, workers may be hired by temporary help agencies and are often referred to as “contingent workers.” Alternatively, they may be hired as regular workers at supplier firms or as independent contractors.
A variety of studies find that these forms of outsourcing of employment, especially as carried out in the United States, typically create undesirable outcomes for workers in areas such as wages, benefits, job security, and safety.19 Contingent workers earn 10.5 percent less per hour and 47.9 percent less per year than non-contingent workers, and are more likely to suffer workplace injury.20 Workers employed at suppliers, even as regular workers, generally earn less than workers at lead firms, which tend to be larger.
Wages are typically lower at suppliers than at lead firms because of the barriers to innovation discussed above, which reduce productivity; the absence of pressures to reduce wage differentials within a firm due to norms of fairness; and greater pressure on wages at outside suppliers, which are more easily replaced than are internal divisions.
![]()
Market and network
failures in supply chains
Three forms of market failure contribute to the central tendency of U.S. supply chains to suppress innovation and make jobs worse:
- Free-rider problems between firms. When a lead firm makes investments in upgrading its suppliers—by providing technical assistance to suppliers, training supplier workers, or helping them invest in new equipment—some of this improved capability will often spill over to benefit a supplier’s other customers, including the lead firm’s rivals. Lead firms thus have less incentive to invest in their suppliers than would be socially beneficial.21
- Siloes within firms. Internal conflicts between departments within a lead firm can mean a focus on finding suppliers with low prices rather than on those providing high quality and innovation. An easy way for firms to evaluate their purchasing departments, for example, is the extent to which they reduce the price per unit they buy. A purchasing agent could thus be rewarded for choosing a supplier whose costs are $1,000 less than a rival supplier’s—even if that supplier’s skimping on quality control later causes the shutdown of a production line that costs the operations department $100,000. It may seem unlikely that sophisticated companies would fall prey to such problems, but quality and innovation are harder to measure than prices, and their benefits often accrue to departments other than purchasing.22
- Profit protection. Outsourcing of work often reduces workers’ access to profits earned by the lead firm. Organizational structures tend to minimize wage differentials within firms, due to both norms of fairness and to a desire to promote cooperation within an organization. Firms with a high degree of market power have lots of profits to protect, which they often do by adopting policies that make their suppliers interchangeable, even at a cost to efficiency.23
The result of these market failures is an emphasis in the United States on arm’s length rather than collaborative governance of supply chains, and a hollowing out of productive eco-systems, as firms set up incentives for their purchasing departments that privilege supplier firms that can win competitive bidding wars. These “winners” tend to be small firms with low expenditures on overhead costs, covering such things as salaries for managers and engineers and worker training. In extreme cases, such as garment production or janitorial services, competition is so fierce that firms compete in part by violating laws on safety, minimum wages, overtime, and disposal of toxic waste. In the rare instances in which these firms are caught, they often can file for bankruptcy and re-open under another name.24
![]()
Policies to promote innovative
supply chains with good jobs
Outsourcing has its advantages, principally in making possible a potentially efficient division of labor in which specialist firms can achieve economies of scale and diffuse best practices by serving a variety of customers. Yet lead firms’ zealous embrace of the non-collaborative version of this strategy has resulted in significant weaknesses in innovation and job quality in the United States. Tackling these challenges will help address some root causes of wage inequality and productivity stagnation in U.S. manufacturing and service industries. Policies in five areas will help:
Encourage firms to adopt collaborative supply-chain practices
Public support for economic growth has long focused on the diffusion of physical technologies, yet the diffusion of operational insights may be just as valuable. Evidence suggests supply chains with more collaborative practices are more innovative.25 The next Administration should use its convening power to encourage lead firms to take steps such as:
- Offer suppliers assurance that they will receive a fair return on investments they make in new technologies and in upgrading their capabilities. In order to become partners in innovation, suppliers need to develop better capabilities in product and process design, and to upgrade equipment.
- Promote information-sharing and make changes in their own operations as a result of supplier suggestions. A key insight from the Toyota Production System is that firms and workers who are close to production have access to information not easily available to those at the top of the chain.26 Firms that establish mechanisms to learn from their suppliers can significantly improve cost and quality.
- Use a “total cost of ownership” approach when making purchasing decisions. Firms should consider impacts of sourcing decisions on quality and innovation as well as on price per unit purchased.27 Forming long-term, collaborative relationships with highly competent suppliers may be in a firm’s best overall interest, yet purchasing departments are not always incentivized to consider these benefits.
Nurture productive eco-systems of firms, universities, communities, and unions
One reason for the struggles that small- and medium-sized U.S. firms face is that they are “home alone,” with few institutions to help with innovation, training, and finance.28 For reasons of both equity and efficiency, these firms should not depend solely on their customers for strategic support.
Policies that nurture small firms, local universities, their communities, and unions could help the firms leverage their advantages over their larger brethren in nimbleness and strong community ties. Germany’s Mittelstand (medium-sized firms) are the backbone of the German manufacturing sector due to the help they get from community banks, applied research institutes, and unions.29 In the United States, the unionized construction sector has developed structures that create good jobs and fast diffusion of new techniques, even though the industry remains characterized by small firms and work that is often intermittent. Building trades unions work with signatory employers to provide apprenticeships, continuing education programs, and portable benefits.30
Federal technology assets should be better deployed as well, continuing the work begun by the Obama White House Supply Chain Innovation Initiative.31 National labs can be encouraged to work with small as well as large firms, for example, and the Manufacturing Extension Partnership can expand its efforts to work with entire supply chains (rather than firms one by one) to identify sources of inefficiency. A century ago, the federal government played this role in agriculture by funding land grant universities, which led not only to the creation of knowledge, but also created durable networks of researchers and practitioners through which such knowledge could quickly spread.32
Promote formation of supply chains in industries that advance national goals
The free-rider problems discussed above are likely to be particularly acute in forming collaborative supply chains for new products, such as improved solar panels or wind turbines. These industries face additional market failures leading to underinvestment in addressing climate change. The Obama Administration’s Clean Energy Manufacturing Initiative helps to move new technologies out of the laboratory and into production. It would be useful to explicitly address the incentive and information issues in supply chains for producing and installing these products. The next administration could convene firms throughout the supply chain to engage in value analysis to improve product designs, to uncover hidden pockets of inventory, and to adopt total-cost-of-ownership techniques.
Promote good jobs and high-road strategies
Much research documents the ways that firms can utilize “high-road” policies or “good-jobs” strategies to tap the knowledge of all their workers to create innovative products and processes.33 High-road firms remain in business while paying higher wages than their competitors because their highly skilled workers help these firms achieve high rates of innovation, quality, and fast response to unexpected situations. The resulting high productivity allows these firms to pay high wages while still making profits that are acceptable to the firms’ owners. Collaborative supply chain governance plays an important role in providing the stability needed to support these strategies, from which lead firms also benefit.
Dis-incentivize low-road production strategies
Even in collaborative scenarios, wages are often less than in the old vertically integrated model. The corrosion of labor union power enables outsourcing, and the increase in outsourcing has, in turn, further decreased workers’ bargaining power.
Thus, as important as it is to “pave the high road,” it is also important to “block the low road.”34 The Department of Labor has begun to take advantage of modern supply chains’ emphasis on “just-in-time” delivery, recognizing that reduced inventories make regulators’ threat to shut down suppliers for violation of wage and hour laws a more potent threat.35 New policies could combine such sticks with some carrots. The federal government could offer technical assistance, for example, to help small garment manufacturers move away from the existing low-road model, in which ill-trained workers typically do one simple operation to a garment and then pass it on to the next worker. Instead, these firms could adopt a more agile production recipe, one that involves more broadly trained and higher-paid workers collaborating in teams—a high-road model sustained by greater productivity and reduced lead times.
Government should implement collaborative supply-chain practices within its own purchasing, building on the Obama Administration’s nascent efforts to measure total cost of ownership and to ban supply chains with recent violations of labor and other laws from selling to the government.36
Current outsourcing practices allow lead firms and their suppliers to reap the benefit of paying workers only when needed, while the risks of being left without earnings are borne by workers. Several proposals could improve the balance here: encouraging work-sharing in downturns (which would make hiring regular workers less costly), continuing to improve the portability of benefits across firms, and promoting schedule stability.
![]()
Retooling supply chains for equitable growth
Decisions about how to structure supply chains matter greatly for working Americans, yet this topic rarely takes a front seat in policy discussions of how to address rising inequality and stagnating productivity. In order to promote equitable growth, policymakers must understand how the economic pie is created—not just how it is divided.
Fundamental changes in the way supply chains operate threaten U.S. economic competitiveness by undermining innovation, and erode American workers’ economic security. The rise over the past few decades of supply chains with small, weak firms leads to an increased presence of firms that innovate less and pay less. It is unlikely and undesirable, however, that the United States would return to the often bureaucratic and stifling vertically integrated supply chains of the mid-20th century.
We can do better. This essay outlined government and corporate policies to promote both more innovation and better job quality in supply chains. In particular, more collaborative supply chains and better-supported local eco-systems could significantly improve the viability of “good jobs strategies.” The way the economic pie is created affects the way it is divided.
(For more detail on these proposals and the analysis behind them, see Susan Helper and Timothy Krueger, “Supply chains and equitable growth,” Washington Center for Equitable Growth, September 29, 2016.)
Unemployment insurance reform: a primer

AP Images
This article is part of our series: Delivering equitable growth: strategies for the next Administration.
About the author: Till von Wachter is a professor of economics and the associate director of the California Center for Population Research at the University of California-Los Angeles.
The Unemployment Insurance system provides temporary and partial earnings replacement for workers that have become unemployed through no fault of their own and are actively searching for work. To facilitate reemployment, the UI system is complemented by job search assistance and training services. Within a common federal framework, states set the main parameters of the UI system and are responsible for financing benefits via payroll taxes, though federal funding has played an increasing role, especially in economic downturns.
In the United States, and most other developed countries, unemployment insurance is the main program helping to buffer the shock of layoffs and unemployment. The UI system provides vital benefits for laid off workers and families to weather the high and persistent costs of layoffs, especially in recessions. By preventing cuts in consumption, UI benefits can also function as an automatic stabilizer in economic downturns. Given high layoff rates even in normal economic times, the insurance provided by UI also plays an important role by supporting a well-functioning, dynamic labor market.
![]()
The need for common sense and
evidence-based unemployment insurance reforms
While most observers agree that the current structure of the unemployment insurance system is fundamentally sound, there is also widespread agreement that the UI system is in need of reform. There are several major issues to be addressed, First, the current UI system suffers from financial instability that risks compromising its major role as adjustment mechanism in recessions. Second, the coverage of UI has eroded over time, with a declining fraction of workers receiving lower benefits amounts. Third, UI does little to avert the large, long-lasting earnings losses among reemployed workers. And fourth, there are persistent questions about the effectiveness of UI and related programs to quickly reemploy job losers.
Delivering equitable growth
Previous article: Social Security, Jesse Rothstein
Next article: U.S. labor market mobility, Abigail Wozniak
The good news is that, in many ways, unemployment insurance appears to be an ideal target for bipartisan reform. First, there is a set of straightforward, common-sense goals for a well-functioning UI system. These goals include, among others: that UI should provide a sufficient buffer to avoid financial difficulties after layoff, especially for families with children; that UI should encourage speedy reemployment of the unemployed; that UI plays a clear role in economic downturns, and hence should not be at the discretion of local or federal politics; and that UI should be financial sound.
Second, Unemployment Insurance reform is an almost ideal example of the potential for evidence-based reform. There is a lot of high-quality evidence on the working of the UI system. A lot of the additional evidence needed for more-informed policymaking can potentially be obtained at arm’s length, especially in a data-rich environment. The following “primer” discusses and summarizes core pieces of recent evidence on job loss, unemployment, and the current UI system, and then relates them to a series of reform proposals. The reform proposals can be grouped into those that deliver a basic “tune up” of the current UI system, and those that provide more fundamental “modernization.” These are summarized here:
“Tune-up” (minimal) reforms:
- Prevent erosion of benefit generosity by mandating minimum UI benefits
- Institutionalize federal emergency unemployment compensation
- Fix outdated system of data collection to enable evidence-based policies
- Expand coverage of UI to fit structure of modern workforce
- Resolve financing short-falls in states’ UI trust funds by modifying tax base
Modernization reforms:
- Institute functioning system of job sharing to prevent costly layoffs
- Experiment with wage insurance to aid workers returning to employment
These proposals will be related to the issues they resolve and the evidence they rest on after a brief primer on the main available evidence about the UI system.
![]()
A primer on evidence about
the Unemployment Insurance system
A few key themes arise from extensive research on core aspects of the Unemployment Insurance system.37 While additional research is needed, the good news that the much of the data needed is potentially available at low cost from the UI system itself.
Point 1: The current benefit levels and durations appear appropriate. An increasing number of studies have shown that current Unemployment Insurance benefits provide an important buffer against consumption losses for a substantial number of unemployed workers. While a large number of studies have established that UI also tends to prolong unemployment and hence reduce tax revenues, it appears at current levels that the social benefits outweigh the budgetary costs. Recent research also gives clear guidance that UI benefits should be extended in recessions, and when they should be targeted to certain groups of individuals.
Point 2: The coverage of Unemployment Insurance has eroded over time. It is well known that on average only half of the unemployed receive UI benefits, substantially limiting the program’s scope to insure individual earnings shocks and provide an automatic stabilizer. This is partly because up until recently UI rules in most states explicitly exclude certain groups of unemployed—those engaging in full- or part-time education, those seeking part-time employment, or those with low earnings. Partly it arises because of a low take-up rate of benefits among those eligible.
Point 3: The effects of layoff are felt long after unemployment. An increasing amount of evidence suggests that the effects of job loss are felt long beyond reemployment, including effects on earnings, health, and child outcomes.38 Children of job losers suffer from the consequences even as adults. Overall, research suggests UI benefits only make up a small portion of the earnings lost at job loss.
Point 4: Current reemployment efforts show mixed success. While many programs aiming to aid Unemployment Insurance recipients to find work are successful and sometimes cost-efficient, increasing evidence suggests that substantial hurdles for successful reemployment remain, especially for older and longer unemployed workers. Especially for these individuals, longer UI benefits do not improve and may even reduce job quality. Although the evidence is mixed, an ongoing concern is UI may damage reemployment prospects by lengthening the unemployment spell.39
Point 5: The federal-state relationship needs to be fixed. Although in principle the nature of Unemployment Insurance taxes should lead state UI trust funds to balance over the business cycle, reductions in UI tax rates and a low tax base have led to financing shortfalls. As a result, benefit extensions during recessions have been increasingly financed by ad hoc federal measures. To partly resolve budget short falls, several states have begun cutting benefits. Currently, political constellations at the state level have led to a patch-work of UI reforms, exposing similar workers to different UI systems. The current system also suffers from a wasteful lack of data-sharing that prevents meaningful management and study of the UI program.
![]()
Proposals for “tune up” (minimal reforms)
of the Unemployment Insurance system
Policy analysts and researchers have discussed the need to modernize the unemployment insurance system for some time. This discussion received momentum during the Great Recession. The result has been a series of well-articulated proposals, and convergence on a list of basic fixes. Several of these reform proposals have made it into President Obama’s Budget Proposal for fiscal year 2017, which begins in October 2016. The following is a list of the core proposals, including a brief summary of their justification.
Prevent erosion of benefit generosity by mandating minimum duration of 26 weeks
The issues. Partly to counter funding difficulties in the aftermath of the Great Recession, several states have cut benefit durations below the typical 26-week mark. Similarly, there is substantial heterogeneity in benefit levels across states. Yet, there are no compelling reasons why similar workers in different states should be treated different by the Unemployment Insurance system. Research provides justification for the optimal generosity of UI benefits, and when these should vary with characteristics of workers or local labor markets. Hence, the choice of benefit parameters and how they vary in the population or over time should not be a function of the local political process or short-term funding needs.
Proposed changes. Federal law should mandate a minimum amount of potential duration of Unemployment Insurance benefit of 26 weeks, an average effective replace rate of 50 percent of benefits (with gradual adjustments of the maximum benefit amount), and a dependent allowance to support families with children with higher consumption commitments. To ensure states update their laws, the federal government can limit the credit for the State Unemployment Tax employers receive against the Federal Unemployment Tax.
Institutionalize federal emergency Unemployment Insurance benefits as function of local unemployment
The issues. Research clearly indicates that Unemployment Insurance benefits should be extended in recessions. This is because the benefits to workers at risk of exhausting their benefits are greater, the inefficiency costs are not larger and perhaps smaller, and the potential of stimulating effects is greater. The experience in the aftermath of the Great Recession has shown that leaving extensions of UI benefits to the political process can lead to gaps in coverage that are damaging to affected workers. For most recessions, there is no evidence indicating a need for wasteful and potentially harmful discretion.
Proposed changes. The federal Emergency Unemployment Compensation program should be made a permanent program. A straightforward way to achieve is to reform the current Extended Benefit program and make it 100-percent federally financed. In the course of such a reform, the trigger structure should be modified to keep the fraction workers covered by UI approximately constant over the business cycle.
Fix outdated system of data collection to enable evidence-based policies
The issues. To maintain daily operations of their Unemployment Insurance programs, states collect information on workers’ wages, UI claimants’ benefits, and their employers’ UI taxes. This information is vital for an efficient administration of the UI system, including understanding which parts of the system are cost effective. Yet the current law only requires states to share the data with federal agencies for extremely limited purposes. Moreover, many of the data sets lack basic information, such as on worker age or gender. Ample experience now exists to cheaply handle and combine sensitive administrative data.
Proposed changes. The data collection should be modernized by adopting four complementary strategies: enhance data collection by states; establish a national data clearinghouse of Unemployment Insurance data at either the U.S. Bureau of Labor Statistics or the U.S. Census Bureau; support these changes by providing a common software and offering moderate grants for upgrade hardware; and establish a protocol to allow to access the data for research purposes and to improve the UI system. It is important to include an enforcement mechanism to ensure states’ compliance with this requirement.
Expand coverage of Unemployment Insurance to fit structure of modern workforce
The issues. The current Unemployment Insurance system does not serve a large fraction of the unemployed. This is partly due to changes in the structure of the workforce, with increasing amounts of low-wage workers in unstable jobs or rising part-time employment especially among women. Through incentives provided by the American Recovery and Reinvestment Act of 2009, a substantial number of states have now made benefits more easily accessible by adopting a range of proposals.
Proposed change. A reform should provide pathways to harmonize eligibility for Unemployment Insurance across states and increase take-up rates among eligible individuals. There is little justification for the current patchwork of eligibility, and meetings of state and federal UI officials should provide a system of best practices for eligibility requirements and outreach. Eligibility requirements should include those proposed in the American Recovery and Reinvestment Act, among them allowing for training of UI beneficiaries, enabling part-time workers to claim benefits, enhancing the mobility of working couples by making moves for family-related reasons a qualifying event for UI, and instituting the alternative base period. In addition, some of the gradual restrictions imposed over the last three decades to lower UI payments should be reviewed and possibly modified as well.40
Resolve financing short-falls in states’ UI trust funds
The issues. As a consequence of growing wages (and hence benefits) and low taxable wage bases that are not indexed to covered wages, just 25 percent of earnings covered by Unemployment Insurance laws nationally are currently subject to state UI payroll taxes. The minimum taxable wage base, set by the federal government, is currently $7,000 and has not changed since 1983. Similarly, the net federal tax rate—as defined under the Federal Unemployment Tax Act, or FUTA—has been 0.8 percent for more than 30 years, depressing revenues that pay, among others, for UI administration by federal and state agencies.41 Many states’ UI taxes—as defined by their State Unemployment Tax Act, or SUTA—have remained low as well, and states have increasingly resorted to borrowing to finance UI benefits in recessions. Hence, even without the large increase in UI payments during and after the Great Recession the financial soundness of the UI system was steadily eroding.42
Proposed changes. Several sensible reforms of the complex financing system have been proposed. One is to raise the federal taxable wage base, index it to wage growth, and correspondingly lower the FUTA tax rate.43 Another is to institute federal penalties for states that fail to carry sufficient forward balances in their trust funds during expansions.44 And a third is to prevent payroll taxes from rising in the midst of a protracted recovery by extending the 2-year window until FUTA tax credit expires, institutionalizing interest wavers, and encouraging states to also delay automatic tax triggers aimed at balancing their trust funds.
Additional proposal worthy of consideration but not discussed further here
There are additional interesting proposals meant to fix additional shortcomings of the current unemployment insurance system. In addition, there are challenging open questions that have not yet been addressed. These proposals and open questions include, among others:
- A modernization of the administration of Unemployment Insurance, including information technology used to administer claims, which is found to be often outdated and underfunded by the federal government45
- A reform of firms’ UI tax rates to better internalize the costs of layoffs, reduce the cost to the UI system, and achieve similar cost of layoffs across states
- An optional private unemployment account to cover the self-employed or independent contractors46
- A “job seeker allowance” to aid young workers not qualifying for UI because of a lack of earnings history47
![]()
Proposals for innovation of
the Unemployment Insurance system
Even if sufficiently modernized according to these basic reforms, Unemployment Insurance as it is currently designed can neither prevent nor buffer much of the large and lasting earnings losses due to layoffs. This also affects the UI system’s efforts to reemploy workers, who may wait too long to engage in the long process of rebuilding their careers. Yet several innovations of the existing UI system have been proposed that could greatly expand the reach of UI without the need to establish a new program.
Institute a functioning system of work sharing to prevent costly layoffs
The issues. An increasing number of U.S. states have instituted programs of work sharing—also called short-term compensation, or STC—that allow workers to draw pro-rated UI benefits while on the job as an alternative to layoff. Evidence from other countries suggests work sharing can achieve substantial reductions in layoffs. Yet, take-up of the programs by employers in the United States has been low, partly because of restrictive program rules and partly because of a lack of awareness about the program.
Proposed changes. Several policy options are available to strengthen the use of STC across and within states, especially during recessions. One would be to continue to incentivize adoption of the program, with 100 percent of STC outlays funded federally for the first three years after adoption, or alternatively require states to establish STC programs. To raise attractiveness to employers, during this period states should be required to not charge employers for their uses (meaning there should be no experience rating). Another policy option would be to encourage states to share best practices and harmonize their efforts in outreach, and consider targeting employers using industry-level indicators of economic activity or those in the WARN system.48 A third policy option would be to encourage widespread use of short-term compensation during recessions when Extended Benefits are turned on by having STC benefits 100-percent federally financed; by suspending experience ratings; and by not having STC benefits deducted from workers maximum UI eligibility. Finally, research should continue to assess what prevents adoption of the STC program, and best practices for eligibility requirements should be developed.
Experiment with wage insurance to aid workers returning to employment
The issues. Since Unemployment Insurance only insures a minor fraction of the total earnings risk of job losers, its role as insurance mechanism and automatic stabilizer in recessions is substantially below potential. As a result, a growing number of researchers have suggested complementing the current UI system with a system of wage insurance. Wage insurance is likely to provide substantial additional insurance value. In addition, it may provide cost-savings by lowering UI payments. And it is unlikely to further reduce wages, and may raise them by shortening unemployment.49 Yet, currently little is known on potential effects of wage insurance.
Proposed changes. A series of proposals have been made to extend existing wage-insurance plans for trade-related layoffs to all workers covered by Unemployment Insurance.50 Given the evidence on job loss, introducing a version of wage insurance is sound policy, but an experimental evaluation will be important to better understand the effects. Policy parameters should be set with core facts in mind—for example, average wage losses of displaced workers with three years or more of tenure from good employers in a recession are about $15,000 per year in the first couple of years,51 so $10,000 over two years replaces only 30 percent of the loss.52 Similarly, insurance benefits should be extended to workers earning more than $50,000 on their new job since this would exclude substantially affected middle-class employees and their families from insurance.53 Since most evidence suggest that earnings losses last at least three years, and likely many more, a proposal with sharp limits has to educate workers about the long path to recovery.
What new administrative data reveals about access to consumer credit and the U.S. economy

AP Images
This article is part of our series: Delivering equitable growth: strategies for the next Administration.
About the authors: Kyle Herkenhoff is an assistant professor of economics at the University of Minnesota. Gordon Phillips is the C.V. Starr Foundation Professor and Academic Director of the Center for Private Equity and Entrepreneurship at the Tuck School of Business, Dartmouth College.
The aim of this essay is to provide several pertinent facts about the way unemployed households in the United States use consumer credit and the way bankruptcy flags affect job finding rates and business creation. These facts can be used by policymakers, including legislators and central bankers, in order to better understand the implications and feasibility of both consumer credit regulations and monetary policy.
The basis for these facts is a new dataset whose construction was funded by the National Science Foundation, implemented in large part by one of the co-authors of this essay, Gordon Phillips, and University of Maryland finance professor Ethan Cohen-Cole, and recently analyzed in joint work with the other co-author of this issues brief, Kyle Herkenhoff.54 There were four major observations and implications that came out of our dataset:
- Credit cards are a form of unemployment insurance
- Expansionary monetary policy (lowering interest rates) may give unemployed consumers more ‘breathing room’ and allows them to find jobs at higher paying, larger, and more productive firms
- Access to consumer credit facilitates self-employment as well as the transition into hiring an entrepreneur’s first employee
- Bankruptcy flags disrupt job finding, business creation, and reallocation of workers across jobs
In the remainder of this essay, we explain each of these findings, the circumstances under which they obtained, and the implications for policymakers and lawmakers.
![]()
Credit cards are a form
of unemployment insurance
Our first main finding is that consumer credit (credit cards, personal revolving loans, and other forms of revolving credit) has an effect on unemployed households that is comparable to unemployment insurance. In simple terms, being able to borrow allows unemployed households to search more thoroughly for a job. Just like unemployment insurance, credit cards and other forms of revolving credit allow unemployed individuals to “hold themselves over” by, say, buying groceries, or in economic terminology, it allows them to “smooth consumption.” Therefore, consumer credit allows them to find better job matches, and, as a consequence, they are paid higher wages.
We begin with a sample of 3 million workers. We first focus on a set of 20,000 displaced workers, some of whom have significant amounts of credit limits, while others have very limited consumer credit access. We use exogenous increases in credit that result from the removal of bankruptcy flags and from automatic increases in credit to isolate credit increases that are not related to an individual’s job prospects and their underlying employability or quality. We find that the more credit unemployed workers have, the longer they take to find a job. Among those who find a job, they find jobs with higher wages.
Delivering equitable growth
Previous article: Supply chains, Susan Helper
Next article: Wealth transfer taxation, Lily Batchelder
These findings suggest that consumer credit acts in a very similar way to unemployment insurance. Existing unemployment insurance studies find that unemployment insurance protracts unemployment durations, and workers generally find higher paying jobs. (This is true in the United States and Europe;55 European estimates, however, are sometimes insignificant or negative).56 The similarity between the way unemployed individuals use consumer credit and unemployment insurance suggests that households have some degree of private insurance against job loss through credit markets, and that government programs in which consumer credit is extended to unemployed individuals rather than as a transfer payment may produce similar disincentive effects.
![]()
Expansionary monetary policy may give unemployed
consumers more breathing room to find better jobs
What are the implications of our findings for monetary policy? The new dataset allows us to measure the impact of consumer credit access on labor market outcomes for the first time. Our results suggest that if interest rates are lowered, or if the government provides some more “breathing room” for unemployed consumers, then they may take longer to find a job, and they may ultimately find better job matches. A direct consequence of this mechanism is that if the government lowers interest rates then the unemployment rate may initially increase. With lower interest rates, and a greater ability to smooth consumption, households may be able to hold themselves over while searching more thoroughly for a job.
Consequently, the duration of unemployment and the unemployment rate will initially be higher following an interest rate decline. Yet the wages of those workers who find jobs will be higher because they are searching more thoroughly and finding better matches. Thus, our research suggests that a central economic-performance indicator of the Federal Reserve should be the wages of new hires, not necessarily the unemployment rate. We believe that by focusing on measures of match quality, the Federal Reserve can take into account the role that credit plays in household job-search decisions as well as have a more complete picture of the health of new labor market matches.
![]()
Access to consumer credit facilitates self-employment as
well as the transition into hiring an entrepreneur’s first employee
Consumer credit is not just used to facilitate a thorough job search, it is also a critical component of financing for the self-employed and job creation.57 To examine the importance of consumer credit for the self-employed, we build another new dataset with 200,000 individuals who have previously filed for bankruptcy and link these individuals to Internal Revenue Service entrepreneur tax records with administrative employment histories, credit histories, and so called SS-4 IRS business ownership data.
Using this dataset, we are able to follow individuals over time and observe all possible employment transitions, comprised of: transitions in and out of working for another business; transitions in and out of self-employment; and transitions in and out of owning an employer firm in the Integrated Longitudinal Business Database, or ILDB, which is the merged dataset of SS-4 ownership records with firm employment.58 Our main source of exogenous variation in credit access comes from the removal of consumers’ bankruptcy flag.59 We show that following bankruptcy flag removal, individuals receive a large increase in consumer credit access. Following this large, discrete, and unanticipated increase in consumer credit access,60 we find what we call the “credit access effect.”
![]()
Bankruptcy flags disrupt job finding, business
creation, and reallocation of workers across jobs
We show, for the first time to our knowledge, that consumer credit is critical for making the leap from a non-employer business to an employer business. In other words, consumer credit facilitates the hiring of the first initial employee, allowing individuals to make the transition out of self-employment into becoming a job-creating entrepreneur. Specifically, we find that:
- Flows into self-employment increase disproportionately after credit access improves. Those individuals who start new businesses earn 4 percent more Schedule C Net Income ($1,000) versus comparable bankrupt individuals who have not yet had their bankruptcy flag removed.
- Following the discrete rise in credit access, these individuals are more likely to become employer firms in the Integrated Longitudinal Business Database
- New-firm owners in this database borrow $40,000 more using mortgages and home equity lines of credit
These findings suggest that consumer credit matters for the subgroup of individuals who want to start a business, and moreover, it matters disproportionately for those individuals who want to grow their businesses.
A crucial fact for subsequent mortgage regulation is that self-employed individuals who make their initial hire borrow $40,000 more than the control group, and they primarily use mortgage credit to facilitate this transition. In particular, they borrow using home equity lines of credit and other forms of high-interest-rate revolving credit.
This is an important set of facts for regulatory institutions, such as the Consumer Finance Protection Bureau, because this implies that restrictions on access to mortgage credit have direct implications not just for “mom-and-pop” self-employed individuals but also for those who intend to grow rapidly and hire additional employees. Consumer credit may not be the only source of financing for these businesses, but our results indicate that it is, on average, an important part of the debt portfolio of young, growing firms.
The United States is currently witnessing a long-run trend decline in startups.61 By further curtailing or restricting consumer credit, startup rates (and in particular high-growth startup rates) may drop. Our research therefore calls for follow-up studies on regulations that the CFPB may consider, and in particular, mortgage restrictions, especially home equity lines of credit.
Using the same dataset, we are able to measure the impact of bankruptcy flag removal on employment prospects and wages as well as on self-employment and business income. Our final policy relevant finding on the topic of consumer credit is that bankruptcy flags are likely misallocating workers across sectors. Using the same dataset of 200,000 individuals who previously filed for bankruptcy, we are able to study the way bankruptcy flag removal affects labor markets, self-employment, and earnings. We notice four broad patterns following bankruptcy flag removal:
- Individuals flow into formal sector unemployment-insured jobs. In simple terms, following bankruptcy flag removal, individuals find jobs that qualify them for unemployment insurance. These jobs provide a safety net to the worker in the case of job loss.
- Those who flow into formal-sector jobs after bankruptcy flag removal earn significantly more and are extremely attached to the formal sector. In simple terms, they earn more and are less likely to end up non-employed than are other comparable individuals without a flag removal.
- Individuals flow out of “informal” sector self-employed jobs. In simple terms, individuals leave self-employment after bankruptcy flag removal, and they subsequently find jobs in the formal sector.
- Individuals also flow into “informal” sector self-employed jobs (as mentioned above). With greater credit access, nascent entrepreneurs can quit their formal sector jobs and use credit to finance their ideas.
The main policy implication of our bankruptcy-flag removal findings has to do with the current debate over the use of credit checks by human resource departments.62 Our results indicate that after bankruptcy flag removal, there is a significant amount of reshuffling of workers across sectors. In economic terms, there appears to be reallocation, although whether this is a welfare-improving reallocation remains to be determined. Based on the wages of new hires and their subsequent job transitions (especially the fact that they do not exit to non-employment), our findings suggest workers with bankruptcy flags are not going to the jobs that value them the most. We therefore suggest to policymakers who are considering credit-check bans to consider the impediments that bankruptcy flags generate for self-employment, formal-employment, and new employment in their cost-benefit analyses.