Interactive: Comparing wages within and across demographic groups in the United States

This post originally published Aug. 23, 2016. It was updated July 9, 2019 to incorporate new data.

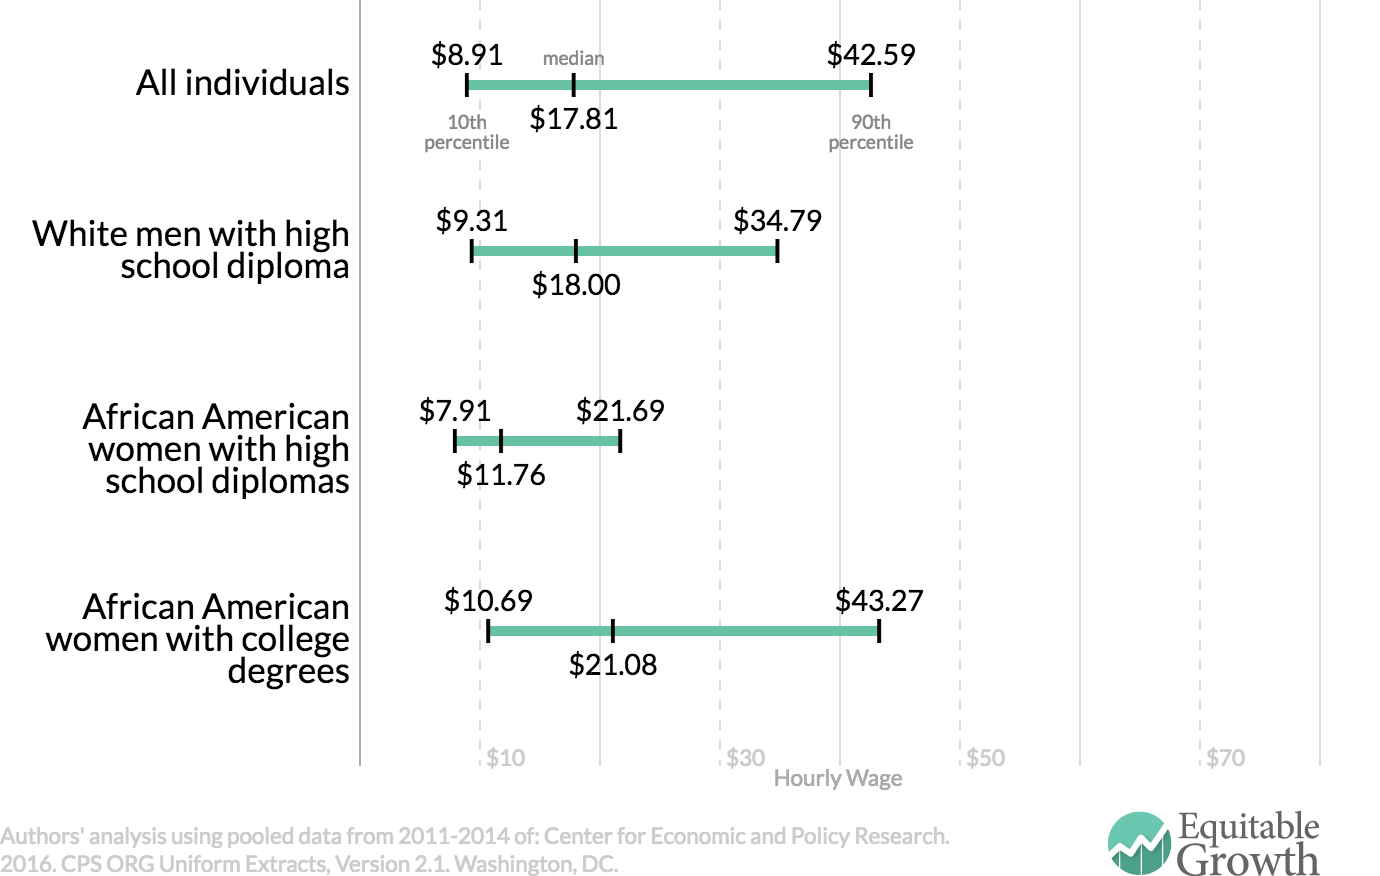
Hourly wages among U.S. workers vary enormously by gender, race, and education level. This simple interactive tool provides a way to see just how much wages vary within and across demographic groups.

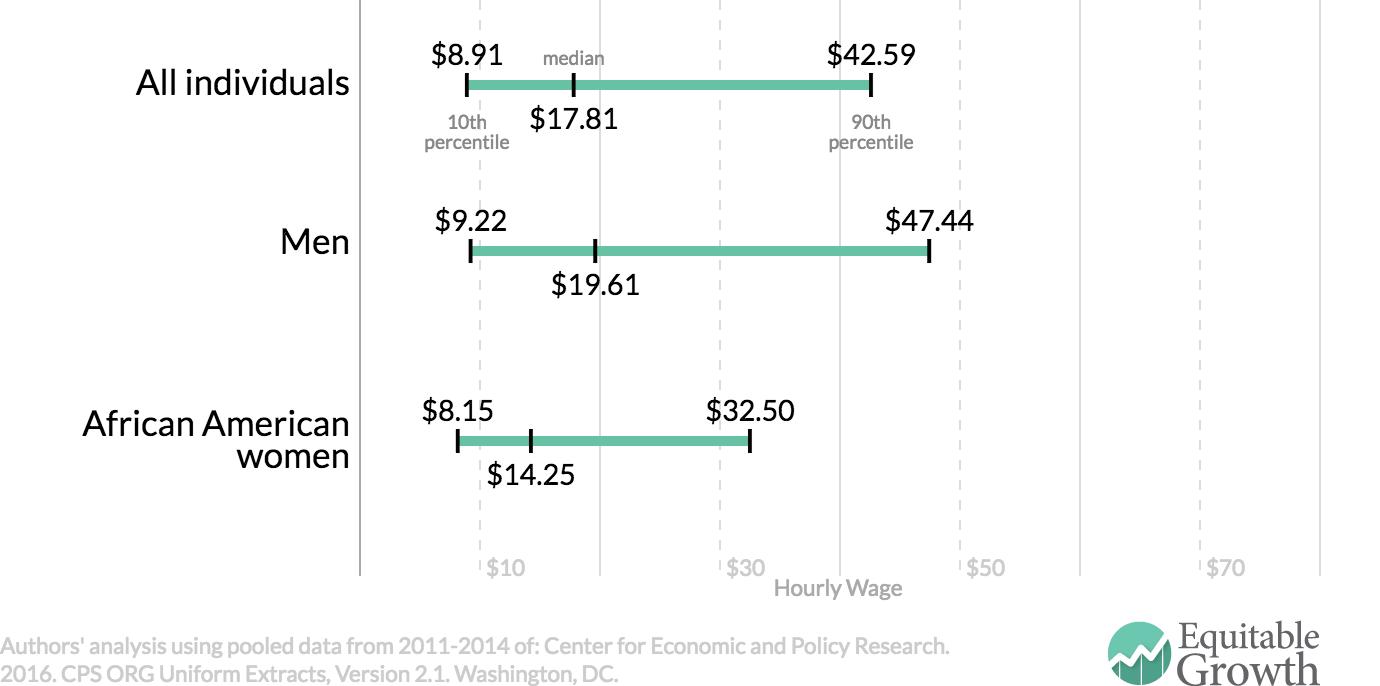
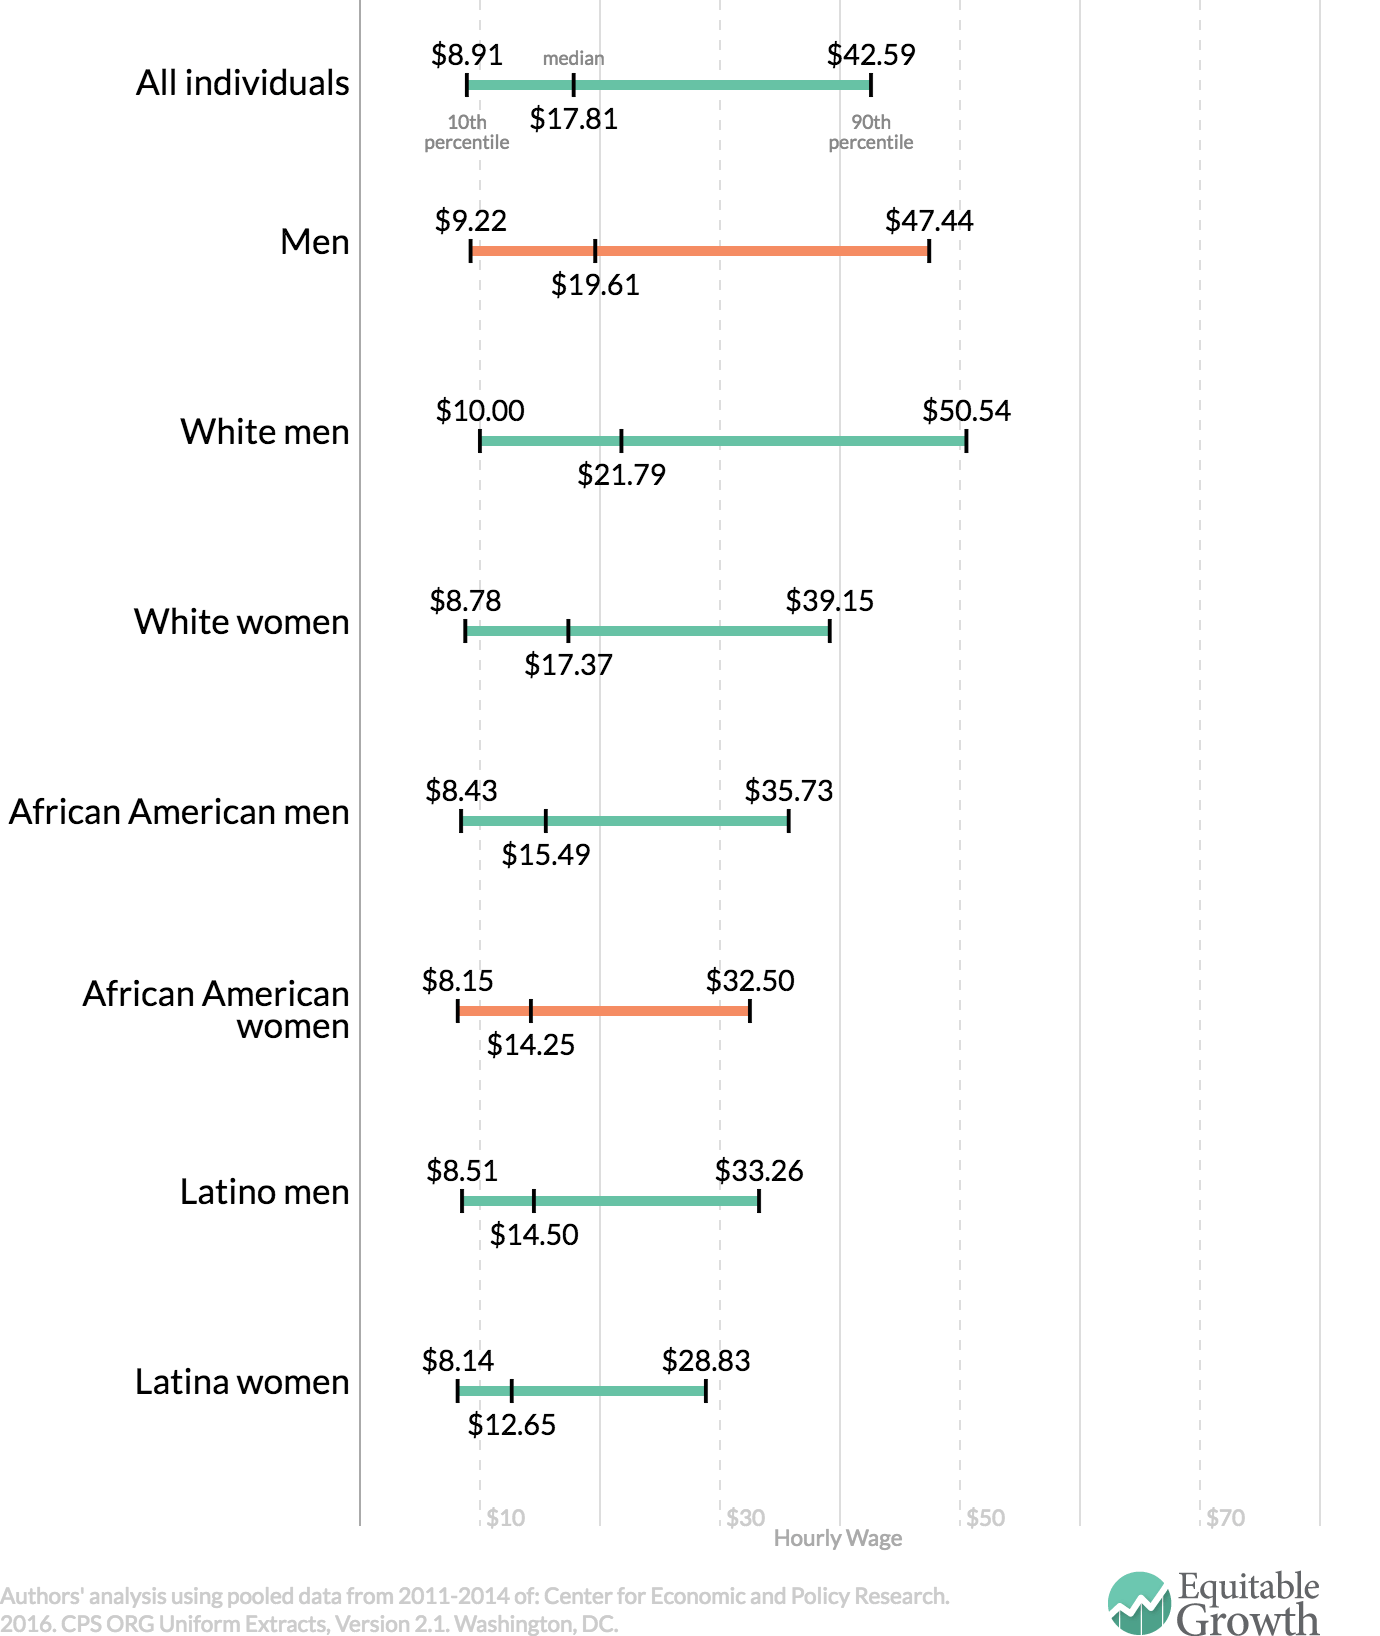
The interactive begins by displaying the 10th, 50th, and 90th percentile hourly wages for people of any gender, race or ethnicity, and education level. The 10th percentile worker is a relatively low-wage worker, who earns more than 10 percent of all workers, but less than 90 percent of all workers. The 50th percentile (or median) worker is the worker right in the middle of all earners, making more than the bottom half of all workers and less than the top half of all workers. The 90th percentile worker is a relatively well-paid worker, who earns more than 90 percent of the workforce, but less than the top 10 percent. Over the period 2013-2016, the 10th percentile worker earned $9.11 per hour, the median-wage workers earned $18.22 per hour, and the 90th percentile worker earned $43.87 per hour (all wage rates have been adjusted for inflation and expressed in 2016 dollars).

Average Wages by Demographics
An interactive look at how wages vary within and between demographic groups
Use the dropdown menus to create a demographic group of your choice, and hit the add button to load it into the interactive. By clicking download image, you can save a shareable graphic.
Gender
Race/Ethnicity
Education level

To see how a certain group fares in comparison to all workers, use the dropdown menus to select a gender (all, women, men), race or ethnicity (African American, Asian, Latino, or white), and an education level (less than high school, high school, some college, four-year college degree, advanced degree) and hit the add button to display the data for this group. The interactive can create many different groups by selecting different demographic combinations and hitting add after forming each one.

To compare the earnings of white men with college degrees to Latina women with college degrees, for example, use the dropdown menus to create and add each group. The result: the lowest-paid white men with college diplomas earn $14.12 per hour, which is about 39 percent more than the $10.14 earned by Latina women with a four-year college degree. At the median, white men with a college degree make $30.00 per hour, or approximately 48 percent more than the $20.28 earned by the median college-educated Latina women. For the best paid workers in both groups—those at the 90th percentile—the pay gap is 59 percent, with white, male college graduates receiving $67.90 per hour, compared to $42.61 garnered by top-earning Latina women with college degrees.

To call out an interesting row in any group of comparisons, hover over the row and the option to highlight that row will appear to change its color. Tapping highlight again returns the row to its original color. To remove a row, the hover function also provides the option to delete a group from the chart.

To begin building a new chart from scratch, hit the red start over button

After you’ve created the comparisons, tap the download image button at the top of the interactive to save the chart, and, then, feel free to share it with the world.

Methodology

The data behind this interactive are derived from the Center for Economic and Policy Research extracts of the Current Population Survey Outgoing Rotation Group. To reduce problems with small samples, we pooled together the 2013, 2014, 2015, and 2016 CPS survey results. We limited our sample to working-age persons (between the ages of 16 to 64). Finally, our estimates of the 10th, 50th (median), and 90th percentile hourly wage are expressed in 2016 dollars and include earnings from overtime, tips, bonuses, and commissions.

After 25 years, it’s time for paid leave

It has been 25 years since the Family and Medical Leave Act was signed into law by President Bill Clinton, providing unpaid leave for qualified workers. Now it’s time for federal paid family and medical leave legislation.

Twenty-five years ago, barely two weeks after Bill Clinton was sworn in as president, he signed his first piece of legislation: The Family and Medical Leave Act. The law provides most workers with the job-protected right to take unpaid time off from work to care for a new child, a sick family member, or one’s own health. Now, it’s time to update the law to include paid leave.

Since its passage, the Family and Medical Leave Act of 1993 has served as a lifeline for workers, having been used more than 200 million times. But the law alone is not enough to address the needs of families in today’s economy: It only covers 60 percent of workers. Those who are excluded are disproportionately low-income and less educated. And even those who are eligible for unpaid time off do not take it, primarily because of financial reasons. Lack of access to paid leave has long-term economic effects as well, such as lower labor-force participation and reduced lifetime earnings.

That is why Congress needs to pass a comprehensive federal paid family and medical leave policy and the president needs to sign it. Federal policymakers can learn from the experience of the states such as California, New Jersey, and Rhode Island, all of which boast successful state paid leave laws, to craft a policy that is based on evidence garnered in our own backyard.

Last fall, we wrote a paper for The Hamilton Project at The Brookings Institution on the updates to U.S. labor policies that are necessary to address the concerns of 21st century families. In our report, we dug into the research to outline what must be included in a federal paid leave policy that benefits workers and their families while improving broad-based economic growth. Based on the evidence, we proposed that a successful paid leave policy must include the following:

  1. Cover the range of family and medical needs that require time away from work. Much of the discussion today around paid leave centers on parental leave to care for newborn children, but an effective paid leave program must include leave for workers to address their own illness or that of a family member. As the population ages, an increasing number of workers need time off to care for an aging parent or relative. And over half of those who used unpaid leave last year did so to address a personal medical concern.
  2. Be available to all workers, men and women, equally. An effective paid leave program should cover all workers regardless of employer identity or size, or the worker’s full-time or part-time status. It should also use an inclusive definition of family. Furthermore, paid leave should be gender neutral, following the example of the Family Medical Leave Act in providing eligible men and women with the same amount of leave.
  3. Provide adequate length of leave to address care needs. Paid leave should entail at least 12 weeks of leave, allowing families enough time to deal with a serious illness or to care for a new child.
  4. Have a sufficiently high replacement rate to make a difference in people’s lives. Wages should be replaced at a level sufficient to protect families at a time when household expenses rise. We suggest that, at the minimum, a national policy mimics New Jersey’s 66 percent wage replacement with a cap that prevents benefits from being overly generous to high-income families.

Each of these principles is based on evidence from the states, as we detail in our paper. In order to avoid burdening employers, all of the state programs are based on a social insurance system. That means the state governments collect a small payroll tax from employees (and in certain states, employers as well) and then pays out benefits directly to workers. A version of these models could be easily replicated at the federal level.

These policies have been overwhelmingly successful, with these states seeing, for example, increased labor-force participation, hours worked after the birth of a child, and a decline in the use of public assistance to cope with family medical emergencies. To date, there is no evidence that firms experience higher employee turnover or rising wage costs. In fact, a study done by Pew Research Center found that paid leave makes it more likely that workers return to their original employer compared to unpaid leave.

The 25-year-old Family and Medical Leave Act is not enough for workers or the U.S. economy today. A well-designed federal paid leave program based on a social insurance model would benefit U.S. workers and the U.S. economy alike.

Why, despite post-racial rhetoric, do racial health disparities increase at higher income levels?

A research technician at the University of Pittsburgh Medical Center collects blood pressure data from a patient.

Persistent disparate health outcomes between black and white Americans are a major contributor to the United States’ poor performance on international measures of health. These disparities cannot be explained by socioeconomic status alone. While health outcomes generally improve with socioeconomic status, the disparity in health outcomes between black and white Americans not only persists but often worsens with higher socioeconomic status.

In my new working paper, “Post-racial rhetoric, racial health disparities, and health disparity consequences of stigma, stress, and racism,” I explore this paradox, placing it within the context of neoliberal rhetoric and the political narrative that the United States has entered a “post-racial” era, and I propose a new framework for empirical research to explore and explain this trend.

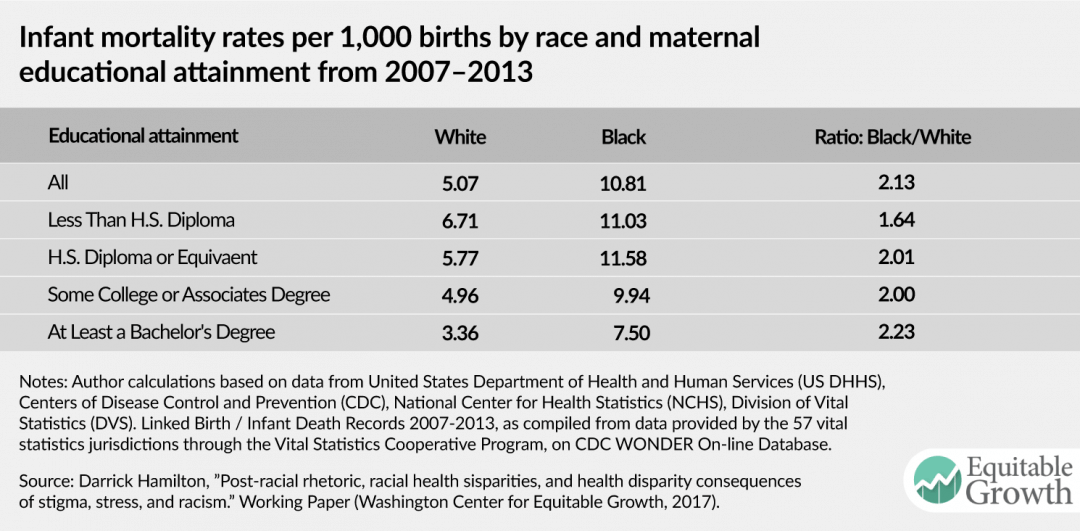
One example is that the racial differences in infant mortality actually worsen with higher levels of both education and income. The infant mortality rate for all white women, regardless of education, was 5.07 per 1,000 from 2007 to 2013; for black women, the corresponding figure was 10.81 per 1,000, a ratio of 2.13. When you break down infant mortality rates by education, you find that disparity actually worsens at higher levels of educational attainment. While the infant mortality rate for babies born to white women with at least a bachelor’s degree is 3.36 per 1,000, for babies born to black women with the same level of education the rate is 7.5 per 1,000, which is still more than the rate for babies born to white women with less than a high school degree. The ratio of black to white infant mortality rates for babies born to a mother with at least a bachelor’s degree is 2.23, the highest ratio for any level of educational attainment. (See Table 1). In fact, the ratio rises fairly steadily for each level of educational attainment.

Table 1

This pattern is not limited to infant mortality. An analysis of health data by Ahmedin Jemal and his co-authors found this pattern of mortality disparities with rising levels of educational attainment across many major disease types, including cancer, heart disease, stroke, and HIV-related causes.

That disparities in health outcomes increase with educational attainment flies in the face of American political rhetoric that emphasizes personal responsibility and hard work. This neoliberal rhetoric, combined with a narrative that the United States is now post-racial, places responsibility for continued disparities in outcomes squarely on individual choices and actions and ignores structural factors and an environment of continuing racism. Personal responsibility, hard work, perseverance and—especially—education are supposedly all that one needs to achieve better life outcomes, regardless of where you come from, how much your parents earned, or the color of your skin.

But the evidence contradicts that rhetoric. Across health, wealth, employment, and education, racial disparities persist, regardless of socioeconomic status, in all four outcomes with the exception of one: educational attainment. Ironically, education is an indicator in which blacks perform relatively better than whites once family socioeconomic background is controlled.

So, what explains the increasingly disparate health outcomes for more highly educated black Americans? Research on racial health disparities has largely focused on socioeconomic status as an explanatory factor, as William W. Dressler and his co-authors point out in their literature review of models of racial health disparity. According to this theory, it is because black Americans are overrepresented in lower socioeconomic strata that they have worse health outcomes. However, as we have just seen, even when controlling for socioeconomic status, not only is there still a disparity in health outcomes, but the racial disparities often worsen with more education.

A new framework is needed to analyze the paradoxical health outcomes for high socioeconomic black Americans. Research by Sherman James offers a starting point for this new theoretical framework: “John Henryism,” a reference to the fable of the black railroad worker who beats a machine in a race to dig a tunnel only to collapse to death from his overexertion.

In this framework, the disparate health outcomes of black Americans—especially related to hypertension—are analyzed within the context of the disproportionate race-related stress they face. Blacks from lower socioeconomic strata are presumed to be chronically exposed to psychosocial stress such as threat of job loss, having to make ends meet, and social insults related to race and class, among other factors. They have to exert considerable energy on a daily basis in order to cope with these conditions of uncertainty and corresponding high anxiety. James developed a scale, which he labeled John Henryism, to quantify this “effortful coping,” which measured efficacious mental and physical vigor, a strong commitment to hard work, and single-minded determination to succeed.

In a series of experiments, James found that the combination of high John Henryism ranking and low socioeconomic status was associated with high blood pressure. When examining within races, James found that there was very little difference in blood pressure within socioeconomic strata among whites, regardless of their John Henryism scores. However, among blacks, those with low socioeconomic status and high John Henryism scores had the highest blood pressure. The unfortunate irony is that these findings suggest that blacks who work the hardest to cope with a stressful situation experience worse health outcomes.

While James only analyzed the intersection of socioeconomic status, health, and “effortful coping” within race, his work could provide a framework for further analysis and empirical studies into the paradox of worsening health disparities for black Americans of higher socioeconomic status across race.

The persistence of earnings differences among white and black men

Slavery in the United States ended more than 150 years ago. In that time, black men have seen their relative earnings rise compared with those of white men, but the pace of progress has been slow, and racial economic inequality remains strongly persistent. In 2015, when including those out of the labor force, the median African American man in his prime working years—ages 25 to 54—earned $23,000 compared with the $44,000 earned by his white counterpart.

But what explains this gap? Is it possible that the weak pace of economic convergence reflects the very low average starting position of black men at the time of emancipation? Is this earnings gap a legacy of the abject poverty of the enslaved? Or perhaps instead, do black men face unique challenges in escaping poor backgrounds—a legacy of race and discrimination rooted in the history of slavery yet persistent in other ways after emancipation?


New Working Paper
Up from slavery? African American intergenerational economic mobility since 1880


Most likely, today’s earnings gap is a combination of both factors, but to shed light on the relative importance of the initial poverty level of newly emancipated black men and race-specific barriers to economic convergence since then, we assembled new data to measure the rate of father-to-son economic status transmission over the past century and a half. Because we cannot observe income in the data from the late 19th century and early 20th century, we estimate income based on occupation, race, and geography.

We were particularly interested in whether poor white families in America experienced slow convergence toward the population’s mean earnings historically. If so, then that would suggest that poverty’s historical legacy has been powerful and that the slow pace of black men’s advance may largely reflect their initial concentration at the bottom of the U.S. economic and social ladders. If not, then it would suggest that race-specific factors have been paramount.

For cohorts of black and white sons born after 1940, federally collected and publicly available data sets provide sufficient information to compare the economic status of father-son pairs by income. But for earlier cohorts, observing father-son relationships requires more work. We created new data sets of father-son pairs by using samples of the U.S. census from 1880, 1900, 1910, and 1930, observing sons in their fathers’ households when the fathers were at work and then observing sons again 20 years later when they were in the labor force themselves. These linkages across time reveal father-son economic status relationships akin to those we see for later cohorts—even though we cannot measure income itself among those pre-World War II generations of black and white men.

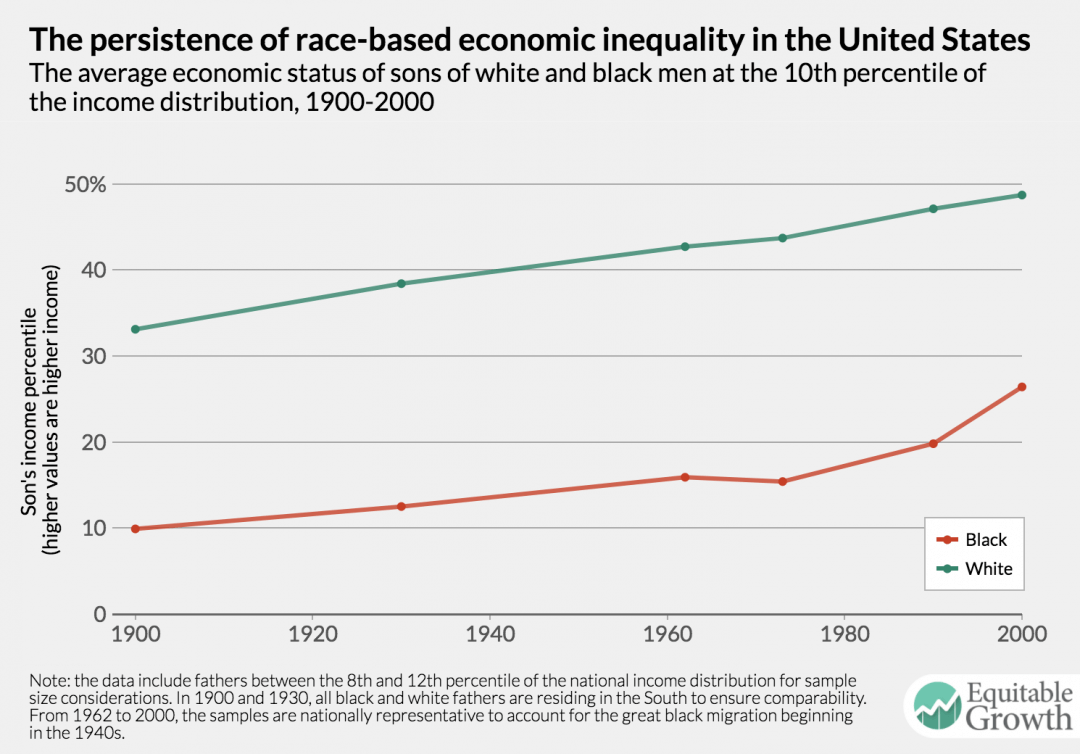
Our results indicate that the “penalty” for being black in the intergenerational mobility process has been large and persistent since 1880. For each cohort we observe, black sons, on average, ranked roughly 20 percentile points lower in the national income distribution than whites with similarly situated fathers. This is true even within the South, where 95 percent of black Americans lived at the time of emancipation. In short, poor black and poor white children have faced sharply different prospects for their adult earnings throughout U.S. history.

This means that the racial economic inequality we observe in each cohort was primarily the product of race. These disadvantages for black children are readily apparent when we compare the fortunes of black and white sons of fathers at the 10th percentile of the national economic status distribution in each period. (See Figure 1.)

Figure 1

Our research also finds that the differences in average outcomes conditional on parental economic status among black and white men are not explained by differences in many nonincome personal attributes, such as childhood location, education, and their parents’ marital status. But controlling for educational test scores—through which we measure acquisition of human capital skills rather than the traditional standard measurement of educational achievement—substantially reduces the gap in earnings among black men and white men.

These findings provide a window into possible remedies for the persistent earnings gaps among white and black men. Equalizing children’s opportunities to build human capital may be critical first steps toward ameliorating racial inequality in adulthood.

—William J. Collins is the Terence E. Adderley Jr. Professor of Economics at Vanderbilt University and Research Associate of the National Bureau of Economic Research, or NBER. Marianne H. Wanamaker is an Associate Professor of Economics at the University of Tennessee, a Research Fellow of the Institute for the Study of Labor, and Faculty Research Fellow of the NBER.

Minimum wages and the distribution of family incomes in the United States

The ability of minimum-wage policies in the United States to aid lower-income families depends on how they affect wage gains, potential job losses, and other sources of family income, including public assistance. In contrast to a large body of research on the effects of minimum wages on employment,1 there are relatively fewer studies that empirically estimate the impact of minimum wage policies on family incomes.

In my new paper, I use individual-level data between 1984 and 2013 from the Current Population Survey by the U.S. Census Bureau to provide a thorough assessment of how U.S. minimum wage policies have affected the distribution of family incomes.2 Similar to existing work, I consider how minimum wages influence the poverty rate. Going beyond most existing research, however, I also calculate the effect of the policies for each income percentile, adjusting for family size. This highlights the types of families that are helped or hurt by wage increases. I also calculate the effect on a broader measure of income that includes tax credits and noncash transfers. I quantify the offset effect of higher wages on the use of transfer programs and the gains net of the offsets by income percentiles, painting a fuller picture of how minimum-wage policies affect the U.S. income distribution and the overall well-being of U.S. families.


New Working Paper
Minimum wages and the distribution of family incomes


Overall, I find robust evidence that higher minimum wages lead to increases in incomes among families at the bottom of the income distribution and that these wages reduce the poverty rate. A 10 percent increase in the minimum wage reduces the nonelderly poverty rate by about 5 percent. At the same time, I find evidence for some substitution of government transfers with earnings, as evidenced by the somewhat smaller income increases after accounting for tax credits such as the Earned Income Tax Credit and noncash transfers such as the Supplemental Nutrition Assistance Program. The overall increase in post-tax income is about 70 percent as large as the increase in pretax income.

Effect of minimum wages on poverty

I use individual level data from the UNICON extract of the March Current Population Survey between 1984 and 2013. I focus on the nonelderly population under 65 years of age. I define family income following the official poverty measurement, using (pretax) cash income, and adjust for family size and composition using Census Bureau guidelines.3

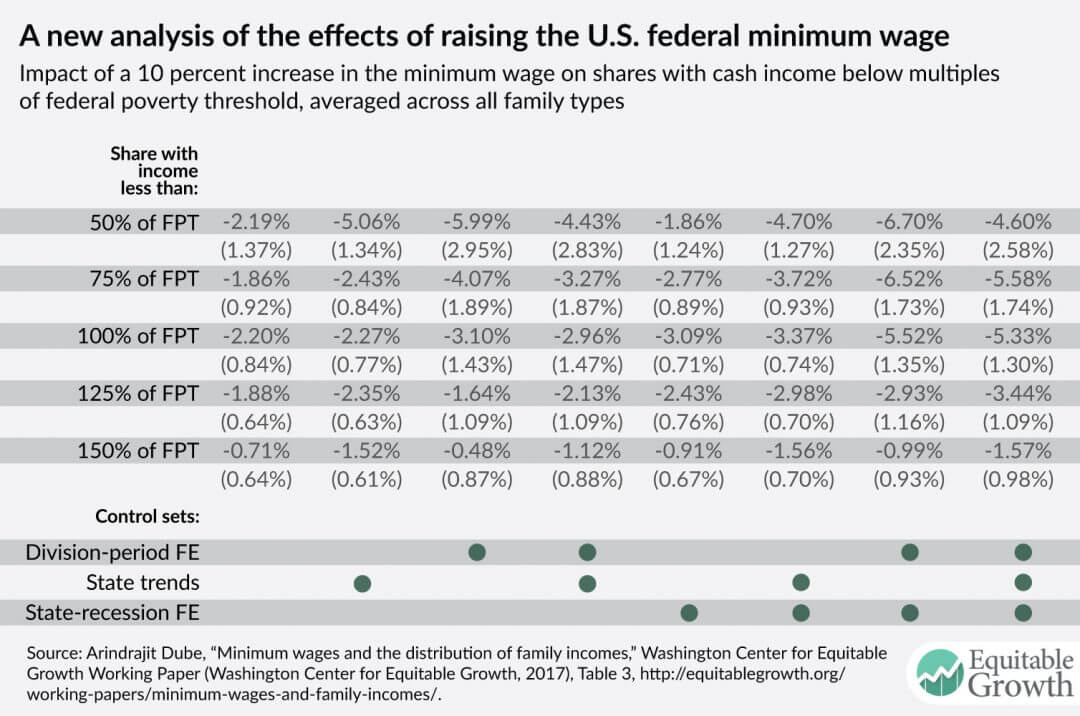
I find that a 10 percent increase in the minimum wage reduces poverty among the nonelderly population by 2.1 percent and 5.3 percent across the range of specifications in the long run (three or more years after the policy change). There are also reductions in shares earning below 125 percent and below 75 percent of the poverty threshold. For my preferred model with the richest set of controls, the falls in shares below 75 percent, 100 percent, and 125 percent of the poverty threshold are 5.6 percent, 5.3 percent, and 3.4 percent, respectively, from a 10 percent increase in the minimum wage. (See Table 1.)

Table 1

Since minimum wage policies are not randomly assigned across states, it is important to account for any bias that may arise from differences across states raising the minimum wage as compared to those which do not. For instance, there is a strong regional clustering of minimum wage policies.4 Economists disagree, however, on the best way to account for such biases. For this reason, I report results using eight different specifications with alternative controls for state-level controls that subsumes most of the approaches used in the current economics literature on minimum wages. Starting with the classic model that assumes all states are on parallel trends (known as the two-way fixed effects model), I progressively add regional controls (division-period effects), state-specific linear trends, and state-specific business cycle effects. This exercise allows the evolution of family income distribution to differ across states in many different ways.

Moreover, all of these controls have been shown to be important in the existing minimum-wage literature.5 Importantly, all of these specifications find that increases in the minimum wage reduce the nonelderly poverty rate.6 At the same time, as I show in the paper, the specification with all three sets of controls (the last column in Table 1) performs the best in a variety of falsification tests, meaning they do not spuriously suggest an effect much earlier than the policy change or suggest effects much higher up in the income distribution. This is why I consider it the preferred specification.

Effect of minimum wages on family-income distribution

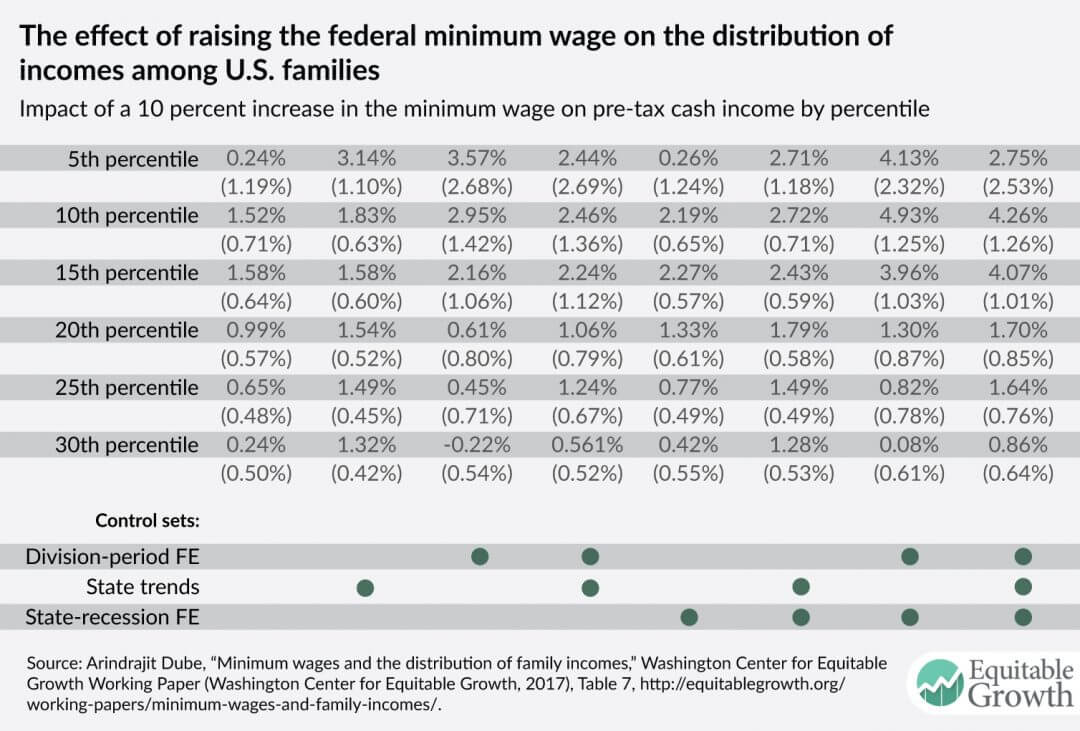
In my paper, I use the shift in the cumulative distribution of family income to calculate income changes by percentiles. I find that the largest increases occur between the bottom 10th and 15th percentiles. A 10 percent increase in the minimum wage raises pretax cash incomes in this range anywhere between 1.5 percent and 4.9 percent depending on control sets. (See Table 2.)

Table 2

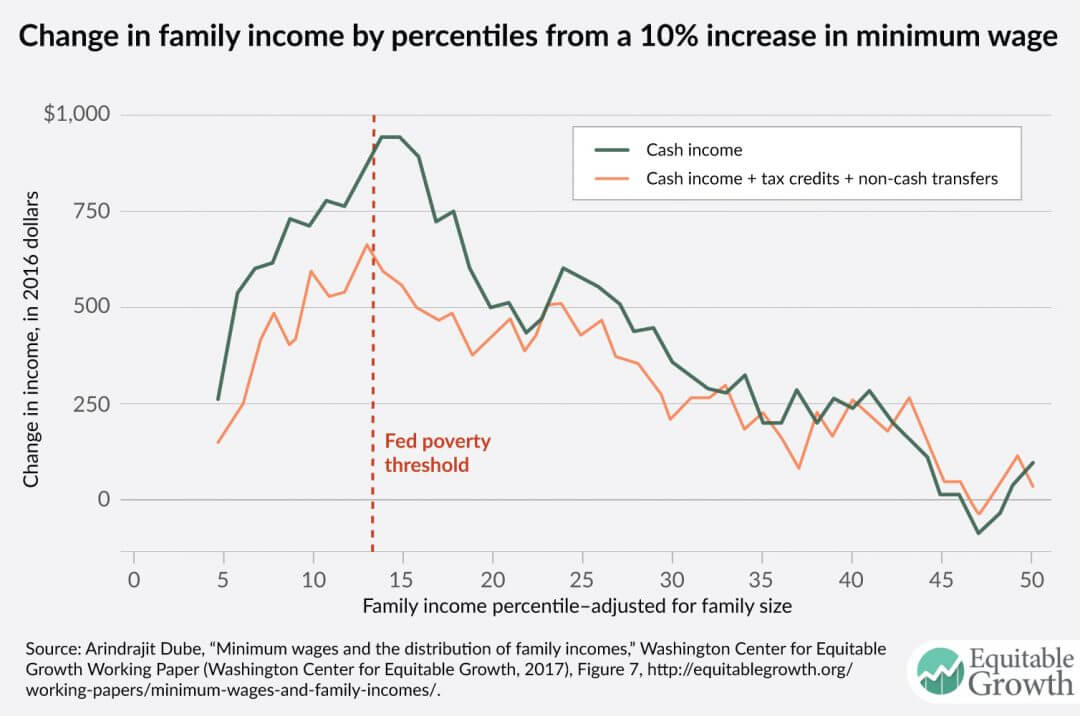
Some of the increase in pretax cash incomes among these families at or near the bottom of the income distribution is offset by reduced tax credits and noncash transfers. Losses in tax credits (such as the Earned Income Tax Credit and the Child Tax Credit) and noncash transfers (such as the Supplemental Nutrition Assistance Program) offset some of these gains. For the bottom quartile, the income gains are approximately $370 after accounting for these offsets due to reduced tax credits and noncash transfers—or around 70 percent as large as the pretax cash income gains. The offsets appear to be particularly pronounced between the 13th and 17th percentiles of the income distribution.

These findings are consistent with some individuals losing eligibility for benefits as a result of increased income. Typically, eligibility for supplemental nutrition assistance, for example, requires income to be less than 130 percent of the federal poverty threshold, which for this population binds just under the 15th percentile. On average, those in the bottom quartile of the income distribution can expect an approximately $525 increase in annual income from the minimum-wage policy; the gains are largest around the 15th percentile. (See Figure 1.)

Figure 1

Policy implications

To put the policy implications of these estimates in perspective, I calculate the impact from an increase in the federal minimum wage from the current $7.25 per hour to $12 per hour. One could use the same estimates in this paper to project the impact of alternative policies—such as raising the minimum wage to $10 per hour or $15 per hour. The caveat is that when considering inflation-adjusted minimum-wage levels much larger than those used in the study, the projections may be less reliable.

Taking into account the state minimum wages as of January 2017, an increase in the federal minimum wage to $12 (in 2017 dollars) would raise the effective minimum wage—meaning the maximum federal or state standard—by 41 percent. The long-run estimates from the paper and a 13.5 percent poverty rate among the nonelderly population in 2016 suggests a 2.45 percentage point reduction in the poverty rate from this minimum wage increase. Given the roughly 270 million nonelderly Americans in 2016, this translates into 6.6 million fewer individuals living in poverty.

We can also expect the same minimum-wage increase to raise family incomes by 14.5 percent at the 10th percentile of the family-income distribution in the long run. For the average family near the 10th percentile in 2016, this translates into an annual increase of $2,538, and after accounting for the offset due to reduced tax credits and noncash transfers, this amounts to an increase of $2,140.If we take the range of estimates from all specifications, the proposed minimum wage changes can be expected to reduce the poverty rate among the non-elderly population by 1.00 and 2.53 percentage points, hence reducing the number of non-elderly individuals living in poverty by somewhere between 2.7 and 6.8 million. For the 10th percentile of family incomes, this translates to an annual income increase ranging between 5.2 and 16.8 percent, or between $905 and $2,937. After accounting for offsets due to lost public assistance, the income increases would range between $657 and $2,790.
To put these changes in context, the Earned Income Tax Credit reduces the nonelderly poverty rate by around 1.7 percentage points, and cash transfers (means tested and nonmeans tested) reduce it by around 3.8 percentage points, while noncash transfers (other than Medicaid) reduce it by around 0.9 percentage points. In other words, a substantial increase in the minimum wage would likely have a positive impact on the nonelderly poverty rate comparable to means-tested public assistance programs.

These calculations did not factor in how minimum-wage increases may affect overall consumer prices, though such price increases are very small compared to the income gains for those in the bottom of the income distribution. The expected price increase from raising the federal minimum wage to $12 per hour would be less than 1 percent.7 Therefore, netting out any price increases does not substantially affect the real income gains for the bottom quarter of the income distribution. Price increases do mean, however,  that a sizeable portion of these income gains at the bottom are likely to be borne by middle- and upper-income consumers through small increases in prices.

Conclusion

A substantial increase in the federal minimum wage can play an important role in reducing poverty and raising family incomes in the United States at the bottom of the income ladder while reducing the use of public assistance. The loss in cash and noncash transfers and tax credits among those who would benefit the most from minimum-wage increases is likely to dampen some of the benefits, especially among those around the poverty line, yet the resulting public savings could be ploughed back into further shoring up the safety net—in turn increasing the complementarity between minimum wages and income support for raising the incomes of families at the bottom of the income ladder.

—Arindrajit Dube is an associate professor of economics at the University of Massachusetts, Amherst

Download File
Minimum wages and the distribution of family incomes in the United States

Read the full PDF in your browser

Unemployment insurance reform: a primer

AP Images

About the author: Till von Wachter is a professor of economics and the associate director of the California Center for Population Research at the University of California-Los Angeles.

The Unemployment Insurance system provides temporary and partial earnings replacement for workers that have become unemployed through no fault of their own and are actively searching for work. To facilitate reemployment, the UI system is complemented by job search assistance and training services. Within a common federal framework, states set the main parameters of the UI system and are responsible for financing benefits via payroll taxes, though federal funding has played an increasing role, especially in economic downturns.

In the United States, and most other developed countries, unemployment insurance is the main program helping to buffer the shock of layoffs and unemployment. The UI system provides vital benefits for laid off workers and families to weather the high and persistent costs of layoffs, especially in recessions. By preventing cuts in consumption, UI benefits can also function as an automatic stabilizer in economic downturns. Given high layoff rates even in normal economic times, the insurance provided by UI also plays an important role by supporting a well-functioning, dynamic labor market.

The need for common sense and
evidence-based unemployment insurance reforms

While most observers agree that the current structure of the unemployment insurance system is fundamentally sound, there is also widespread agreement that the UI system is in need of reform. There are several major issues to be addressed, First, the current UI system suffers from financial instability that risks compromising its major role as adjustment mechanism in recessions. Second, the coverage of UI has eroded over time, with a declining fraction of workers receiving lower benefits amounts. Third, UI does little to avert the large, long-lasting earnings losses among reemployed workers. And fourth, there are persistent questions about the effectiveness of UI and related programs to quickly reemploy job losers.

Delivering equitable growth

Previous article: Social Security, Jesse Rothstein
Next article: U.S. labor market mobility, Abigail Wozniak

The good news is that, in many ways, unemployment insurance appears to be an ideal target for bipartisan reform. First, there is a set of straightforward, common-sense goals for a well-functioning UI system. These goals include, among others: that UI should provide a sufficient buffer to avoid financial difficulties after layoff, especially for families with children; that UI should encourage speedy reemployment of the unemployed; that UI plays a clear role in economic downturns, and hence should not be at the discretion of local or federal politics; and that UI should be financial sound.

Second, Unemployment Insurance reform is an almost ideal example of the potential for evidence-based reform. There is a lot of high-quality evidence on the working of the UI system. A lot of the additional evidence needed for more-informed policymaking can potentially be obtained at arm’s length, especially in a data-rich environment. The following “primer” discusses and summarizes core pieces of recent evidence on job loss, unemployment, and the current UI system, and then relates them to a series of reform proposals. The reform proposals can be grouped into those that deliver a basic “tune up” of the current UI system, and those that provide more fundamental “modernization.” These are summarized here:

“Tune-up” (minimal) reforms:

  • Prevent erosion of benefit generosity by mandating minimum UI benefits
  • Institutionalize federal emergency unemployment compensation
  • Fix outdated system of data collection to enable evidence-based policies
  • Expand coverage of UI to fit structure of modern workforce
  • Resolve financing short-falls in states’ UI trust funds by modifying tax base

Modernization reforms:

  • Institute functioning system of job sharing to prevent costly layoffs
  • Experiment with wage insurance to aid workers returning to employment

These proposals will be related to the issues they resolve and the evidence they rest on after a brief primer on the main available evidence about the UI system.

A primer on evidence about
the Unemployment Insurance system

A few key themes arise from extensive research on core aspects of the Unemployment Insurance system.8 While additional research is needed, the good news that the much of the data needed is potentially available at low cost from the UI system itself.

Point 1: The current benefit levels and durations appear appropriate. An increasing number of studies have shown that current Unemployment Insurance benefits provide an important buffer against consumption losses for a substantial number of unemployed workers. While a large number of studies have established that UI also tends to prolong unemployment and hence reduce tax revenues, it appears at current levels that the social benefits outweigh the budgetary costs. Recent research also gives clear guidance that UI benefits should be extended in recessions, and when they should be targeted to certain groups of individuals.

Point 2: The coverage of Unemployment Insurance has eroded over time. It is well known that on average only half of the unemployed receive UI benefits, substantially limiting the program’s scope to insure individual earnings shocks and provide an automatic stabilizer. This is partly because up until recently UI rules in most states explicitly exclude certain groups of unemployed—those engaging in full- or part-time education, those seeking part-time employment, or those with low earnings. Partly it arises because of a low take-up rate of benefits among those eligible.

Point 3: The effects of layoff are felt long after unemployment. An increasing amount of evidence suggests that the effects of job loss are felt long beyond reemployment, including effects on earnings, health, and child outcomes.9 Children of job losers suffer from the consequences even as adults. Overall, research suggests UI benefits only make up a small portion of the earnings lost at job loss.

Point 4: Current reemployment efforts show mixed success. While many programs aiming to aid Unemployment Insurance recipients to find work are successful and sometimes cost-efficient, increasing evidence suggests that substantial hurdles for successful reemployment remain, especially for older and longer unemployed workers. Especially for these individuals, longer UI benefits do not improve and may even reduce job quality. Although the evidence is mixed, an ongoing concern is UI may damage reemployment prospects by lengthening the unemployment spell.10

Point 5: The federal-state relationship needs to be fixed. Although in principle the nature of Unemployment Insurance taxes should lead state UI trust funds to balance over the business cycle, reductions in UI tax rates and a low tax base have led to financing shortfalls. As a result, benefit extensions during recessions have been increasingly financed by ad hoc federal measures. To partly resolve budget short falls, several states have begun cutting benefits. Currently, political constellations at the state level have led to a patch-work of UI reforms, exposing similar workers to different UI systems. The current system also suffers from a wasteful lack of data-sharing that prevents meaningful management and study of the UI program.

Proposals for “tune up” (minimal reforms)
of the Unemployment Insurance system

Policy analysts and researchers have discussed the need to modernize the unemployment insurance system for some time. This discussion received momentum during the Great Recession. The result has been a series of well-articulated proposals, and convergence on a list of basic fixes. Several of these reform proposals have made it into President Obama’s Budget Proposal for fiscal year 2017, which begins in October 2016. The following is a list of the core proposals, including a brief summary of their justification.

Prevent erosion of benefit generosity by mandating minimum duration of 26 weeks

The issues. Partly to counter funding difficulties in the aftermath of the Great Recession, several states have cut benefit durations below the typical 26-week mark. Similarly, there is substantial heterogeneity in benefit levels across states. Yet, there are no compelling reasons why similar workers in different states should be treated different by the Unemployment Insurance system. Research provides justification for the optimal generosity of UI benefits, and when these should vary with characteristics of workers or local labor markets. Hence, the choice of benefit parameters and how they vary in the population or over time should not be a function of the local political process or short-term funding needs.

Proposed changes. Federal law should mandate a minimum amount of potential duration of Unemployment Insurance benefit of 26 weeks, an average effective replace rate of 50 percent of benefits (with gradual adjustments of the maximum benefit amount), and a dependent allowance to support families with children with higher consumption commitments. To ensure states update their laws, the federal government can limit the credit for the State Unemployment Tax employers receive against the Federal Unemployment Tax.

Institutionalize federal emergency Unemployment Insurance benefits as function of local unemployment

The issues. Research clearly indicates that Unemployment Insurance benefits should be extended in recessions. This is because the benefits to workers at risk of exhausting their benefits are greater, the inefficiency costs are not larger and perhaps smaller, and the potential of stimulating effects is greater. The experience in the aftermath of the Great Recession has shown that leaving extensions of UI benefits to the political process can lead to gaps in coverage that are damaging to affected workers. For most recessions, there is no evidence indicating a need for wasteful and potentially harmful discretion.

Proposed changes. The federal Emergency Unemployment Compensation program should be made a permanent program. A straightforward way to achieve is to reform the current Extended Benefit program and make it 100-percent federally financed. In the course of such a reform, the trigger structure should be modified to keep the fraction workers covered by UI approximately constant over the business cycle.

Fix outdated system of data collection to enable evidence-based policies

The issues. To maintain daily operations of their Unemployment Insurance programs, states collect information on workers’ wages, UI claimants’ benefits, and their employers’ UI taxes. This information is vital for an efficient administration of the UI system, including understanding which parts of the system are cost effective. Yet the current law only requires states to share the data with federal agencies for extremely limited purposes. Moreover, many of the data sets lack basic information, such as on worker age or gender. Ample experience now exists to cheaply handle and combine sensitive administrative data.

Proposed changes. The data collection should be modernized by adopting four complementary strategies: enhance data collection by states; establish a national data clearinghouse of Unemployment Insurance data at either the U.S. Bureau of Labor Statistics or the U.S. Census Bureau; support these changes by providing a common software and offering moderate grants for upgrade hardware; and establish a protocol to allow to access the data for research purposes and to improve the UI system. It is important to include an enforcement mechanism to ensure states’ compliance with this requirement.

Expand coverage of Unemployment Insurance to fit structure of modern workforce

The issues. The current Unemployment Insurance system does not serve a large fraction of the unemployed. This is partly due to changes in the structure of the workforce, with increasing amounts of low-wage workers in unstable jobs or rising part-time employment especially among women. Through incentives provided by the American Recovery and Reinvestment Act of 2009, a substantial number of states have now made benefits more easily accessible by adopting a range of proposals.

Proposed change. A reform should provide pathways to harmonize eligibility for Unemployment Insurance across states and increase take-up rates among eligible individuals. There is little justification for the current patchwork of eligibility, and meetings of state and federal UI officials should provide a system of best practices for eligibility requirements and outreach. Eligibility requirements should include those proposed in the American Recovery and Reinvestment Act, among them allowing for training of UI beneficiaries, enabling part-time workers to claim benefits, enhancing the mobility of working couples by making moves for family-related reasons a qualifying event for UI, and instituting the alternative base period. In addition, some of the gradual restrictions imposed over the last three decades to lower UI payments should be reviewed and possibly modified as well.11

Resolve financing short-falls in states’ UI trust funds

The issues. As a consequence of growing wages (and hence benefits) and low taxable wage bases that are not indexed to covered wages, just 25 percent of earnings covered by Unemployment Insurance laws nationally are currently subject to state UI payroll taxes. The minimum taxable wage base, set by the federal government, is currently $7,000 and has not changed since 1983. Similarly, the net federal tax rate—as defined under the Federal Unemployment Tax Act, or FUTA—has been 0.8 percent for more than 30 years, depressing revenues that pay, among others, for UI administration by federal and state agencies.12 Many states’ UI taxes—as defined by their State Unemployment Tax Act, or SUTA—have remained low as well, and states have increasingly resorted to borrowing to finance UI benefits in recessions. Hence, even without the large increase in UI payments during and after the Great Recession the financial soundness of the UI system was steadily eroding.13

Proposed changes. Several sensible reforms of the complex financing system have been proposed. One is to raise the federal taxable wage base, index it to wage growth, and correspondingly lower the FUTA tax rate.14 Another is to institute federal penalties for states that fail to carry sufficient forward balances in their trust funds during expansions.15 And a third is to prevent payroll taxes from rising in the midst of a protracted recovery by extending the 2-year window until FUTA tax credit expires, institutionalizing interest wavers, and encouraging states to also delay automatic tax triggers aimed at balancing their trust funds.

Additional proposal worthy of consideration but not discussed further here

There are additional interesting proposals meant to fix additional shortcomings of the current unemployment insurance system. In addition, there are challenging open questions that have not yet been addressed. These proposals and open questions include, among others:

  • A modernization of the administration of Unemployment Insurance, including information technology used to administer claims, which is found to be often outdated and underfunded by the federal government16
  • A reform of firms’ UI tax rates to better internalize the costs of layoffs, reduce the cost to the UI system, and achieve similar cost of layoffs across states
  • An optional private unemployment account to cover the self-employed or independent contractors17
  • A “job seeker allowance” to aid young workers not qualifying for UI because of a lack of earnings history18

Proposals for innovation of
the Unemployment Insurance system

Even if sufficiently modernized according to these basic reforms, Unemployment Insurance as it is currently designed can neither prevent nor buffer much of the large and lasting earnings losses due to layoffs. This also affects the UI system’s efforts to reemploy workers, who may wait too long to engage in the long process of rebuilding their careers. Yet several innovations of the existing UI system have been proposed that could greatly expand the reach of UI without the need to establish a new program.

Institute a functioning system of work sharing to prevent costly layoffs

The issues. An increasing number of U.S. states have instituted programs of work sharing—also called short-term compensation, or STC—that allow workers to draw pro-rated UI benefits while on the job as an alternative to layoff. Evidence from other countries suggests work sharing can achieve substantial reductions in layoffs. Yet, take-up of the programs by employers in the United States has been low, partly because of restrictive program rules and partly because of a lack of awareness about the program.

Proposed changes. Several policy options are available to strengthen the use of STC across and within states, especially during recessions. One would be to continue to incentivize adoption of the program, with 100 percent of STC outlays funded federally for the first three years after adoption, or alternatively require states to establish STC programs. To raise attractiveness to employers, during this period states should be required to not charge employers for their uses (meaning there should be no experience rating). Another policy option would be to encourage states to share best practices and harmonize their efforts in outreach, and consider targeting employers using industry-level indicators of economic activity or those in the WARN system.19 A third policy option would be to encourage widespread use of short-term compensation during recessions when Extended Benefits are turned on by having STC benefits 100-percent federally financed; by suspending experience ratings; and by not having STC benefits deducted from workers maximum UI eligibility. Finally, research should continue to assess what prevents adoption of the STC program, and best practices for eligibility requirements should be developed.

Experiment with wage insurance to aid workers returning to employment

The issues. Since Unemployment Insurance only insures a minor fraction of the total earnings risk of job losers, its role as insurance mechanism and automatic stabilizer in recessions is substantially below potential. As a result, a growing number of researchers have suggested complementing the current UI system with a system of wage insurance. Wage insurance is likely to provide substantial additional insurance value. In addition, it may provide cost-savings by lowering UI payments. And it is unlikely to further reduce wages, and may raise them by shortening unemployment.20 Yet, currently little is known on potential effects of wage insurance.

Proposed changes. A series of proposals have been made to extend existing wage-insurance plans for trade-related layoffs to all workers covered by Unemployment Insurance.21 Given the evidence on job loss, introducing a version of wage insurance is sound policy, but an experimental evaluation will be important to better understand the effects. Policy parameters should be set with core facts in mind—for example, average wage losses of displaced workers with three years or more of tenure from good employers in a recession are about $15,000 per year in the first couple of years,22 so $10,000 over two years replaces only 30 percent of the loss.23 Similarly, insurance benefits should be extended to workers earning more than $50,000 on their new job since this would exclude substantially affected middle-class employees and their families from insurance.24 Since most evidence suggest that earnings losses last at least three years, and likely many more, a proposal with sharp limits has to educate workers about the long path to recovery.

Confronting neighborhood segregation

AP Images

About the author: Patrick Sharkey is a professor of sociology at New York University.

In 1970, 15 percent of families in the United States lived in neighborhoods where most of their neighbors were either extremely rich or extremely poor. By 2012, the percentage of families in such neighborhoods had more than doubled. More than a third of families now live in neighborhoods that can be thought of as mostly affluent, or mostly poor.25 As the level of economic inequality has risen over the past several decades, families of different economic classes have begun to move away from each other, literally, into separate communities.

And as our nation’s cities and communities have become more stratified, the life chances of those within the richest and poorest neighborhoods have become more unequal. Over the past decade or so, research from several different types of studies carried out in entirely different settings shows that growing up in a disadvantaged residential environment hurts the academic progress of children and reduces their chances to move upward in the income distribution.

This research comes from housing mobility programs such as the Dispersed Housing Program in Denver, the Moving to Opportunity program in five different cities, and the Ethel Lawrence Homes development in Mt. Laurel, New Jersey, all of which showed that when children are given the chance to leave communities with concentrated poverty and violence they benefit substantially in the long run.26 And it comes from natural experiments that reveal when children are able to attend high-quality schools with diverse student populations, their academic performance begins to steadily improve.27

Delivering equitable growth

Previous article: Geography of economic inequality, Kendra Bischoff

Most recently, the work of Stanford University economist Raj Chetty and his co-authors sheds light on the tremendous variation in economic opportunity across U.S. counties and commuting zones.28 This research is powerful because it makes the impact of place glaringly visible, and it demonstrates persuasively that our economic outcomes are driven not just by individual traits and skills, and not just by our parents and families, but also by the communities in which we spend our lives.29

Any agenda for economic mobility has to consider ways to confront residential segregation in America. There are two sets of approaches to confronting economic segregation and its impacts. The first set focuses on ways to invest in neighborhoods in order to make the consequences of segregation less severe, and the second set focuses on ways to reduce the level of segregation in American neighborhoods directly.

Invest in neighborhoods
where poverty is concentrated

Neighborhoods of concentrated poverty have never received the basic investments that are taken for granted in most communities across the country. While programs that confront urban poverty have come and gone, our most consistent, expensive housing investments are programs such as the home mortgage interest deduction, a tax subsidy that disproportionately goes to high-income homeowners in the nation’s wealthiest communities.30

The first approach to confronting economic segregation is to minimize its consequences by shifting investments into every low-income community across the country. Three types of investments are supported with strong evidence:

  • Provide work supports for individuals and families in high-poverty communities
  • Invest in evidence-based programs for young people
  • Identify or establish a “community quarterback” in every low-income neighborhood

Let’s examine each of these briefly in turn.

Provide work supports for individuals and families in high-poverty communities

The New Hope program provided work supports, wage supplements, and temporary, guaranteed public service jobs for low-income individuals in low-income neighborhoods of Milwaukee who were willing to work at least 30 hours per week. A randomized evaluation found that participants had higher rates of employment and higher earnings while the program was in operation. Further, children of families who took part performed better in school and showed improvements in behavior as well.31

The Jobs Plus program, carried out in five cities, provided a range of services to residents of public housing developments in order to improve their capacity to obtain and retain employment over time. The program also provided rent incentives designed to encourage work. The sites that offered the full range of services increased employment of residents by roughly 10 percent and increased earnings of participants by between 8 percent and 19 percent.32

Invest in evidence-based programs for young people

Recent demonstrations show that high-quality programs targeting youth in disadvantaged communities can have enormous impacts on their academic success and their involvement in violence. The Becoming A Man program in Chicago provides cognitive behavioral therapy combined with sports activities and lessons. Students randomly assigned to take part are more engaged in school and registered a greater than 40 percent reduction in arrests for violent crimes.33 A randomized trial providing “high-intensity” tutoring for one hour a day led to improvement in math scores equal to “an extra one to two years of learning.”34

What’s more, multiple randomized trials of summer jobs programs show that giving young people the chance to take on meaningful work in the summer, when violence is at its peak, produces substantial effects on violence and academic outcomes.35

Identify or establish a “community quarterback” in every low-income neighborhood

Stories of communities that have transformed over time, such as East Lake in Atlanta, always begin with one strong, stable institution that takes ownership over the community and takes responsibility for all of the residents within it. Purpose Built Communities—an organization that has most successfully worked to turn communities around across the country, including East Lake, calls this type of institution the “community quarterback.”36

To begin a process of change, federal resources should be combined with resources from foundations and the private sector to identify or establish a community quarterback in every low-income community across the country, so that everyone within that neighborhood knows that there is going to be an institution serving them for the long haul and will have resources sufficient to bring about long-term change.

Expand and preserve affordable housing
and provide access to areas of opportunity

The problem of affordable housing has become a crisis in cities across the country, exacerbating the consequences of concentrated poverty and creating severe hardship for low-income families. The instability at the bottom of the housing market makes it extremely difficult for families to have any chance of finding stable employment, to raise their children in stable homes and find quality schools, and to move upward in the income distribution.37

At the same time, families receiving housing assistance tend to churn through a small segment of neighborhoods that are characterized by segregation and that offer few opportunities for upward mobility.38 New approaches to housing assistance are needed in order to address the affordability crisis while also providing families with the capacity to make moves into neighborhoods and cities of opportunity.

This second set of approaches is designed to confront segregation directly, by addressing the affordability crisis while also taking active steps to create economically diverse communities at the bottom and at the top of the housing market. Specifically, this approach calls for

  • Expanding the supply of housing vouchers
  • Providing support to allow families to access opportunity neighborhoods
  • Providing incentives and regulations to preserve and expand affordable housing in exclusive markets
  • Establishing a long-range mobility bank

Each of these approaches are briefly detailed below.

Expanding the supply of housing vouchers

Only 1 in 4 families with income low enough to quality for housing assistance actually receive any form of assistance, as the supply of vouchers is nowhere near sufficient to meet the needs of low-income renters.39 A first step in addressing the problem of neighborhood segregation is to take active steps to create affordable housing. Expanding the number of housing-choice vouchers available to very low-income American families so that affordable housing is an entitlement is one straightforward policy option that has received bipartisan support.40

Providing support to allow families to access opportunity neighborhoods

Even when families do receive housing assistance, they are often left on their own to navigate the housing market without the support and information needed to find housing options in communities that may offer greater opportunities. Evidence from the Baltimore Housing Mobility Program shows that when housing assistance recipients are supported for long periods of time they are able to find and to stay in communities that offer higher-quality schools and greater economic opportunities.41 New resources are necessary to change the way housing assistance is supplied so that residents are provided support in finding units in new communities and continue to have support, for up to two years, which allows them to navigate their new environments, find transportation to new job opportunities, and locate the right schools for their children.

Providing incentives and regulations to preserve and expand affordable housing in exclusive markets

Growing demand in select U.S. cities, combined with rigid restrictions on real estate development, have created soaring housing prices in some cities and made it difficult for middle- and low-income families to take advantage of new opportunities in hot markets. To preserve affordable housing in such cities, the federal government can provide incentives for local cities and organizations to take active steps to utilize creative ways to take housing out of the market and keep it affordable.

Two approaches are community land trusts and inclusionary zoning. Community land trusts are sections of land that are owned by non-profit organizations and can be sold or rented to families at prices below the local market rate. The federal government also can provide incentives for local jurisdictions to implement mandatory inclusionary zoning plans, which require developers to include a percentage of affordable units in any new development.42

Both community land trusts and inclusionary zoning are designed to maintain mixed-income communities in markets where housing prices are rising rapidly. In other jurisdictions that have never provided affordable housing, the federal government must continue efforts begun under the Obama Administration to assist local jurisdictions in their efforts to comply with the rule requiring comprehensive plans for affirmatively furthering fair housing. The effort to gradually enforce compliance with this longstanding rule is crucial to breaking down barriers to economically diverse communities in jurisdictions that have resisted the requirement to provide affordable housing.43

Establishing a long-range mobility bank

Long-range residential mobility, which brings families into different parts of the country with greater economic opportunities, has always been a mechanism for upward mobility. Yet migration into new parts of the country has declined over time, particularly for black Americans. Jens Ludwig at the University of Chicago’s Harris School of Public Policy and Steve Raphael at the University of California-Berkeley’s Goldman School of Public Policy propose the idea of a “mobility bank” to encourage long-range moves that are risky to individuals and families, and exceedingly uncommon.44 The mobility bank would provide loans for individuals and families that allow them to make long distance moves away from distressed areas and into places that offer greater opportunities.

Geography of economic inequality

AP Images

About the author: Kendra Bischoff is an assistant professor of sociology at Cornell University.

Why does it matter where you live? Or where a child grows up? Neighborhoods are a primary non-familial context by which lives are shaped—residential context plays a significant role in access to education and other public services, opportunities for social interactions, labor market prospects, the frequency and nature of encounters with the police, and the freedom enabled by one’s real or perceived physical safety.

The geography of economic inequality refers to the spatial sorting of individuals by income, and the correlated patterning of economic resources and opportunities. The ability to pay has always determined the latitude of one’s residential choices as well as one’s capacity to afford certain neighborhoods. Research shows, however, that residential sorting by income has significantly increased over the past 45 years.45 This sorting has resulted in more Americans living in communities that represent the poles of the income distribution rather than the middle. In 1970, two-thirds of families in large metropolitan areas lived in middle-income neighborhoods. By 2012, just 40 percent of families lived in such neighborhoods.

Similarly, the percentage of families living in affluent or poor neighborhoods more than doubled from 15 percent to 34 percent over that same time period.46 This pattern is particularly problematic for lower income individuals. The most recent American Community Survey data show that approximately 12 percent of all poor individuals, and nearly a quarter of poor individuals in urban areas, live in “distressed” neighborhoods, defined as census tracts with poverty rates greater than 40 percent. This means that more than five million Americans face the double disadvantage of individual and contextual poverty.47

What are the causes and consequences
of spatial economic inequality?

The spatial sorting of economic resources results from many regional factors, including income inequality, suburbanization patterns, the age and quality of housing stock, school and municipal boundaries, zoning and land-use regulation, and current and historical housing policies.48 Income segregation is more pronounced among families with children than it is among the general population, and most of the increase in income segregation that has occurred since 1990 can be accounted for by the residential choices of parents.49 This means that children, in particular, experience stratified residential contexts, and that parents are increasingly choosing to live with others similar to themselves.50

It is common sense that the lived experiences of people in neighborhoods characterized by high poverty rates, low employment rates, and routine violence are dramatically different than those of people in wealthy, protected neighborhoods. The concentration of social, financial, and environmental resources and hazards form the context in which children develop and adults live, which not only affects day-to-day experience but also is thought to affect educational achievement and attainment, adult earnings, mental and physical health, and attitudes toward society and the government.

In addition to the direct effects of neighborhood conditions, highly segregated neighborhoods make it less likely that advantages afforded by those with more resources will be shared, or will spill over, to those who are less fortunate. Economically heterogeneous schools, for example, ensure that the time and money that middle- and upper-class families have to invest in their children’s schools, such as through the parent-teacher association, fund-raising, event planning, and curricular decisions, will also benefit children with fewer resources who share that educational environment.

Delivering equitable growth

Previous article: Home mortgages, Atif Mian and Amir Sufi
Next article: Neighborhood segregation, Patrick Sharkey

There is great interest among social scientists and policymakers in understanding how residential context matters, especially for the trajectory of children. Understanding the link between neighborhoods and individual or distributional outcomes is challenging—people are not randomly assigned to residential location, and the degree of segregation in a city or metropolitan area is likely related to characteristics of the area itself. But using high-quality research designs such as controlled and natural experiments, longitudinal analyses, and carefully crafted observational studies, there is an ever-growing and improving body of evidence on whether, how, and under what conditions neighborhoods affect individual and distributional outcomes, net of personal characteristics. In these studies, disadvantaged neighborhood contexts are defined by the concentration of poverty, but also sometimes by other indicators of neighborhood advantage or disadvantage, such as rates of unemployment, educational attainment, family structure, and welfare receipt.

Educational outcomes are probably the most-frequently studied outcome relating to neighborhood composition. In these studies, the authors seek to understand how neighborhood poverty affects the lives of individuals (as opposed to trying to understand the effect of the distribution of income across neighborhoods). Evidence suggests that exposure to a disadvantaged neighborhood context negatively affects educational outcomes such as high school graduation rates and test scores, and reduces children’s verbal ability by as much as one year of learning.51 Long-term residence in the most disadvantaged neighborhoods, as compared to the most advantaged ones, severely reduces the odds of graduating from high school, and these conditions have a larger depressive effect on educational attainment for African American children than they do for other children.52 The effects of neighborhood disadvantage on high school graduation rates appear to be especially acute during adolescence, and are most harmful for those children who face the double disadvantage of family and neighborhood poverty.53 A number of other studies have shown that episodes of neighborhood violence reduce performance on academic tests and diminish the attention span and impulse control of children.54

Experimental evidence from housing programs on the effect of neighborhood composition has been more mixed. The well-known Moving to Opportunity study, for example, offered a random sample of participants a voucher to induce them to move to more advantaged neighborhoods. Comparisons between those who received the voucher and those who did not showed few long-term differences, which led people to conclude that neighborhoods, in and of themselves, had limited effects on individuals.55

Yet recently completed, longer-term evidence from the Moving to Opportunity data show that children who moved to low-poverty neighborhoods before the age of 13 have reaped significant benefits. They were more likely to attend college, had significantly higher earnings by their mid-20s, and lived in less disadvantaged neighborhoods as adults—all compared to those who did not receive the voucher in the experimental project. Results for children who moved after the age of 13 were nil or even negative, suggesting that stability and consistent social environments may be more important in late adolescence.56

Finally, a study of a housing program in Montgomery County, MD found significantly higher academic achievement among low-income students who lived in low-poverty school zones, compared to similar peers in high-poverty school zones.57 Taken together, there is a fairly strong body of evidence supporting the fact that childhood neighborhood context matters for contemporaneous and long-term outcomes, but that the effects differ by family income, race/ethnicity, and age.

There is less evidence on the consequences of economic segregation itself, a characteristic not of individual neighborhoods but of the arrangement of neighborhoods in a city. The existing research has demonstrated that metropolitan- and state-level income segregation increases inequality of educational attainment and infant health outcomes and shows that income segregation in U.S. metropolitan areas weakens economic mobility, establishing an important link between the geography of economic inequality and intergenerational mobility.58

Concluding thoughts and
policy directions

The spatial dimension of economic inequality is a persistent feature of U.S. cities and communities. The magnitude of residential sorting continues to increase, closely tracking the steady rise in income inequality. Over one third of all families in large metropolitan areas now live in relatively poor, or relatively affluent, neighborhoods—neighborhoods that affect our understanding of America as a country of the middle class. Three additional points bear mention in this short brief.

First, neighborhood disadvantage is durable. Segregated neighborhoods are difficult to escape, especially for African Americans. Nearly three quarters of African American children who grow up in America’s poorest neighborhoods live in similar neighborhoods as adults.59 A lack of sufficient resources in the poorest neighborhoods, such as high-quality schools, contributes to the intergenerational transmission of individual poverty and neighborhood disadvantage.60

Second, the concentration of affluence deserves more attention. The geographic isolation of the affluent is connected to the geographic isolation of the poor. Recent American Community Survey data show that, nationally, the school district at the 10th percentile of the income distribution has a median household income of $34,000 while the 90th percentile district has a median income of $74,000. The median household incomes in the very wealthiest districts exceed $200,000, and fall below $20,000 in the very poorest.61 These income gaps are not the whole story, but the gaps are representative of bundles of advantages and disadvantages comprised of parental education levels and employment status, teacher quality, school facilities, and safety. This matters, in part, because children from poor and affluent neighborhoods are competing for the same seats at elite colleges and universities, and for the opportunity to be leaders in politics, business, academic research, and the arts. The presence of highly polarized neighborhoods ensures that children spend important developmental years in severely unequal environments.

Third, the vast majority of research on the causes and consequences of neighborhood poverty and economic segregation relies exclusively on income as a metric for financial resources. Wealth data are harder to obtain, but it is even more unequally distributed than income and it can be a major factor in residential choice. In 2010, 44 percent of all income in the United States went to the highest-earning 10 percent of the workforce, whereas the top 10 percent of wealth holders controlled 74 percent of all U.S. wealth. Similarly, the income-based Gini coefficient (a widely used measure of inequality in which 1 signifies absolute inequality and zero absolute equality) was 0.55 but the wealth-based figure was 0.87.62 Wealth segregation may be relatively severe due to the extreme level of wealth inequality in the United States, but less is known about the degree to which families are spatially separated by wealth.

How can public policy address the geography of economic inequality? I offer two brief comments. First, economic segregation and the concentration of poverty are not narrowly local issues. They are regional issues that need regional solutions. This may require collaboration across multiple municipalities, or the formation of regional governance structures that have the authority and mandate to address the division of resources that occurs through municipal fragmentation. Policy tack and the appropriate level of government intervention depend on the boundaries of the geographic inequality—across neighborhoods within a municipality, across schools within a school district, across municipalities and school districts within a metropolitan area, or even between cities or counties within a state or nationwide.

Second, there are remedies for the problem itself, and there are ways to mitigate its negative effects. Policies that encourage mixed-income communities or reduce income inequality refer to the former, while school integration programs and monetary redistribution refer to the latter. These types of policies are not mutually exclusive—society can both pursue bold long-term plans to equalize children’s neighborhood contexts while also embracing short-term programs to mitigate the effects of segregation and concentrated poverty.

How economic inequality affects children’s outcomes

AP Images

About the author: Ariel Kalil is a professor of public policy at the Harris School of Public Policy Studies, University of Chicago.

What happens in the home is paramount to children’s early development. Economically disadvantaged children’s limited access to cognitively enriching home environments may help drive growing gaps in cognitive and non-cognitive skills, producing a feedback cycle that leads to low socioeconomic mobility and further grows inequality. Research increasingly suggests that policy should identify new targets for programs aimed at enhancing parent-child interactions in low-income families, such as Early Head Start and Healthy Families America. All parents want to help their children flourish, but low-income parents often lack the resources to achieve their parenting goals. Parents are children’s first teachers and, to equalize the playing field, governments need to invest in parents so that they, in turn, can better invest in their children.

Background

Economic growth for much of the 20th century supported America’s promise of offering opportunities to both parents and their children. It is well known, however, that income inequality increased dramatically in the United States beginning in the 1970s.63 Greg Duncan and Richard Murnane illustrate how increasing family income inequality may affect access to high-quality child care, neighborhoods, schools, and other settings that help build children’s skills and educational attainments.64 Changes in these social contexts may in turn affect children’s skill acquisition and educational attainment directly as well as indirectly by influencing how schools operate.

Growing income inequality also increases the gap in the resources high- and low-income families can spend on enrichment goods and services for their children.65 For instance, Sabino Kornrich and Frank Furstenberg show that spending on child-enrichment goods and services jumped for families in the top quintiles but increased much less—in both absolute and relative terms—for families in bottom-income quintiles, as reflected in four large consumer expenditure surveys conducted between the early 1970s and 2005-2006. In 1972-1973, high-income families spent about $2,700 more per year on child enrichment than did low-income families. By 2005-2006, this gap had nearly tripled, to $7,500.66

As the incomes of affluent and poor American families have diverged over the past three decades, so too has the educational performance of the children in these families. Sean Reardon documents substantial growth in the income-based gap on the test scores of children born since the 1950s. Among children born around 1950, test scores of low-income (10th income percentile) children lagged behind those of their better-off (90th income percentile) peers by a little over half a standard deviation, or about 50 points on an SAT-type test. Fifty years later, this gap was twice as large. Family income is now a better predictor of children’s success in school than race.67

At age four, children from families in the poorest income quintile score on average at the 32nd percentile of the national distribution on math, the 34th percentile in a test of literacy, and at the 32nd percentile on a measure of school readiness compared with children in the richest quintile, who scored at the 69th percentile on math and literacy and at the 63rd percentile on school readiness.68 Gaps in conduct problems and attention/hyperactivity also are apparent albeit less pronounced. On measures of hyperactivity, for instance, children from families in the poorest income quintile score on average at the 55th percentile of the national distribution (in this case, higher scores indicate higher levels of behavior problems) compared with children in the richest quintile, who scored at the 44th percentile.69

Delivering equitable growth

Previous article: Income volatility, Bradley Hardy
Next article: Social Security, Jesse Rothstein

Using data from the 1979 and 1997 National Longitudinal Surveys of Youth, Martha Bailey and Susan Dynarski show that graduation rates for children born into high-income families jumped 21 percentage points (from 33 percent to 54 percent) between the early 1960s and the early 1980s. The corresponding increase for children born into low-income families was only four percentage points (from 5 percent to 9 percent). A little less than half of the gap between rich and poor in college graduation rates can be explained by differences in college enrollment rates, with the rest explained by differences in students’ persistence in completing their degrees.70 Phillipe Belley and Lance Lochner show that high family income has become a substantially more important determinant of college attendance and college quality in recent years, particularly for those youth with the lowest skills.71

Drivers of the socioeconomic
status-based gaps in child outcomes

Rising gaps in children’s skills and attainments cannot be attributed to rising income gaps alone, however.72 In fact, Reardon estimates that only about half of the rising income-based gap in test scores can be attributed to rising income inequality.73 Parents invest more than money in their children’s development. Through their time and attention parents can provide a cognitively stimulating and emotionally supportive home environment that promotes children’s early learning and behavioral adjustment. Economically advantaged parents differ from their less advantaged peers on many relevant dimensions of parenting.74

Mounting evidence suggests that socioeconomic status-based gaps in parenting and children’s early developmental outcomes have grown alongside increasing economic inequality in family conditions.75 The demography of family structure, for example, has changed in ways that favor the socioeconomically advantaged and their ability to invest parental time and resources in their children’s development. Between 1980 and 2010, the share of children living with college-educated mothers who were married remained at about 90 percent. In contrast, the share of children living with mothers who lacked a high school degree and who were married decreased from about 73 percent to about 66 percent.76 Two-biological-parent households not only enjoy greater economic well-being but also demonstrate higher levels of parental time investment in children than do single-parent households.77

Trends in maternal age at first birth also have changed in important ways that may favor the parenting environments provided by mothers with high socioecoconomic status. Comparing data on U.S. births in 1970, 1989 and 2006 by age of mother and maternal schooling reveals that the maternal age gap between children born to high school dropouts and college graduate mothers grew by nearly 3 years—from 4.3 years to 7.1 years.78 Positive parenting behaviors increase in maternal age at first birth whereas negative parenting behaviors decrease in maternal age at first birth.79

Finally, how parents think about parenting has changed dramatically over the past century. In 1900, parenting experts emphasized nutrition, medical care, and fresh air as the key inputs into child development, according to a comprehensive analysis of magazine articles containing parenting advice. By the 1980’s, intellectual stimulation and social/emotional development had replaced nutrition and fresh air as key topics of concern along with medical care.80 Yet economically advantaged parents, more so than their disadvantaged counterparts, may have responded more quickly to this advice, thus widening the parenting gap.

Why parents matter

Economically advantaged parents display more of the behaviors deemed supportive of children’s development across a range of parenting domains. Economically advantaged parents display more authoritative (versus authoritarian) parenting styles,81 engage in more sensitive and responsive mother-child interactions,82 use greater language stimulation,83 and use greater levels of parental management and advocacy.84 A famous example of differential parenting by socioeconomic status is the study by Betty Hart and Todd Risley, who intensively observed the language patterns of 42 families with young children. They found that in professional families, children heard an average of 2,153 words per hour, while children in working class families heard an average of 1,251 words per hour, and children in welfare-recipient families heard an average of 616 words per hour. By age four, a child from a welfare-recipient family could have heard 32 million words fewer than a classmate from a professional family.85

One of the most important parenting differences between advantaged and disadvantaged parents is in how much time the parent spends with the child. Annette Lareau’s qualitative study of family life reported that middle-class parents target their time with children toward developmentally enhancing activities. In her study, middle-class families (whose jobs, by her definition, require college-level skills) engage in a pattern of “concerted cultivation” to actively develop children’s talents and skills. By contrast, in lower-class families, Lareau identified a pattern that she calls “the accomplishment of natural growth,” wherein parents attend to children’s material and emotional needs but presume that their talents and skills will develop without concerted parental intervention.86

Numerous quantitative studies not only show large differences in the time investments of advantaged and disadvantaged parents but also that these gaps remain large even when other differences across families, such as employment hours and schedules, are accounted for.87 Work by Ariel Kalil, Rebecca Ryan, and Michael Corey further shows that highly educated mothers are more “efficient” in their parental time investments by tailoring their specific activities to children’s developmental stage. This research also shows that with respect to total childcare time, the educational gradient is most apparent in households with the youngest children, a point also made by Erik Hurst, Daniel Sacks, and Betsey Stevenson.88 Economically advantaged mothers, more so than their less advantaged counterparts, may have learned the message that parental investments in early childhood are key ingredients in children’s long-run success.89

High-income parents appear to be investing more parenting time than ever before in their children’s cognitive development and educational success.90 This increase may mean that high-skilled parents are responding to the increased returns to having high-skilled (highly educated) children.91 Work by Erik Hurst , Daniel Sacks, and Betsey Stevenson further show that all of the increase in childcare time between 1985 and 2003 has come from households with children ages 5 and younger, and Evrim Altintas shows that the growing education gap in time with young children is driven by time in educationally enriching activities.92

Increases in the parenting gap are expected to be relevant for socioeconomic status-based gaps in children’s development. Observational research suggests that the quality of the home learning environment as measured by the HOME score accounts for up to half of the relationship between socioeconomic status and disparities in children’s cognitive test scores.93 In a descriptive analysis of U.S. data from the Early Childhood Longitudinal Study-Birth Cohort, Jane Waldfogel and Elizabeth Washbrook conclude that parenting style (in particular, mothers’ sensitivity and responsiveness as well as the home learning environment) is the most important factor explaining the poorer cognitive performance of low-income children relative to middle-income children, accounting for between a quarter and a third percentage of the gaps in literacy, mathematics, and language.94

What’s the role for
public policy?

Few trends are more ominous than the increases in both the class gaps and achievement gaps between low- and high-income children in the United States. The rising income-based achievement gaps call into question whether the American Dream of intergenerational mobility is now beyond the reach of many children raised in low-income families.95

Policy approaches to addressing increasing disparities in outcomes for children from low- and high-income families can take a number of forms. Some of these will boost families’ economic security, others can help support parents’ engagement in their children’s development, and others can provide educational supports directly to children. Such approaches can be pursued simultaneously. These include policies such as the Earned Income Tax Credit that redistributes income and relies on parents to use the added income to promote their children’s development; policies such as the Nurse Family Partnership that teach high-risk parents about positive parenting practices and about the nature of early childhood development; polices such as Pell Grants that encourage would-be parents to acquire post-secondary schooling; and policies such as state pre-Kindergarten programs that provide educational services directly to young children.96

Given the importance of parental engagement in children’s development, it may be especially fruitful for policies to focus on boosting parents’ ability to provide a cognitively stimulating and emotionally supportive home environment. Gaps in children’s skills could be narrowed if less-advantaged parents adopted the parenting practices of their more-advantaged peers. Notably, a leading family intervention for low-income children—the Nurse-Family Partnership program—is being targeted for substantial expansion by the federal government from the Administration on Children and Families’ Maternal, Infant, and Early Childhood Home Visiting Program demonstration. The program provides weekly in-home visits by trained nurses from pregnancy through the child’s second birthday.

One mission of the Nurse-Family Partnership program is to improve children’s health and development by helping young, economically disadvantaged parents provide more competent care. Some experimental evaluations of the program show it reduces child maltreatment. In one study, mothers in the treatment group who received nurse visits during their pregnancy and the child’s infancy had 0.29 substantiated reports of child abuse and neglect at some point before the child turned 15. Mothers in the control group, in contrast, had on average 0.54 such reports.97 This is important because child maltreatment is costly for the individual affected and for society.98

The Nurse-Family Partner program also yields long-run benefits for some children. By age 19, girls in the treatment group had fewer arrests and convictions; a subset of these girls had fewer children and less Medicaid use than their comparison group counterparts.99 Although there is room for improvement in the design and delivery of this and similar intervention programs, research underscores the merit of the new federal emphasis on supporting parenting in educationally disadvantaged families.

Important new evidence also is emerging that suggests that low-cost “light-touch” efforts can be highly successful in helping low-income parents support their young children’s learning and development.100

Conclusion

The United States has made little progress toward narrowing the achievement gap between advantaged and disadvantaged children. This is in part because public policy has neglected the critical role of parenting in children’s development. Parents do more than spend money on children’s development; they also promote child development by spending time in cognitively enriching activities and by providing emotional support and consistent discipline.

All parents want the best for their children, but the “parenting divide” between economically advantaged and disadvantaged children is large and appears to be growing over time.101 The main barrier to designing and scaling up parenting interventions nationwide is the currently limited understanding of the key ingredients of successful programs. Policymakers need to become better informed on effective interventions that can motivate and support parents to engage effectively in their children’s development.

A fresh look at the wage gap on African American women’s Equal Pay Day

Ultraviolet members protest Macy's lobbying against an equal pay bill. They're asking the retail giant to pledge to never lobby against equal pay again. Photo Credit: Melissa Byrne

According to the National Organization for Women, today is African American women’s Equal Pay Day, when African American women will have worked all of 2015 through today—an additional 236 days—in order to earn the same amount that men made last year. In other words, in 2015, on average, black women earned about 63 cents per every dollar earned by a man. This isn’t necessarily surprising given what the research says about pay equity, but it sparked further interest at Equitable Growth to see what the wage gap looks like for African American women up and down the income ladder.

Equitable Growth’s new interactive tool allows for a careful look. Though our interactive’s numbers don’t quite match the National Organization for Women’s Equal Pay Day levels due to methodological differences (primarily, our interactive covers a slightly different time period), they still prove the same point: Men across the board are paid substantially more than African American women. By our calculations, men earn a median wage of $19.61 per hour, while African American women earn a median wage of $14.25, an hourly wage differential of $5.36 or a pay gap of about 38 percent relative to African American women’s hourly rate. (See Figure 1.)

Figure 1

When looking across the wage distribution detailed in Figure 1, the same pattern is clear—men get paid more. Low-wage male workers make about $9.22 per hour compared to the $8.15 earned by low-wage black women, a pay gap of about 13 percent. Near the top, however, the pay gap is substantially larger, approximately 46 percent, with men earning $47.44 and African American women earning $32.50.

These data also demonstrate that the pay gap between men and black women is narrower for workers at the bottom, but widens as a worker moves up the wage distribution. This same pattern also holds when we observe the wage distributions for different genders, races, and ethnicities. (See Figure 2.)

Figure 2

At the bottom of the distribution, low-wage workers from different demographic backgrounds have relatively similar wages. Low-wage Latinas and African American women earn the least ($8.14 and $8.15 per hour, respectively), while low-wage white men earn the most ($10.00). This clustering of wages at the bottom is likely a result of current federal and state minimum wage policies, which legally mandate employees to be paid at least $7.25 per hour (or more, in many states).

For workers in the middle range of each demographic group, the gender gap is bigger. Median-wage Latinas and African American women are the lowest-wage recipients, earning $12.65 and $14.25 per hour, respectively. In contrast, white men earn the highest median wages, making $21.79. At the top, where the gap is largest, the lowest wages are $28.83 (Latinas) and $32.50 (African American women), while the highest wage is $50.54 (white men), a difference of more than $20.00. The spreading out at the top reflects discrimination across both gender and race.

What explains these wage gaps? On one hand, social and cultural norms at work, occupational sex segregation, and a lack of workplace policies, among other factors, play a role in pushing women out of higher-paying jobs. On the other hand, racial discrimination, which appears in hiring practices and other labor market interactions, disproportionately leaves workers of color with lower pay than their white counterparts. African American women (and Latinas) are doubly disadvantaged, as they experience both of these forms of discrimination.

Increasing educational attainment by women of color is probably the most commonly suggested solution to closing the gender wage gap. Yet over the past two decades, women have outpaced men in college enrollment and college enrollment for black women has surged. Despite these gains in education, African American women still earn less. So other solutions would seem to be in order. But first, it’s worthwhile to examine the wage distribution by a worker’s educational attainment. Comparing the earnings of white men with high school degrees to African American women with college degrees shows there are many similarities in their wages despite the much higher level of educational attainment for this group of African American women. (See Figure 3.)

Figure 3

The lowest-paid white men with high school diplomas earn $9.31 per hour, which is only about 15 percent less than the $10.69 earned by African American women with a four-year college degree. At the median, white men with a high school degree make $18.00 per hour, or only about 17 percent less than the $21.08 earned by the median college-educated African American women. Even for the best paid workers in both groups, the pay gap is only about 22 percent, with white male high school graduates receiving $34.79 per hour, compared to $43.27 top-earning African American women with college degrees.

Closing the pay gap for African American women clearly is no simple task. On the policy front, raising the minimum wage and the tipped minimum wage at the federal, state, and local levels would make a positive difference for women of color. So, too, would increased unionization, crackdowns on workplace discrimination, and improved work flexibility and childcare policies. But the wage gap will persist for African American women as long as structural racism goes unaddressed, which admittedly is a more complex and challenging issue. In the meantime, African American women’s Equal Pay Day helps serve as a reminder that much work is left in order to achieve pay equity across gender and race.