Congressional Republicans’ budget bill is the most regressive in at least 40 years

Introduction
The U.S. Congress is in the midst of debating a budget bill that would make massive changes to U.S. tax and spending policy over the course of the next decade and beyond. On May 22, the Republican majority in the House of Representatives passed its One Big Beautiful Bill Act, which spends more than $3.7 trillion over the next 10 years to cut taxes, mostly for the richest Americans.
To finance these tax cuts, the bill cuts federal spending focused on middle- and lower-income Americans. These spending cuts amount to roughly $1.3 trillion over the next decade (net of new spending) and would—among other estimated effects—reduce funding for the Supplemental Nutrition Assistance Program by almost one-third and increase the number of Americans without health insurance by 11 million through changes to Medicaid eligibility and affordable coverage in the ACA marketplaces. The remaining $2.4 trillion of tax cuts would be financed by deficit spending, driving up the federal debt by $3 trillion when increased interest costs on the debt are factored in (and by $5 trillion if temporary provisions are made permanent, as the bill’s designers hope).
In short, the Republican’s budget bill is enormous, largely unpaid for, and overwhelmingly regressive, transferring income from less affluent Americans to the most privileged.1 Indeed, we estimate that, if enacted, it would be the most regressive tax and budget law in at least the past 40 years—and possibly ever (though we lack precise distributional estimates for earlier periods).2 This regressivity reflects big, complex tax cuts for the rich—which have received limited attention, relative to simple but small-bore tax cuts for the middle class—as well as cuts to health and social programs that are designed to hide their true impact by imposing new administrative burdens on beneficiaries and by shifting costs onto states.
In this report, we shine a light on the hidden regressive elements of the House-passed One Big Beautiful Bill Act. We show that they are not only large in historical relief, but also large when compared with such putatively populist features as “no tax on tips.” We also argue that they are likely to be even bigger than current estimates suggest because they are designed to create self-reinforcing political and economic dynamics—what political scientists call “policy feedback effects”—that will make the law’s impact bigger, more favorable to the rich, and more harmful to everyone else.
In the first section, we substantiate our claims about the unprecedented regressivity of the bill, comparing it with the two other leading contenders for this dubious distinction: the Bush tax cuts of 2001 and the Trump tax cuts of 2017. In the second section, we explain why the most complex and little-discussed tax provisions in the bill are so regressive, focusing on the highly inegalitarian changes to the tax treatment of pass-through business income, of huge estates, and of the ever-rising incomes of the richest taxpayers.3
The third section looks at the bill’s draconian and deceptive spending cuts, which are designed to push tough decisions—and, congressional Republicans hope, accountability—down to the states, where millions of Americans will lose health insurance and nutrition assistance, among other valued benefits. In the fourth section, we show that, compared with these large losses, the so-called populist provisions of the bill—notably, the provisions for no tax on tips and overtime—are tiny. These “shiny objects” are not only fiscally trivial, compared with the bill’s big tax cuts for the wealthy, but also time-limited and designed in ways that limit their benefits for less affluent taxpayers.
In the last two sections of the report, we examine the likely dynamic policy feedback effects of the bill in a transformed fiscal and policy context. These effects—which are not incorporated into existing estimates of the bill’s distributional effects—are virtually certain to increase the bill’s regressivity. In the fifth section, we show that if the Trump administration continues to decimate the capacities of the IRS, the costs of the bill’s tax cuts for the rich are likely to balloon, due to increased tax avoidance and evasion concentrated among the affluent. In the sixth section, we show that the cuts for lower- and middle-income Americans are also likely to expand because they are designed so that states facing restricted and risky fiscal circumstances will be under increasing pressure to cut benefits and use administrative burdens to discourage people from receiving these reduced benefits.
Because of these likely feedback effects, even the best distributional estimates of the Republican bill—which, as we show, indicate that it would be the most upwardly redistributive law in at least 40 years if enacted—are biased toward underestimating its skewed distribution.
The One Big Beautiful Bill Act is more regressive than other modern tax and budget bills
Tax and budget laws that shift income from low-income Americans to the affluent are rare. From 1982 until 2001, virtually every major budget bill raised taxes in progressive, or relatively distributionally neutral, ways.4 Of course, regressive tax cuts have been passed under unified Republican control of the executive and legislative branches before. The Economic Growth and Tax Relief Reconciliation Act of 2001—the first of the so-called Bush tax cuts—contained tax changes that were highly skewed toward the wealthy, as did the Tax Cuts and Jobs Act of 2017.
What makes the current Republican bill so distinctive is that it would also impose large spending cuts that disproportionally hurt less affluent Americans. Because of these cuts in Medicaid, Affordable Care Act coverage, food assistance, support for lower-income college students, and other valuable benefits for poor and middle-income Americans, the One Big Beautiful Bill Act dwarfs the overall regressivity of the 2017 Trump tax cuts and is more regressive than even the famously upwardly skewed Bush tax cuts of 2001.
Despite many expert analyses of the House Republican legislation (on which we gratefully draw), its radically inegalitarian character is still not adequately appreciated. This is in part because Republicans have described what they are doing in false terms—saying, for example, that they are not “cutting” Medicaid, when in fact millions will lose coverage.
Yet it also reflects the fact that the bill is designed to hide its biggest, least popular, and most regressive elements, while proponents tout its more popular provisions that have comparatively miniscule impacts. Chief among these is President Donald Trump’s promise of eliminating taxes on tips, which accounts for just 1 percent ($40 billion) of the $3.7 trillion in tax cuts in the bill and would do nothing to boost to the take-home pay of 98 percent of U.S. households.
We calculate that the combined tax and spending cuts in the One Big Beautiful Bill Act, if enacted, would produce a transfer of income from less affluent Americans to the rich that is without precedent in at least the past 40 years. We look at a simple measure of regressivity that compares the average percentage changes in income at different points in the income distribution. In essence, this measure tells us how much larger the percentage change is for affluent households than for lower-income ones. (We discuss these calculations further in the technical appendix, where we also present more information about the effects of the bill across the full income distribution—which only bolsters our case.)
We compare changes in income between the poorest and richest 20 percent of the income distribution stemming from each of the three aforementioned Republican tax bills. Because these tax cuts, especially the Bush tax cuts of 2001, were highly skewed toward the very top, we also compare changes in incomes of the poorest 20 percent to changes for the top 5 percent and top 1 percent.
According to our calculations, the three most upwardly skewed tax and budget laws of the past half-century are—from most to least regressive—the One Big Beautiful Bill Act (2025), Economic Growth and Tax Relief Reconciliation Act (2001), and the Tax Cuts and Jobs Act (2017).5 Figure 1 compares these three laws, showing the percentage change in income by quintile, as well as for the top 5 percent and top 1 percent of households. It also presents our three different measures of regressivity. (See Figure 1.)
Figure 1
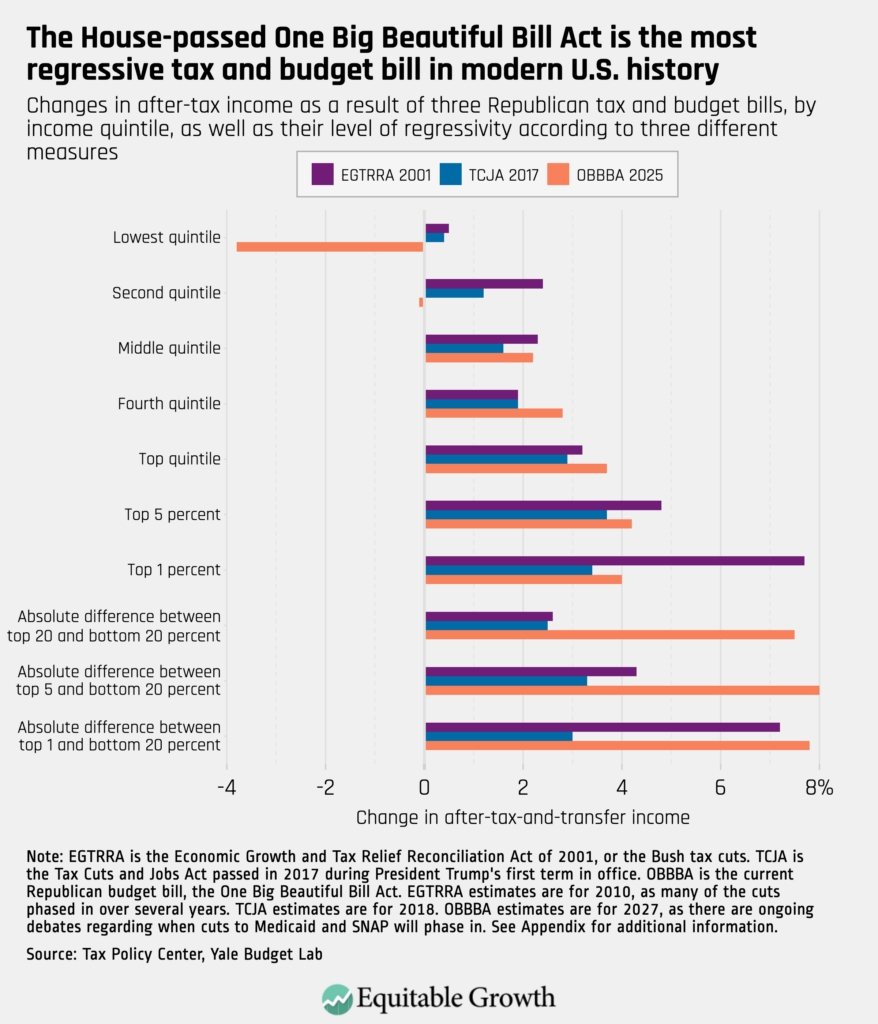
If enacted, our calculations show that the current bill would reduce income among the poorest 20 percent of Americans by an average of 3.8 percent while increasing it by 3.7 percent for the richest 20 percent—a difference of 7.5 percentage points. By comparison, the 2017 tax bill increased income among the poorest 20 percent by an average of 0.4 percent and increased it among the richest 20 percent by an average of 2.9 percent—a difference of 2.5 percentage points.
For its part, the first Bush tax cuts increased income among the poorest 20 percent by an average of 0.5 percent and increased it among the richest 20 percent by an average of 3.2 percent—a difference of 2.7 percentage points. When the comparisons focus on the highest-income households, however, the Bush tax cuts appear more regressive. Looking at the top 1 percent, for example, reveals an absolute difference from the bottom 20 percent of 7.2 percentage points—an extremely sharp skew, but still slightly short of the 7.8 percentage point difference projected for the current bill, according to this measure.
As Figure 1 makes plain, the One Big Beautiful Bill Act is much more regressive than the 2017 Trump tax cuts and either substantially or modestly (depending on the comparison group) more regressive than the Bush tax cuts of 2001. But what exactly makes the bill so regressive? In the next two sections, we bring to light some of the key reasons, focusing on its tax cuts and spending reductions, respectively.
Regressivity driver #1: Tax cuts that benefit the rich
Some of the key regressive elements on the tax side of the One Big Beautifull Bill Act are complex or little-known, certainly to the public. This, however, does not make them unimportant. Indeed, the three key provisions we discuss below—an expanded deduction on pass-through business income, cuts to marginal tax rates, and a large increase in the federal estate tax exemption threshold—would cost $3.2 trillion over 10 years. Moreover, the bill seeks to make all three of these components permanent, entrenching this regressivity into the U.S. tax code and raising the cost burden for years to come.
Before delving into these provisions, it is important to note that the key permanent provision—and single most-expensive item—in the 2017 Trump tax cuts was a huge reduction of the corporate income tax rate from 35 percent to 21 percent. Despite claims from the (first) Trump administration and congressional Republicans that slashing corporate tax rates would substantially increase workers’ wages, recent empirical evidence suggests that typical workers saw very few, if any, actual gains. On the contrary, these studies show that gains disproportionately flowed to the affluent.6
While the key regressive and permanent provisions of the Tax Cuts and Jobs Act dealt with corporate taxation, the key regressive (and, as proposed, permanent) provisions in the current tax bill involve changes to taxes on wealthy individuals. We start with one of the largest and least-understood provisions: much more favorable treatment of hard-to-verify business income.
The expanded deduction on pass-through business income
The Republican tax bill seeks to make permanent an expanded deduction on qualified business income of pass-through business entities, such as sole proprietorships, partnerships, and S corporations. In the past, income earned via these entities was typically taxed at the same rate as ordinary income. The Tax Cuts and Jobs Act of 2017, however, introduced a 20 percent deduction on this type of income, and the current bill would not only make this deduction permanent, but would also expand it to 23 percent. If implemented, this could lower the top marginal tax rate on pass-through incomes by nearly 10 percentage points.
Economists widely believe the TJCA pass-through provision was bad policy. One tax expert has referred to it as “the worst provision ever even to be seriously proposed in the history of the federal income tax.” For our purposes, however, the key consensus point is that the effects of the provision were radically regressive. Extending it permanently while also expanding it would make it even more so.
Pass-through income makes up a much larger fraction of the income of high earners than it does for lower-income earners, and income from these types of entities is highly concentrated among those in the top 1 percent of the income distribution.7 In fact, nearly 70 percent of pass-through income goes to those in the top 1 percent of the income distribution. By comparison, “only” 45 percent of corporate income and 21 percent of national income do, respectively. According to recent research, roughly 40 percent of the rise in top income shares from 1980 to 2013 reflects sharp increases in pass-through business income.
The Tax Policy Center estimates that, if the current pass-through provisions were enacted, those in the top 0.1 percent of the income distribution would receive an average tax break of more than $120,000, representing the largest percentage increase in after-tax income of any group. (See Figure 2.)
Figure 2
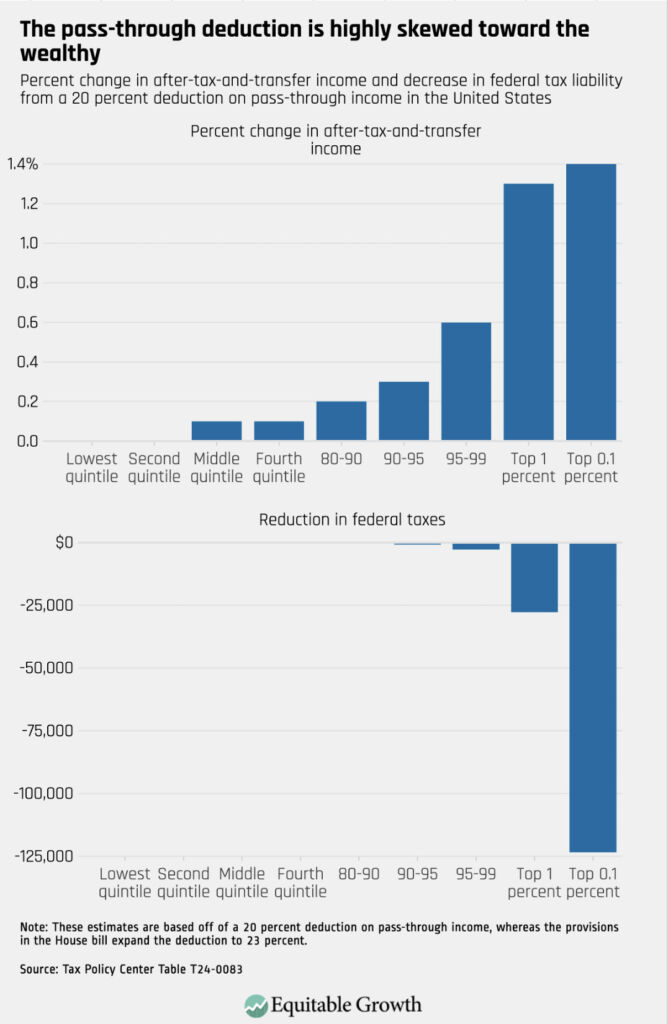
Two final points about the expanded and permanent pass-through deduction are relevant. First, making the 23 percent expanded deduction permanent would cost around $820 billion over 10 years—much more than some of the much-touted provisions emphasized by the bill’s proponents. And second, pass-through entities are a major vehicle for tax avoidance, which is particularly relevant to our discussion later in this report of the evolving policy dynamics surrounding cuts to IRS enforcement.
Cuts to most individual marginal tax rates that nonetheless mostly benefit the rich
The One Big Beautiful Bill Act would make permanent rate cuts on the top marginal tax rate (from 39.7 percent to 37 percent), as well as on four of the next five brackets below the top. This not only would be the costliest provision of the bill (at $2.2 trillion over a 10-year period), but also would be 1.5 times more costly than the corporate tax provision of the Tax Cuts and Jobs Act of 2017.
It is easy to assume that reduced tax rates on all but the lowest tax bracket provide a roughly proportional boost to the after-tax incomes of taxpayers across the board. But nothing could be further from the truth.
First, cuts to tax rates on higher brackets exclusively benefit individuals with very high levels of taxable income. The reduction of the top marginal tax bracket, for instance, only benefits single filers with taxable incomes of more than $626,350 and married couples filing jointly with taxable incomes of more than $751,600.
Second, because tax brackets are marginal—that is, different levels of income are taxed at different rates, with everyone paying the same rate on income earned up to the next bracket—the most affluent taxpayers also receive the benefits of reduced rates on lower brackets.
How these components combine with changes in tax bracket thresholds and different filing statuses is complicated. Thankfully, researchers at the Tax Policy Center have done the math. Their results show that those in the top 1 percent would receive the largest increase in their after-tax incomes as a result of these provisions, at 2.1 percent. To put these numbers in dollar terms, members of this group would receive a tax cut of nearly $45,000 on average.
Permanently exempting even extremely large estates from taxation
While not as costly as the previous two items, the One Big Beautiful Bill Act also contains changes to the federal estate tax that would cost more than $200 billion over 10 years and would further increase economic inequality. Wealth inequality is not only high in the United States, compared with other rich democracies, but is also growing at a faster rate.8 Though estimates vary, the share of wealth that comes from inheritances also is large: On the lower end, more than one-third of wealth is inherited among U.S. households, and high estimates put the share closer to two-thirds.
Rather than strengthening a key policy tool that could reduce the ability of dynastic wealth to be transferred across generations, the Republican tax bill follows a trend that began at the turn of the 21st century. Dramatic increases in the estate tax exemption threshold have resulted in an infinitesimally small fraction of the nation’s wealthiest individuals facing any liability at all. (See Figure 3.)
Figure 3
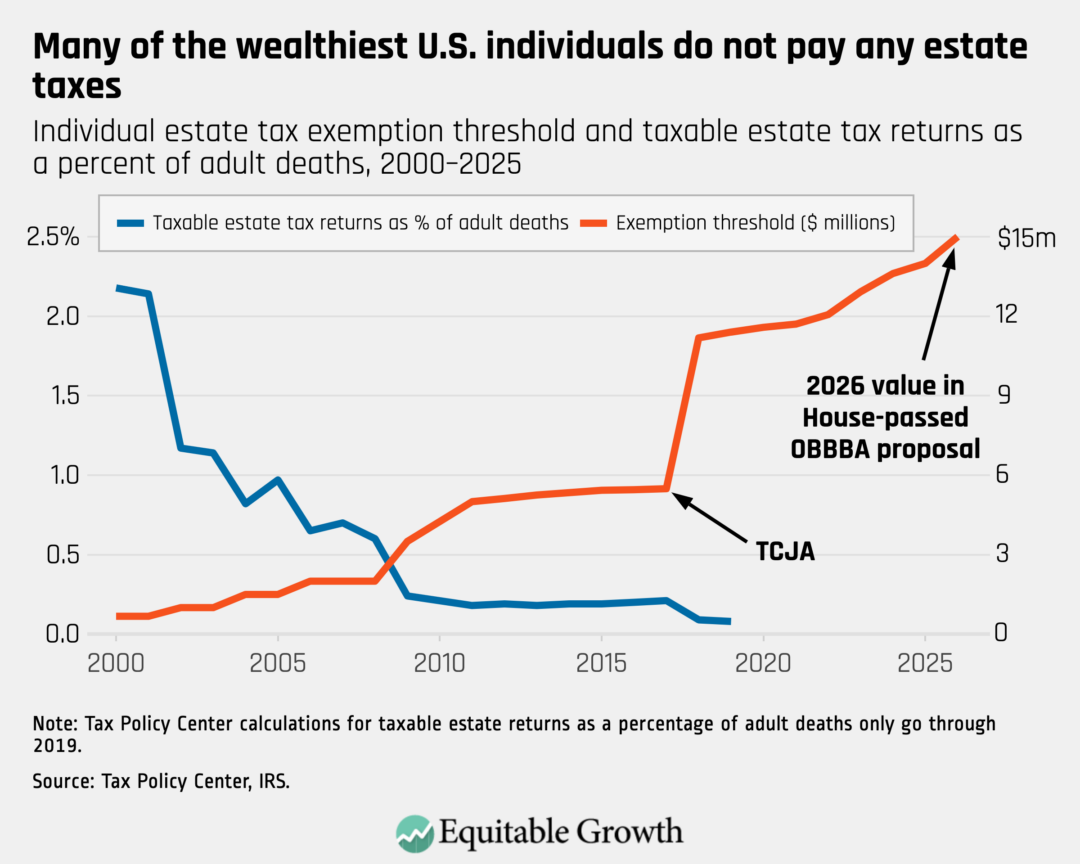
Specifically, the current Republican tax bill calls for increasing the individual estate tax exemption threshold to $15 million ($30 million for couples) and making these changes permanent.9 From our own survey research, we know that telling middle-income Americans that the current exemption threshold is about $14 million for individuals usually comes as a large shock—most people believe that the exemption level is far lower.10 What should be equally shocking is that the bill, if passed, would increase this amount and make the change permanent. The benefits of these changes would accrue exclusively to the wealthiest individuals in the country.
In short, the tax cuts in the One Big Beautiful Bill Act widen the economic divide at a time when it is already large and growing. The picture looks even worse when we look at the spending side of the bill, to which we turn next.
Regressivity driver #2: Spending cuts for the rest of Americans
Our ongoing survey research shows that Americans do not support the large spending reductions that make the Republican bill so regressive. They are particularly opposed to the more than $900 billion in cuts to Medicaid and Affordable Care Act coverage.
Recognizing this political reality, President Trump recently warned congressional Republicans, “Don’t f–k around with Medicaid.” Yet they did not heed his advice. Instead, House Republicans have sought to portray unprecedented cuts to Medicaid, nutrition assistance, and student loans for low-income borrowers as efforts to reduce waste, fraud, and abuse.
These claims are demonstrably false. The unpopular spending cuts in the One Big Beautiful Bill Act will slash eligibility and benefits for critical policies that reduce poverty, safeguard health security, and promote equal opportunity. The biggest of these cuts affects health care (at $900 billion), but the bill also reduces spending by a combined $650 billion on the Supplemental Nutrition Assistance Program ($300 billion) and student loans ($350 billion).
Similar to the tax cuts they help finance, the bill’s spending cuts are guaranteed to substantially increase inequality. They share another feature, too: These are complex changes to policy details that few Americans recognize or understand. Indeed, many involve the imposition of new administrative burdens on people who receive or apply for public benefits at the state level.
There is only one way that regressive spending cuts can free up $1.3 trillion to finance regressive tax cuts: by taking away valued benefits from tens of millions of Americans. We now detail the cuts to health care, nutrition assistance, and student loans.
Cuts in Medicaid and Affordable Care Act coverage
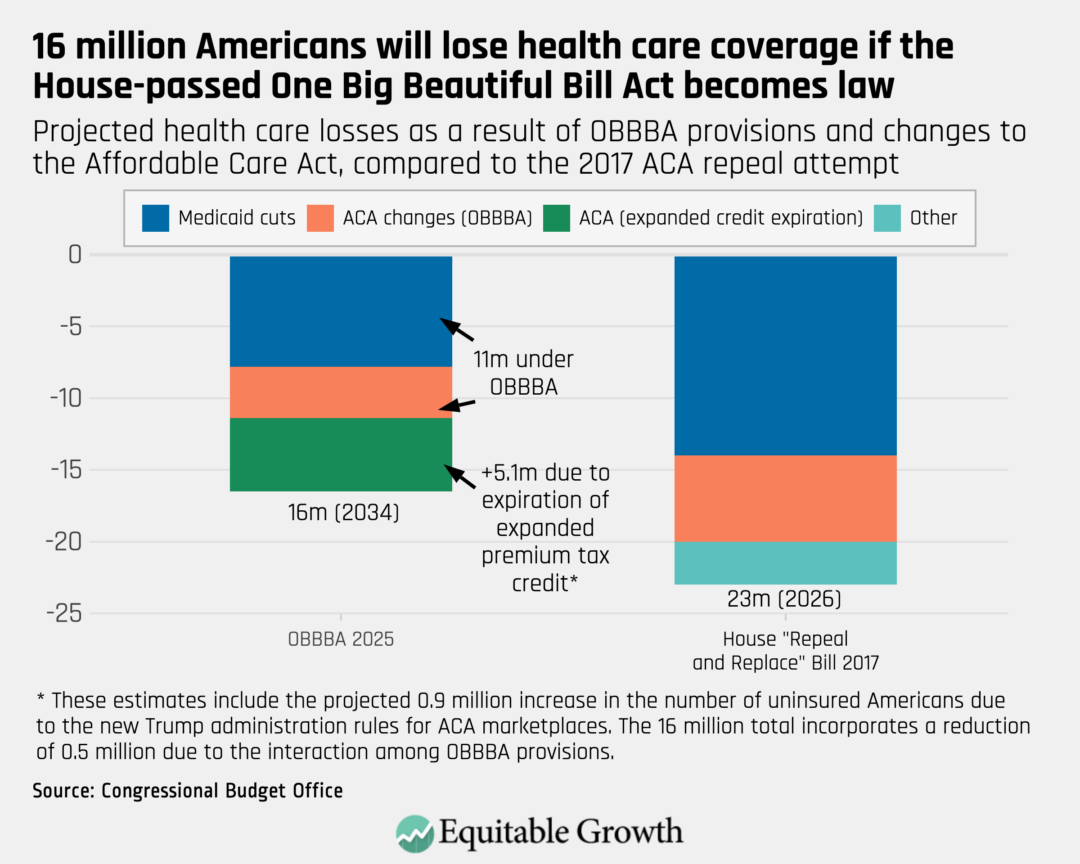
The largest single source of spending “offsets” for tax cuts, the proposed cuts to Medicaid and changes to the Affordable Care Act would result in the biggest loss of health insurance coverage in U.S. history. According to the Congressional Budget Office, roughly 11 million Americans would become uninsured due to the OBBBA provisions. Another 4 million would lose coverage, according to CBO estimates, because the bill, despite extending regressive tax cuts, would not extend expanded premium tax credits for insurance purchased in the ACA marketplaces, which are set to expire at the end of 2025. And another 1 million Americans would lose health care coverage because of changes in the marketplaces being pursued through executive action.
As Figure 4 shows, these total losses of 16 million rival the 23 million that was projected for the bill that House Republicans passed in 2017 to repeal and replace the Affordable Care Act—an effort that eventually failed in the U.S. Senate, in part because it was the least popular major piece of legislation in at least a generation. (See Figure 4.)
Figure 4
This time around, Republicans are seeking similar health care losses but in a way that would better obscure their responsibility for the fallout—namely, by simultaneously restricting funding for and imposing new requirements on states and beneficiaries.
On the funding side, states will not be able to use health-care-related assessments or taxes—an important source of revenue for state Medicaid programs in every state but Alaska—to increase revenues for their programs. Some states may even be required to restructure their existing assessments in ways that reduce revenues or abandon them altogether. In addition, states that expanded Medicaid under the Affordable Care Act will be severely penalized if they provide coverage to noncitizens, even if those beneficiaries are lawfully living in the United States and even if states fully fund this coverage.
However, the biggest administrative burdens will be imposed on people who rely on Medicaid, in the form of stringent work requirements that entail both intrusive screening of applicants and frequent recertification of Medicaid beneficiaries. It is crucial to recognize that most of those who lose coverage under this rule will, in fact, be working or would qualify for an exemption based on having a disability, being in school, or other factors. Based on past experience with work requirements in state Medicaid programs, the Center on Budget and Policy Priorities estimates that at least 2 in 3 enrollees losing coverage would be wrongly cut off from coverage or mistakenly prevented from gaining it. According to the Congressional Budget Office, these severe administrative burdens would do nothing to increase employment.
Finally, although President Trump has repeatedly promised he would not cut Medicare, the current Republican bill would have major negative effects on Medicare enrollees who are “dually eligible” for Medicare and Medicaid—almost 9 in 10 of whom had annual incomes below $20,000 in 2020. Indeed, according to the Congressional Budget Office, just one provision would cause nearly 1.4 million low-income people with Medicare to lose access to state-run savings programs that lower their premiums and out-of-pocket costs.
Cuts to nutrition assistance
A similarly grim story can be told about the Supplemental Nutrition Assistance Program. If enacted, the One Big Beautiful Bill Act would end the federal commitment to funding 100 percent of food benefits, shifting a significant share of these costs to the states for the first time in the almost 50-year history of nationwide food assistance. Under the bill, states would be required to pay for at least 5 percent of benefits. In many states, however, the share would be even higher—as much as 25 percent of benefit costs—because of new requirements and penalties in the bill.
These tough new rules are being presented as penalizing states that have high error rates, whether they be over- or under-payments. Yet virtually all states have mis-payment rates that are, or in the recent past have been, above the new minimum standard, and such mis-payments almost always reflect unintentional mistakes by state workers and households rather than fraud.
Even as the Republican bill would impose these penalties, it would slash by half dedicated federal funding for the administration of state programs. This would not only push more costs onto states but also would increase the chance that states incur penalties.
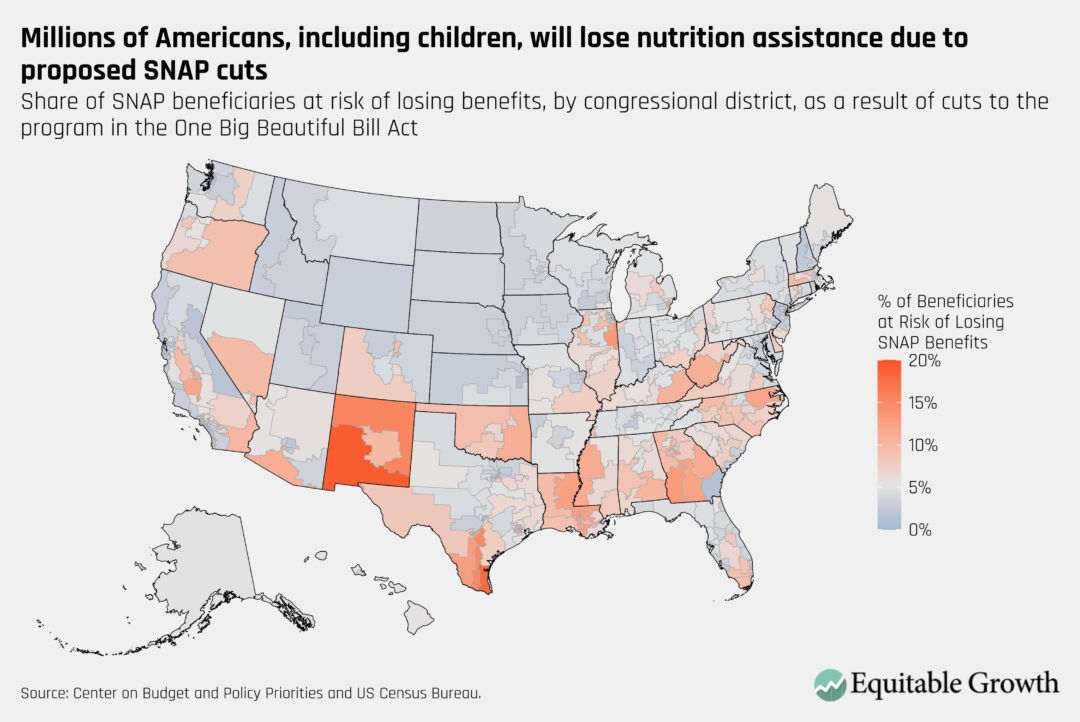
As draconian as these requirements are, the bill would impose at least as devastating cutbacks directly onto beneficiaries in the form of expanded work requirements. As a result of these new administrative burdens, the Congressional Budget Office estimates that 3.2 million fewer people would receive SNAP benefits in a typical month, while the Center on Budget and Policy Priorities estimates that 11 million people—including 4 million children—would be at risk of losing SNAP benefits or seeing the benefits for their families cut. As Figure 5 shows, these losses would be widespread but concentrated in congressional districts in poorer parts of the nation. (See Figure 5.)
Figure 5
Cuts to subsidized student loans for low-income students
The bill’s large cuts to student loans have received relatively little attention, in part because they are so abstruse. Yet these cuts are as large in the aggregate as the cuts to SNAP—and similarly focused on restricting access to federal support for the least affluent Americans.
The bulk of these changes concern income-driven repayment, a means of reducing the risk of costly human capital investments for students who don’t have the safety net of substantial family wealth. Higher education is risky because, while average returns are high, there is substantial variability in post-graduate earnings—both because of deliberate choices, such as going into valuable but relatively low-paying professions such as teaching, and because of unexpected shifts in demand for specific occupations and skills.
In effect, income-contingent loans allow students whose incomes after graduation are lower to make smaller repayments, while conversely, students whose earnings are higher pay more of their loans back. These plans therefore foster not only greater economic opportunity but also greater economic security.
The One Big Beautiful Bill Act replaces existing income-driven repayment plans with a single new plan, the Repayment Assistance Plan, or RAP. The Urban Institute has compared the effects of this plan on borrowers relative to the main existing federal options, finding that “undergraduate borrowers with the lowest incomes (below $34,000) would be required to pay substantially more of their debt under the RAP than under current options.”11 Similarly, its calculations show that graduate borrowers with high levels of student debt would pay more under the proposed Repayment Assistance Plan until they earn around $70,000 per year.
Part of the reason for this disproportionate impact on lower-income borrowers is that the proposed plan, unlike existing plans, would apply to the first dollar of income, whereas existing options do not require repayment when earnings are below 150 percent of the federal poverty level. In other words, payments would be newly required for the poorest borrowers. By contrast, higher-income borrowers would be little affected, both because of the repayment formula and because they generally are not eligible for or opt out of income-driven repayment.
Finally, the bill alters eligibility standards for the federal Pell grant—the main source of support for low-income students attending college. Though again complex, the main changes would tighten eligibility for the program in ways that would reduce eligibility and benefits. According to the Congressional Budget Office, more than half of Pell grant recipients would see their awards decline, and roughly 7 percent would lose eligibility altogether.12 It is worth emphasizing that two-thirds of Pell grant funds currently go to families with less than $30,000 in annual household income, and 93 percent go to families with less than $60,000.
In short, Republican tax cuts for the affluent are being financed through cuts to programs that allow lower-income students and their families to achieve a better future.
Putatively populist provisions distracting from the bill’s regressive skew
Proponents of the One Big Beautiful Bill Act have focused on its provisions for no taxes on tips and overtime. These putatively populist provisions have garnered a lot of attention-grabbing headlines, and their perceived policy effects are more readily grasped by larger swaths of the public.
The day the bill was passed by the House of Representatives, we conducted a headline search of news stories dating back to the beginning of 2025 using NexisUni, a platform often used to examine media mentions of a given topic. Coverage of “no tax on tips” dominated the press, and mentions of “no tax on overtime” also rivaled or exceeded mentions of these more regressive elements. Unsurprisingly, then, in a survey we conducted in early June, Americans were more likely to have heard about these allegedly populist tax provisions than the bill’s more hidden regressive components. (See Figure 6.)
Figure 6
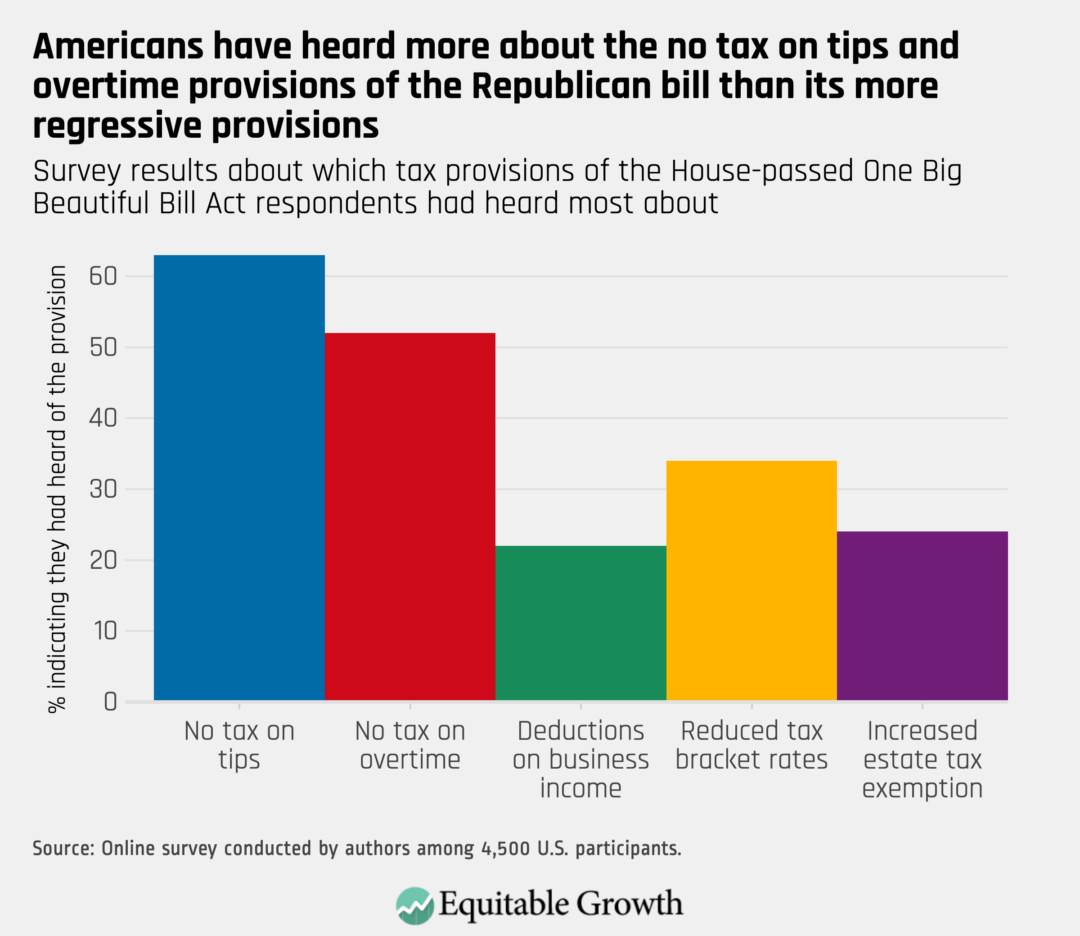
Despite the disproportionate attention devoted to these “no tax” provisions, their effects would be strikingly limited. Tipped workers make up less than 3 percent of all U.S. employment. Moreover, many tipped workers earn low wages and thus already pay little or nothing in federal income taxes, making these provisions meaningless. The Tax Policy Center estimates that only around “2% of all households … would receive a tax cut” from provisions similar to those proposed in the One Big Beautiful Bill Act. Similarly, relatively few workers (around 6 percent) reported working overtime in 2024.
Given these realities, the average tax cut for individuals in middle- to lower-income quintiles also would be extremely small. According to the Tax Policy Center estimates, those in the lowest quintile would see virtually no benefit; the second and middle quintiles would see an average increase in their after-tax incomes of only 0.1 percent—that is, one-tenth of 1 percent.
What’s more, the Center on Budget and Policy Priorities has shown that a no tax on tips type of provision would do almost nothing to make the bill less regressive. As for overtime, similar provisions to those in the bill would result in the second-lowest quintile getting an average annual tax cut of only around $80; for those in the lowest quintile, this drops to about $10.
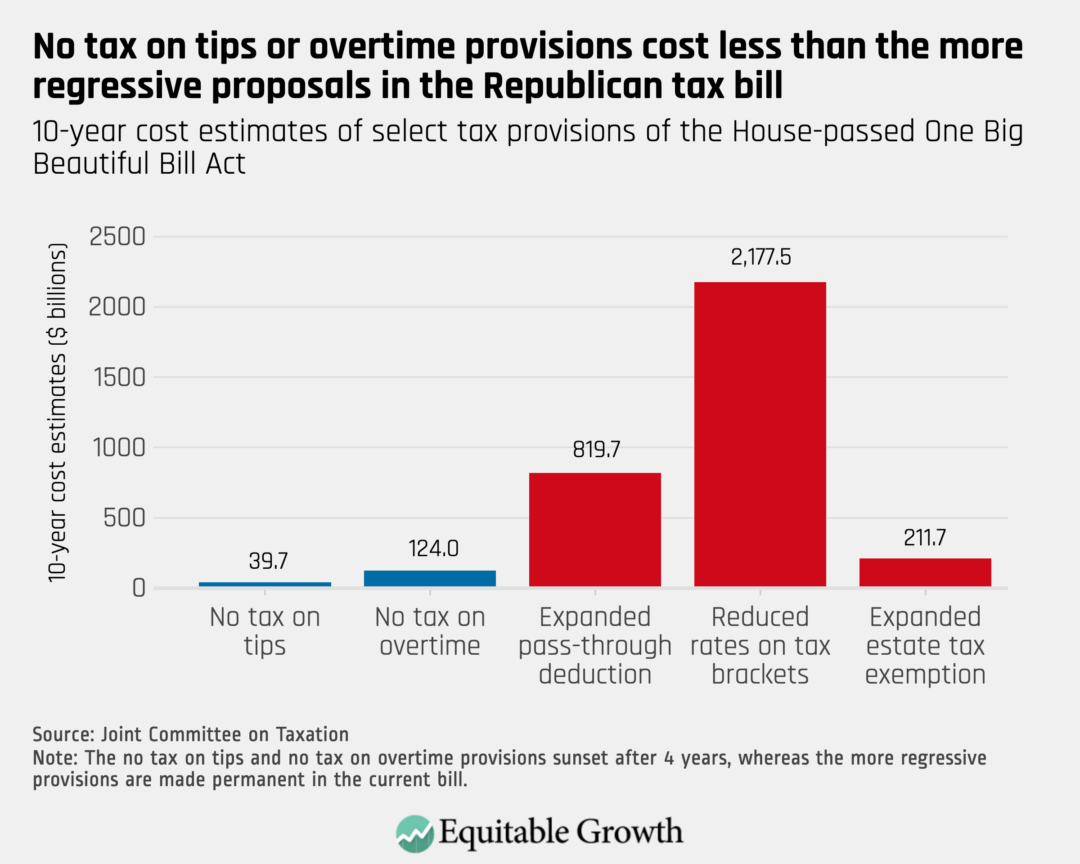
Lastly, as Figure 7 shows, the costs of these provisions pale in comparison to the more regressive pieces of the legislation, which lawmakers are seeking to make permanent, while these putatively populist provisions would sunset at the end of 2028. Indeed, even if these provisions were extended over a 10-year window, their costs would still fail to come close to those of the biggest regressive tax cuts in the bill. (See Figure 7.)
Figure 7
Policy feedback effect #1: IRS funding cuts will increase tax evasion and income reclassification
When policy analysts discuss “dynamic” effects, usually they are referring to the extent that growth will result in additional revenue, partially offsetting the cost of different pieces of legislation. For the One Big Beautiful Bill Act, researchers at the Joint Committee on Taxation have found little evidence that the bill would induce any noticeable growth or that any revenue generated due to these growth effects would come close to allowing the bill to “pay for itself.”13 Indeed, the CBO’s dynamic score concluded that the bill would actually increase deficits by an additional $423 billion if it were scored dynamically because small growth effects would be outweighed by higher interest rates.
In this section and the next, we focus on a different set of potential future dynamics that are highlighted by scholarship on policy feedback—that is, the ways in which the bill will create political-economic and fiscal pressures that increase tax evasion among the affluent and compound cuts in benefits and enrollment, especially at the state level.
Because these dynamic effects result from the interaction of the Republican bill and changing features of its context, such as cuts to the IRS and the eroding fiscal situation of the states, they are not factored into standard distributional analyses. When we consider them in light of policy feedback scholarship, however, it becomes clear that the One Big Beautiful Bill Act is likely to be even more regressive than current projections indicate.
We turn first to the cuts to IRS funding and enforcement capabilities.
The assault on the IRS, and tax avoidance and evasion by the rich
The current Trump administration and the Department of Government Efficiency have put the Internal Revenue Service and its employees in their crosshairs. Both IRS staff and spending are on the chopping block, including enhanced IRS resources authorized by the 2021 Inflation Reduction Act. Some reports have suggested that the administration is seeking a “reduction in force” that would rid the agency of approximately 50 percent of its staff, or up to 50,000 workers. This is against the backdrop of dramatic declines in IRS funding and staffing that were occurring prior to the enactment of the Inflation Reduction Act of 2021.
These mind-boggling cuts, if implemented at anything close to the envisioned scale, are certain to translate into significantly less enforcement capacity for the agency, which would allow high-income individuals to avoid or evade taxes to an even greater extent than they already do. They are also highly likely to result in large—and, under certain assumptions, drastic—reductions in federal revenue collected, which is of course needed to fund the vital programs discussed above.
Declining tax enforcement helps those at the top for two simple reasons: They are the most capable of avoiding or evading their legal tax obligations, and, with their higher incomes, they have a greater incentive to do so. For most earners—especially those with middle-class and lower incomes—the vast majority of their earnings come from wages and salary, and taxes are regularly withheld from their paychecks. Higher earners, however, tend to earn much more of their incomes from sources other than wages, including pass-through entities, which we highlighted earlier. As a study from the Brookings Institution shows, the top 0.1 percent of earners receive more than 75 percent of their incomes in forms other than wages, the top 0.01 percent receive nearly 85 percent from these other sources, and the top 0.001 percent receive more than 93 percent of their income from nonwage sources.
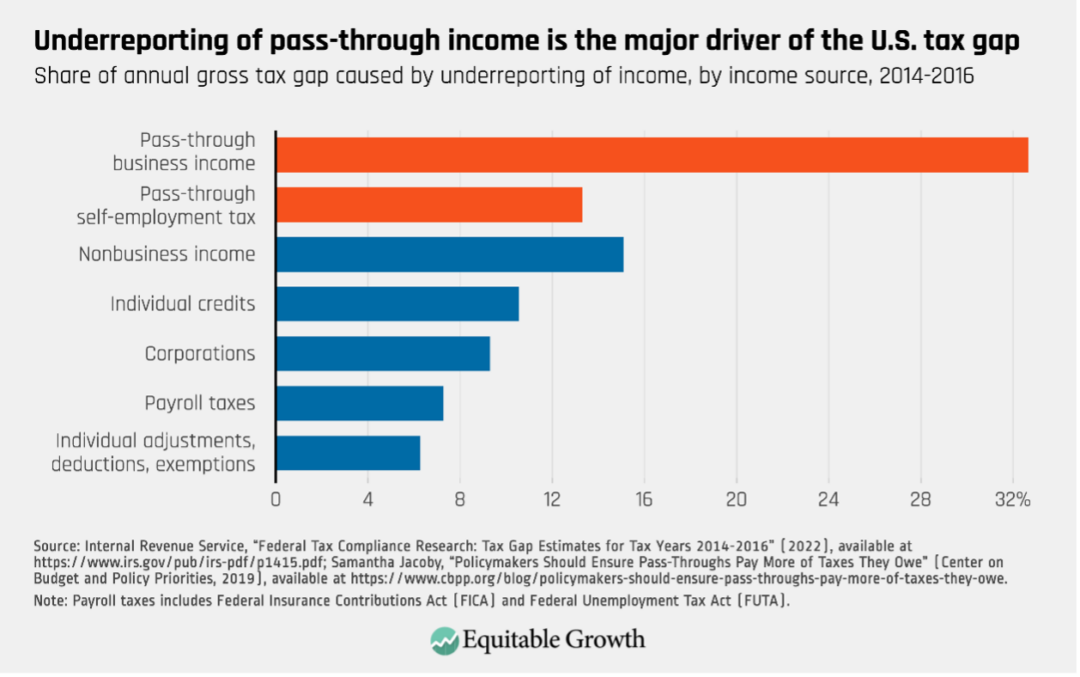
Relative to wage income, the IRS typically has less—and, in some cases, far less—information on these sources of income. As such, noncompliance generally increases with income. Moreover, higher-income taxpayers simply earn more, making tax evasion by this group more costly to the government. Underreported income from pass-through businesses, for example, is a major driver of the tax gap—or the difference between taxes collected and those legally owed. (See Figure 8.)
Figure 8
Unsurprisingly, then, high-income taxpayers contribute to the tax gap to a substantially greater degree than those with lower incomes. Our colleagues at the Yale Budget Lab estimate that the bottom 50 percent of taxpayers are responsible for less than 6 percent of the total amount of unpaid taxes in a given year. By contrast, those in the top 5 percent are responsible for half of the total tax gap, and the top 1 percent alone is responsible for nearly 30 percent.
Why cutting IRS enforcement is counterproductive
Study after study shows that IRS enforcement generates much more revenue than it costs, especially from corporations and those with high-incomes. One study found, for instance, that increasing spending on IRS audits raises just over $2 in additional revenue for each dollar spent. Audits of those in the 99th percentile to the 99.9th percentile bring in about $3.20 per dollar spent, while audits of those in the top 0.01 percent yield a stunning $6.30 per dollar.
As impressive as these numbers are, they do not include so-called deterrence effects. When audited, taxpayers who have misreported taxes become much more cautious in the future, which typically means increasing their reported income and, as a result, revenue raised. The same study referenced above also finds that these deterrence effects bring in more than 3 times as much revenue as the audits themselves and lead to a combined total of $12 of revenue generated for each dollar spent on audits above the 90th percentile.
The key takeaway is that the direct and indirect revenue effects of additional spending on auditing high-income individuals are large. Moreover, voters overwhelmingly agree that the IRS should conduct more audits on high-income earners and corporations.
Instead, policymakers are heading in the opposite direction. The Yale Budget Lab estimates that reductions in force of about 7,000 IRS employees would lead to net foregone revenue—that is, net of any savings the IRS would accrue thanks to a lower head count—of approximately $64.3 billion over the next decade. This is already a sizable drop when compared to the lab’s estimates that the $80 billion in expanded funding under the Inflation Reduction Act would have generated more than $600 billion in net revenue over the course of a decade. However, if the Trump administration lays off closer to 50,000 IRS workers, the 10-year net revenue decrease would total nearly $350 billion. And these numbers do not include indirect deterrence effects.
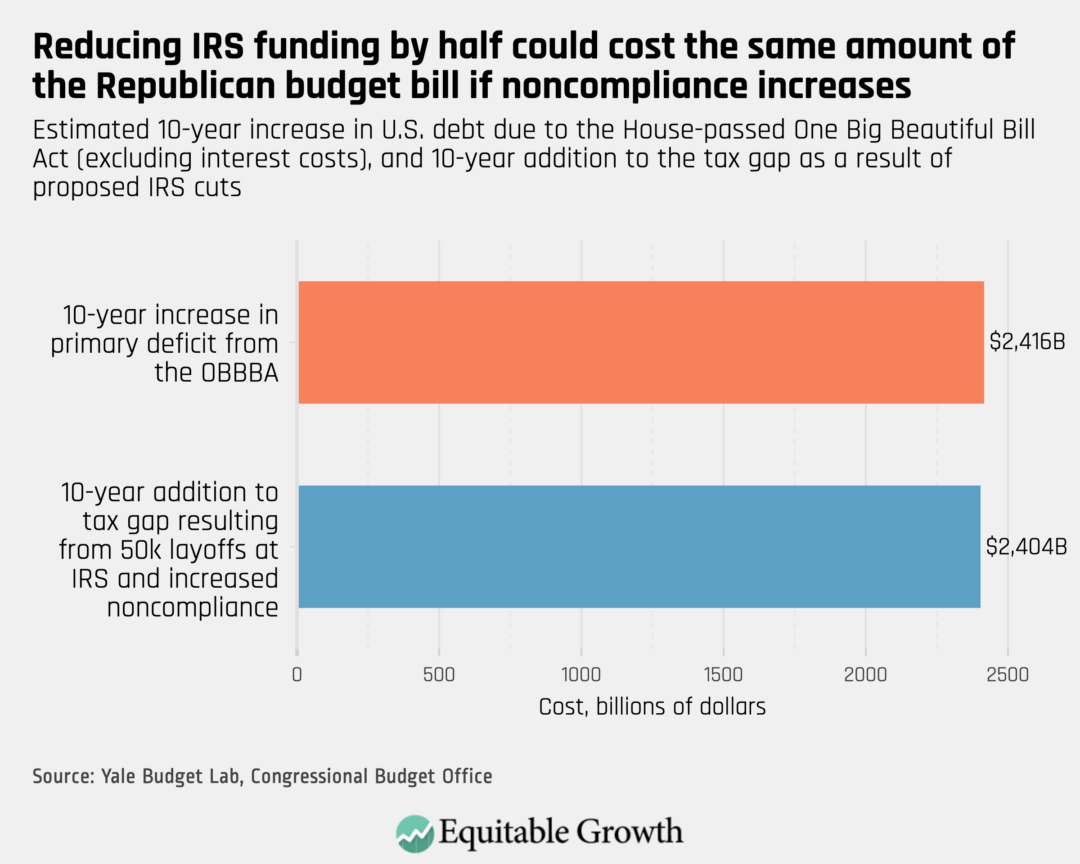
Incorporating increases in behavioral responses that lead to decreased compliance, a reduction in the IRS workforce by about 50,000 jobs could lead to an additional $2.4 trillion added to the tax gap over the next decade, with most of this gap, again, resulting from declining tax enforcement at the top of the income distribution.14 If $2.4 trillion sounds familiar, it is because it is equivalent to the amount that the Congressional Budget Office estimates would be added to the primary deficit over a 10-year period under the One Big Beautiful Bill Act. (See Figure 9.)
Figure 9
Policy feedback effect #2: Restricted fiscal and economic circumstances will increase pressure on states to cut benefits
The dynamic feedback effects that are likely to increase tax evasion and the exploitation of tax loopholes by affluent Americans have their counterpart in the dynamic feedback effects that are likely to increase the losses imposed on less affluent Americans.
A large body of research has analyzed what is sometimes called bureaucratic disentitlement—the ways in which the administrators of programs, under fiscal pressure and facing new rules and messages from above, reduce spending and access to programs for which citizens are technically eligible.15 The design and context of the Republican budget bill’s provisions are almost perfectly calibrated to produce a dramatic upswing in such retrenchment, compounding the decline in health insurance, food assistance, and access to financial aid for low-income students.
These cascading effects could make the bill even more devastating for less affluent Americans than projected by the already-grim forecasts we have reviewed. Importantly, the resulting benefit cuts would be the result of complex administrative and spending decisions that would often play out in highly decentralized ways—making them difficult to attribute to federal lawmakers. For national politicians seeking to impose unpopular policy outcomes, this is a feature, not a bug, and could make it much harder to muster the focused political response necessary to slow or reverse these changes.
Intense new pressures on states to cut eligibility and benefits
The major site of these cutbacks will be cash-strapped states. States are required (legally or effectively) to balance their budgets, and as a whole, they are already facing one of the worst fiscal situations in decades. They will now have to face it with major cuts in federal Medicaid and SNAP funding, including targeted cutbacks in federal support for state administration, while being required to implement administratively challenging new requirements.
All the estimates of Medicaid and SNAP cuts we have discussed in this report incorporate specific assumptions about how much of the shortfall that states face under the proposed Republican bill will be made up by increased state spending. The general assumption used by the Congressional Budget Office in its cost projections, for instance, is that roughly half of federal cuts will be covered by states. These assumptions imply that to cover the shortfall, states will either cut spending elsewhere in their budgets or raise taxes—both highly difficult in the current environment.
If states cannot cover the expected share of the growing gap in funds, the coverage and benefit losses will be even greater than expected. But even if states are able to cut spending in other policy areas to finance continued Medicaid or SNAP benefits, these spending cuts would have negative effects on lower-income state residents that are not included in distributional estimates of the bill’s direct consequences. Either way, states will be under enormous pressure to reduce the cost of affected programs.
How states might pursue such cost reductions is little mystery. The One Big Beautiful Bill Act contains mandates and penalties that are designed to pressure the states to increase administrative burdens so eligible beneficiaries are pushed or kept off the rolls. Remember that most of those who fail to receive benefits will actually be eligible for those benefits but will simply fail to run the administrative gauntlet or be discouraged from even trying.
The history of state-level programs focused on less affluent residents provides strong expectations about how front-line administrators are likely to operate in this new context. Responding to new rules, incentives, and messages, they will likely lean toward more draconian implementation of eligibility and benefit rules. Here again, the feedback effects of the bill could cascade to produce much larger losses for less affluent Americans than projected.
The darkest of scenarios would play out if the United States experiences a significant economic downturn—a prospect that has become much more likely in recent months due to federal spending cutbacks, high and ever-changing tariffs, erratic trade policy, and much-increased political uncertainty. During the Great Recession of 2007–2009, states not only cut back on Medicaid but also slashed spending on public elementary and higher education to stay afloat. With states forced by the Republican tax bill to shoulder much more of the costs of health and nutrition benefits themselves, the negative effects of the next economic downturn could be even larger—not just on Medicaid and nutrition assistance, but on other crucial state-level policies that reduce inequality as well.
Confusion, delay, and cutbacks for federal student loans and grants
While student loans for higher education are a federal responsibility, negative feedback effects are likely to operate in this realm too. First, as just discussed, states already face a challenging situation funding higher education. Nearly 90 percent of Pell grant funds go to public universities, which are already under severe financial pressure. In the context of an economic downturn, state funding for public universities could be further compromised, reducing the capacity of these vital institutions to enroll less affluent students.
Second, federal-level political and economic dynamics are profoundly challenging, too. Just as IRS funding and staff are under threat, so too is the U.S. Department of Education, which administers both the Pell grant program and income-driven repayment plans. In addition to changes in these programs that raise costs for lower-income students, the One Big Beautiful Bill Act would require that the federal Department of Education implement a complex proposal that is designed to penalize colleges with lower levels of student loan repayment—penalties that could reduce the ability of these colleges to serve lower-income students.
Quickly implementing the bill’s envisioned changes to Pell grants and loan repayment programs, as well as its new rules for colleges, would be challenging if the Department of Education were at full capacity. But the department is, in the words of Secretary Linda McMahon, “winding down,” having already lost nearly half its staff. As new rules are being worked out, borrowers are likely to face severe confusion, bureaucratic unresponsiveness, and interim solutions that will raise their costs. As with the Medicaid and SNAP cuts, the most severe effects will hit those with fewest resources—lower-income students most reliant on federal grants and loans to attend and remain in school.
Similar to the potential increase in tax evasion that would result from deep cutbacks at the IRS, these processes of bureaucratic retrenchment defy precise distributional estimates, which is why they are a means of obscuring the bill’s true effects. Yet what’s crucial about these uncertain effects is that they all point in one direction: toward bigger tax cuts and bigger spending cuts, producing bigger regressive distributional impacts than current analyses suggest.16
Conclusion
Our review of tax and budget laws from the past four decades shows that the Republicans’ current legislation is unprecedented in the extent to which it shifts income from low- and middle-income Americans to the rich. That regressivity is striking on its own terms—no other law of this period has combined large tax cuts concentrated on those at the top with large spending cuts focused on those lower down the economic ladder.
Yet it is all the more striking because leaders of the Republican Party, and especially President Trump, have presented themselves as economic populists. The truth is that the few allegedly populist provisions, such as no tax on tips, are miniscule compared with the huge tax cuts for the richest Americans. Similarly, claims that the bill “would not actually be cutting” popular programs are at odds with the reality that millions of Americans—most of them workers or those living in working households—would lose health insurance, food assistance, and other crucial benefits if the bill became law.
Once we look beneath the surface of the bill’s deliberate complexity, its big regressive provisions reveal their ugly heads. These provisions are historically skewed toward the affluent even when we look at them in isolation. When we examine them not on their own but in parallel with other co-evolving dynamics, such as cuts to IRS funding and the strained fiscal situations of many states, the likely regressive effects look even bigger.
If populism means standing up for the ordinary workers and their families, this bill does exactly the opposite. After a half century of rising gaps between the rich and the rest, it will only deepen citizens’ concerns about a political system that seems highly responsive to economic elites while compounding the strains facing ordinary Americans. The best way to start restoring confidence in that system is to defeat this historically regressive bill.
About the authors
Jacob S. Hacker is Stanley Resor Professor of Political Science at Yale University and director of the American Political Economy eXchange, or APEX, at the Yale Institution for Social and Policy Studies. He is also faculty co-director of the Ludwig Program for Public Leadership at Yale Law School.
Patrick Sullivan is a postdoctoral scholar at APEX and an associated researcher at “The Politics of Inequality” Cluster of Excellence at the University of Konstanz.
Acknowledgements
We would like to thank Emilie Openchowski, Elena Waskey, and David Mitchell at Equitable Growth for providing us with feedback, encouragement, and assistance; Lucas Kreuzer for his valuable research assistance; Alex Hertel-Fernandez and Philipp Rehm for reading and responding to draft versions of our arguments; Natasha Sarin, Harris Eppsteiner, John Ricco, and Martha Gimbel of the Budget Lab at Yale University for providing and explaining their distributional data; and Chuck Marr and Brendan Duke at the Center on Budget and Policy Priorities for discussing early ideas related to this project.
Did you find this content informative and engaging?
Get updates and stay in tune with U.S. economic inequality and growth!
End Notes
1. By regressive, we mean that it increases incomes for those in the top part of the income distribution more than it does for those in the lower part of the income distribution, widening inequality.
2. We focus on tax and budget bills, both so we are comparing comparable legislative packages and also because the distributional effects can be more reliably calculated. We exclude from our comparison the 1996 welfare reform law (the Personal Responsibility and Work Opportunity Reconciliation Act). Unlike the other tax and budget laws we discuss, it did not contain large tax changes, and it is probably better thought of as social welfare legislation than a tax and budget bill. In any case, its estimated regressivity, while substantial, does not rival that of the One Big Beautiful Bill Act, in large part because it had no positive effects on the incomes of affluent taxpayers.
3. It would be even more regressive if Republicans had not made permanent in 2017 another tax provision favorable to the richest Americans—a large cut in the corporate tax rate.
4. The exception is the 1997 agreement between President Bill Clinton and congressional Republicans, which increased the deficit but had relatively modest, if regressive, effects on the distribution of income. Additionally, while we would have liked to go back further in time to compare how the One Big Beautiful Bill Act compares to even earlier years, we were unable to find reliable or comparable estimates.
5. Though the One Big Beautiful Bill Act is a bill that has, at the time of publication, only been passed by the House of Representatives, we use “laws” for ease of presentation. The question is how this bill would compare with these other laws if it were enacted. In addition, because we are interested in comparing single tax and budget laws, we look only at the largest of the several rounds of tax cuts that occurred under President George W. Bush, the 2001 law, which dwarfed the others in its magnitude and effects.
6. Authors from the Federal Reserve and Joint Committee on Taxation found that “51% of gains [from the 2017 corporate tax cuts] flow to firm owners, 10% flow to executives, 38% flow to high-paid workers, and 0% flow to low-paid workers.” To make the point more clearly, workers in the bottom 90 percent of their firms’ earnings distribution saw their wages increase by $0 on average, whereas executives—those with average salaries of around $950,000—saw salaries increase by about $50,000. Examining the effect across the income distribution—that is, outside of firms—the authors found that the top 10 percent of earners captured approximately 80 percent of these gains.
7. Another important reason why pass-through income deductions are skewed is because of how they interact with marginal income tax rates. Deductions in the tax code function by reducing the amount of taxable income an individual owes. Because higher levels of income are taxed at higher marginal rates, individuals whose income places them in higher marginal tax brackets receive a greater return on an additional dollar of deductions relative to those with lower levels of taxable income.
8. Wealth inequality in the United States is also much higher than income inequality. The top 1 percent captures around 20 percent of national income in a given year, but about 35 percent of wealth is owned by the most affluent 1 percent.
9. Though large increases to the tax’s exemption threshold occurred already as part of the 2001 Bush tax cuts—the tax was actually eliminated for 1 year (2010) but was reinstated in 2011 with an individual exemption amount of $5 million—the Tax Cuts and Jobs Act of 2017 also included a provision that nonpermanently but substantially increased the exemption threshold for the federal estate tax, doubling the exemption threshold to $11 million per individual ($22 million for couples).
10. Patrick Sullivan and Kattalina Berriochoa, “Death, Taxes, and Family: Facts and Frames on Public Opinion.” Working Paper (2025). In this paper, we find that less than 7 percent of our sample of U.S. participants believed the individual estate exemption threshold to be more than $10 million.
11. The plan developed by the Biden administration—Saving on a Valuable Education—is under court review and therefore not among those options.
12. The Congressional Budget Office estimates that roughly 10 percent of Pell grant recipients would be ineligible under the bill’s new minimum requirement of 6 credit hours, but that “about one third” of those affected would enroll in more credits to avoid losing their awards.
13. Economists at the Joint Committee on Taxation, for instance, calculated the 10-year costs of the bill to be roughly $3.8 trillion, only of which $100 billion (less than 3 percent) would be offset from so-called macroeconomic revenue feedback effects.
14. The Yale Budget Lab team notes that this number could actually be an understatement as it excludes some other key areas of income misreporting (such as on corporate income).
15. Important works on the dynamics of bureaucratic disentitlement include Pamela Herd and Donald P. Moynihan, Administrative Burden: Policymaking by Other Means (New York: Russell Sage Foundation, 2019); Joe Soss, Richard C. Fording, and Sanford Schram, Disciplining the Poor: Neoliberal Paternalism and the Persistent Power of Race (Chicago: University of Chicago Press, 2011); Zachary Parolin, “Temporary Assistance for Needy Families and the Black–White child poverty gap in the United States,” Socio-Economic Review 19 (3) (2021): 1005–1035, available at https://doi.org/10.1093/ser/mwz025; Jamila Michener, Fragmented Democracy: Medicaid, Federalism, and Unequal Politics (New York: Cambridge University Press, 2018); and Andrea Louise Campbell, Trapped in America’s Safety Net: One Family’s Struggle (Chicago: University of Chicago Press, 2014).
16. Again, we are focused just on the feedback effects that the One Big Beautiful Bill Act will produce in the current political-economic context. If we were to include in our analysis other likely dynamics—such as the increased risk of new federal spending cuts in the context of rapidly increasing debt levels—the expected negative feedback effects would be even larger. In other words, it is worse than it looks, and if we accounted for these additional risks, it would look even worse.


Stay updated on our latest research