New U.S. Census Bureau data show significant economic disparities among the LGBTQ+ community

The evidence across academic and research disciplines overwhelmingly indicates that disaggregated data help build a more detailed narrative about the varying economic experiences of the U.S. population. While great strides have been made to disaggregate federal data by race, ethnicity, gender, income groups, and other categories, one group has long been excluded: the LGBTQ+ community.
Yet new data from the U.S. Census Bureau’s Household Pulse Survey now make it possible to look at a wider range of issues that the LGBTQ+ community faces amid the ongoing COVID-19 pandemic. The Household Pulse Survey began in April 2020 to monitor the impact of the pandemic and ensuing recession on U.S. households in real time, but it wasn’t until July 2021 that the survey began collecting data on sexual orientation and gender identity, or SOGI. These questions allow for further data disaggregation and a clearer understanding of how the LGBTQ+ community is weathering the pandemic.
This is the first time a federal statistical agency has collected data on an inclusive LGBTQ+ community. While the decennial census asks respondents how they are related to the people living in their residence and reports on same-sex households, this doesn’t fully capture the experiences of the entire LGBTQ+ community. Similarly, in 2019, the Federal Reserve Survey of Household Economic Decisionmaking, or SHED, asked questions on sexual orientation and gender identity, but in 2020, supplemental SHED surveys omitted these questions.
This column takes a deeper look at the SOGI data presented in the Household Pulse Surveys over the past year and discusses the economic hardships and resiliency of the LGBTQ+ community in the United States, including discrepancies in job losses, housing stability, and health insurance coverage.
Discrepancies in job losses for LGBTQ+ workers
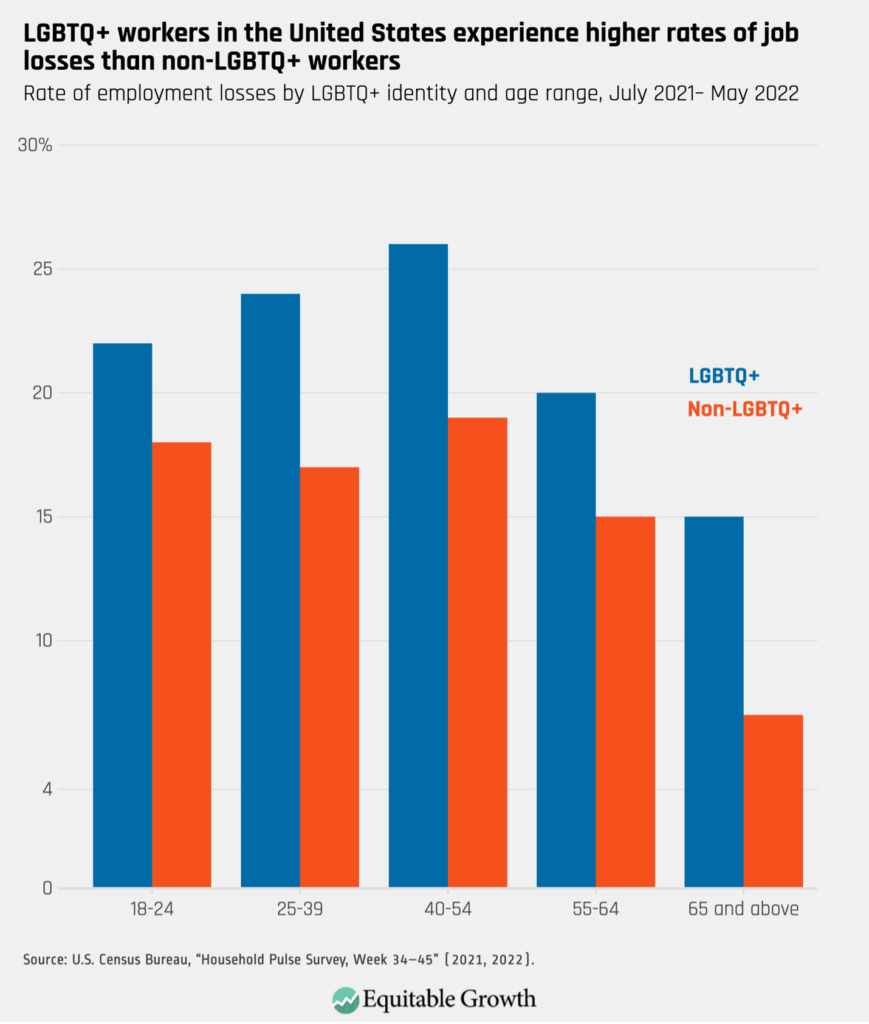
While the pandemic impacts U.S. workers across all demographic groups, the Household Pulse data indicate that LGBTQ+ workers are disproportionately affected, compared to non-LGBTQ+ individuals. Approximately 28 percent of LGBTQ+ respondents said they experienced some form of job loss since LGBTQ+ data collection began last July. Comparably, 18 percent of non-LGBTQ+ respondents reported job loss in the same time frame.
The data indicate that age plays an intersecting role in work-loss experience. LGBTQ+ respondents between the ages of 25 and 39 and 40 and 54 had the highest rates of job losses, while older, non-LGBTQ+ respondents had the lowest rates. (See Figure 1.)
Figure 1
These data are further validated by research from the Movement Advancement Project, which shows that LGBTQ+ individuals with additional demographic intersectionalities face greater rates of job loss. Black and Latinx LGBTQ+ households in the United States experienced higher rates of employment or wage loss, at 60 percent and 71 percent, respectively, between July 2020 and August 2020, compared to non-LGBTQ+ households of all races (45 percent).
While the onset of the COVID-19 pandemic played a significant role in increasing unemployment and decreasing incomes among LGBTQ+ workers, these disparities have been building in recent decades in the United States. Research from 2021, for instance, finds that the lesbian wage premium fell from around 10 percent in 2000 to almost zero in 2018. The Center for LGBTQ+ Economic Advancement and Research, or CLEAR, finds that in 2019, 31 percent of Black LGBT households and 24 percent of Latinx LGBT households reported earning less than $25,000 annually, compared to 24 percent of Black non-LGBT households and 15 percent of Latinx non-LGBT households.
Disparities in employment loss between LGBTQ+ and non-LGBTQ+ workers may also be driven by a large share of LGBTQ+ individuals being employed in industries hardest hit by the pandemic. Analysis by the Human Rights Campaign Foundation, for instance, finds that in 2018, the five industries with the greatest share of LGBTQ+ employees were restaurant and food services (15 percent of LGBTQ+ adults), hospitals and healthcare (7.5 percent), K–12 education (7 percent), colleges and universities (7 percent), and retail (4 percent). These five industries have experienced the greatest disruptions in employment since the onset of the pandemic, which comes on top of the already-low wages widely experienced in three of these industries—hospitality, retail, and K–12 education.
Housing affordability among the LGBTQ+ community
Access to affordable and stable housing has historically affected the LGBTQ+ community, especially LGBTQ+ youth. LGBTQ+ youth make up around 40 percent of all homeless youths, and around 80 percent of young homeless LGBTQ+ individuals say that their homelessness is a result of being forced out of their family homes or running away from their families.
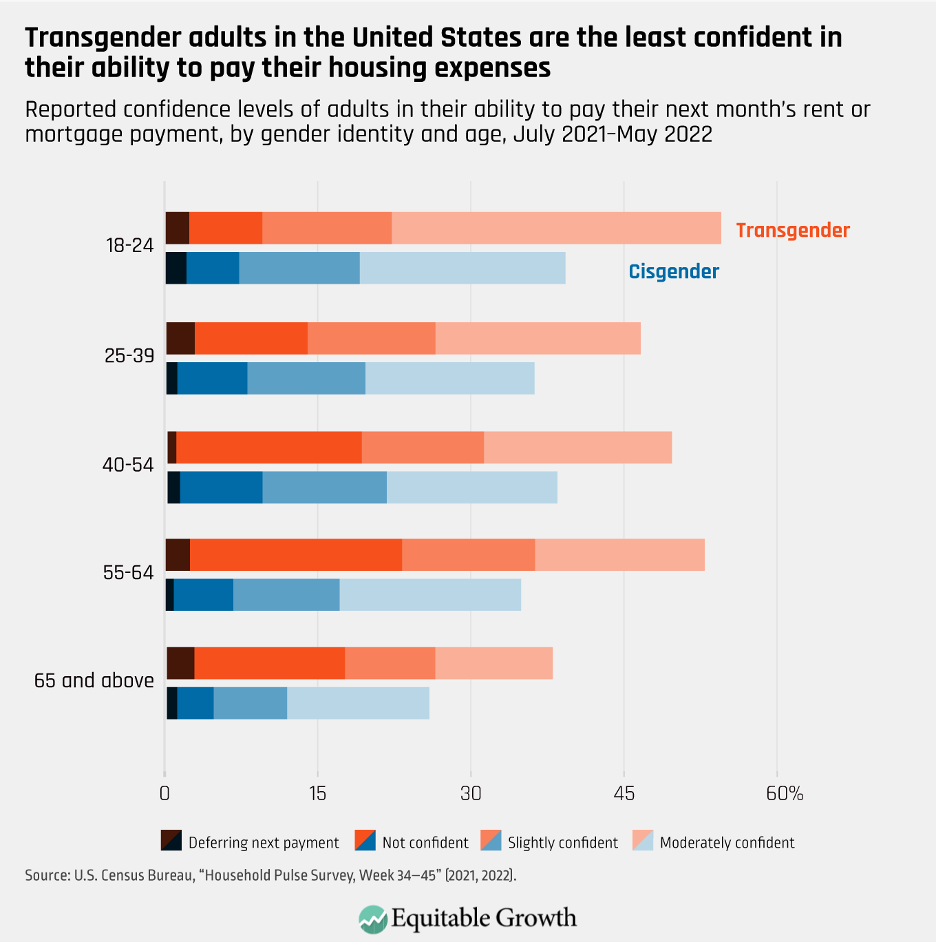
While the Household Pulse Survey does not ask about youth homelessness explicitly, it does collect data on housing affordability of adult respondents. Results show that LGBTQ+ adults of all ages were less confident than non-LGBTQ+ adults in their ability to pay their next month’s mortgage or rent payment, with young transgender adults reporting the least confidence of all groups. (See Figures 2 and 3.)
Figure 2
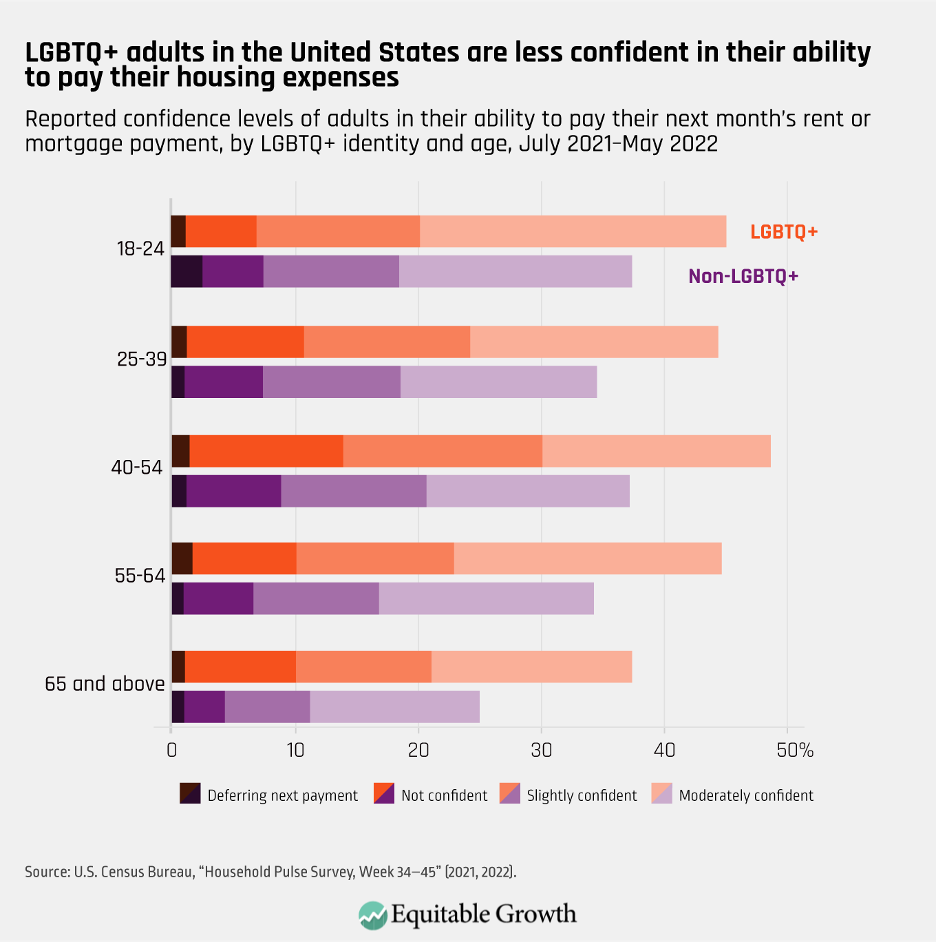
Figure 3
At the onset of the pandemic, the U.S. Centers for Disease Control and Prevention issued an eviction moratorium, barring landlords from evicting tenants for any reason. In September 2021, however, the Supreme Court struck down the Biden administration’s attempt to extend that moratorium, immediately putting renters across the United States back at risk of eviction.
An analysis of Pulse survey data prior to the Supreme Court’s decision by the Williams Institute, a research organization focused on sexual orientation and gender identity issues, finds that ending this moratorium would disproportionately harm LGBTQ+ individuals. This is because 41 percent of LGBTQ+ people, and 47 percent of LGBTQ+ people of color, rent their residences, compared to 25 percent of non-LGBTQ+ people, according to the analysis.
LGBTQ+ individuals’ access to health insurance
A 2014 study by the Center for American Progress finds that between 2013 and 2014, when the Affordable Care Act was implemented, the uninsured rate of LGBTQ+ Americans with incomes below 400 percent the federal poverty rate fell from 34 percent to 26 percent. The uninsured rate for LGBTQ+ people of all income brackets in the United States remains at 12.7 percent in 2021, compared to 11.4 percent for non-LGBTQ+ people.
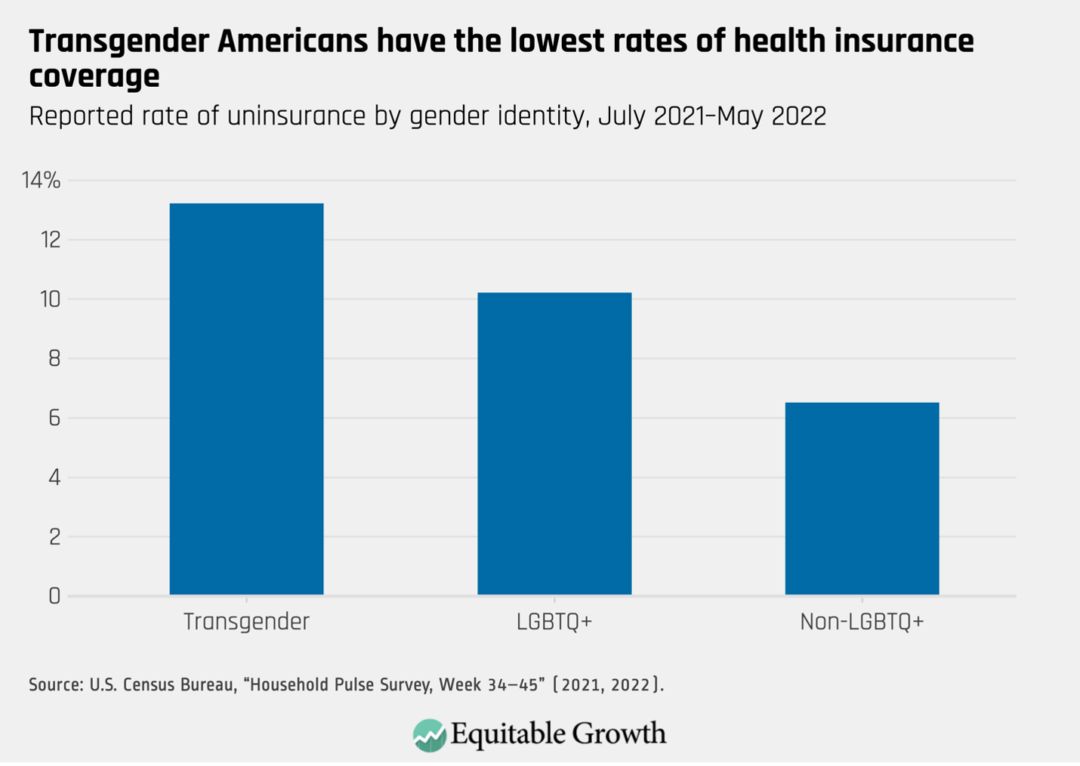
Transgender respondents of the Household Pulse Survey report slightly lower rates of public and private insurance, compared to cisgender respondents, indicating that while there has been much progress in improving coverage for LGBTQ+ individuals in recent years, more efforts are needed to improve transgender healthcare coverage. While some of the noise in the survey data can be attributed to the smaller sample size of transgender respondents, it is indicative of the disparities transgender people face in access to quality healthcare. (See Figure 4.)
Figure 4
Many LGBTQ+ workers have lost their employer-sponsored health insurance along with their jobs amid the ongoing COVID-19 pandemic. The U.S. Bureau of Labor Statistics finds that only 42 percent of private-sector employers who laid off workers during the pandemic paid some or all of their workers’ health insurance premiums. Additionally, only 23 percent of workers in the industries with the largest share of LGBTQ+ workers—such as arts, entertainment and recreation, or accommodations and food services—had employer-paid healthcare coverage, compared to 34 percent of the private sector more broadly.
Having little to no health insurance coverage during a worldwide pandemic can have detrimental effects on an individual’s physical and mental health. The Census Bureau’s own analysis of the Household Pulse Survey finds that LGBT respondents reported twice as high rates of experiencing symptoms of anxiety and depression, compared to non-LGBT respondents.
Policy implications and conclusion
In these initial Household Pulse Survey results, there are significant disparities in economic experiences and hardships between LGBTQ+ individuals and non-LGBTQ+ individuals, as well as within the LGBTQ+ community. These data reinforce the importance of federal data collection in accurately tracking the economic well-being of LGBTQ+ populations in the United States.
There is also widespread evidence that shows how disaggregating data by race and gender paints a clearer picture of the economy and holds policymakers accountable for creating broad-based economic growth. Further disaggregating data along LGBTQ+ lines would similarly benefit researchers and policymakers alike.
Legislation such as the LGBTQI+ Data Inclusion Act, which recently passed in the U.S. House of Representatives, would mandate federal agencies to improve data collection and bolster privacy protections for the LGBTQ+ community. This disaggregated data will help create equitable economic growth for the LGBTQ+ community in the United States by clarifying current economic conditions and allowing policymakers to target support programs more effectively.
Methodology
To collect information about LGBTQ+ respondents, the Census Household Pulse Survey asks three SOGI-related questions:
- What sex were you assigned at birth on your original birth certificate? Choice of answers: Male or Female.
- Do you currently describe yourself as male, female, or transgender? Choice of answers: Male, Female, Transgender or None of these.
- Which of the following best represents how you think of yourself? Choice of answers: Gay or lesbian; Straight, that is not gay or lesbian; Bisexual; Something else; I don’t know.
The U.S. Census Bureau then groups all respondents into three categories: LGBT, Non-LGBT, and Other. Respondents who reported a sex at birth that does not match their current gender identity or those who answered that they are gay/lesbian, bisexual, or transgender were assigned to the LGBT category. Respondents whose birth gender matches their current gender and answered that they are straight were assigned to the Non-LGBT group. And respondents who selected “None of these” on the current gender question and either “Something else,” “I don’t know,” or “Straight” on the sexual orientation question were categorized as Other. Respondents whose sex at birth matches their current gender identity but selected either “Something else” or “I don’t know” on the sexual orientation question were also categorized as Other.
For our analysis, we merged the LGBT and Other groups to make one LGBTQ+ category. We assume that respondents in the Other category identify themselves as queer, pansexual, asexual, or other identities or orientations beyond lesbian, gay, bisexual, or transgender. Merging the two groups thus allows us to create an inclusive LGBTQ+ category that represents all members of the community.


