New measurement for a new economy

This essay is part of Vision 2020: Evidence for a stronger economy, a compilation of 21 essays presenting innovative, evidence-based, and concrete ideas to shape the 2020 policy debate. The authors in the new book include preeminent economists, political scientists, and sociologists who use cutting-edge research methods to answer some of the thorniest economic questions facing policymakers today.
To read more about the Vision 2020 book and download the full collection of essays, click here.
Overview
Measurement is an important component of good economic governance. In the United States, we rely on the federal government’s Census Bureau, the Bureau of Labor Statistics, and the Bureau of Economic Analysis to provide the data that elected officials and economic policymakers use to steer the U.S. economy and that businesses use to make investment decisions.
Many of our most well-known economic indicators were designed and then first collected more than 70 years ago. The most prominent is the National Income and Product Accounts, from which the Bureau of Economic Analysis calculates Gross Domestic Product. But also important is the Current Population Survey, a national, monthly survey of all U.S. households by the Census Bureau, which gives us estimates of the share of the population employed and household income. Then there’s the data provided by employers on employment and earnings to the Bureau of Labor Statistics. Although the U.S. economy has changed significantly over the intervening decades, few new metrics have been added—and none have eclipsed the public salience of these old stalwarts.
Yet our economy has changed markedly in recent decades, which means our existing metrics are not properly accounting for the disruptive influence of economic inequality. New metrics that measure what really matters for American families would focus policymakers on the task of building an equitable economy—one that creates strong, stable, and broad-based growth. Metrics that better capture the well-being of American families would allow everyone to evaluate economic performance and hold elected officials accountable to their promises. As our ideas about what constitutes economic success change, so too must our metrics.
Federal statistics are an absolutely essential component of a policy agenda. To govern in an age of inequality, policymakers need to craft and make use of new metrics that show them and the public how the U.S. economy delivers for all Americans.
How does measurement shape policy?
The metrics that the federal government collects shape the policy options that stakeholders consider and execute. Terms of public debate over economic policy are likewise shaped by the available indicators, and getting the metrics right is imperative. Case-in-point: When the Bureau of Labor Statistics releases data on the prior month’s employment indicators, the data can cause gyrations in stocks and other financial markets.
Common and widely available metrics naturally become targets for decision makers—sometimes with suboptimal results when the metrics aren’t quite right. An oft-repeated example is U.S. News & World Report’s annual Best Colleges rankings. These ratings so dominated the public imagination that colleges became obsessed with improving their ratings. Since the ratings were based on a small set of measurable outcomes—such as graduation rate, class size, and admissions selectivity—colleges quickly found ways to improve their ratings by changing their practices. One college offered financial incentives to freshmen to retake the SAT, raising their incoming class average and their ranking,1 while others hired their own graduates to boost graduate employment metrics.2 Multiple colleges gave falsified data to U.S. News.3 The way we measure outcomes can indeed shape outcomes.
The measurements at the center of national policy debates affect both what policies are discussed and what policies are adopted. GDP growth has assumed a central role in many economic policy debates. Policy debates often center on the idea that growth in GDP is an unalloyed good, worth targeting without regard for other considerations, including how those gains are distributed across the American people. The Tax Cuts and Jobs Act of 2017 was sold on exactly these grounds by its biggest proponents.4
But in order to understand what greater economic growth means for our economy, we need to see it within its relevant context, which is that in our modern economy, growth now tends to almost exclusively benefit the highest income earners in our society. With that bit of context, it becomes difficult to understand why we should be targeting aggregate growth at all. Surely policymakers should instead look at distributional tables that tell us how people in particular income brackets will be affected by the tax, as Equitable Growth advocates.5 Trumpeting the 2017 tax law’s effects on overall growth only serves to obscure what the distributional tables show—these tax cuts will raise the incomes of the wealthiest Americans and will do little for those at the bottom. (See Figure 1.)
Figure 1
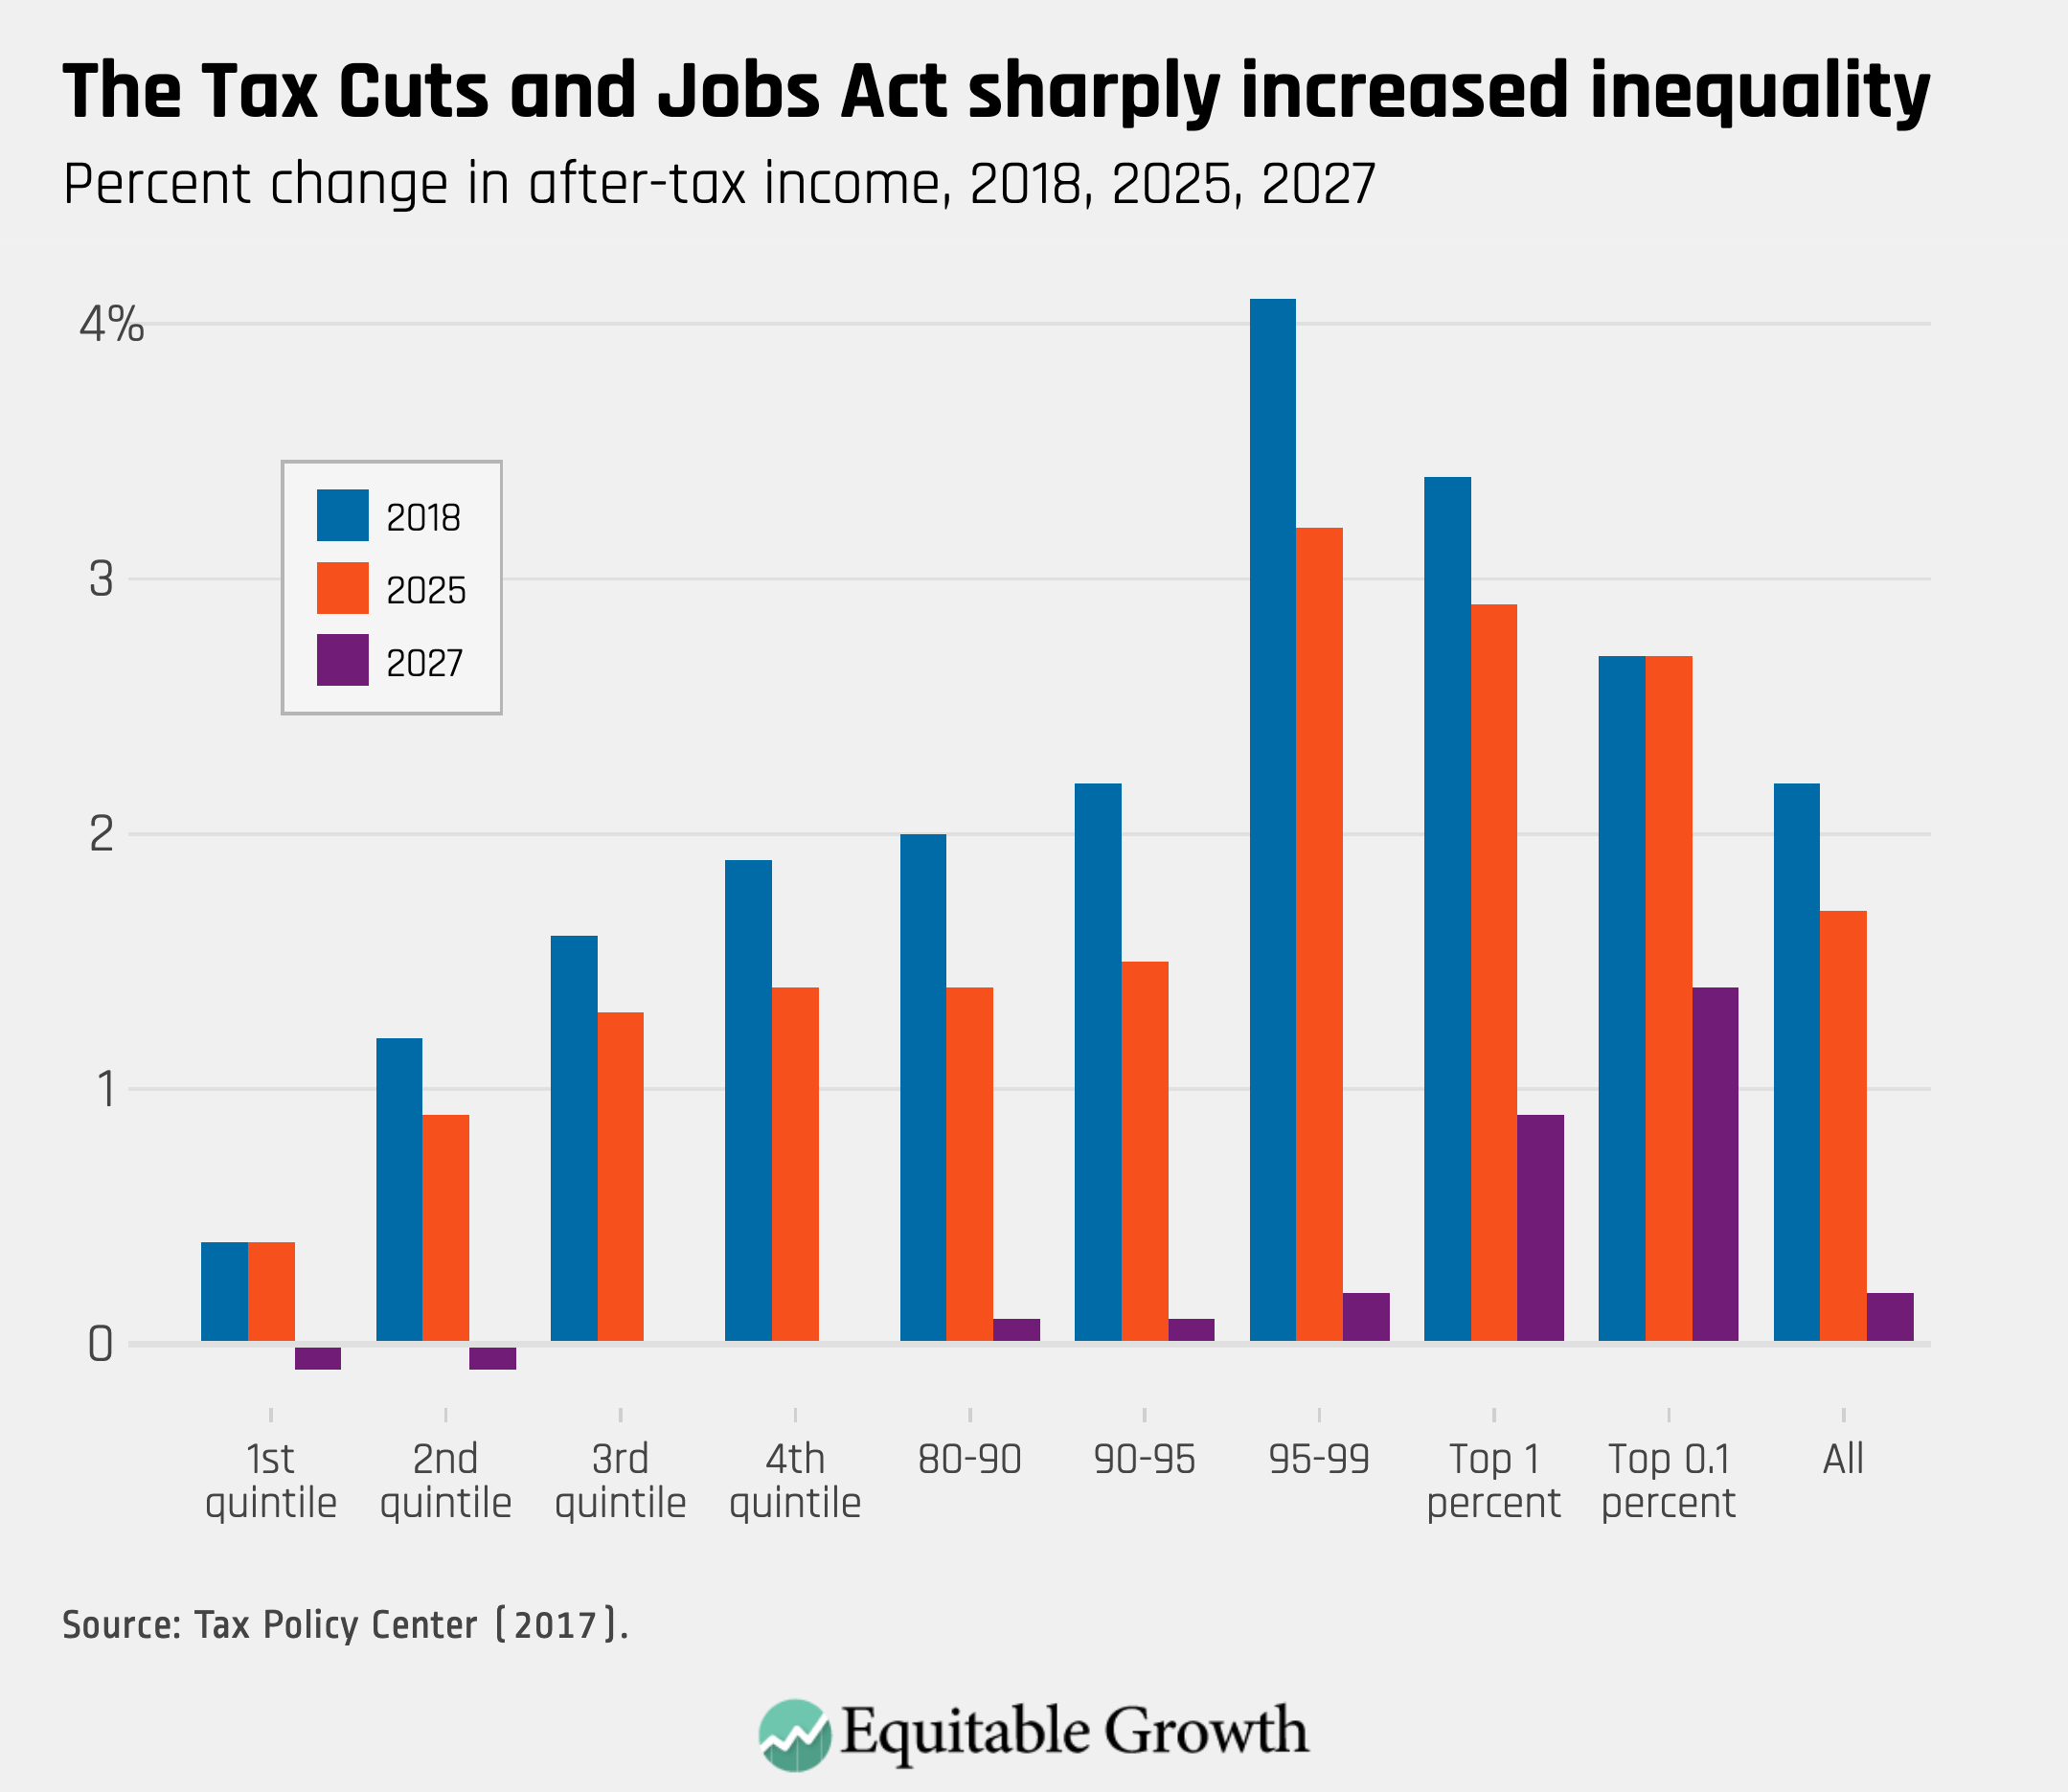
But popular evaluation of the Tax Cuts and Jobs Act tended to present it as a trade-off between equity and growth. Because GDP growth is a highly visible metric of economic progress, whereas distributional tables are one-off evaluations of potential policy by nonofficial sources, the public policy debate gives undue importance to it.
Federal metrics should reflect the complexity of the U.S. economy
Our economy has changed dramatically, and the metrics we had can no longer serve to help us fix the problems of economic inequality. Policymakers cannot continue to pretend that they can rely only on methods developed by economists from 70 years ago, when our economy today looks so different.
Below, I detail two areas where new metrics would help us chart a bold new course for our economy. The first is an issue that academic economists are still puzzling out—the extent to which inflation is now different for the rich and poor and how this fact affects policy choices. The second is a much more mature area of work: GDP 2.0 is a project to add distributional measures of income to our National Income and Product Accounts. It is the subject of current legislation in Congress and one of the most important steps we can take to combat inequality.
Inequality has upended the measurement of inflation
Xavier Jaravel is an assistant professor of economics at the London School of Economics. His research provides an apt example of how gaps in government measurement may already be having an effect on existing economic policy, largely without anyone noticing.
Jaravel uses price-scanner data from retail stores to show that low- and high-income consumers face different rates of inflation.6 On average, he finds that households with incomes of $100,000 or higher faced inflation rates 0.65 percentage points lower than households with incomes of $30,000 or less. (See Figure 2.)
Figure 2
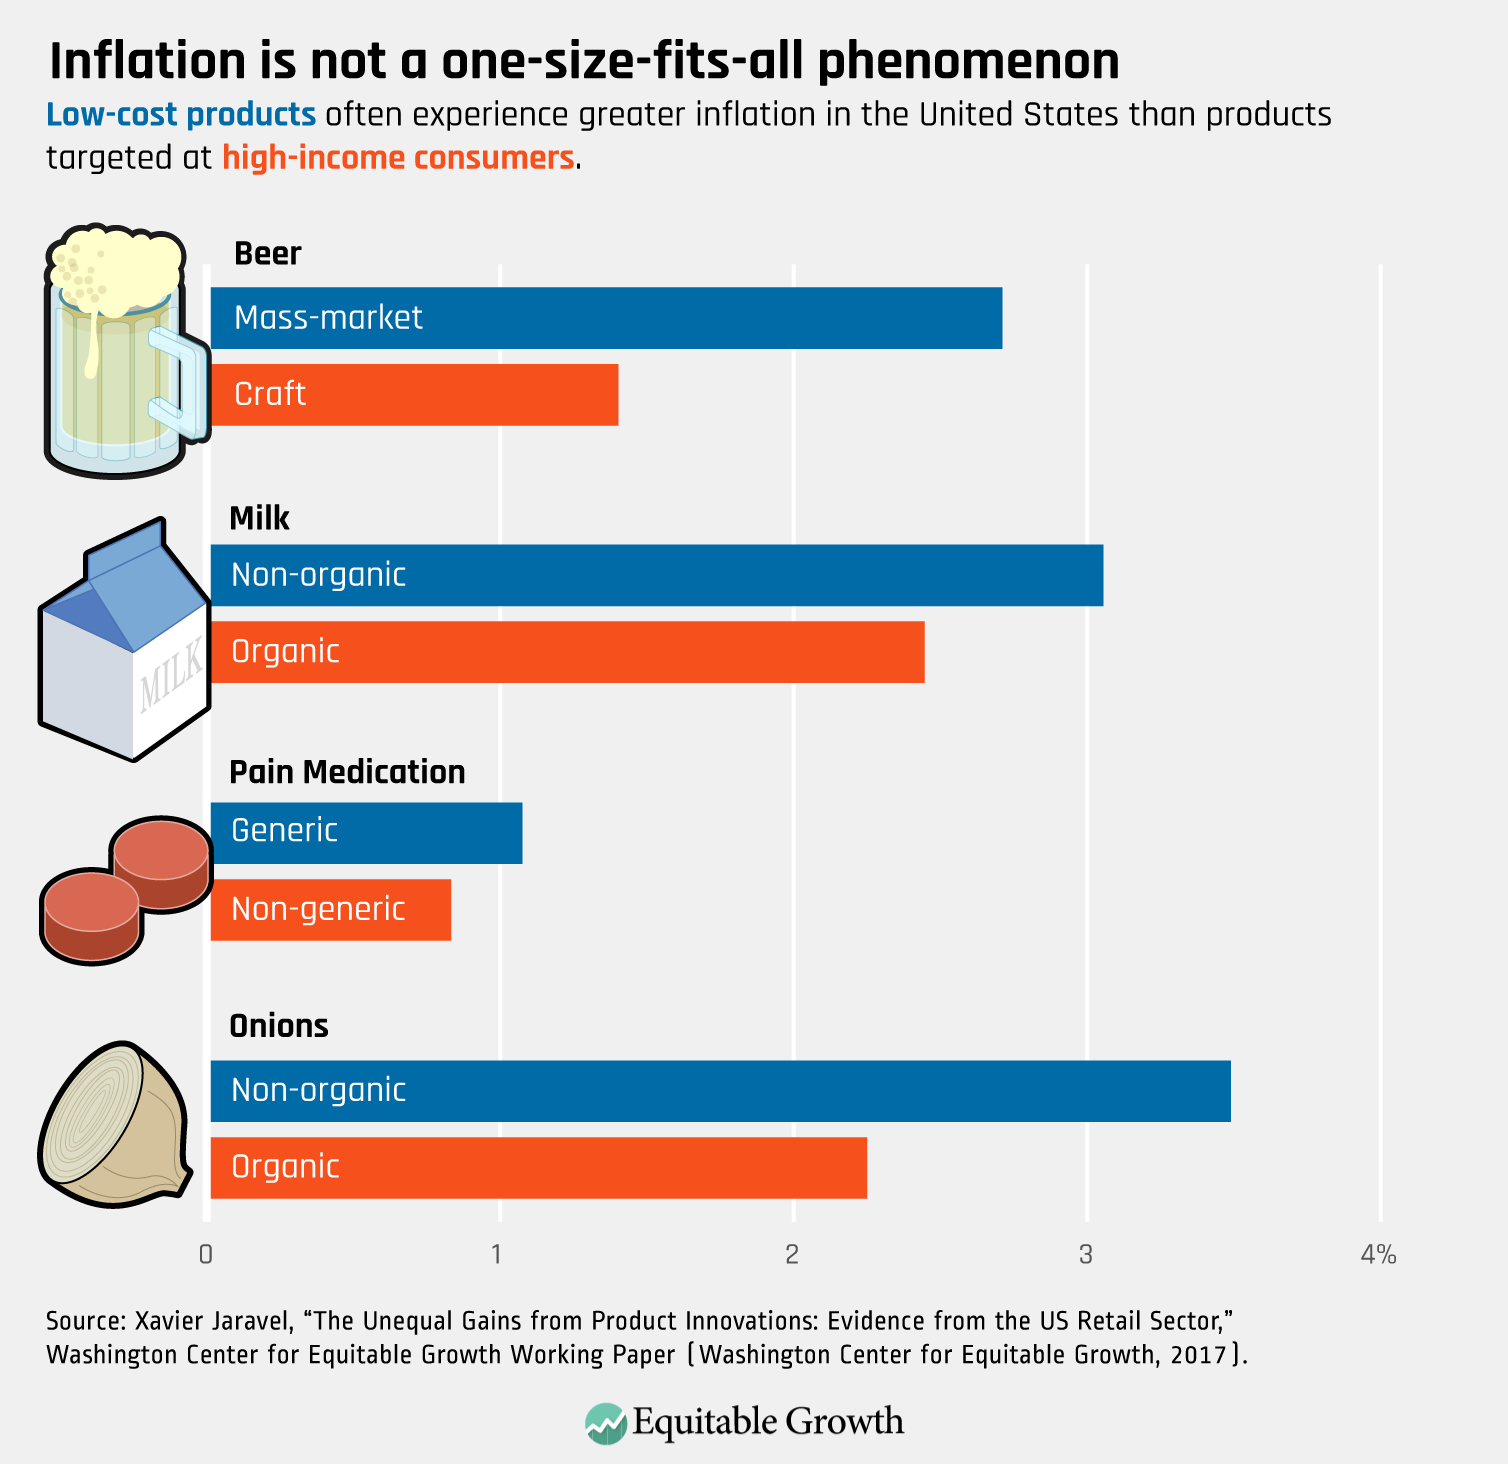
This is a recent phenomenon, driven by the rise of inequality in the U.S. economy. Inequality, Jaravel finds, has driven up demand for goods at the high end of the product market. That, in turn, has led firms to innovate more in high-price goods, and this innovation has introduced competitive pressure into these market segments, keeping prices for these products low relative to prices of low-price goods.
An example is the craft beer market. Craft beers are generally more expensive than their mass-market counterparts. But the proliferation of small craft breweries and the resulting competition has kept inflation in the craft brew segment more than a full percentage point lower than inflation in the mass-market beer segment.
This discrepancy in high-cost and low-cost product inflation rates limits the effectiveness of policy decisions. One case in point is the Supplemental Nutrition Assistance Program, which provides food assistance to low-income households that increases over time with the rate of inflation. Jaravel’s research shows that the headline rate of inflation is understating price increases for the households that this program is meant to serve, which means that benefits are rising slower than the price increases faced by low-income families.
Between 2004 and 2015, Jaravel’s higher inflation rate for low-income households suggests that food prices rose 36 percent, which is almost a third higher than the 25 percent increase in supplemental nutrition assistance benefits based on the headline inflation rate. Families are experiencing a decline in the purchasing power of these benefits, counter to the intent of the policy. This is not the only consequence of unequal inflation rates. Jaravel’s findings may have implications for monetary policy, which typically targets the inflation rate. Economists are only just beginning to explore the consequences.
GDP 2.0: Measuring who prospers when the U.S. economy grows
GDP is the one-number economic indicator that news anchors and policymakers alike love to dissect. Reading quarterly Bureau of Economic Analysis reports on GDP growth is a form of divination that, in popular imagination, tells us whether the economic fortunes of the country are trending up or down. Strong GDP growth is considered evidence of good fortune for all Americans under the presumption that “a rising tide lifts all boats.”
This presumption is mistaken. GDP growth may once have indicated good fortune for the vast majority of Americans, but over the past several decades, many Americans have been left behind by economic expansion. This reality makes GDP a misleading statistic for the opinion leaders and politicians who rely on it. The consequence is that the diagnoses of the U.S. economy and prescriptions for what ails it are based on the wrong metric.
The good news is that we have the data and the statistical know-how to fix the problem. To reflect the true range of how people experience the economy, we can and should produce statistics that show income growth for Americans in different income brackets. These statistics will allow policymakers to evaluate how the U.S. economy is performing for the working class, the middle class, and the affluent.
GDP 2.0 is a policy proposal that will extend existing GDP reports, adding a distributional component so policymakers and the public know not just how much the economy grew overall, but also how much incomes grew for those at the bottom, middle, and top of the income distribution. Each Bureau of Economic Analysis report on GDP should come with measures of growth for income earners up and down the income ladder, including measures of income growth at the very top of the income distribution—the top 1 percent—where the largest gains of the past several decades have been seen.
Who does growth benefit?
This new way of measuring economic growth is needed because the National Income and Product Accounts, of which GDP is just one part, were devised in the 1930s, the result of a concerted effort by many economists to better quantify economic output at that time but wholly inadequate to the needs of today.
These data were first put together in the 1930s to help policymakers understand the Great Depression. The U.S. Department of Commerce commissioned Simon Kuznets, who, at the time, was an economist at the National Bureau of Economic Research and a professor at the University of Pennsylvania, to develop estimates of aggregate national income for the United States. In 1934, he and his team of researchers in New York and at the Commerce Department presented their findings to the U.S. Senate. The report itself is nearly 300 pages long, offering painstaking detail for every line of information published, drawn from an immense number of independent sources and statistical abstracts across every major industry and government agency responsible for their oversight.7
Based on this work, the first U.S. national income statistics were published in 1942. These accounts, specifically developed to help the United States effectively marshal its economic resources to fight in World War II, are what we have used to tabulate GDP ever since. Kuznets would go on to win the third Nobel Memorial Prize in Economic Sciences for this work and his research on economic growth.8
Gross Domestic Product was a tool well-adapted to the economic problems of mid-20th century America. It allowed economic policymakers to understand the vast depth of the Depression and highlighted the need for bold action. Similarly, it served as a guide in World War II, providing some indication of how many planes and boats and tanks we might plausibly manufacture if the full resources of the nation were focused on the task.
These are important questions, but now there are other ones that the nation needs answered. In an era where inequality has swelled to levels approaching those last seen nearly a century ago, elected officials need to know who is prospering from economic progress so they can manage the economy for broad-based growth that benefits all Americans. This need is acute now because headline GDP growth has become unmoored from the economic fortunes of many Americans.
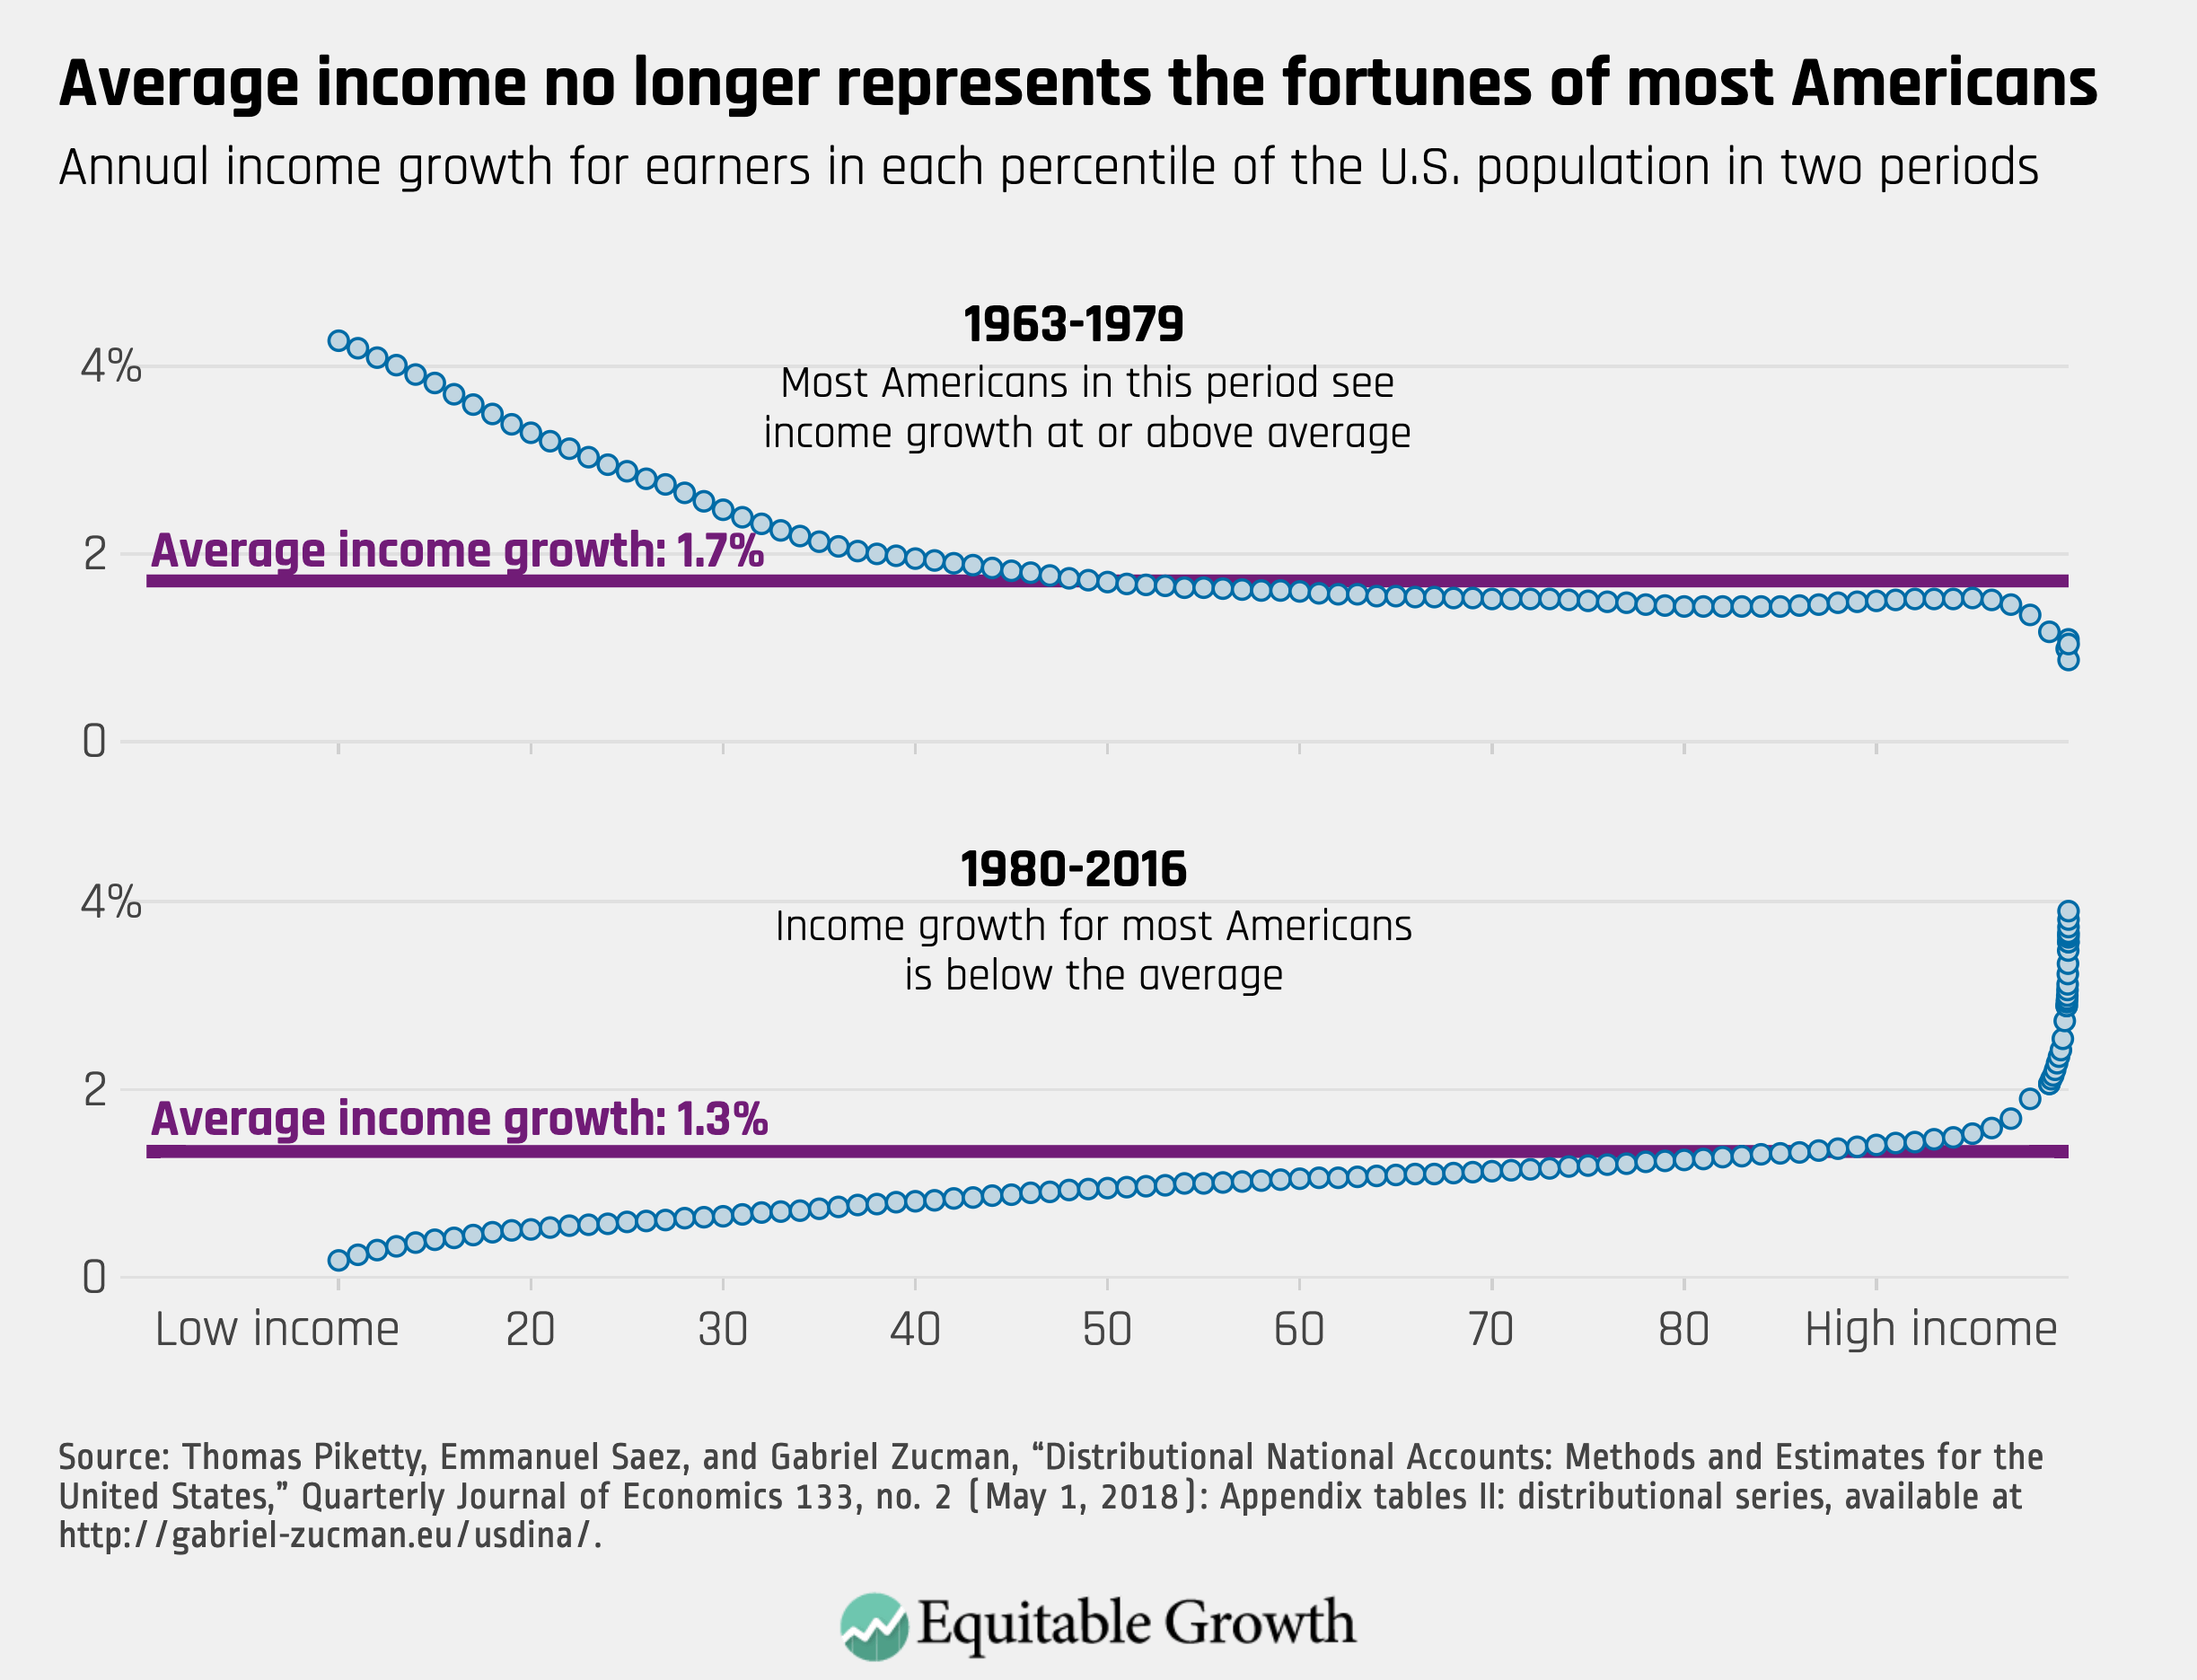
Economic growth was equitably distributed in the United States between 1963 and 1979. Americans at all levels of income saw annual growth that was at or above the level of total GDP growth, unless they were among the very richest, who experienced slower growth than the rest, on average. Starting around 1980, this relationship began to change. In the decades since 1980, the vast majority of Americans have seen growth in their own incomes that is below GDP growth. Over this time period only the most affluent Americans have seen their incomes rise faster than the average. This is a sharp shift in the trends from the decades before. (See Figure 3.)
Figure 3
This divergence between the average and the actual fortunes of families is a problem Kuznets warned about in one of his very first publications on the subject of national accounts. In a section of his report to Congress titled “Uses and Abuses of National Income Measurements,” he noted that, “The welfare of a nation can, therefore, scarcely be inferred from a measurement of national income.”9
This divergence makes GDP increasingly misleading as a guide to public policy: It does little good to target GDP as an outcome if the majority of GDP growth flows to a small group of families, leaving the rest with few gains. Despite this, politicians continue to focus too much on GDP growth, and pundits encourage them. The Trump administration made a campaign issue out of targeting 3 percent growth and sometimes promised to achieve much higher growth, without a simultaneous discussion of who would reap the gains of that growth.10
The pattern of growth shown in Figure 3 has serious downstream consequences. To take just one significant example, Harvard University economist Raj Chetty and his colleagues have demonstrated that absolute intergenerational income mobility has declined precipitously in the United States, and that most of this decline is due to rising income inequality.11
Chetty finds that children in the United States used to have a 90 percent chance of earning more than their parents did, comparing parents at age 30 to their children at age 30. But by 1980, the chances had dropped to just 50 percent. There are two possible explanations: Mobility could have fallen because of lower overall economic growth in later cohorts, or it could have fallen because of unequal patterns of growth. A counterfactual analysis shows that the latter accounts for two-thirds of the change in absolute mobility.
Adding GDP 2.0 to the statistical toolbox
Academic economists have already provided a working prototype of what GDP 2.0 might look like. Thomas Piketty of the Paris School of Economics, and Emmanuel Saez and Gabriel Zucman, both of the University of California, Berkeley, have published a public dataset they call Distributional National Accounts that uses U.S. tax data to distribute income for 55 years, from 1962 to 2016.12
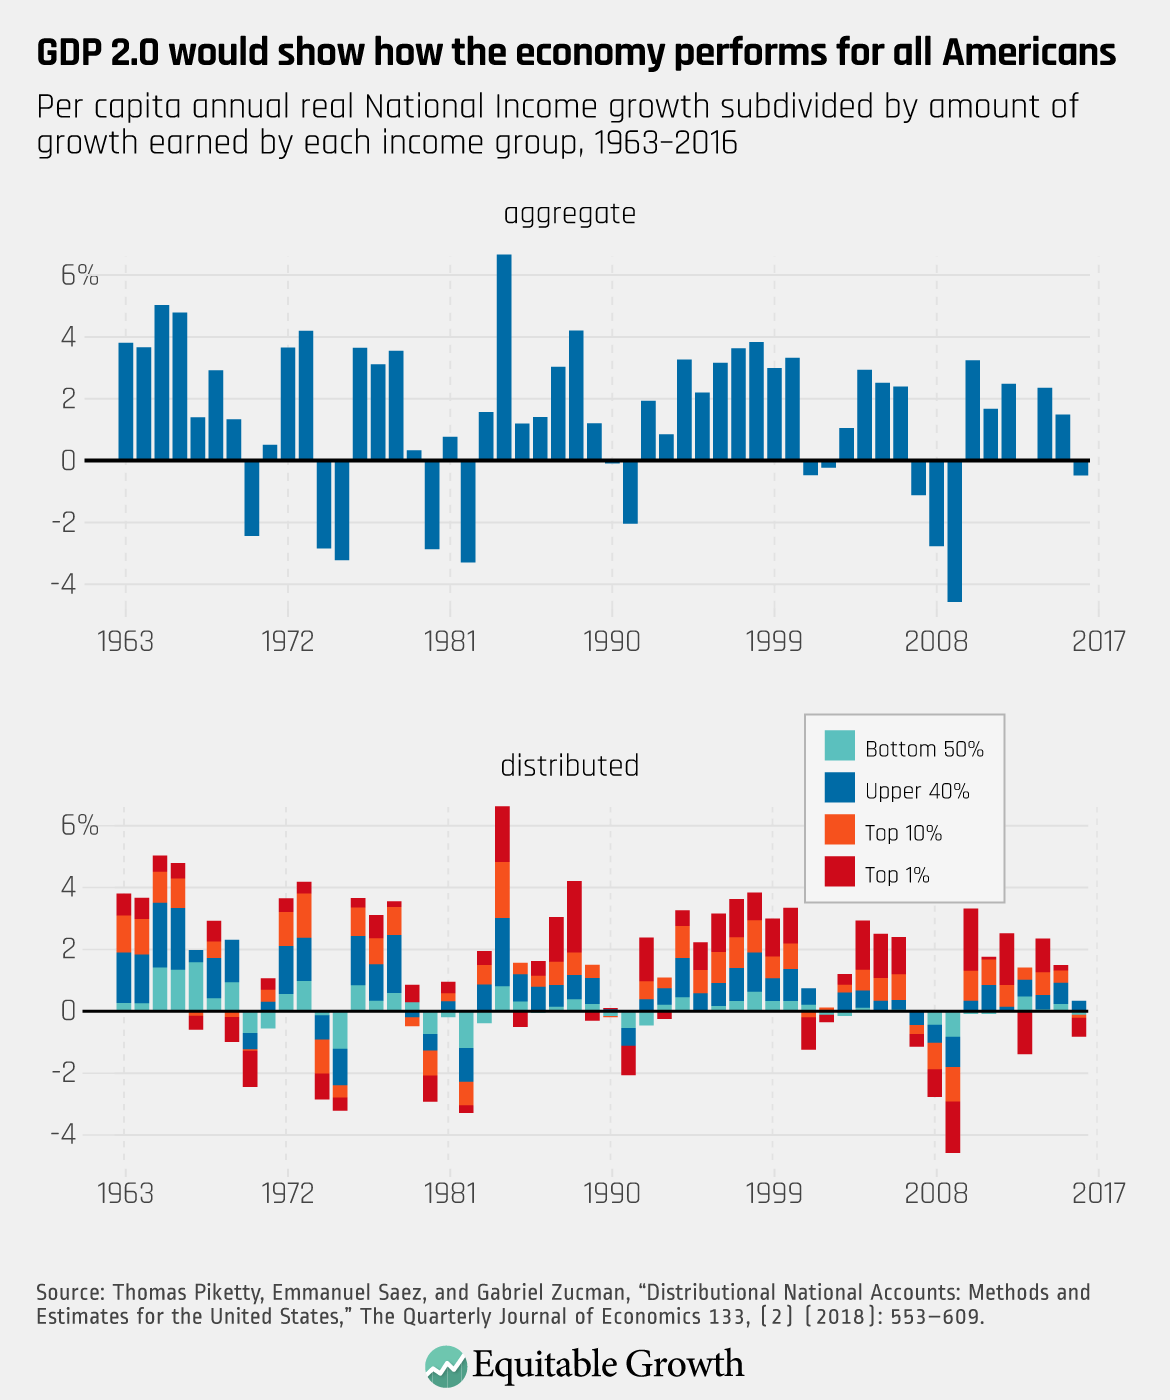
But academic datasets are not a long-term solution for the problem. Government statistics are produced on reliable schedules, using standardized methodologies and the best available data. A distributional measure of growth presented alongside the headline GDP growth number would make the report more meaningful to American families who are not currently well-represented by overall GDP growth. (See Figure 4.)
Figure 4
GDP 2.0: Coming soon
These GDP 2.0 statistics would help facilitate the diagnosis of a real and concerning phenomenon in the economy: increases in inequality that could presage weakness in future consumer spending, indicate falling income mobility, or indicate that the economy is not working for every American.
Creating a distributional component in the National Accounts is well underway at the Bureau of Economic Analysis, thanks to interest from the broader economic community and pressure from Congress. In 2019, for the second Congress in a row, Sens. Charles Schumer (D-NY) and Martin Heinrich (D-NM) and Rep. Carolyn Maloney (D-NY) introduced the Measuring Real Income Growth Act in both chambers.13 The bill, which has garnered 23 cosponsors in the Senate and 22 in the House of Representatives, would direct BEA to produce income growth statistics for Americans in each decile of income to accompany aggregate GDP growth.
This congressional interest has led to a flurry of legislative action. The congressional Joint Economic Committee has held two hearings on the topic, most recently in October 2019.14 In March 2019, the conference report accompanying the Consolidated Appropriations Act for fiscal year 2019 included a clause instructing the Bureau of Economic Analysis to report income growth within deciles of income starting in 2020.15 And in December 2019, the conference report accompanying the Consolidated Appropriations Act for fiscal year 2020 provided the agency appropriations bill for the Department of Commerce for FY2020, House appropriators instructed the agency $1 million to pursue the project.16
Download FileNew measurement for a new economy
Conclusion: For better policy, measure the right things
The metrics we choose should reflect what we value. As the cases of inflation and GDP show, the headline metrics we use for economic evaluation are either missing important features of the 21st century economy or have become misleading because of changes in how the U.S. economy works. If realizing the promise of the American Dream is important, then GDP 2.0 and similar new measures will serve to align our economic policies with our values. Modernizing our economic statistical infrastructure is a way to set new economic goals and guideposts. Without these guideposts, we cannot achieve strong, stable, and broad-based economic growth.
—Heather Boushey is the president and CEO of the Washington Center for Equitable Growth.
End Notes
1. Sara Rimer, “Baylor Rewards Freshmen Who Retake SAT,” The New York Times, October 14, 2008, available at https://www.nytimes.com/2008/10/15/education/15baylor.html.
2. Lauren Kent, “Activists push for law school transparency,” The Daily Tar Heel, October 2, 2014, available at https://www.dailytarheel.com/article/2014/10/many-schools-but-not-unc-fund-jobs-for-graduates.
3. Robert Morse, “Iona College Admits to Inflating Rankings Data for 9 Years,” U.S. News and World Report, December 1, 2011, available at https://www.usnews.com/education/blogs/college-rankings-blog/2011/12/01/iona-college-admits-to-inflating-rankings-data-for-9-years.
4. Daniella Diaz, “Rayn on tax plan: ‘This will increase economic growth,’” CNN, December 20, 2017, available at https://www.cnn.com/2017/12/20/politics/house-speaker-paul-ryan-tax-reaction-morning-shows/index.html.
5. Greg Leiserson, “If U.S. tax reform delivers equitable growth, a distribution table will show it” (Washington: Washington Center for Equitable Growth, 2017), available at https://equitablegrowth.org/if-u-s-tax-reform-delivers-equitable-growth-a-distribution-table-will-show-it/.
6. Xavier Jaravel, “The Unequal Gains from Product Innovations: Evidence from the U.S. Retail Sector,” The Quarterly Journal of Economics (2019).
7. According to the Bureau of Economic Analysis, the U.S. National Income and Product Statistics “were first presented as part of a complete and consistent accounting system in the July 1947 supplement to the Survey of Current Business.” See U.S. Bureau of Economic Analysis and U.S. Department of Commerce, National Income and Product Accounts of the United States, 1929–97, vol. 1 (2001), available at https://fraser.stlouisfed.org/title/181/item/5416; Genevieve Podleski, “Dismal Facts: Measuring the Economy Before GDP,” Inside FRASER blog, October 3, 2017, available at https://insidefraser.stlouisfed.org/2017/10/measuring-the-economy-before-gdp/.
8. Simon Kuznets, “National Income, 1929–1932,” Letter from the Acting Secretary of Commerce transmitting in response to Senate Resolution No. 220, 1934, available at https://fraser.stlouisfed.org/title/971; Diane Coyle, GDP: A Brief but Affectionate History (Princeton: Princeton University Press, 2014), available at https://press.princeton.edu/titles/10183.html.
9. Simon Kuznets, “National Income, 1929-32” (Washington: U.S. Government Printing Office, 1934).
10. John W. Schoen, “Trump defies data with 6% GDP growth forecast,” CNBC, December 6, 2017, available at https://www.cnbc.com/2017/12/06/trump-defies-data-with-6-percent-gdp-growth-forecast.html.
11. Raj Chetty and others, “The Fading American Dream: Trends in Absolute Income Mobility Since 1940,” Science 356 (6336) (2016).
12. Thomas Piketty, Emmanuel Saez, and Gabriel Zucman, “Distributional National Accounts: Methods and Estimates for the United States,” Quarterly Journal of Economics 133 (2) (2018).
13. Measuring Real Income Growth Act of 2019, HR 707. 116 Cong. 1 sess. (2019), available at https://www.congress.gov/bill/116th-congress/house-bill/707; and Measuring Real Income Growth Act of 2019, S.3102. 116 Cong. 1 sess. (2019), available at https://legiscan.com/US/text/SB3102/2019.
14. Joint Economic Committee, “Examining the Rise of American Earnings and Living Standards,” available at https://www.jec.senate.gov/public/index.cfm/2018/9/examining-the-rise-of-american-earnings-and-living-standards. See also JEC, “Hearing: Measuring Economic Inequality in the United States,” available at https://www.jec.senate.gov/public/index.cfm/2019/10/hearing-measuring-economic-inequality-in-the-united-states.
15. Consolidated Appropriations Act, 2019, HJ Res 31. 116 Cong. 1 sess. (2019), available at https://www.congress.gov/bill/116th-congress/house-joint-resolution/31.
16. Commerce, Justice, Science, Agriculture, Rural Development, Food and Drug Administration, Interior, Environment, Military Construction, Veteran Affairs, Transportation, and Housing and Urban Development Appropriations Act, 2020, HR 3055. 116 Cong. 1 sess. (2019), available at https://www.congress.gov/bill/116th-congress/house-bill/3055; Commerce, Justice, Science, and Related Agencies Appropriations Act, 2020, S 2584. 116 Cong. 1 sess. (2019), available at https://www.congress.gov/bill/116th-congress/senate-bill/2584.