Testimony by Heather Boushey before the Joint Economic Committee
Washington Center for Equitable Growth
Testimony before the Joint Economic Committee,
Hearing on “Measuring Economic Inequality in the United States”
October 16, 2019
Thank you, Chairman Lee and Vice Chair Maloney, for inviting me to speak today. It’s an honor to be here.
My name is Heather Boushey and I am President and CEO of the Washington Center for Equitable Growth. We seek to advance evidence-backed ideas and policies that promote strong, stable, and broad-based economic growth.
By any measure, income inequality in the United States has increased significantly over the past 40 years. This increase in inequality has constricted the growth of our economy and had an insidious effect on our political institutions. The topic of today’s hearing speaks to a small but significant step we can take toward more equitable growth.
One of the most important things we can do to fight inequality in the United States right now is to start keeping track of it. Government statistics—Gross Domestic Product growth, inflation, jobs added, wage increases—drive economic policymaking in Congress, the Federal Reserve, and executive agencies. Better measurements of inequality are overdue additions to this list.
To properly contextualize economic growth, policymakers should ask the U.S. Bureau of Economic Analysis, or BEA, to add measures of growth within income quantiles to the National Income and Product Accounts. This is what we at Equitable Growth call “GDP 2.0”—an extension to our existing National Income accounts that updates them to better reflect the realities of our 21st century economy.
I want to thank Vice Chair Maloney and Sen. Heinrich, as well as Senator Schumer, for introducing a bill in 2018 that would do just that and for continuing their efforts in this Congress. The Measuring Real Income Growth Act of 2018 would tell us what growth looks like for low-, middle-, and high-income Americans.
This bill would task the Bureau of Economic Analysis with adding distributional measures of growth to its quarterly National Income and Product Account releases so we could see not just that the economy grew by 2 percent or 3 percent, but also how much it grew for Americans of different incomes.
Publishing this information would have four important effects.
- First, it will connect the idea of aggregate economic data to the real-life circumstances of families in the economy. When members of the working class see politicians touting strong growth but look around and see no evidence of it in their communities, they are right to feel that their economic needs are not being paid attention to.
- Second, by highlighting differences in how the economy is working for different groups of workers, it will focus our attention on the economic well-being of most families.
- Third, distributional measures of growth will guide policymakers in designing policies that both raise output and do it in a way in which everyone gains.
- Finally, these metrics will allow citizens to hold their elected representatives accountable to delivering an economy that works for all.
It is critical to start capturing this data so we can ensure strong, stable, and broad-based economic growth. There is a large—and growing—body of empirical research that shows we cannot create strong or broadly shared economic gains through a policy agenda that presumes growth follows from allowing those at the top to reap the bulk of the gains. The policy agenda we have pursued for decades, driven largely by the desire to maximize GDP growth at any cost, is not delivering for American families and is creating inequities in the economy that actually constrict growth.
In the sections that follow, I will explain why GDP growth became such an important indicator of economic success, how it became a poor proxy for the success of the average American family, and why we need a GDP 2.0 to better capture the full range of economic progress that is experienced by Americans up and down the income ladder. In the final section, I explain how inequality is constricting growth in the economy.
One number for an entire economy
The National Income and Product Accounts were pioneered in the 1930s by the economist Simon Kuznets. At the time, it was a radical new development in economic measurement. It let policymakers see for the first time just how much had been lost in the Great Depression and later helped them understand how the U.S. economy could be harnessed to go to war. For this groundbreaking work, Kuznets won the Nobel Memorial Prize in economics.
The member nations of the Organisation for Economic Co-operation and Development, or OECD, at the time adopted Kuznets’ principals as a general framework and National Accounts became a global phenomenon. GDP, the most prominent measure of aggregate output in the National Accounts, has attained a unique level of authority to the exclusion of other markers of a nation’s development. Because it is standardized across nations and available as a relatively long time series, economists and policymakers alike have latched onto GDP as a way to adjudicate which national economies are best and to conduct inquiries into what makes some economies grow faster than others.
But this was never the intent of Kuznets himself. In a section of his 1934 report to Congress titled “Uses and Abuses of National Income Measurements,” Kuznets noted that, “The welfare of a nation can, therefore, scarcely be inferred from a measurement of national income.”1 This is true for many reasons, but Kuznets was especially concerned with the distribution of resources in society. He understood that high aggregate output was not necessarily indicative of well-being if the underlying distribution of income was highly unequal. To address this concern, he helped compile some of the very first breakdowns of inequality by income quintile. For a short time in the 1950s, BEA regularly produced these statistics, but they were abandoned due to a lack of funding.2
Kuznets’ warnings have been repeated many times in the 85 years since he authored his report to Congress. Robert Kennedy famously echoed Kuznets’ warning when he said that GDP “measures everything … except that which makes life worthwhile.”3
GDP growth has been treated for decades by pundits and policymakers alike as synonymous with prosperity, but this is no longer a useful indicator of well-being. President John F. Kennedy famously alluded to it when he said that “a rising tide lifts all boats.” In the decades since, economists and commentators have used the metaphor of “growing the pie” to indicate that we should first and foremost be concerned with growing the economy rather than concerning ourselves with who gets a slice. But the pie is no longer growing for many Americans because much of the growth of the past four decades has been captured largely by Americans at the top of the income distribution.
Rising inequality means less informative aggregate statistics
Over the period from 1980 to 2016, average growth was about 1.4 percent annually. Yet the bottom 85 percent of all adults saw income growth lower than this. Only those in the top 15 percent experienced better-than-average growth.4 (See Figure 2.)
Figure 2
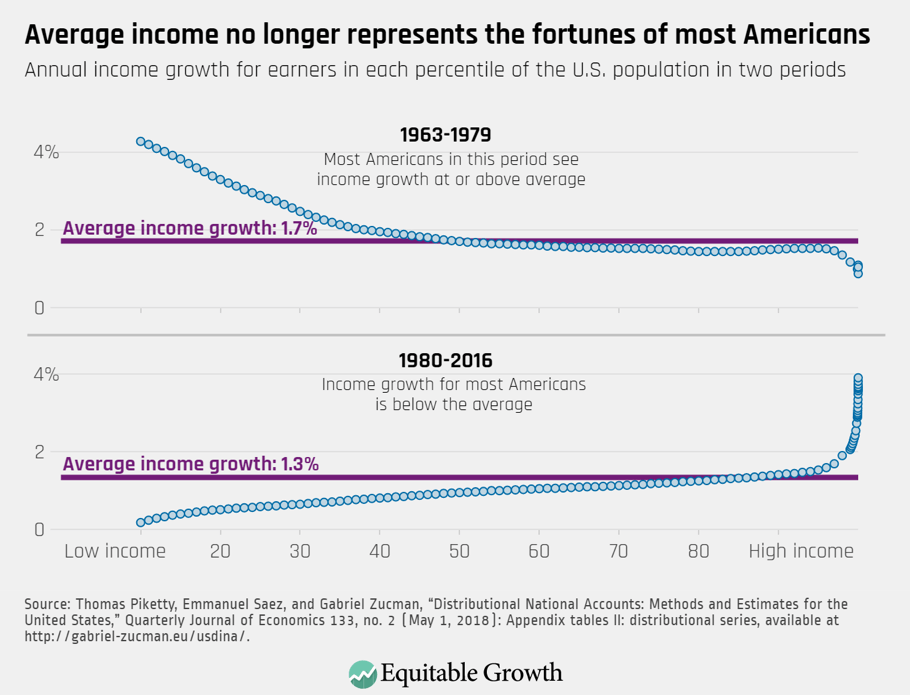
This is a new phenomenon. Prior to this period, there was little need to disaggregate national growth because the headline GDP growth statistic was broadly representative of the economy as experienced by most Americans. Average growth was around 1.7 percent between 1963 and 1979—higher than in the years since. And that growth was broadly shared, as the scatter plots of pretax and post-tax income growth for each percentile of income show in Figure 2. Most Americans saw income growth at or above that average.
Today, GDP growth is decoupled from the fortunes of most Americans. What was once a useful indicator of how most families were faring is now unmoored from the experience of most families. Today’s economy is growing slower than in the past, and much of this growth benefits only those at the very top of the economic ladder. Incomes for the working class and the middle class have grown slowly for decades while incomes at the very top have exploded.
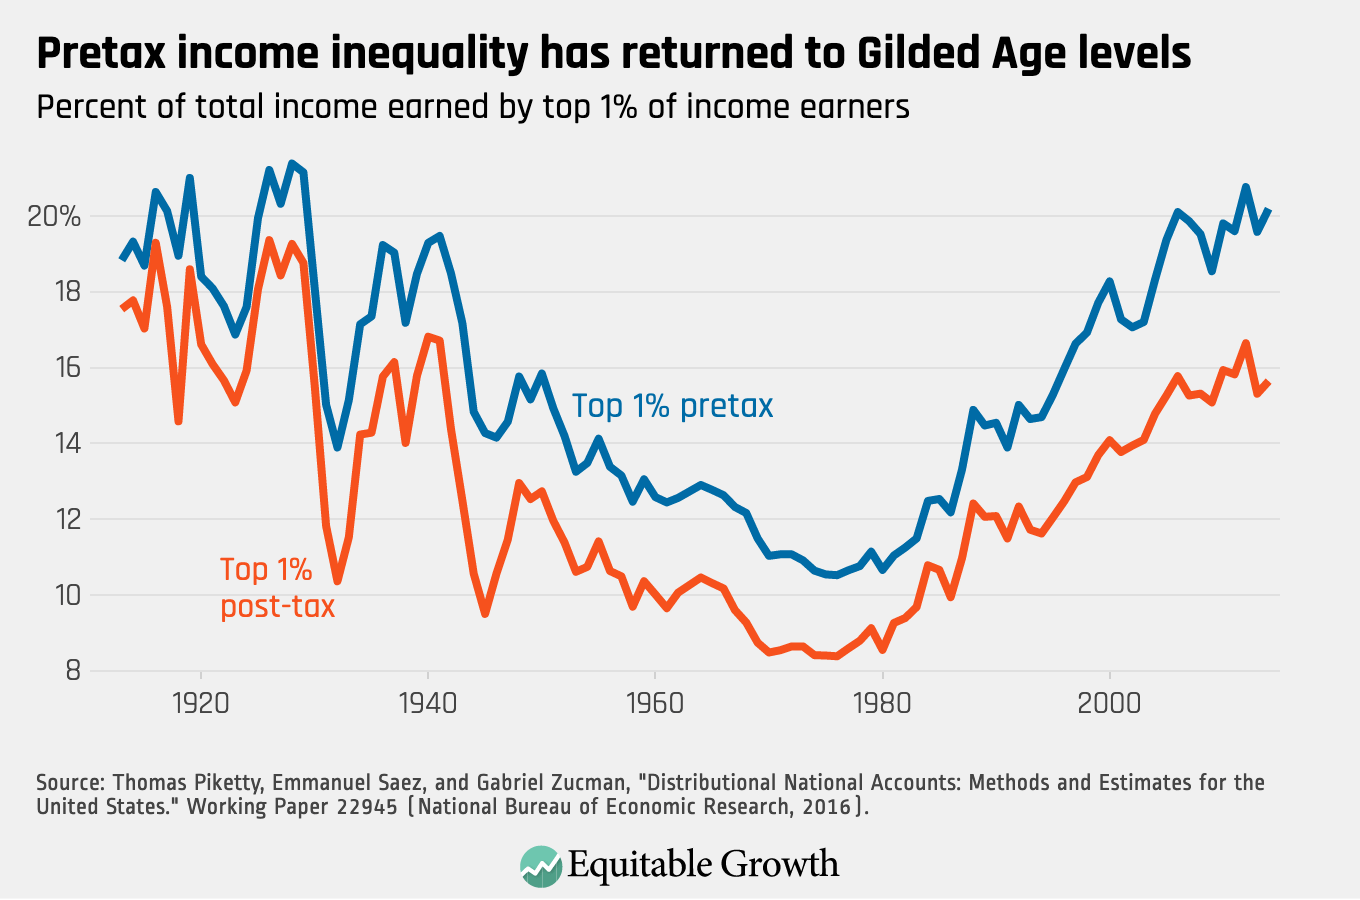
Between 1980 and 2016, the bottom half of Americans by income saw average annual income growth of just 0.6 percent. The richest 10 percent of Americans, by contrast, enjoyed annual income growth of 2 percent, resulting in this group doubling their income over the 35-year period. But even they were left behind by the top 1 percent, who saw their income increase by 162 percent over the same period.5
The result is that the pretax distribution of income has returned to the Gilded Age levels of the 1920s. The story is not quite so dramatic after government taxes and transfers, but by either measure, the share of total national income held by the top 1 percent has nearly doubled since hitting lows in the 1970s. (See Figure 3.)
Figure 3
We see these same divergent trends across multiple measures of economic well-being: wages, income, and wealth. The implication for how we evaluate the economy is that mean economic progress is pulling away from median economic progress. Almost all of our national economic statistics are becoming less representative of the experience of most Americans. Reforming our national statistical infrastructure to account for this reality is long overdue.
GDP 2.0: Measuring what matters
GDP 2.0 refers to adding subpopulation estimates of income growth to our existing National Income and Product Accounts reports. Currently, the Bureau of Economic Analysis releases a new estimate of quarterly or annual GDP growth every month. Distributional national accounts would add to some of these releases an estimate that disaggregates the topline number and tells us what growth was experienced by low-, middle-, and high-income Americans.
Academics have already constructed such a measure. The Distributional National Accounts (or DINA) dataset constructed by economists Thomas Piketty, Emmanuel Saez, and Gabriel Zucman disaggregates National Income growth from 1962 to 2016.6 This dataset gives us a complete picture of how inequality has changed in the United States over time and how recent growth in national output is being shared by Americans. In 2014, for example, total National Income growth was 2.1 percent. According to the DINA dataset, income growth for the lowest-earning 50 percent of all Americans was just 0.4 percent, while growth for the richest 1 percent of Americans was 5.3 percent.
The Bureau of Economic Analysis has begun studying how it could create its own similar dataset and has published preliminary findings for a small number of years in its Survey of Current Business.7
Members of Congress have also realized the importance of constructing these new indicators. In 2018, Sens. Charles Schumer (D-NY) and Martin Heinrich (D-NM) and Rep. Carolyn Maloney (D-NY) introduced the Measuring Real Income Growth Act of 2018 in both chambers. The Senate bill garnered 24 co-sponsors.
This initial legislative action has been followed by a flurry of further congressional interest. In March 2019, the conference report accompanying the Consolidated Appropriations Act of 2019 included a clause instructing Bureau of Economic Analysis to report income growth within deciles of income starting in 2020.8 In their appropriations bill for the Department of Commerce for FY2020, House appropriators instructed the agency to report on its progress toward the FY2019 appropriations language.9 Most recently, Senate appropriators allocated $1 million to the effort.10
It is expected that Bureau of Economic Analysis will publish a prototype set of distributional growth figures in 2020 in accordance with these instructions from Congress.
GDP 2.0 will inform policy
Distributional national accounts will be an important tool for crafting policy in today’s unequal economy. To give one powerful example, distributional national accounts might have allowed policymakers to spot and correct the significant decline in absolute intergenerational income mobility in the United States that occurred over the past 60 years.
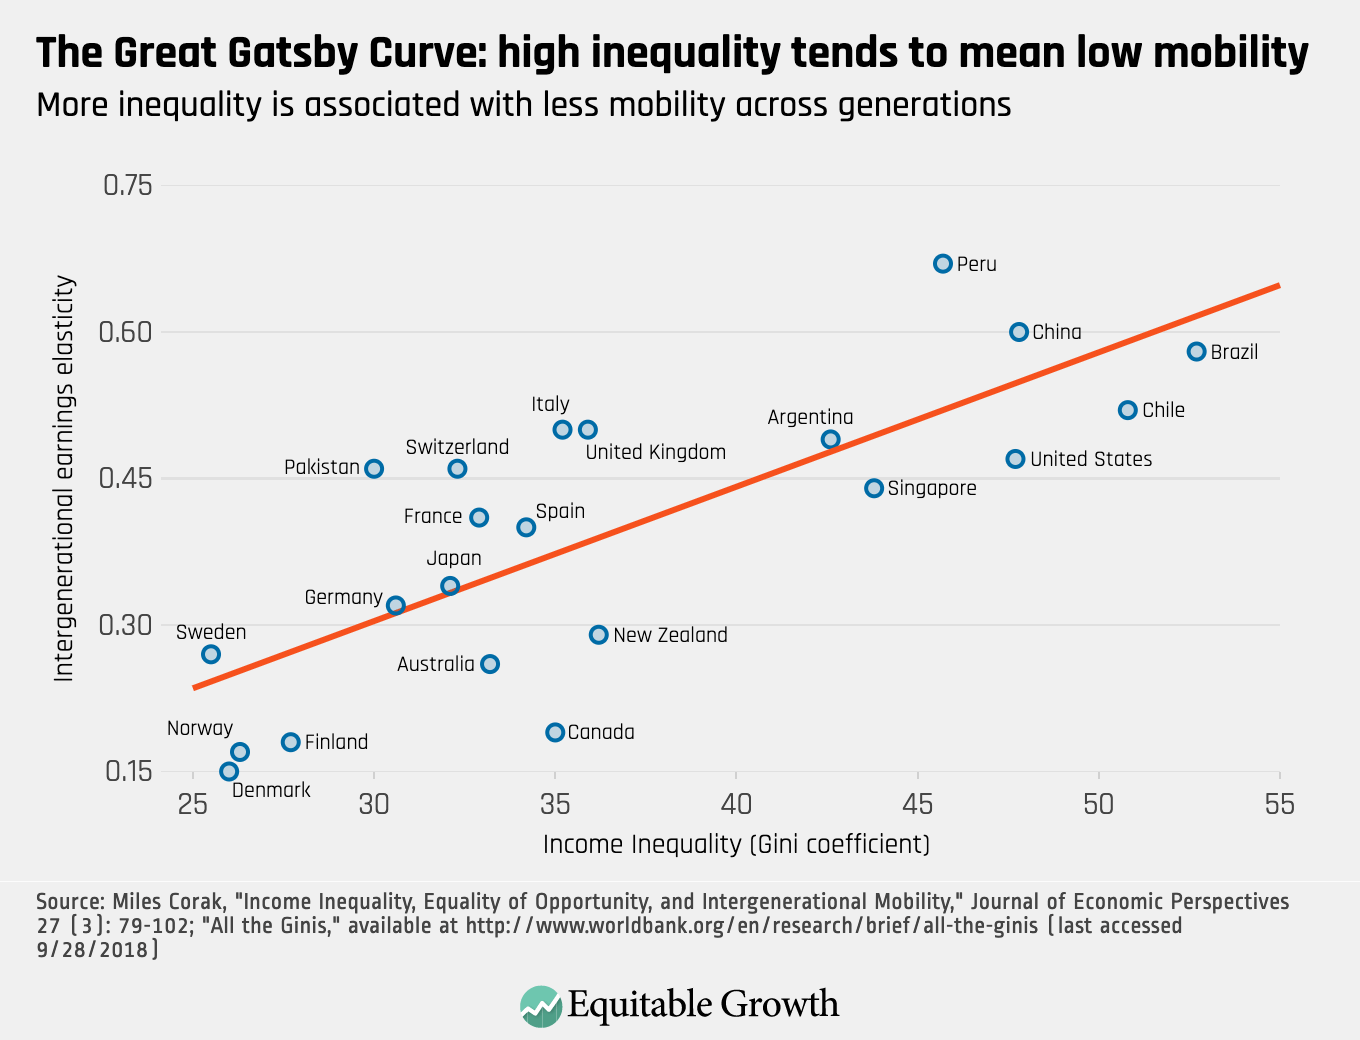
It is intuitively unsurprising that societies with higher inequality are also societies with low economic mobility. Economist Miles Corak created what former Chair of the Council of Economic Advisers Alan Krueger called “The Great Gatsby Curve,” which plots the relationship between inequality and intergenerational mobility across countries. Countries with higher inequality tend to have lower economic mobility. Figure 4 shows one version of this curve.
Figure 4
While critics often suggest that the relationship is not causal, more recent research shows that increasing inequality in the United States has significantly reduced absolute intergenerational mobility. Economist Raj Chetty has shown that children born in 1940—just before the baby boom, when inequality was low and growth was high—had a 90 percent chance of earning more than their parents. In contrast, Generation Xers born in 1980, when income inequality was high and growth was low, have just a 50 percent chance of surpassing their parents’ income.11
More importantly, the evidence shows that even if children born in 1980 had experienced the same higher growth experienced by children born in 1940, this would have closed only about one-third of the mobility gap. But if children born in 1980 had instead faced the same levels of inequality as children in 1940 (even with the lower growth), this would have closed two-thirds of the mobility gap. Figure 5 illustrates rates of absolute mobility by parent income percentile and shows these counterfactuals.
Figure 5
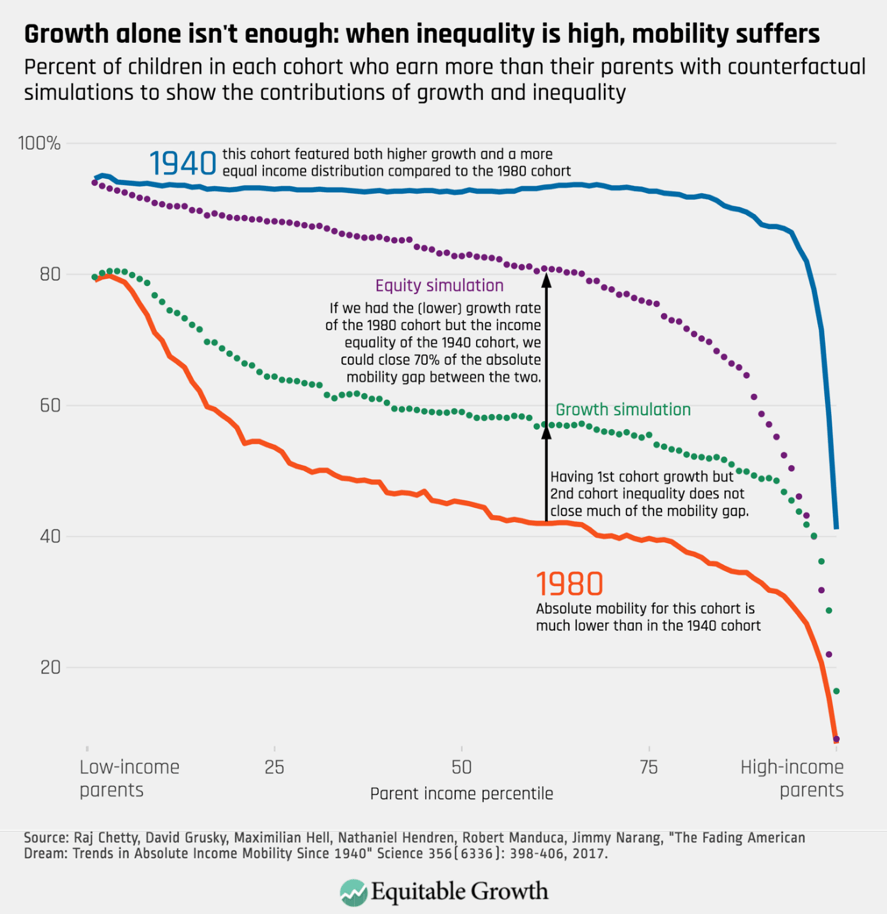
The implication is clear: Growth alone is not enough to produce strong absolute mobility. Distributional national accounts would allow us to track how growth is distributed annually and manage the economy accordingly to increase economic mobility. Notably, to diagnose this problem, it is not enough to know that median household income is stagnant. Understanding how mobility might be changing requires a complete picture of how growth is accruing to families all along the income curve, including at the very top.
GDP 2.0 will help families understand the economy
In addition to helping policymakers craft responses to changes in our economy, GDP 2.0 will also help families across the country understand how economic growth is related to their own personal circumstances. The separation of average growth from the experience of most Americans, as demonstrated above, leaves many feeling alienated when media trumpets high growth that does not reflect their own situation or the situation of those in their communities. GDP 2.0 will help people understand how the economy is working for them.
Equally importantly, when the economy is not working for families up and down the income curve, that information will be widely known and voters will be empowered to hold policymakers accountable if the economy is not performing for all Americans. This link is important, because inequality isn’t simply bad for some families at the bottom of the income distribution. Inequality is bad for the economy itself.
Economic inequality is bad for the economy
The most critical reason we need to measure who is prospering from growth is because the levels of inequality we see now are harming our economy. Inequality constricts growth by:
- Obstructing the supply of people and ideas into our economy and limiting opportunity for those not already at the top, which slows productivity growth over time
- Subverting the institutions that manage the market, making our political system ineffective and our labor markets dysfunctional
- Distorting demand through its effects on consumption and investment, which both drags down and destabilizes short- and long-term growth in economic output
Inequality obstructs the supply of talent, ideas, and capital
The economic circumstances into which children are born affect children’s development in everything from their health to their ability to focus at school to their educational opportunities, and these, in turn, affect their economic outcomes as adults. Research by economists shows the links between factors such as children’s varying birth weights and their different levels of school performance, job-holding, and earnings as adults, relative to others with similar skillsets.
Even when children have access to skills, inequality obstructs their contributing to the economy to the best of their abilities, and these obstructions hinder productivity and growth. Research led by Harvard’s Chetty measured what is more important to earning a patent later in life: scoring high on childhood aptitude tests or parental income. Disturbingly, the richer the family, the more likely the child will be to earn a patent—far outweighing demonstrated intelligence. If a child who shows aptitude early on cannot climb the income and wealth ladder, then there’s something broken in the way our economy works. Inequality has blocked the process and, as result, drags down national productivity by making our workforce less capable than it could be and our economy less innovative.
Inequality subverts the institutions that manage the market
Growing inequality is subverting the public institutions and the policymaking processes we need to support our economy. It discourages a focus on the public interest and promotes the efforts of firms to accrue larger profits than truly competitive markets would allow.
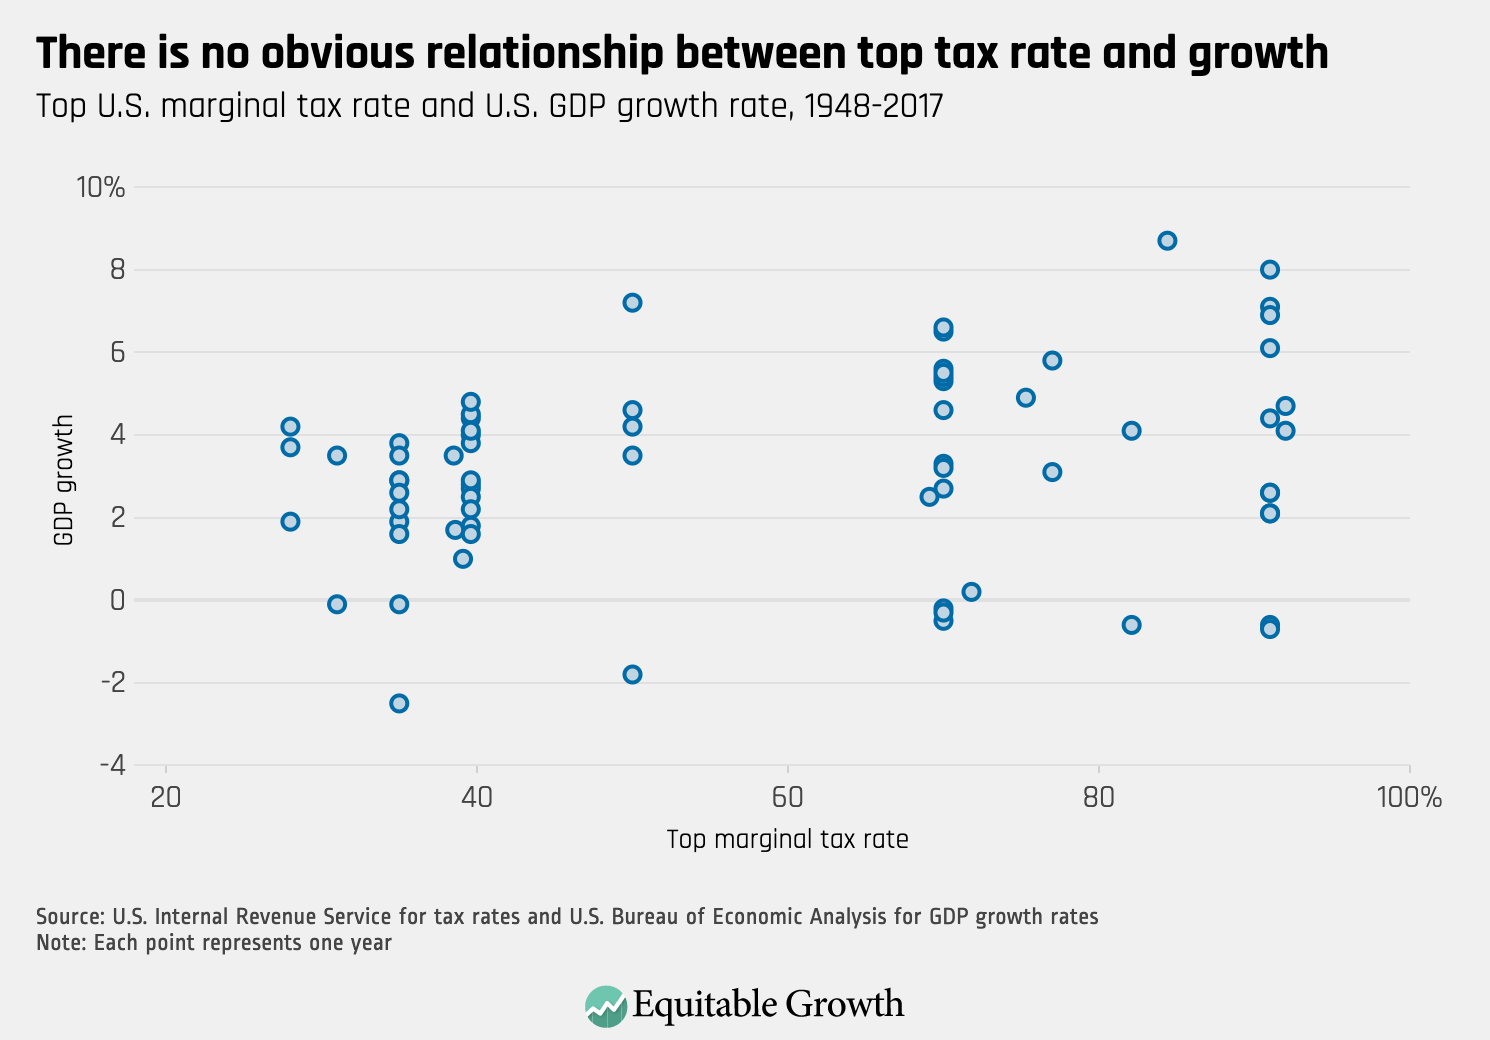
Today, firms are able to manipulate the functioning of the marketplace because economic inequality gives their owners the financial wherewithal to wield political influence. By exerting pressure on political processes, they can minimize the taxes on firms, owners of capital, and top-salaried workers. And they can rewrite laws and regulations in their favor. Research shows that lower taxes on those at the top of the income ladder do not lead to the kinds of beneficial outcomes some economists and policymakers suggest. The evidence is that when the rich pay less in taxes, it encourages them to act in unproductive ways. (See Figure 6.)
Figure 6
When a firm has too much power in its product or services market, it has monopoly power, which means it can raise prices with impunity and stymie competition. Indeed, our economy is increasingly dominated by a few firms in many industries. In healthcare markets, the biggest healthcare companies are increasing their stronghold by merging and then charging higher prices, which, in turn, leads to higher profits for managers and shareholders alongside less affordable—and sometimes lower quality—healthcare for everyone else. It also means lower wages for those working increasingly in what economists call “monopsony labor markets,” where there’s only one or a handful of employers in a given market, giving these firms outsized wage-setting power. What’s happening in healthcare is emblematic of changes across our economy.
By subverting our economy in various ways, inequality undermines confidence that institutions of governance can deliver for the majority. But for the economy to function, the public sector needs to function, and function well. In the 19th and 20th centuries, the U.S. government implemented policies that launched many families into prosperity with a solid financial foundation, including the Homestead Act, the estate tax, universal primary and secondary schools and land grant colleges across the nation, and the GI Bill. These policies weren’t perfect and were discriminatory in multiple ways, but they showed that the federal government could embark on big agendas to reduce inequality. Today, however, inequality in wealth and power is thwarting the government from taking on collective endeavors that provide the foundation for broad-based economic growth while promoting the interests of monopolists and oligopolists over others.
Inequality distorts both consumption and investment
Inequality distorts everyday decision-making by consumers and businesses. These outcomes are evident at the macroeconomic level. People’s spending drives business investment, as consumers account for nearly 70 cents of every dollar spent in the United States. But for the past several decades, U.S. families in the bottom half of the income distribution have seen no income gains, and the gains for those families not among the top 10 percent of income earners have been meager. This means that if firms were to invest more, they may not be able to sell additional goods and services because consumers might not be in positions to buy them.
Many businesses, eyeing demand, have understandably not invested much over this period. U.S. firms are sitting on record-high piles of cash, which have been steadily accumulating since the 1980s.12 Others have found customers willing to purchase their wares, but only because of the financially unstable expansion of household debt—as seen especially in the run-up to the Great Recession in the middle of the past decade, and as is occurring again today.13 Growing economic inequality thus destabilizes spending because everyday consumers either don’t have enough money to spend or are borrowing beyond their means to buy what they need.
Inequality is even driving changes in what firms are producing, with a number of economic implications for innovation and even inflation. Xavier Jaravel at the London School of Economics finds that businesses are investing in new products targeted at high-end consumers while developing fewer products for those in the lower end of the market. For those at the low end, there’s less competition for their business, which means lower productivity, lower innovation, and higher prices and inflation. This shows up in the data: Jaravel found that between 2004 and 2013, families with incomes greater than $100,000 per year saw yearly prices rise by 0.65 percent less than for families earning below $30,000 in the respective bundles of goods that those families bought.
With consumption dragged down by flagging middle-class incomes, too much money in the hands of those at the top, and investors sitting on the sidelines, conditions are ripe for an increase in the supply of credit. The deregulation of the financial sector over the past 40 years has made it easier to lend to U.S. households—in no small part due to the influence of the financial services industry. Empirical research and the U.S. experience over the past several decades show the consequences of these distortions and how credit-driven economic growth both increases economic instability and leads to lost economic opportunity.
Conclusion: Measure who prospers when the economy grows
Simon Kuznets knew that tracking GDP growth was not the endpoint for his National Income and Product Accounts. Much more needed to be done to ensure that the National Accounts were not just accounting tables but also could, in fact, say something meaningful about the well-being of American families. But despite some early progress toward adding a distributional component to the accounts in the 1950s, little changed over the next seven decades. It is time to fulfill this promise. Implementing GDP 2.0 will change our economic narrative and focus us on achieving broad-based growth. A new commitment to fighting inequality will, in turn, yield dividends for our economy.
View a recording of the testimony below:
End Notes
1. Simon Kuznets, “National Income, 1929-32” (Washington: U.S. Government Printing Office, 1934).
2. Dennis J. Fixler and others, “A Consistent Data Series to Evaluate Growth and Inequality in the National Accounts,” Review of Income in Wealth (63) (2017).
3. Robert F. Kennedy, “Remarks at the University of Kansas, March 18, 1968,” available at https://www.jfklibrary.org/Research/Research-Aids/Ready-Reference/RFK-Speeches/Remarks-of-Robert-F-Kennedy-at-the-University-of-Kansas-March-18-1968.aspx.
4. Thomas Piketty, Emmanuel Saez, and Gabriel Zucman, “Distributional National Accounts: Methods and Estimates for the United States,” Quarterly Journal of Economics 133 (2) (2018).
5. Ibid.
6. Ibid.
7. Dennis J. Fixler and others, “Toward National and Regional Distributions of Personal Income,” Survey of Current Business (97) (2017).
8. Consolidated Appropriations Act, H.J. Res.31, 116 Cong. (2019), available at https://www.congress.gov/bill/116th-congress/house-joint-resolution/31.
9. Making Further Continuing Appropriations For The Department Of Homeland Security For Fiscal Year 2019, and For Other Purposes, H. Rept. 116-9, 116 Cong. 1 sess (2019), available at https://www.congress.gov/congressional-report/116th-congress/house-report/9/1?overview=closed.
10. Commerce, Justice, Science, Agriculture, Rural Development, Food and Drug Administration, Interior, Environment, Military Construction, Veterans Affairs, Transportation, and Housing and Urban Development Appropriations Act, 2020, H.R.3055, 116 Cong. (2019), available at https://www.congress.gov/bill/116th-congress/house-bill/3055.
11. Raj Chetty and others, “The Fading American Dream: Trends in Absolute Income Mobility Since 1940,” Science 356 (2017): 398–406.
12. Moody’s Investors Service, Inc., “US Corporate Cash Pile Grows to $1.84 Trillion, Led by Tech Sector,” Moodys.com, July 19, 2017, available at https://www.moodys.com/research/Moodys-US-corporate-cash-pile-grows-to-184-trillion-led–PR_369922.
13. Federal Reserve Bank of New York, “Quarterly Report on Household Debt and Credit 2019:Q2” (New York: Federal Reserve Bank of New York, 2018), available at https://www.newyorkfed.org/medialibrary/interactives/householdcredit/data/pdf/HHDC_2019Q2.pdf.