Why current definitions of family income are misleading, and why this matters for measures of inequality

What is “equitable growth” and how do we measure it? The following essay, part of a series, asks economists, other researchers, and practitioners to explore these questions. Equitable growth means an economy that raises living standards for all families. We have seen decades of economic growth in the U.S.—commonly measured by GDP. Yet that success has not meant significant income growth for most American families. Clearly GDP doesn’t provide the full picture. How do we know we’re on the right track? There is little consensus around what specific of indicators are required to quantify whether the economy is growing on behalf of all Americans. Is it a matter of looking at different already existing measures? Should new data using existing concepts of income and well-being be created? Do our concepts of what’s important to measure need updating as well? A better understanding of equitable growth—and how to measure it—can improve our understanding, inform decisions and lead to better outcomes for all.

Researchers studying income distribution in the United States seem reluctant to acknowledge the family as an important unit of production and distribution. As a result, they often rely on statistics that provide a misleading picture of inequalities based on class, race or ethnicity, and especially gender.

Incomplete definitions of both family and income either obscure or render invisible transfers between and within households, including the value of housework and family care. Evidence from specialized surveys—such as the Health and Retirement Survey, the Panel Survey of Income Dynamics, the Survey of Income and Program Participation, and the American Time Use Survey—clearly demonstrate the quantitative relevance of these omissions.

Conventional measures

What, exactly, do economists mean by income, and what, exactly, is the presumed income-receiving unit? Usually, income refers to direct market income (labor earnings plus income from capital such as interest or dividends, and including, where feasible, indirect market income such as the dollar value of transfers from private pensions or government).

Many shortcomings of this measure are widely recognized. For instance, conventional estimates do not include any valuation of the flow of implicit service income from capital assets such as housing or the increase in wealth due to capital gains appreciation.1 Sources of income that take the form of in-kind benefits and/or tax expenditures such as the Earned Income Tax Credit are seldom included. These problems, however, have received more attention than those related to largely unmeasured aspects of the family economy.

Most individuals in the United States pool at least some of their income with other family members over a significant portion of their lifecycles. As a result, family income is a better indicator of material living standards than individual earnings. Family-based measures are especially relevant to the economic welfare of children, the elderly, and individuals who are sick or disabled, as well as those supporting or providing direct care for such dependents.

Many unrelated individuals live together in households without pooling income, but benefit from household public goods and economies of scale in household production. That’s why it is difficult to measure the extent to which individuals pool their income and what share of family or household income should be imputed to them. While it is often assumed that married couples equally share their market income, empirical research suggests that is not always the case. 2 The proliferation of informal partnerships such as cohabitation further complicate the story. 3

Intrafamily transfers of money and time—mediated by the public-good aspects of household consumption and economies of scale in household production—potentially affect both the size and the distribution of individual income. For instance, improvements in women’s earnings relative to those of men may be counterbalanced by a decline in intrahousehold or intrafamily transfers related to nonmarriage, loss of household economies of scale, or increases in the percentage of children maintained by women alone. 4

Defining the family in family income

Seeking a practical solution to a complex problem, the U.S. Census Bureau enforces a clear distinction between family and household. Specifically:

A family consists of two or more people (one of whom is the householder) related by birth, marriage, or adoption residing in the same housing unit. A household consists of all people who occupy a housing unit regardless of relationship. A household may consist of a person living alone or multiple unrelated individuals or families living together. 5

Note, however, that the definition of family provided here is limited to family members living in the same household. In this sense, it represents a truncated and, in some respects, misleading definition. While the U.S. Current Population Survey asks some questions relating to intrahousehold family transfers, these are largely been considered a private matter, except where they represent a traditional obligation rendered visible by child support agreements.

By contrast, the Health and Retirement Survey asks respondents to report financial help, defined as:

Giving money, helping pay bills, or covering specific types of costs such as those for medical care OR insurance, schooling, down payment for a home, rent, etc. The financial help can be considered support, a gift or a loan.

This is a much broader definition of intrafamily transfers than that in the Current Population Survey, and a recent empirical analysis of the Health and Retirement Survey finds that households with an adult between the ages of 50 and 64 transferred an average of $8,350 to family members over a two-year period between 2008 and 2010. Both the probability and the size of these transfers were positively correlated with income, and the overall likelihood of such transfers increased substantially between 1998 and 2010. 6 In other words, relatively affluent adults approaching retirement age have provided an increasingly significant economic boost to their adult children, which is not factored into conventional family-income calculations.

This analysis of the Health and Retirement Survey does not break out transfers by race or ethnicity, but other research utilizing data from the 2005 and 2007 Panel Study of Income Dynamics, as well as the Survey of Consumer Finance, shows that middle- and upper-income African Americans are more likely to provide informal financial assistance than whites with similar characteristics. 7 Not surprisingly, black families are more likely to have needy family members and friends—what might be termed a negative network effect. This difference can account for a significant portion of the racial gap in wealth.

Overall, such transfers may have an equalizing effect because they generally flow from those with more market income to those with less. But young white adults are more likely to receive transfers from relatively affluent parents, while young black adults are more likely to transfer income to those closer to the bottom of distribution.

Equivalence scales and intrafamily transfers

Comparisons of family income are often unadjusted for family household composition or are adjusted on a per-capita basis, simply divided by the number of household members. Both approaches are misleading. A family of two is much better off with an income of $50,000 than a family of six. In contrast, a family of six does not need three times as much income to be as well off as a family of two, even though it has three times as many members.

For this reason, family income is often adjusted by an equivalence scale that assigns a different weight to children and adults, and takes economies of scale into account. The U.S. poverty line and benchmarks based upon it—such as the 200 percent of the poverty line—represents an implicit equivalence scale. Another common measure divides family income by the square root of family size. 8 Such scales represent an approximation of what might be termed an intrafamily transfer. 9

Virtually all conventional equivalence scales assume that children are less costly than adults because the cost of feeding and clothing them is lower. 10 Further, virtually all applications of equivalence scales to family income in the United States apply the same scales at every point in time. Since the mid-1960s, however, children have become more costly relative to adults, and family budgets have shifted away from food and clothing toward services such as childcare and education.

A major factor behind increased childcare costs is the significant increase in the labor-force participation of mothers between 1975 and the mid-1990s. Another is the steady climb in the percentage of children living in families maintained by a mother alone, since mothers are required to engage in paid employment in order to even qualify for public assistance.

While longitudinal data are scarce, a recent Census Bureau report based on the Survey of Income and Program Participation estimates that overall expenditures on childcare doubled between 1985 and 2011, from $84 to $143 per week in constant dollars. In the most recent year, families with incomes below the federal poverty line spent about 30 percent of their income on childcare, compared to 8 percent for families not in poverty. 11

Parental spending on higher education has also increased, the combined result of increasing college enrollments (despite relatively stagnant graduation rates) and significant increases in tuition and fees, particularly over the past 15 years. 12 Research also shows that home buyers and renters pay a significant premium for houses in high-quality school districts, indirectly increasing the cost of children. 13

These factors have important implications for considering the distribution of adjusted family income today. Whites in general are less likely than African Americans or Hispanics to live in households with children, and college-educated women are significantly less likely than other women to become single parents. Current equivalence scales significantly understate the economic significance of these demographic differences. Yet many dual-earner families with children sit squarely in the middle of the (conventionally measured) family-income distribution.

In current economic parlance, disposable income is typically defined as income after taxes. One could conceptualize “adult disposable income” as the net of taxes and benefits and transfers to children and other dependents. Instead, current assumptions treat spending on children or other needy family members merely as another form of consumption, no different than spending on restaurant meals or automobiles.

The value of nonmarket work

Housework and family care are now widely recognized as forms of work that yield economic benefits. Recent data from the American Time Use Survey show that productive activities that someone else could, in principle, be paid to perform constitute roughly half of all time devoted to work in the United States. 14

A number of studies impute a market value to this work on the aggregate level, simply multiplying the number of hours by an estimate of quality-adjusted replacement cost. This exercise suggests that the contribution of nonmarket work to an expanded definition of Gross Domestic Product in the United States lies somewhere between 30 percent and 40 percent. 15 Yet, with a few notable exceptions, the value of nonmarket work is largely ignored in estimates of family income on the microeconomic level. 16

Consider two family households of identical composition consisting of two adults and two children under the age of 5, both with a family income of $50,000 (ignoring both taxes and benefits, for the sake of simplicity). Conventional measures would place both of these families at exactly the same place in the distribution of income. But what if the first family includes two wage-earners, both working 40 hours per week and earning $25,000 per year, and the second family includes one wage-earner, working 40 hours per week and earning $50,000 per year, along with one stay-at-home parent who prepares meals, does shopping, and provides childcare.

Surely the second family is significantly better off than the first, if only because it does not incur the childcare costs alluded to in the section above.

What effect does imputation of the value of nonmarket work have on estimates of the distribution of family income in the United States? Empirical work today suggests that it has an equalizing effect in the cross-section, not because low-income families devote more time to it, on average, but because any imputation of the value of that work represents a larger percentage of their market income. 17

The implications for trends over time are quite different. The equalizing effect of valuing nonmarket work was almost certainly greater in the 1960s, when a relatively large percentage of married women were full-time homemakers. As women entered wage employment and substituted market employment for at least some of their nonmarket work, this equalizing effect diminished. Inequality in women’s earnings is also far greater today than it was in the 1960s, with high-earning women likely to marry high-earning men. 18

Whatever the gender implications of the traditional breadwinner/homemaker family, it may well have mitigated some aspects of class inequality among whites (it was never widespread among blacks). But most studies of the impact of women’s increased labor-force participation on income inequality completely ignore the value of nonmarket work, essentially assigning homemakers a contribution of “zero” in their empirical analysis. 19

Implications

Changes in the family economy of the United States have probably had only small effects on the relative income of the top 1 percent or the top 5 percent. They have larger implications for both the reality and the perception of relative income among households with divergent patterns of female labor-force participation and family responsibility.

Many public benefits in the United States—from the Supplemental Nutrition Assistance Program to financial aid for college—are conditioned on conventional measures of family income. Because these measures provide an incomplete and misleading picture of relative well-being of families, reliance on them may breed frustration and resentment. 20

Many of the policy proposals emerging from both political parties speak to concerns about the costs of family care: increased public provision of care and education, as well as child and dependent care tax credits. The potentially equalizing effect of such policies deserves serious consideration. In principle, many of the data sources cited above offer the potential to enlarge appreciation of the family in family income.

—Nancy Folbre is the director of the program on gender and care work at the Political Economy Research Center at the University of Massachusetts, Amherst.

Improving the measurement and understanding of economic inequality in the United States

What is “equitable growth” and how do we measure it? The following essay, part of a series, asks economists, other researchers, and practitioners to explore these questions. Equitable growth means an economy that raises living standards for all families. We have seen decades of economic growth in the U.S.—commonly measured by GDP. Yet that success has not meant significant income growth for most American families. Clearly GDP doesn’t provide the full picture. How do we know we’re on the right track? There is little consensus around what specific of indicators are required to quantify whether the economy is growing on behalf of all Americans. Is it a matter of looking at different already existing measures? Should new data using existing concepts of income and well-being be created? Do our concepts of what’s important to measure need updating as well? A better understanding of equitable growth—and how to measure it—can improve our understanding, inform decisions and lead to better outcomes for all.

There has long been interest in extending and improving the National Income and Product Accounts, or NIPA, to turn it into a better indicator of general economic welfare and its progress. The accounts, and the summary Gross Domestic Product number, were not initially intended as an indicator of welfare, but rather as a measure of economic activity—even misdirected activity such as the production of cigarettes. Even on that basis, there is room for improvement: Perhaps the most commonly suggested extension has been the explicit inclusion of environmental degradation and improvement, along with other instances of resource depletion. I would certainly be in favor.

Nevertheless, I want to begin with a retrograde suggestion. Whatever is eventually done with NIPA and GDP, I hope it is done in such a way that it will always be possible easily to extract from the new NIPA most of the components of the old NIPA. (It will not be possible to extend the new NIPA back in time very far because the basic data will never have been collected.) For those of us who want to go beyond measurement to understand macroeconomic behavior and policy, having a fairly consistent quarterly time series going back to 1949 is a wonderful thing. Even with those data, it is a hard problem—without them, it would be hopeless. Another 65 years of compatible data would be more than welcome.

From the very beginning of national accounting, it has been understood that the focus on gross investment and gross product is a standing temptation to error. If GDP increases from one year to the next only because there is a bigger charge for depreciation of fixed capital, it is obvious that nothing has really gotten better. Taking account of depreciation to yield net product—and correspondingly net national income—would provide a better measure of productive economic activity. The prominence given to gross investment and GDP derived from the realization that measures of depreciation taken from business accounts would be not only inaccurate but also biased in odd ways. The practice of depreciation accounting was too badly infected by tax incentives and cosmetic considerations; it was thought better to sidestep the resulting not-even-random errors.

I am told that the situation has not improved, so my second suggestion would be to devote more resources to the improvement of depreciation (and depletion) accounting. If we could move in the future to a focus on net output and net income, NIPA would be a small step closer to providing better elementary building blocks for the measurement of welfare and its changes through time.

These suggestions amount only to shifting or not shifting deck chairs. A useful and substantial extension of the standard statistical picture of the economy would be the regular publication of distributional information. I would want to go well beyond the familiar Gini coefficient, which hides more than it reveals. For starters, I would urge the regular calculation of the distribution of personal income by size, say by income deciles. (The usual quintile distribution is a lot better than nothing but still too rough.) It would be very informative to have such distributions for both market incomes—before taxes and transfers, and after taxes and transfers. It would be especially nice if regular official publications could familiarize the interested public with the Lorenz curve, which is probably the best graphic way of grasping shifts in inequality. The choice between quarterly and annual publication is a trade-off. A year is a long time to wait for news if you care about changes in income inequality, but for an individual or group of individuals, shifts in the interquarterly timing of income may be essentially meaningless. Only experience will clarify the pros and cons.

It would also be useful, in a different way, to have a serious accounting of the assets and liabilities of the public sector at all levels of government. Governments own land, buildings, vehicles, and other equipment. They invest in these objects and undergo depreciation. Even if we do not adequately measure their contribution to output, we should at least take account of their existence. It is a familiar plaint that infrastructure in the United States—bridges, roads, port facilities—is badly decayed and in need of repair and replacement. Regular measurement might lead to more rational decision-making.

There is another, more speculative reason to want better wealth accounting in the public sector. A common cause for alarm these days is the threatened advance of the robots and the possibility that human labor may become all but obsolete. If the threat is real—who knows?—one significant policy response might be the establishment of large sovereign wealth funds that would indirectly own some of those hypothetical robots, and thus provide a source of income to replace the missing wages and salaries. It would then be an advantage to have a tradition of accounting for public-owned wealth and its productivity.

It hardly needs to be added that better and more complete tracking of the distribution of private wealth would also contribute to our understanding of economic welfare. A lot has been accomplished by a group of scholars making use of tax data here and elsewhere. The tax files necessarily miss quite a lot of private wealth, and even apart from that, the development of further sources of information could provide a much-needed check on information and disinformation gleaned from tax returns. Both measurement and understanding would be improved.

Finally, sticking close to familiar economic indicators, I would urge a major effort to collect more longitudinal data, especially on employment status, earnings, and income. Of course, many scholars have used the Panel Survey of Income Dynamics and other surveys for this purpose. I am hoping for a larger, more systematically designed effort aimed specifically at producing the transition frequencies that could serve as the basis for an understanding of the random process that generates lifetime incomes.

(Personal history: When I was writing my Ph.D. thesis in 1949, I came upon transition matrices for covered earnings that the Social Security Administration had compiled for three or four years in the late 1930s. They made the basis for an excellent chapter. Coverage is much broader now, so there’s the possibility for a fresh start with large enough numbers to take account of age and other personal characteristics.)

It is obvious that my wish list has steered away from other vital indicators of social and economic welfare that have often been proposed. I have not mentioned such important issues as health status, access to education and training, exposure to crime, and subjective feelings of security in general. All of these and others are part of a complete picture of average well-being and its distribution in society. I have omitted them not out of abject ignorance or indifference, but out of respect for the principle of comparative advantage.

—Robert Solow is a Nobel Laureate and professor emeritus at the Massachusetts Institute of Technology.

Must- and Should-Reads: July 11, 2017


Interesting Reads:

Fifteen Theses on “The Wealth of Humans” and “After Piketty”

Notes for the July 11, 2017 Research on Tap http://www.bradford-delong.com/2017/06/equitable-growth-research-on-tap-after-piketty-tue-jul-11-2017-at-500-pm.html event:

  • Ryan Avent (2016): The Wealth of Humans: Work, Power, and Status in the Twenty-first Century http://amzn.to/2t9TtWe
  • Heather Boushey, J. Bradford DeLong, and Marshall Steinbaum: After Piketty: The Agenda for Economics and Inequality http://amzn.to/2t9UI7y

Meditations on Ryan Avent:

Ryan Avent: What will happen to ‘The Wealth of Humans’? http://www.aei.org/publication/the-wealth-of-humans-a-qa-with-ryan-avent/: “This really dramatic technological change… the digital revolution… is adding hugely to the amount of effective labor that’s available to firms…. A lot of routine tasks in factories and in offices… [to] be automated…. High-skilled jobs… use these new technologies to do work that used to require a lot more people to do and in the process are displacing workers… enormous, abundant labor…. Employer[s] with… huge reservoir[s] of willing workers at very low wages… say…. “I don’t need to invest in this labor-saving technology…. replace my cashiers with automated checkout… replace the people moving boxes in the warehouse with robots”. And so you get this sort of self-limiting technological change…. The more powerful the digital revolution… the more people… looking for low-wage work… the less of an interest firms have in using machines to replace them…”


  1. For the past thirty and the next thirty years—but probably not more—we are in all likelihood facing the increasing drift toward inequality driven by the rise of the Overclass as identified by Thomas Piketty. As long as the Overclass has enough control over the political system to manipulate it to reap enough rents to peg the rate of return on wealth—not physical capital, wealth—at 5%/year, we will see much if not all of the benefits from economic growth flowing to this Overclass, which will increasingly be an overclass of heirs and heiresses, rather than one that can claim that its wealth is due to some sort of meritocratic chops.

  2. For the past ten years and the next ten years—if not more—our biggest and principal problem has been an economy in secular stagnation afflicted by slack demand, and that in a high -pressure economy like we had under Clinton in the late 1990s or Kennedy-Johnson in the 1960s, most of what we see as our economic problems would not melt completely away but be much reduced. Robots and artificial intelligence were overwhelmingly seen not as problems but as opportunities in the high-pressure economy of the later 1990s.

  3. A generation ago we feared. But then we feared not the robot but the mainframe—and our fears of the mainframe then were like our fears of the robot now, save that while we now fear that robots will leave us with no work to do, we feared then that mainframes would leave us with no meaningful work to do and no work to do save being a mainframe-controlled dumb robot. As the Apple commercial said, we feared that 1984 would be like 1984: https://www.youtube.com/watch?v=2zfqw8nhUwA. Those fears were vastly overblown: we did not become robots subordinated to mainframes; instead, microcomputers and the internet became our personal intelligent tools.

  4. The human brain is a massively parallel supercomputer that fits inside half a shoebox. It draws 50 watts of power. It is an amazing innovation, analysis, assessment and creation machine. 600 million years of proto-mammalian and mammalian evolution coupled with the genetic algorithm means that almost every single human can solve AI problems far beyond our current engineering reach—so much so that much of what our machines find impossible our brains find so trivially easy that we call such capabilities “unskilled”. When combined with our brains, human fingers are amazingly fine manipulation devices. And human back and leg muscles—especially when testosterone soaked—are quite good at moving heavy objects. Thus back in the environment of evolutionary adaptation, we used our brains, our big muscles, and our fingers to lead cognitively interesting—if stressful and short—lives.

  5. Back in the environment of evolutionary adaptation, we used our brains, our big muscles, and our fingers to lead cognitively interesting—if stressful and short—lives. Short: life expectancy at brith of 25 or so. Stressful: watching relatively young people die around you all the time is a significant source of stress. And in order for the average woman to have two children who survive to reproduce, the average woman would have had to have three reach adulthood, about four reach the age of five, about six live births, and about nine pregnancies—that’s the average. Up until 250 years ago, the average woman spent about six years pregnant and eighteen years breastfeeding. Some more. Some less.

  6. History has rolled forward since the hunter-gatherer age. And as history has rolled forward, we have figured out other things to do to add economic and sociological value than using our backs and legs to move things, our fingers to grasp things, and our brains to decide what to hunt and gather. Using backs to move heavy objects and our fingers to perform fine manipulations in cognitively-interesting ways has, relatively, declined.

  7. As our use of our backs and fingers guided by our brains to create value has declined, we have turned to: (1) turning many of us into robots ourselves, performing simple routinized repetitive and vastly boring tasks to fill in the gaps in value chains between the robots that we know how to build; (2) jobs as microcontrollers for domesticated animals and machines—the horse does not know what plowing the furrow is—(3) finding jobs as relatively simple accounting and software bots, keeping track of stuff, what it is useful for, and how its use is to be decided; (4) becoming personal servitors; (5) becoming social engineers—trying to keep all those things and all those people—especially, perhaps, trying to keep those brains soaked in testosterone—somehow working in harmony, somehow pulling together, although admittedly with limited success; and (6) remaining innovators, analyzers, assessors, and creators as well.

  8. Backs started to go out with the domestication of the horse. Fingers began to go out with the invention of the spinning jenny. But humans-as-microcontrollers, humans-as-accounting-‘bots—paper shufflers—and humans-as-the-robots we cannot yet build—took up all the job slack. Every horse needs a microcontroller. And a human brain was the only possible option. Even today, to a large amount every textile machine needs a human watching it at least part of the time. It doesn’t know when it’s gone wrong. It has no clue how to fix itself. It no more understands the idea of “fixing” any more than Alpha-Go understands that it is playing Go, and not just solving a problem of outputting a two-element vector in response to a 19 x 19 matrix of inputs with the additional structure that the output changes the matrix and that the possible matrices have a value-function structure.

  9. Now, however, we can finally peer into a future in which the microcontrollers and the accounting bots are on their way out in a manner analogous to the backs and the fingers. But this is our future. This is not our present. For the past ten years and the next ten years—if not more—our biggest and principal problem has been an economy in secular stagnation afflicted by slack demand, and that in a high -pressure economy like we had under Clinton in the late 1990s or Kennedy-Johnson in the 1960s, most of what we see as our economic problems would not melt completely away but be much reduced.

  10. What do we see when we peer into a future in which the microcontrollers and the accounting bots are on their way out in a manner analogous to the backs and the fingers? Fortunately, one thing this brings with it isthe forthcoming extinction of the the jobs that treat humans as simple robots: simple cogs in the machine that is Henry Ford’s River Rouge assembly line. Many occupations that vastly underutilize the massively parallel supercomputer that fits in half a shoebox are on the way out—and good: for those are not properly “human” jobs at all.

  11. Not yet, but starting soon, and continuing for perhaps the next hundred years, we face the deep problem of the obsolescence of human brains as resources that can be employed—or, rather, underemployed—to create substantial economic value. Over the past six thousand years, ever since the domestication of the horse, we have seen the erosion, at first slowly and in the past two centuries rapidly, of the obsolescence of human muscles as resources that can be employed to create substantial economic value. But we have benefited because human brains underemployed—as microcontrollers for domesticated animals and machines, and as relatively simple accounting and software bots—have nevertheless been of great and increasing value. But now our microcontrollers are better microcontrollers than human brains, and our software accounting ‘bots are becoming better accounting ‘bots than human brains. Not next year, and not next decade, but further out by some unknown time, humans’ jobs will be as: personal servitors, social engineers, and innovators, analyzers, assessors and creators. Here we might well, someday, have a huge problem.

  12. The market economy will amply fund AI research that replaces workers in capital intensive production processes by machines. Such industries have mammoth returns to scale. They thus tend to be characterized by large oligopolies. And so the firm that funds such labor-replacing research will capture with its own scale and in its own value chain a substantial part of the benefits of such R&D. That means that the combination of coming AI with a market economy might well be absolute poison for equity and equitable growth. It will race ahead with shedding workers in capital intensive production processes.

  13. The market economy will not amply fund AI research that assists and amplifies workers in labor intensive production processes. Such tend to be small scale. The inventors and the innovators cannot capture even a small part of the benefit in their own production processes and value chains. And intellectual property is a very weak reed indeed to rely on to fix the problem—in fact, intellectual property is more likely to be the problem than the solution, cf. Nathan Myhrvold, and Intellectual Ventures.

  14. The combination of coming AI with a market economy might well be absolute poison for equity and equitable growth. It will race ahead with shedding workers in capital intensive production processes. There will be—as Laura Tyson and Mike Spence pointed out in their contribution to Heather, Marshall, and my After Piketty book—a synergy between the dangers posed by the Rise of the Robots on the one hand and the inequality generating forces analyzed by Thomas Piketty in his Capital in the Twenty-First Century on the other.

  15. Technological progress could rescue us from Pikettyian dystopia. Robots could be intelligent tools. AI could be gold for equity: amplifying the capabilities of workers in labor intensive production processes would, as John Maynard Keynes once said, bring us vastly closer to economic El Dorado. Recall how a generation ago we feared not the robot but the mainframe—and our fears of the mainframe then were like our fears of the robot now, save that while we now fear that robots will leave us with no work to do, we feared then that mainframes would leave us with no meaningful work to do and no work to do save being a mainframe-controlled dumb robot. As the Apple commercial said, we feared that 1984 would be like 1984. But we are unlikely to see a repeat of the microcomputer revolution. Firms will not invest on a large scale in AI that amplifies the capabilities of labor in labor intensive industries. It will not happen unless some NGO does. How about an engineering school? How about an engineering school at a public university?

JOLTS Day Graphs: May 2017 Report Edition

Every month the U.S. Bureau of Labor Statistics releases data on hiring, firing, and other labor market flows from the Job Openings and Labor Turnover Survey, better known as JOLTS. Today, the BLS released the latest data for May 2017. This report doesn’t get as much attention as the monthly Employment Situation Report, but it contains useful information about the state of the U.S. labor market. Below are a few key graphs using data from the report.

The quits rate went up slightly to 2.2 percent and is still slightly below pre-recession levels. How much more it can increase is a big question for wage growth.

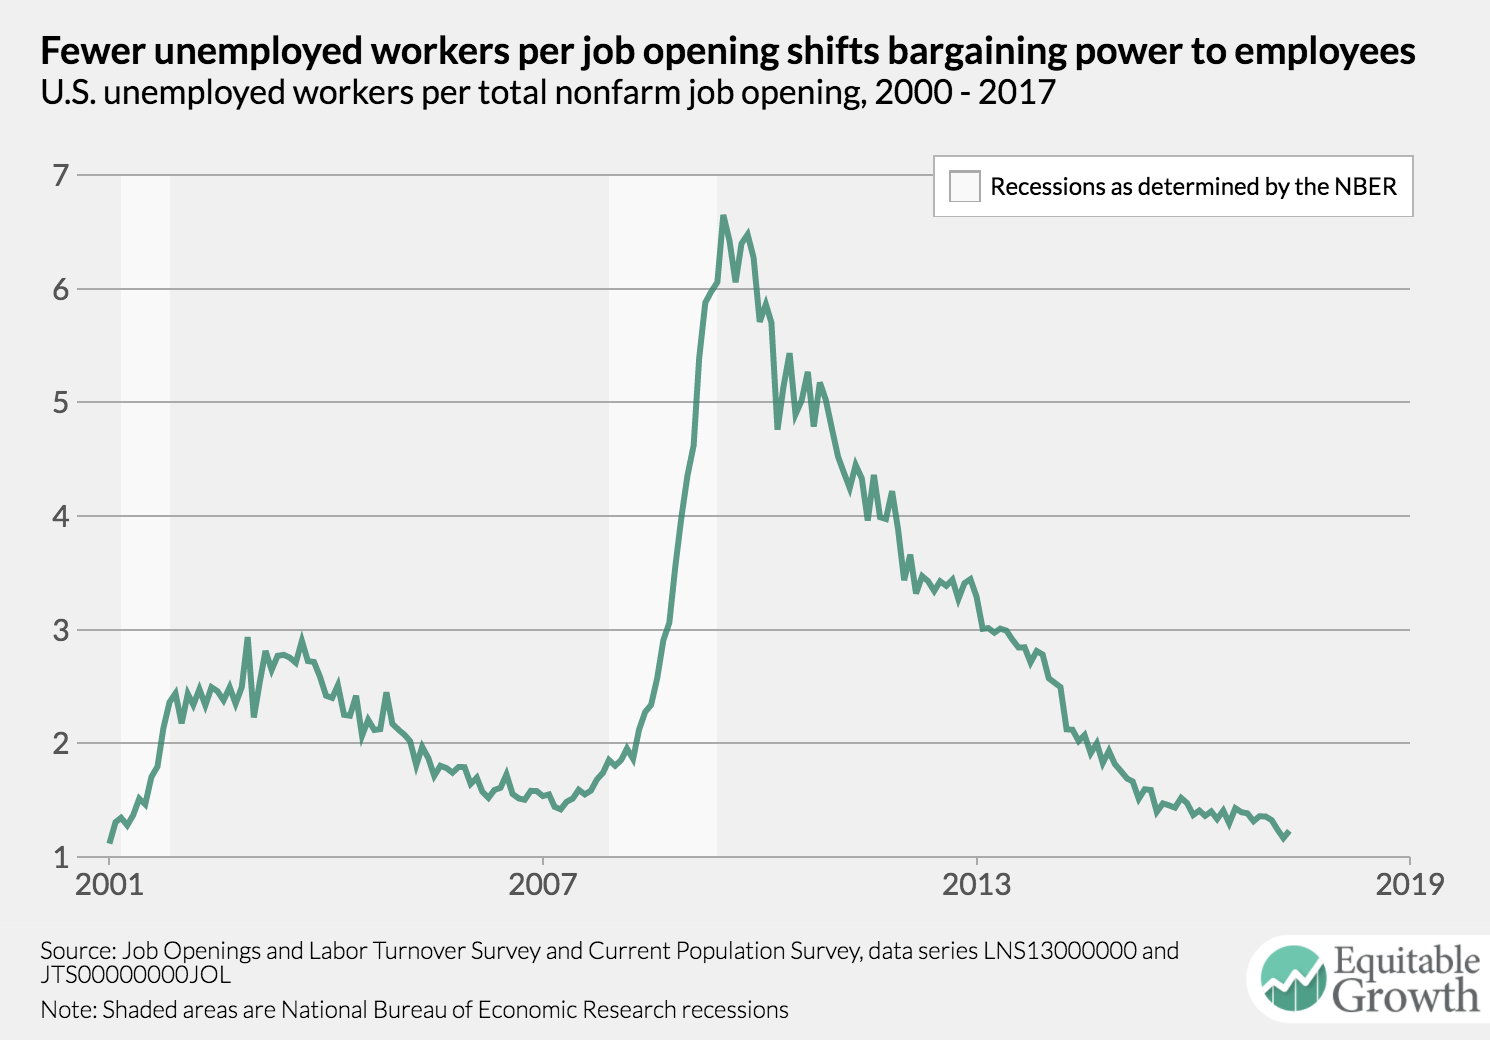
The number of unemployed workers per job opening increased slightly, but is still near historical lows.

The number of hires created from each job opening also jumped up thanks to the decline in the number of job openings. But the overall the trend in the vacancy yield appears to be sideways.

Toward a unified measure of U.S. housing insecurity

Townhouses for sale in Beaverton, Oregon.

The consequences of the Trump administration’s proposed steep cuts to the housing social safety net are serious but unquantifiable. Policymakers should look to the development of the U.S. Household Food Security Survey Module as a roadmap to create a standard instrument to measure housing security.


New Working Paper
Roadmap to a unified measure of housing insecurity


Housing is often used as a barometer of achievement in U.S. society. The type of home we live in and our neighborhoods are signals of pedigree, of where we fall on the socioeconomic ladder. Nevertheless, housing is in fact one of life’s few necessities. Although many of us might take it for granted, we need stable quality housing to be healthy, productive citizens. Housing and neighborhoods influence our emotional and physical well-being, human capital development, and social networks. At its core, housing is a human right.

When we think of those who experience housing insecurity, we often think of the extreme: the homeless. Yet many individuals and families struggle daily to find and maintain affordable, quality housing. These struggles often go unseen until some major event such as the housing market crash a decade ago or last year’s tragic Oakland, California, warehouse fire. The housing market crash, in particular, brought to light that no matter our status in society, we are all susceptible to a housing crisis.

Housing insecurity is often invisible to the public. In fact, we do not really know the true extent to which Americans, or others in the world, suffer from housing problems. Unlike food insecurity, there is no uniform measure for housing insecurity that captures all of housing’s various dimensions. More basic than that, we do not have shared language or a common definition that defines and guides our understanding of what constitutes housing insecurity.

Some housing experts describe housing problems as “housing instability.” Others utilize the chosen term for this article, “housing insecurity.” Still others use “housing insufficiency.” Likewise, housing problems are measured in various ways; some look strictly at housing affordability—spending more than 50 percent of one’s annual income on housing—while others incorporate behavioral aspects of housing insecurity such as multiple moves and overcrowding.

The lack of a unifying term and definition inhibits the mobilization of research, resources, and public policy surrounding this issue. But there is a model that could be used to fix this problem. The food insecurity measure came about after the 1984 President’s Task Force on Food Assistance found that the lack of a credible indicator for hunger inhibited public policy regarding this issue. By October 1990, the National Nutrition Monitoring and Related Research Act passed in the U.S. Senate and U.S. House of Representatives requiring the preparation and implementation of a 10-year plan, which included as a goal to “establish and improve the quality of national nutritional and health status data and related data bases and networks, and stimulate research necessary to develop uniform indicators, standards, methodologies, technologies, and procedures for nutrition monitoring.”

In 1995, the first federal food security instrument was included in the U.S. Census Bureau’s Current Population Survey, and since then, our understanding of food insecurity has grown tremendously. We now know more about food insecurity’s risk factors and whether it is a chronic state or temporary. Food security has become an important indicator for the well-being of households and children, as well as an outcome in the evaluation of food assistance programs. All of this is the result of a transdisciplinary effort that included practitioners, policymakers, and academics committed to developing a validated instrument that could be used to understand, similar to housing, one of society’s most intractable and often hidden problems.

As we enter into a period of increasing wealth inequality, gentrification, and threats to the housing social safety net, it is imperative that policymakers revisit housing insecurity so that they can understand the degree to which individuals and families suffer from the more hidden dimensions of housing insecurity, determine the burden of housing insecurity on society, and devise strategies and solutions to address this problem.

As you may have already surmised, the common term endorsed by my co-authors and me is “housing insecurity.” While this is not the most frequently used term in the literature, we argue that it will provide familiar, accessible language to society given the widespread adoption and success of the concept of food insecurity. We also put forth a definition of housing insecurity based on the 1969 indicators of housing instability described by the U.S. Department of Health and Human Services. Specifically, we define housing insecurity as:

Limited or uncertain availability of stable, safe, adequate, and affordable housing and neighborhoods; limited or uncertain access to stable, safe, adequate, and affordable housing and neighborhoods; or the inability to acquire stable, safe, adequate, and affordable housing and neighborhoods in socially acceptable ways.

We believe our definition is sound. But we also believe it is imperative for all key stakeholders to convene in order to agree upon a common language and definition. Regardless of what these turn out to be, we argue that there are six domains of housing insecurity that should be considered in any measure:

  • Housing stability
  • Housing affordability
  • Housing quality
  • Housing safety
  • Neighborhood safety
  • Neighborhood quality

We also argue that behavioral measures of housing insecurity should be incorporated within the measure, such as choosing to forgo other necessities such as food to pay for rent, and that the instrument used to measure this metric should have the ability to define housing insecurity along a continuum, such that the most housing secure and insecure can be represented within one measure.

On May 23, President Donald Trump released his official budget proposing to reduce spending on means-tested social safety net programs, such as the Supplemental Nutrition Assistance Program and housing vouchers, by $272 billion over the next 10 years. Because there already is a validated food security measure, we can assess how these cuts will affect the food insecurity of American families and respond with key indicators of the damage that these cuts would cause to families and communities nationwide. Because we do not have a common housing insecurity instrument, we cannot confidently predict how the proposed $7.4 billion—15 percent—budget cut to the U.S. Department of Housing and Urban Development for fiscal year 2018 will affect the housing insecurity of U.S. households.

Although it is clear that these cuts to federal housing programs would, if enacted, reduce or eliminate funding to programs such as housing vouchers, Community Development Block Grants, and public housing, we cannot estimate the full extent to which American families will suffer due to increased homelessness and housing hardships. Leaders in Congress should both oppose these ill-intentioned cuts to the housing safety net and understand that any future proposed change to housing security programs needs to be accompanied by clear data that can inform decision-making moving forward. Now is the time to develop a uniform measure of housing insecurity. While this is a tall task, we are confident that it can be done. After all, we do not have to look very far in history to find a blueprint on how we could develop such a national instrument, given the relatively recent creation and implementation of the U.S. Household Food Security Survey Module.

—Robynn Cox is an assistant professor at the University of Southern California’s Suzanne Dworak-Peck School of Social Work and the Leonard D. Schaeffer Center for Health Policy and Economics.

Should-Read: Gillian Tett: Donald Trump’s tariffs would do little for American workers

Should-Read: Gillian Tett: Donald Trump’s tariffs would do little for American workers: “Robots will be the real winners if US president goes ahead with curbs on steel imports… https://www.ft.com/content/cd7df564-5c15-11e7-b553-e2df1b0c3220

…Another week, another wave of sabre-rattling from the Trump administration over trade…. Now the focus is on steel…. Tariffs would hurt American-based companies in direct and indirect ways. The transport equipment sector would suffer most, followed by the leather, petroleum, textiles, machinery and electrical equipment sectors…. If transport companies, such as carmakers, wanted to absorb the cost of these putative tariffs to keep their products competitive, they would have to cut wage costs by 6 per cent; for other industrial groups, a reduction of 2 and 4 per cent is needed. This might imply lower wages. But the more likely response is that companies would just replace workers with more robots…. Laura Tyson calculates… that robots have displaced 400,000 US manufacturing jobs each year in the past couple of decades—which has resulted in the manufacturing workforce falling by a third since 1997, even though output is at record high levels…

Must-Read: Dani Rodrik: Economics of the populist backlash

Must-Read: As I say, repeatedly, calling it “populism” is not a good thing—it does not lead to clear thinking. Hitherto “populism” has meant one to two things:

  • The rather sensible political program of first the American prairie populists of the late nineteenth century and their successors like Huey Long: attack monopolies—railroad monopolies, energy monopolies, streetcar monopolies, and the gold-standard banking monopoly—and share the wealth, and in order to get that done “nail ’em up!!”
  • the less-sensible price-control and macroeconomic expansion programs of left-of-center Latin American governments in the post-WWII era: policies that produced rapid growth and more income inequality in the short run at the price of storing up massive macroeconomic trouble and reducing incentives to invest to boost productivity in the long run.

We have neither here. I think thought is better aided by embracing the historical parallels: call it neo-fascism. And while economic stagnation may have been an element contributing to its rise, economic growth—especially growth that flows to the wrong people, people who are not real Hungarians, real Poles, real Englishmen—is unlikely to tame it. Economic globalization seems to me to be a cause only in the sense of a trigger, a butterfly wing-flap. The real causes lie elsewhere, IMHO at least:

Dani Rodrik: Economics of the populist backlash: The populist backlash to globalisation should not have come as a surprise, in light of economic history and economic theory… http://voxeu.org/article/economics-populist-backlash

…The world’s economic-political order appears to be at an inflection point, with its future direction hanging very much in balance…. The workhorse models with which international economists work tend to have strong redistributive implications… the Stolper-Samuelson theorem…. Economic theory has an additional implication, which is less well recognised. In relative terms, the redistributive effects of liberalisation get larger and tend to swamp the net gains as the trade barriers in question become smaller….

I suggest that these different reactions are related to the forms in which globalisation shocks make themselves felt…. It is easier for populist politicians to mobilise along ethno-national/cultural cleavages when the globalisation shock becomes salient in the form of immigration and refugees…. The relative salience of available cleavages and the narratives provided by populist leaders are what provides direction and content to the grievances. Overlooking this distinction can obscure the respective roles of economic and cultural factors in driving populist politics…

Must-Read: Matthew Yglesias: On Twitter: “Nostalgia-drenched anti-intellectual populism

Must-Read: “We don’t need no education…. We don’t need no thought control…. All in all we’re just another brick in the wall…”:

Matthew Yglesias: On Twitter: “Nostalgia-drenched anti-intellectual populism can be a cause rather than a consequence of community economic decline” https://twitter.com/mattyglesias/status/884438584467521537:

Pew Research Center: Sharp Partisan Divisions in Views of National Institutions: “While a majority of the public (55%) continues to say that colleges and universities have a positive effect on the way things are going in the country these days… http://www.people-press.org/2017/07/10/sharp-partisan-divisions-in-views-of-national-institutions/

…Republicans express increasingly negative views. A majority of Republicans and Republican-leaning independents (58%) now say that colleges and universities have a negative effect on the country, up from 45% last year. By contrast, most Democrats and Democratic leaners (72%) say colleges and universities have a positive effect, which is little changed from recent years….”

Sharp Partisan Divisions in Views of National Institutions Pew Research Center

Should-Read: Nouriel Roubini: The New Abnormal in Monetary Policy

Should-Read: Explain to me, please? What is a BIS that thinks the inflation target should be zero thinking? What are central banks that are not desperately striving to gain more sea room right now thinking?

Nouriel Roubini: The New Abnormal in Monetary Policy: “Financial markets are starting to get rattled by the winding down of unconventional monetary policies in many advanced economies… <https://www.project-syndicate.org/commentary/unconventional-monetary-policy-new-normal-by-nouriel-roubini-2017-07>

All of these central banks will have to reintroduce unconventional monetary policies if another recession or financial crisis occurs…. Even if the Fed can get the equilibrium rate back to 3% before the next recession hits, it still will not have enough room to maneuver effectively. Interest-rate cuts will run into the zero lower bound before they can have a meaningful impact on the economy. And when that happens, the Fed and other major central banks… first could restore quantitative- or credit-easing policies… second… could return to negative policy rates… third… could change their target rate of inflation from 2% to, say, 4%….

The last option for central banks is to lower the inflation target from 2% to, say, 0%, as the Bank for International Settlements has advised. A lower inflation target would alleviate the need for unconventional policies when rates are close to 0% and inflation is still below 2%. But… zero inflation and persistent periods of deflation–when the target is 0% and inflation is below target–may lead to debt deflation… debtors could fall into bankruptcy…