More accurately measuring economic sentiment will help build a U.S. economy—and democracy—that works for all

Overview
When politicians and members of the media discuss the state of “the economy” in the United States, they often use a small handful of data points. Of all the indicators of economic performance, just four are relied on as the primary gauges of the U.S. fiscal direction: Gross Domestic Product, the Dow Jones Industrial Average index, the inflation rate, and the unemployment rate.
Economic measures such as these are seen as objective in their ability to capture how the U.S. economy is doing. These data are certainly prepared dispassionately, according to predefined formulas. But the choice of which metrics to use is highly subjective—and highly revealing of what a society values. As the old saying goes, “What gets measured, gets managed.”
Traditional metrics seek to offer a portrait of how an economy is doing. But the U.S. political and economic system should focus less on how the U.S. economy is doing and more on how Americans are doing. By adopting indicators that are more closely attuned to Americans’ economic and political lives—and by listening to the hopes, dreams, and concerns of those Americans—policymakers can steer toward an economy focused on the well-being of the greatest number of people.
This essay begins with a look at current indicators and their shortcomings in reflecting economic sentiment among the U.S. population. We then discuss how these shortcomings impact U.S. political institutions and civic life. Next, we offer a new method of measurement—what we call the CORE Score—and preview how transitioning to people-focused indicators could yield economic discourse that more accurately reflects how the economy is in fact performing for the majority of Americans.
Current economic indicators do not reflect popular sentiment
The need to reimagine U.S. economic measurements is readily apparent in the aftermath of the 2024 presidential election. For months leading up to Election Day, op-ed pages were roiled in debates (to which we contributed1) over the disconnect between traditional economic indicators, which looked positive, and responses to polls and surveys asking for people’s views on the economy, which were decidedly less positive. Democrats were understandably perplexed by the outcome of the election: By traditional measures, the Biden administration had shepherded the nation through the economic morass of the COVID-19 pandemic, especially in comparison to peer nations.2 Why didn’t voters reward them for this stewardship at the ballot box?
We can hardly claim to have the answer, but our past work provides some clarity. In 2022, as part of the Commission on Reimagining Our Economy at the American Academy of Arts and Sciences,3 we organized small-group conversations across the country, including with service, care, and airport workers, tribal leaders, teachers, small-business owners, and community college students, among others.
What we heard in these listening sessions reflected the consumer sentiment being captured in polling. Inflation was on people’s minds, and many participants expressed that they were living on a financial knife-edge.
But the people we talked to were not only upset because of short-term economic circumstances. They also felt the U.S. economy as a whole was not designed for them. “We really live in a world of abundance,” a woman in Chicago told us, “but the abundance is misdistributed.” Other people in other places were doing better and better, while their economic situation stayed the same or got worse. “Twenty years ago, you didn’t have to work two jobs to get by because we still had [factory jobs]. There’s no factories or anything around here [anymore],” one Morehead, Kentucky, resident explained. Many, including a tribal leader in Arizona, felt that ours is a “greed-based economic system.” And while services were available to help people through adversity, participants talked about the difficulty learning about or accessing these services.
The sentiments that we heard in our listening sessions were actually evident in nontraditional economic indicators—most of which were overlooked in the pre-election discourse about the supposedly robust economy. For example, in 8 of the 10 quarters since the start of 2022, total credit card debt increased, and the percentage of balances delinquent for more than 90 days climbed steadily since the middle of 2023.4 The percentage of auto loans that fell into delinquency by the end of 2023 was at its highest point since the Great Recession of 2007–2009, and rates of food insecurity have been increasing.5
Voters and lawmakers can be forgiven for not providing equal attention to these nontraditional economic proxies. Part of the problem stems from how the media covers the economy. Indeed, a 2021 study finds that, because of the news media’s focus on economic aggregates, “the tone of the economic news strongly and disproportionately tracks the fortunes of the richest households.”6
Additionally, GDP and the Dow Jones are reflective of well-being—but the well-being of those who are already rich, not of all participants in the U.S. economy. After all, about 40 percent of U.S. households do not own stock, including through retirement accounts.7 Yet fluctuations of the Dow frequently make front-page headlines. Of course, changes in the stock market affect the entire economy, even those not directly invested in it. But the reduction of the state of economy to the state of one stock market index obscures as much as it reveals.
Impacts on U.S. democracy and political institutions
Our push for a broader array of economic metrics is born not only of concern for Americans’ material well-being but also the well-being of U.S. democracy. Economic security and opportunity play an outsized role in shaping social trust. Studies show that when people feel economically unstable, are insecure in their jobs, or feel they are not getting what they deserve at work, they are less likely to place their trust in political institutions.8
People’s worries about their financial well-being generally foster support for government intervention to bolster their security, but a perception of government inaction might feed a sense that the system in place is not designed for them.9 Why should someone have faith in the economy if the economy is not working for them?
Such distrust is not confined to the economy but rather extends to a broad array of institutions, both private and public, that, to some, seem to conspire to damage their lives and communities. Take, for instance, the research that University of Wisconsin–Madison’s Katherine Cramer (one of the authors of this essay) did in Wisconsin from 2007 to 2012.10 She invited herself into small groups in dozens of communities across the state, particularly in rural areas, where residents often claimed they were not getting their fair share of resources, attention, and respect in comparison to those who lived in urban areas. In fact, an analysis of tax collections and per capita expenditures at the time showed that, if anything, people in rural counties were getting more than their fair share.11
Yet the cycle of trust in these communities had broken down. People generally tend to make assessments about whether the status quo is working based on both their absolute and relative well-being—in other words, both how their community and their racial/ethnic group is doing, and how they compare to other communities and to other groups.12 Levels of poverty and unemployment were higher in rural places, and household income was lower than in more urban counties.
These comparative disparities registered with many rural residents and fed resentment against urbanites and government actors. And the perception that the government was not working for rural people or rural communities turned out to be fertile ground for Republicans.
The so-called politics of resentment—these sentiments and the political use of them—is hardly confined to Wisconsin. It has taken over much of the national Republican Party and, through it, the White House and the U.S. Congress. In recent U.S. elections, people who perceive that their social group has declined from high to low status appear to be more willing to support candidates who pledge to restore old status hierarchies.13
In fact, the greatest supporters of resentment politics are not necessarily those who actually are experiencing the lowest levels of economic well-being but rather those who perceive that the place where they live is disadvantaged.14
Such a phenomenon is likewise hardly confined to the United States. One study from Europe finds that in EU member states, declining manufacturing and lower per-capita GDP bears a strong association with voting share for right-wing populist parties.15 As seen in Wisconsin during the Obama administration, the breakdown of the economic system fosters support for leaders willing to tear much of that system down.
Many of the uneven shifts in economic well-being that set the stage for the politics of resentment in the United States are not reflected in traditional measures of the U.S. economy. Before 2020, GDP and the Dow Jones had generally shown a steady recovery since the Great Recession. Someone following the economy just through the headlines of a national newspaper will be forgiven if they missed that the recovery in Washington, DC, did not quite reach Washington County, Pennsylvania.
The United States has always had rich and poor places. But while scholars have found a convergence in the fortunes of these places for much of the mid-20th century, this convergence decreased or disappeared entirely between 1980 and 2010.16 The result? Parts of the country are not progressing together—and are even moving in different directions.
Measuring what matters: Changing how we capture economic performance
Even some economic metrics themselves do not necessarily reflect what they purport to measure. Indicators such as the unemployment rate appear straightforward: They measure the percentage of the adult population that is unemployed, right? Not exactly.
As the former Comptroller of the U.S. Currency Eugene Ludwig argues, the traditional headline unemployment rate does not account for those who are without work and no longer actively looking for employment, counts underemployed people who are looking for more work as fully employed, and does not account for how well someone’s job pays.17 Similar issues plague other headline indicators—most obviously inflation, GDP, and the Dow Jones.
Between the problems underlying these metrics and the importance of observing geographic economic trends, policymakers and the media should shift their focus away from aggregate, national measures of economic performance toward more localized, people-centric indicators. We have just such a measure for them to consider.
The CORE Score
Because it became clear to us that traditional metrics do not reflect the well-being of many of the Americans with whom we spoke, we and our colleagues on the Commission on Reimagining our Economy created the a county-level economic index called the CORE Score.18 Crucially, this score’s north star is well-being: It traces not how well-off communities are but how well they are doing, as measured through an annual score. Since even county-level measurements can disguise disparities, the CORE Score provides visibility into disparities within counties along lines of race/ethnicity, age, sex, income, and education level.
This score takes into account indicators from four categories: economic security, economic opportunity, health, and political voice. (See sidebar below.) Many other factors determine well-being, of course—for example, the degree to which someone is free to spend their time how they wish. But many such measures are only available at the national level, without sufficient sample size for geographic disparities, particularly at the county level. For the Score, each U.S. county is scored along each category, with the average producing its CORE Score, and each category score is constructed using a scaled average of the metrics within each category.
We picked these categories because of how well they can capture elements of well-being. A community lacking security, for example, or the chance to pursue or achieve a better life, cannot be a thriving community. Neither can one where people have short lifespans or are unable to receive medical coverage. Measures along these categories are somewhat standard for alternative economic indices such as ours.
Our use of a measure of political voice is less common. We include it because we believe that in a democratic society, the civic health of a community contributes to and reflects its overall well-being. When people engage in activities with one another and when they voice their concerns to their government, they are toning muscles that can help them address community problems and redirect government toward the challenges they find most pressing.
To that end, the CORE Score includes data on voter turnout and civic participation, as well as a new measure of the quality of political representation developed by Commission member and Yale University political scientist Jacob Hacker. This latter data point captures political congruence, or the degree to which members of Congress vote in line with the preferences of their constituents, as expressed by those constituents in public opinion surveys. Being well-represented is hardly a predictor of economic well-being, but identifying who is getting what they want from the political system is important when comparing the well-being of different parts of the country.
Using population-weighted county Scores, we generate state-level CORE Scores. We find, for example, that between 2013 and 2023, the states with the highest average CORE Scores were Minnesota, North Dakota, Iowa, and Wisconsin. In fact, we find that the upper Midwest generally boasts strong results across a variety of measures, particularly economic security. These are many of the same states that, according to a widespread political narrative, turned to populism and President Donald Trump because of economic anxiety.
Yet we find that many of these places are thriving relative to the coastal elites of whom they seem so resentful. Well-being is rooted in perception as much as in reality. So, even if these places—at least at the state level—seem to offer some of the highest levels of well-being in the country, the perception that other places are doing even better, or are receiving unfair levels of help from the government, can breed distrust.
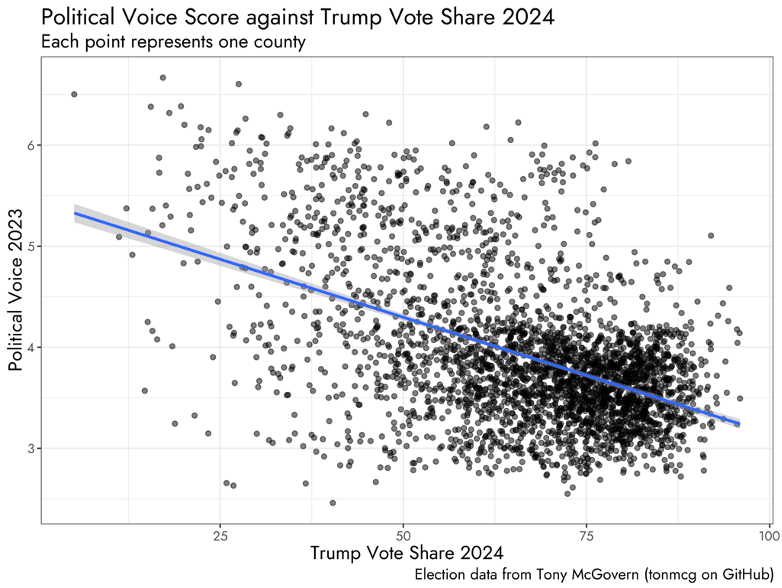
We hardly claim that the CORE Score can singularly explain the emergence of the politics of resentment. Still, this score tells stories that can help explain dissatisfaction with the current state of the U.S. political system. For instance, we see a modest negative correlation (-0.49) between a county’s political voice—the average of its voter turnout, civic participation, and political congruence score, scaled from 1 to 10—and vote share for Donald Trump in the 2024 presidential election.
In general, people living in counties with worse political voice, defined as lower turnout, worse rates of community political involvement, and worse quality of representation, were more likely to support the candidate who has long promised to disrupt the political system. (See Figure 1.)
Figure 1
People in counties with worse political voice tended to vote for President Donald Trump in 2024
Average voter turnout, civic participation, and political congruence scores in U.S. counties, 2023, and the share of each county’s vote that went to Donald Trump in 2024
Some of the stories that emerge from the CORE Score contrast sharply with the dominant economic narratives of the past few years. Gross Domestic Product and the Dow Jones, for example, plummeted in early 2020 amid the onset of the COVID-19 pandemic, but both measures had recovered almost fully by the end of that year.19 In contrast, in 2023, the nation’s CORE Score (5.60) still had not recovered to its 2019 level of 5.87, the highest since 2011. (See Figure 2.)
Figure 2
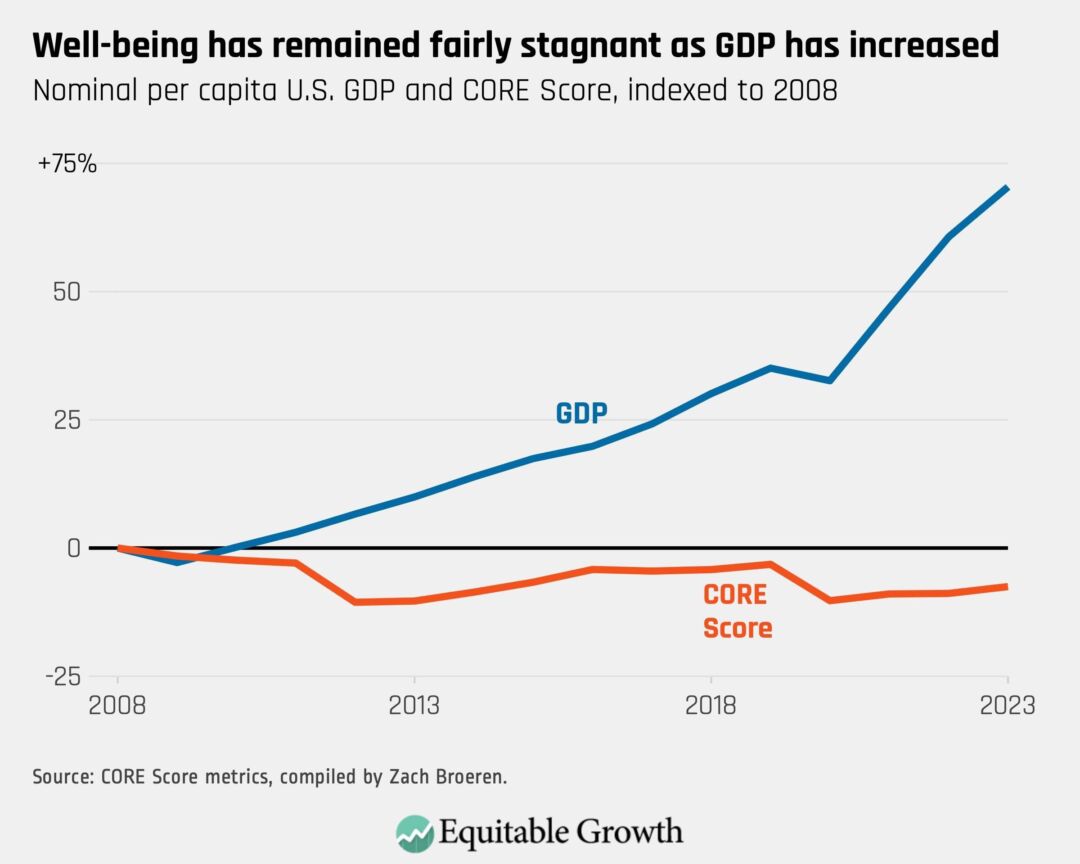
Such a change may appear marginal, but that is part of the problem: The Score shows a modest (7 percent) decline to national well-being since the start of our data in 2008. Between 2008 and 2023, Virginia and the District of Columbia were the only states (or state equivalents, in the case of Washington, DC) whose Score improved, while just 158 out of 3,143 total U.S. counties20 saw improvement.
 post
post
 report
Disaggregating growth
March 28, 2018

Conclusion
Further research using data from the CORE Score and other nontraditional indicators is needed to explain geographic disparities and associated changes in U.S. politics. But the case for these metrics is clear: The fixation on aggregate economic measures has papered over the fact that the economy is made up of people, and that the U.S. economy should serve people, not the other way around.
Using geographically attenuated indicators more closely tied to people’s well-being would allow policymakers and economic storytellers alike to offer a more accurate picture of how the United States is doing. Properly capturing the true extent of economic insecurity represents a crucial step in reshaping public discourse—and, ultimately, public policy—in favor of economic policies that would address the needs of the Americans with whom we spoke. Doing so would also help identify places where normal politics are breaking down and where the politics of resentment may be emerging.
Adopting measures such as these can be as simple as including them in briefing materials for lawmakers or in standard-fare news coverage of the U.S. economy. After all, why shouldn’t the release of data on credit card delinquencies receive the same headline treatment as the latest unemployment figures?
Policymakers could also support the production of additional measures by providing greater support—financial, administrative, or both—to the nation’s statistical agencies. Doing so would help facilitate the timelier release of certain data points, which would allow measures with inherent lags—such as health data, which can take months or years to compile—to compete with the quarterly releases of inflation, GDP, or unemployment data or even the daily vicissitudes of the Dow Jones.
A continued focus on top line measures cultivates misperceptions of widespread economic growth, which abet ongoing anger toward a system that seems to not be working for those who could use its help. Such a trend helps explain why some of the places in the country that have the highest average levels of well-being according to the CORE Score are also some of the places where the politics of resentment has found its greatest purchase.
By listening to Americans, and by measuring what truly matters, the nation’s leaders can forge a path to rebuilding trust and building an economy that works for the people who make it work.
About the authors
Katherine J. Cramer is a political science professor at the University of Wisconsin–Madison. Jonathan D. Cohen is a senior program officer at the American Academy of Arts and Sciences.
Did you find this content informative and engaging?
Get updates and stay in tune with U.S. economic inequality and growth!
End Notes
1. Katherine J. Cramer and Jonathan D. Cohen, “Many Americans Believe the Economy Is Rigged,” The New York Times, February 21, 2024, available at https://www.nytimes.com/2024/02/21/opinion/economy-research-greed-profit.html.
2. Robin Brooks and Ben Harris, “The US Recovery from COVID-19 in International Comparison” (Washington: The Brookings Institution, 2024), available at https://www.brookings.edu/articles/the-us-recovery-from-covid-19-in-international-comparison/.
3. Katherine served as a co-chair of the Commission and Jonathan as its lead staffer. The views expressed in this essay reflect solely the opinions of the authors, not the Commission as a whole.
4. Federal Reserve Bank of New York, Center for Microeconomic Data, “Household Debt and Credit Report” (2024), available at https://www.newyorkfed.org/microeconomics/hhdc.
5. Federal Reserve Board, “Rising Auto Loan Delinquencies and High Monthly Payments,” FEDS Notes, September 26, 2024, available at https://www.federalreserve.gov/econres/notes/feds-notes/rising-auto-loan-delinquencies-and-high-monthly-payments-20240926.html; U.S. Department of Commerce, Economic Research Service, “Food Security in the U.S. – Key Statistics and Graphics,” last updated January 8, 2025, available at https://www.ers.usda.gov/topics/food-nutrition-assistance/food-security-in-the-us/key-statistics-graphics (last accessed March 2025).
6. Alan M. Jacobs and others, “Whose News? Class-Biased Economic reporting in the United States” American Political Science Review 115 (3) (2021): 1016–1033, available at https://www.cambridge.org/core/journals/american-political-science-review/article/whose-news-classbiased-economic-reporting-in-the-united-states/1D4BE72D76707973491EB36C36FE9D0B.
7. Jeffrey M. Jones, “What Percentage of Americans Owns Stock?” Gallup, May 24, 2023, available at https://news.gallup.com/poll/266807/percentage-americans-owns-stock.aspx.
8. Andrew Wroe, “Economic Insecurity and Political Trust in the United States,” American Politics Research 44 (1) (2015): 131–163, available at https://journals.sagepub.com/doi/abs/10.1177/1532673X15597745?journalCode=aprb; Andrew Wroe, “Political trust and job insecurity in 18 European polities,” Journal of Trust Research 4 (2) (2014): 90–112, available at https://www.tandfonline.com/doi/abs/10.1080/21515581.2014.957291; Anahí Van Hootegem and others, “Work Is Political: Distributive Injustice as a Mediating Mechanism in the Relationship Between Job Insecurity and Political Cynicism,” Political Psychology 43 (2) (2022): 375–396, available at https://onlinelibrary.wiley.com/doi/10.1111/pops.12766.
9. Jacob S. Hacker, Philipp Rehm, and Mark Schlesinger, “The Insecure American: Economic Experiences, Financial Worries, and Policy Attitudes, Perspectives on Politics 11 (2013): 23–49, available at https://isps.yale.edu/research/publications/isps13-007.
10. Katherine J. Cramer, The Politics of Resentment (Chicago: University of Chicago Press, 2016), available at https://press.uchicago.edu/ucp/books/book/chicago/P/bo22879533.html.
11. Ibid, Chapter 4.
12. Cameron Ballard-Rosa, Amalie Jensen, and Kenneth Scheve, “Economic Decline, Social Identity, and Authoritarian Values in the United States,” International Studies Quarterly 66 (1) (2022), available at https://doi.org/10.1093/isq/sqab027; Andrés Rodríguez-Pose, Javier Terrero-Dávila, and Neil Lee, “Left-behind versus unequal places: interpersonal inequality, economic decline and the rise of populism in the USA and Europe,” Journal of Economic Geography 23 (5) (2023) 951–977, available at https://doi.org/10.1093/jeg/lbad005.
13. Diana Mutz, “Status threat, not economic hardship, explains the 2016 presidential vote,” PNAS 115 (19) (2018): 4330–4339, available at www.pnas.org/cgi/doi/10.1073/pnas.1718155115; John Sides, Michael Tesler, and Lynn Vavreck, Identity Crisis (Princeton: Princeton University Press, 2019), available at https://press.princeton.edu/books/paperback/9780691196435/identity-crisis?srsltid=AfmBOorOxxqtbJ3O-M2AHFfT4m-f_eu7LSI1iK3jPjzG_N-FBEoqlIgd.
14. Thomas Ogorzalek, Spencer Piston, and Luisa Godinez Puig, “Nationally poor, locally rich: Income and local context in the 2016 presidential election,” Electoral Studies 67 (2020), available at https://thenewpress.com/books/stolen-pride; https://doi.org/10.1016/j.electstud.2019.102068.
15. Dominik Schraff and Jonas Pontusson, “Falling behind whom? Economic geographies of right-wing populism in Europe,” Journal of European Public Policy 31 (6) (2023): 591–1619, available at https://pmc.ncbi.nlm.nih.gov/articles/PMC11104744/.
16. Peter Ganong and Daniel Shoag, “Why has regional income convergence in the U.S. declined?”Journal of Urban Economics 102 (2017): 76–90, available at https://www.sciencedirect.com/science/article/abs/pii/S0094119017300591.
17. Eugene Ludwig, “Voters Were Right About the Economy. The Data Was Wrong,” Politico, February 11, 2025, available at https://www.politico.com/news/magazine/2025/02/11/democrats-tricked-strong-economy-00203464.
18. “CORE Score, Measuring Wellbeing,” available at https://corescore.us/wellbeing-2021-usa/core_score/2021/00?demographic=geography-overall (last accessed March 2025).
19. Federal Reserve Bank of St. Louis, “FRED Economic Data, Gross Domestic Product,” last updated February 27, 2925, available at https://fred.stlouisfed.org/series/GDP (last accessed March 2025); “Marketwatch, Dow Jones Industrial Average,” last updated March 13, 2025, available at https://www.marketwatch.com/investing/index/djia/charts?mod=mw_quote_advanced (last accessed March 2025).
20. This is the total number of U.S. counties, some of which are too sparsely populated to receive a CORE Score.